Commentary:
The casinos are starting to get interesting again as their
recent
consolidation appears to be drawing to a close. The casinos as a whole
have been good performers for the latter half of this year, but had
been experiencing some profit-taking over the past several weeks.
As recently as a week ago, some casino stocks appeared to be in
danger of entering a deeper correction.
Las Vegas Sands (NYSE:
LVS), for instance, fell below the $44 level
briefly last week as it broke below its 50-day moving average. LVS
found buyers in this area and only partially closed a gap formed in
late October. LVS was able to climb back into its base and is
currently testing its 20-day moving average. If it can stabilize in
this area it could set the stage for an attempted
breakout. Traders should watch the recent low; a move below this level
could force recent dip buyers to exit.
Wynn Resorts (Nasdaq:
WYNN) is another stock that appeared to be in
trouble recently. WYNN fell beneath its 50-day moving average in
early December and fell under $100 per share. However, WYNN held
above its prior base and buyers stepped in to propel the stock back
over the $100 level, and its 20- and 50-day
moving averages. While WYNN may not be ready for a
true breakout yet, it did confirm this level as support, and
traders should continue to watch it. (For more, see
The Anatomy Of Trading Breakouts.)
Source: StockCharts.com
Melco Crown Entertainment (Nasdaq:
MPEL ) has been following a similar
pattern in that it began to fall under
support earlier this month, but quickly recovered as buyers
stepped in. MPEL fell under its 50-day moving average and under
lateral support near $5.90 as it corrected its prior run. It surged
after the initial breakdown and also cleared the
channel it was following in the correction. Much like WYNN, MPEL
will likely need more time to consolidate before a true breakout
attempt, but the recent price action was positive in that it
confirmed a key support level. Traders should monitor the recent
low moving forward.
Source: StockCharts.com
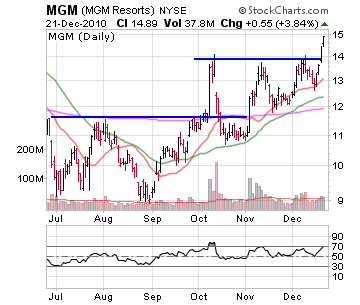
MGM Resorts International
(NYSE:
MGM ) is one casino that has been showing
few signs of weakness. It has been steadily setting higher lows the
past few months while stalling out near $14. It was able to clear
$14 a few sessions ago and is clearly leading in this sector.
Traders should focus on the $14 level moving forward as a
pullback into this level should find buyers.
Source: StockCharts.com
The Bottom Line
While many of the casino stocks remain in a vulnerable position,
the strength in MGM and the recent buying near support on the
others is revealing institutional support for the group. The group
as a whole has been consolidating for several weeks and often a
false breakdown marks the end of a consolidation as the last of the
sellers are flushed out. While it is not a certainty that this
group is ready to move higher, there are enough clues to
suggest that their existing consolidation may be drawing to a
close.
The Blackstone Group (BX), after a big price-volume surge in
September and October, has consolidated in the last two months in
the 13-14 trading range, which looks like it's ready to be broken.
The stock jumped 52 cents today, or 3.83%, on heavy volume, closing
near a multi-month high - at a key resistance level - which is
another indication we could see further advance in this stock. If a
breakout occurs I expect to see BX in the 14.70-15.10 range
short-term. Preferred entry (buy stop) price is 14.25, with a stop
at 13.75.
Tue December 21st 2010
BAC Hurdles Key Resistance
by Mike Paulenoff
Bank of America (BAC) has emerged to the upside from its
one-week coil pattern, hurdling key near-term resistance at
12.75/76, and should thrust directly towards a test of the December
high at 12.93 on the way to 13.25/50 thereafter.
Given the very positive technical set-up, BAC should not weaken
and sustain below near-term support at 12.60/50 prior to
accelerating to the upside.
after falling more than expected down to the 16.60s and filling
the gap from last Fri., has seemed to broken above bear
flag/channel on 5 min. charts, looking for more vol. to come
in.
Watching Ford....looks like it's in a bear wedge or bearish
flag, now has filled the gap from last Friday down to the 16.70s
and seeming to find support. Now we'll see if it was a
falliing wedge or just falling.
MGM Resorts International (MGM) has been trying to break out above
a key resistance level at 13.80 a couple of times since October,
but each attempt has been unsuccessful, with the stock each time
retracing to a new higher low. This has created an ascending
triangle pattern whose upper horizontal trend line -- a key
resistance level -- is finally ready to be broken.
If a breakout occurs we could see momentum that could move the
stock to around the 14.50-14.80 area. Preferred entry (buy stop)
price is 13.85, with a stop loss at 13.30.
The Weekly Report For December 20th - December 24th, 2010
Commentary: The markets
consolidated in an orderly fashion this week after an impressive
two-week run. While some traders may fear an end to the recent
rally, this week’s price action was actually quite constructive.
The markets were able to digest some of their recent gains and gave
back very little ground overall. All of the indexes remain above
their October/November pivot highs and well above their prior
breakout points. With volume likely to dwindle the next two weeks,
traders may experience a few more days of dull price action.
The
S&P 500, as represented by the
S&P 500
SPDRS (NYSE:
SPY) ETF, has managed to remain above its November high, and
finally had some help from the lagging financial sector. With the
financials pitching in, SPY is now trading at new recovery highs
and is approaching the area where the markets dove off
a cliff back in 2008. This could be a significant area of
resistance, so traders will need to be on guard as we approach the
New Year. (For more, see
Technical Analysis: Introduction.)
The
Powershares QQQ ETF (Nasdaq:
QQQQ) remains in a position of strength and finished the week
nearly unchanged. The strength in its leaders like
Amazon.com(Nasdaq:
AMZN) and
Apple(Nasdaq:
AAPL) has kept the pullbacks in QQQQ very
shallow. QQQQ remains above a support level near $54, which
coincides with its November high. Traders should look for buyers in
this area on any weakness. If QQQQ loses this level, then $52 will
be the next level to watch.
Source: StockCharts.com
The
Diamonds Trust, Series 1 (NYSE:
DIA) ETF actually managed to close positive for the week and is
also close to testing a key high from 2008. The benefit of the
doubt has to sit with the bulls at this point, as the markets
continue to push higher. However, the next few weeks could see the
markets pushing to the levels that preceded one of the worst market
crashes in history. For DIA, the $118.73 level was an
important high, and the whole $118 range should have traders on
guard for the chance that DIA will trade there soon. If
DIA can eventually clear this level it could bring more investors
back from the sidelines.
Source: StockCharts.com
One positive for the markets that is showing an underlying strength
is the recent price action in the
iShares Russell 2000 Index (NYSE:
IWM) ETF. IWM also closed the week higher and is now above the
same important resistance levels SPY and DIA are facing. IWM
reversed from the $76 mark a couple of times in 2008 before
crashing along with the markets. These highs in the markets are
important from a psychological perspective as many investors and
traders finally have their
401(k) and retirement accounts back at pre-crash
levels. Because it’s human nature to want to get out at breakeven,
traders should realize the importance of these levels. The fact
that IWM is above this level is a positive and shows that
market participants are being more aggressive.
Source: StockCharts.com
The Bottom Line
The past three weeks have now seen a surge in the markets followed
by a quiet consolidation. Historically, the end of the year has
been positive for the markets and the typical year-end rally has
even coined the term
Santa Claus rally. The markets continue to show underlying strength and many
individual stocks remain in a strong position. While the near-term
picture still looks very strong, traders should be cognizant of the
significant resistance levels that SPY and DIA have yet to face. If
there was a single level that would bring in sellers, it would be
where SPY failed in 2008 near $143.55. Traders should watch this
key area as we head into the next year. (For related reading,
see
Santa Claus Endorsement Deals.)
Thanks for your great charts, marketguy, always enjoy seeing
them and this one really points out how a pullback should be soon,
maybe not tomorrow, but it's coming in the next week or 2, going by
this chart.
Had huge volume on the down day today, and has formed neg. div
on RSI, and trying to on MACD - it needs to cross down, and 14 slo
sto has just crossed below 80. Still would like to see it get
below the 8 EMA, which it's been above since mid-November - to
consider taking a short, but definitely one to watch with the large
neg. volume spike today and neg. divergences.
Fri
December 17th 2010
Upgrade Adds to Powerful Chart Picture for AMAT by Mike Paulenoff
Applied Materials (AMAT) was the beneficiary of a Barclay's
upgrade this morning and an upwardly revised target price to 17
from 12, which is having a positive impact on the stock price.
An upgrade to an already powerful chart picture and technical
set-up aligns the fundamentals and the technicals, in this case
both bullish.
AMAT is heading next for a confrontation with its 2010
resistance line, now at 13.78, which if hurdled should trigger
upside continuation to test 14.00/10.
WNR has continued to be a good short all week, ever since it
crossed below the bearish rising wedge it had been in for over a
month on Monday. It closed in the 10.60s last Friday, and got
down to the 8.70s today, still may be more room on the downside,
but the major move of 15%+ has been put in over the last few days.
And not only could have bought the Dec. 10 puts on Mon. AM at
10 cents, went to 65 later that day and 85 cents yesterday, but
also bought the Dec. 9 puts today and they went from 5 cents early
this AM to 25 cents this afternoon.
Thu December 16th 2010
Squandered Opportunity by Bears
by Mike Paulenoff
As we entered the noon hour,
the S&P 500 saw yet another squandered opportunity by the bears
to inflict some meaningful damage to the powerful upmove off of the
late-Nov lows. Instead, the index, analyzed through its
round-the-clock emini contract, pierced yesterday's low at 1228.75
by 1.25 points, but failed to follow through on the downside, and
then pivoted to the upside with power.
This tells us that on every dip it seems that a "healthy short
position" develops, but is quickly covered upon the slightest "lack
of downside progress." And so we see that the e-SPH pivoted off of
1227.50 and has spiked about 10 points to the upside so far, which
from a pattern perspectiive looks like a corrective sequence ended,
and a new upleg has started.
That said, to really get some traction on the upside, the e-SPH
must hurdle yest.'s rally peak at 1239.50. Otherwise, the messy
sideways range-trade will continue for a while longer.
May want to take a look at shorting SWC, it's the largest
platinum producer in the U.S, and also mines palladium.
Looking at the platinum chart in the newsletter last night,
this looks very similar, with the right shoulder half way formed
and starting to finish heading down, along with the RSI, MACD and
stochastics. Would like to see it get through the 20
MA and the 50 level on the RSI and stochastics just
below, to confirm a better chance to make it to the 50 MA or
lower. What do you think, Matt or Steve?
Commentary:
Copper prices have been rising for several months and
investors have been flocking to all things related to the
industrial metal. There are several possible reasons for the rise
in price, including dollar weakness, fears of inflation and even
hopes of a strengthening economy. There are currently no
ETFs physically backed by the metal, but there are a couple
that track miners.
Global X Copper Miners ETF (NYSE:
COPX) and
iPath DJ-UBS
Copper (NYSE:
JJC) are both trading near all-time highs and offer investors an
alternative to trading an individual stock in this group.
However, looking to some of the individual names, there are many
that have been showing incredible strength and could continue to
rise with the metal.
Freeport-McMoRan Copper & Gold, (NYSE:
FCX) for instance, has doubled in just the past
five months. Over the past two years, FCX has actually rallied
approximately 100 points from its December 2008 low of $15.70.
Despite the incredible run in FCX, the stock is showing few signs
of weakness. It recently cleared a small
consolidation, and is trading near all-time highs. The $110 level should be
watched as the most recent breakout level for support on any
weakness. Looking above, traders should monitor just above $127 as
a possible level of significant
resistance. This level coincides with all-time highs, and
is where FCX topped out in the last bull market.
Southern Copper Corporation (NYSE:
SCCO ) is a copper stock already testing all-time highs. SCCO
has also experienced a sharp rally from its summer lows and is
currently in a consolidation between the $40 and $47.50 level. It
already cleared a smaller
channel it was following within the base and is now attempting to
clear its base. SCCO already poked above the base; traders should
watch to see if SCCO can hold above $47.50 in the near term.
Source: StockCharts.com
Encore Wire Corporation (Nasdaq:
WIRE) is a copper stock that is in the midst of
a
breakout. WIRE was late to the breakout party earlier this fall, as it
continued to consolidate while its peers were rallying. However, it
finally cleared stiff resistance near $22 and has followed through
nicely. WIRE may be a little extended for traders looking to
initiate a position, but it should be monitored as a possible
candidate for buying on a pullback. (For more, see
The Anatomy Of Trading Breakouts.)
Source: StockCharts.com
Lihua International (Nasdaq:
LIWA) is a Chinese copper stock showing an interesting pattern.
LIWA cleared an important level near $9.50 in October and rallied
into the $13 level in a few weeks. It has since been trading in a
consolidation and is now attempting to break out of this pattern.
Traders should monitor the $13 level, as LIWA has struggled with
clearing this level in the past; a move above it would take
LIWA to all-time highs.
Source: StockCharts.com
Bottom Line
While the trend in copper stocks is well underway, they remain
worth watching for traders, as copper may have room for even higher
prices. If it continues on its trend, the miners should be the
primary beneficiaries. Traders shouldn’t chase stocks that are
extended, but these stocks are definitely worth watching for
possible buying opportunities. (For more, see
Taking A Shine To Copper.)
Wed December 15th 2010
Big-Picture Pattern Still Bullish for
China ETF
by Mike Paulenoff
From a big picture weekly chart perspective, the series of
higher lows and higher highs off of the October 2008 bear market
low at 19.35 is the dominant pattern that underpins the iShares
FTSE/China 25 Equity Index (NYSE: FXI) right now.
As long as the major up trendline from October 2008 to the
present (26 months) remains intact, now at 42.00/05, we will be
looking for another loop to the upside towards 49.00-50.00
next.
Have posted this link before, this guy - Harry Boxer, has some
great and simple TA - a lot of it similar to what BPT does that
works (mostly trendline breaks, patterns-flags, wedges, channels,
head and shoulders, and moving average crossovers, uses on balance
volume). This video has lots of short trade ideas, ones to
keep in mind in case the market rolls over, or could play out
anyway on breaks of support. As always, do your own
additional TA with BPT's and your own indicators on various
timeframes, these are all daily charts. May be able to
re-short some of these even if the market and they snap back and
fail at resistance on weak volume.
Mylan, Inc. (MYL), one of the world’s leading generics and
specialty pharmaceutical companies, was upgraded Tuesday to
Outperform by Credit Suisse analyst Michael Faerm. He expects
generic drug developers to perform well in the coming years as key
blockbuster drugs lose patent protection and as generic pipeline
opportunities grow.
MYL finished the session Tuesday at the highest close since May on
strong volume, and it's likely to continue the trend to test the
upper trend line of the bullish channel around the 21.60 area.
Preferred entry (buy stop) price is 20.80, with a stop loss
at 20.20.
Newsletter
Subscribe to our email list for regular free market updates
as well as a chance to get coupons!
The community is delayed by three days for non registered users.
Title: Investopedia/Chart Advisor Newsletter-4 Casino
Posted by curtis on 22nd of Dec 2010 at 10:59 pm
4 Casino Stocks Facing Resistance
Commentary: The casinos are starting to get interesting again as their recent consolidation appears to be drawing to a close. The casinos as a whole have been good performers for the latter half of this year, but had been experiencing some profit-taking over the past several weeks. As recently as a week ago, some casino stocks appeared to be in danger of entering a deeper correction.
Las Vegas Sands (NYSE: LVS), for instance, fell below the $44 level briefly last week as it broke below its 50-day moving average. LVS found buyers in this area and only partially closed a gap formed in late October. LVS was able to climb back into its base and is currently testing its 20-day moving average. If it can stabilize in this area it could set the stage for an attempted breakout . Traders should watch the recent low; a move below this level could force recent dip buyers to exit.
Wynn Resorts (Nasdaq: WYNN) is another stock that appeared to be in trouble recently. WYNN fell beneath its 50-day moving average in early December and fell under $100 per share. However, WYNN held above its prior base and buyers stepped in to propel the stock back over the $100 level, and its 20- and 50-day moving averages. While WYNN may not be ready for a true breakout yet, it did confirm this level as support, and traders should continue to watch it. (For more, see The Anatomy Of Trading Breakouts .)
Melco Crown Entertainment (Nasdaq: MPEL ) has been following a similar pattern in that it began to fall under support earlier this month, but quickly recovered as buyers stepped in. MPEL fell under its 50-day moving average and under lateral support near $5.90 as it corrected its prior run. It surged after the initial breakdown and also cleared the channel it was following in the correction. Much like WYNN, MPEL will likely need more time to consolidate before a true breakout attempt, but the recent price action was positive in that it confirmed a key support level. Traders should monitor the recent low moving forward.

Source: StockCharts.com
MGM Resorts International (NYSE: MGM ) is one casino that has been showing few signs of weakness. It has been steadily setting higher lows the past few months while stalling out near $14. It was able to clear $14 a few sessions ago and is clearly leading in this sector. Traders should focus on the $14 level moving forward as a pullback into this level should find buyers.
Source: StockCharts.com
The Bottom Line
While many of the casino stocks remain in a vulnerable position, the strength in MGM and the recent buying near support on the others is revealing institutional support for the group. The group as a whole has been consolidating for several weeks and often a false breakdown marks the end of a consolidation as the last of the sellers are flushed out. While it is not a certainty that this group is ready to move higher, there are enough clues to suggest that their existing consolidation may be drawing to a close.
bx looks like it broke out
Posted by curtis on 22nd of Dec 2010 at 09:56 am
in the high 14.30s now....
BX trade idea
Posted by curtis on 21st of Dec 2010 at 10:46 pm
BX our Free Stock Pick for Wed Dec 22nd 2010
The Blackstone Group (BX), after a big price-volume surge in September and October, has consolidated in the last two months in the 13-14 trading range, which looks like it's ready to be broken. The stock jumped 52 cents today, or 3.83%, on heavy volume, closing near a multi-month high - at a key resistance level - which is another indication we could see further advance in this stock. If a breakout occurs I expect to see BX in the 14.70-15.10 range short-term. Preferred entry (buy stop) price is 14.25, with a stop at 13.75.
Mike's mid-day minute - BAC Hurdles Key Resistance
Posted by curtis on 21st of Dec 2010 at 02:39 pm
Mid-Day Minute for Tue December 21st 2010
BAC Hurdles Key Resistance
by Mike Paulenoff
Bank of America (BAC) has emerged to the upside from its one-week coil pattern, hurdling key near-term resistance at 12.75/76, and should thrust directly towards a test of the December high at 12.93 on the way to 13.25/50 thereafter.
Given the very positive technical set-up, BAC should not weaken and sustain below near-term support at 12.60/50 prior to accelerating to the upside.
F trying to break out of bear flag
F
Posted by curtis on 20th of Dec 2010 at 10:35 am
after falling more than expected down to the 16.60s and filling the gap from last Fri., has seemed to broken above bear flag/channel on 5 min. charts, looking for more vol. to come in.
F
Posted by curtis on 20th of Dec 2010 at 09:58 am
Watching Ford....looks like it's in a bear wedge or bearish flag, now has filled the gap from last Friday down to the 16.70s and seeming to find support. Now we'll see if it was a falliing wedge or just falling.
MGM trade idea
Posted by curtis on 20th of Dec 2010 at 03:20 am
MGM our Free Stock Pick for Mon Dec 20th 2010
MGM Resorts International (MGM) has been trying to break out above a key resistance level at 13.80 a couple of times since October, but each attempt has been unsuccessful, with the stock each time retracing to a new higher low. This has created an ascending triangle pattern whose upper horizontal trend line -- a key resistance level -- is finally ready to be broken.
If a breakout occurs we could see momentum that could move the stock to around the 14.50-14.80 area. Preferred entry (buy stop) price is 13.85, with a stop loss at 13.30.
canadian stock?
perfect cup and handle
Posted by curtis on 19th of Dec 2010 at 09:45 pm
tried looking up ppya on yahoo finance and no record of it. Is it a canadian stock?
Title: Investopedia/Chart Advisor Weekly Report
Posted by curtis on 19th of Dec 2010 at 02:25 pm
The Weekly Report For December 20th - December 24th, 2010
Commentary: The markets consolidated in an orderly fashion this week after an impressive two-week run. While some traders may fear an end to the recent rally, this week’s price action was actually quite constructive. The markets were able to digest some of their recent gains and gave back very little ground overall. All of the indexes remain above their October/November pivot highs and well above their prior breakout points. With volume likely to dwindle the next two weeks, traders may experience a few more days of dull price action.
The S&P 500, as represented by the S&P 500 SPDRS (NYSE: SPY ) ETF, has managed to remain above its November high, and finally had some help from the lagging financial sector. With the financials pitching in, SPY is now trading at new recovery highs and is approaching the area where the markets dove off a cliff back in 2008. This could be a significant area of resistance, so traders will need to be on guard as we approach the New Year. (For more, see Technical Analysis: Introduction .)
The Powershares QQQ ETF (Nasdaq: QQQQ ) remains in a position of strength and finished the week nearly unchanged. The strength in its leaders like Amazon.com (Nasdaq: AMZN ) and Apple (Nasdaq: AAPL) has kept the pullbacks in QQQQ very shallow. QQQQ remains above a support level near $54, which coincides with its November high. Traders should look for buyers in this area on any weakness. If QQQQ loses this level, then $52 will be the next level to watch.The Diamonds Trust, Series 1 (NYSE: DIA ) ETF actually managed to close positive for the week and is also close to testing a key high from 2008. The benefit of the doubt has to sit with the bulls at this point, as the markets continue to push higher. However, the next few weeks could see the markets pushing to the levels that preceded one of the worst market crashes in history. For DIA, the $118.73 level was an important high, and the whole $118 range should have traders on guard for the chance that DIA will trade there soon. If DIA can eventually clear this level it could bring more investors back from the sidelines.
One positive for the markets that is showing an underlying strength is the recent price action in the iShares Russell 2000 Index (NYSE: IWM ) ETF. IWM also closed the week higher and is now above the same important resistance levels SPY and DIA are facing. IWM reversed from the $76 mark a couple of times in 2008 before crashing along with the markets. These highs in the markets are important from a psychological perspective as many investors and traders finally have their 401(k) and retirement accounts back at pre-crash levels. Because it’s human nature to want to get out at breakeven, traders should realize the importance of these levels. The fact that IWM is above this level is a positive and shows that market participants are being more aggressive.
The Bottom Line
The past three weeks have now seen a surge in the markets followed by a quiet consolidation. Historically, the end of the year has been positive for the markets and the typical year-end rally has even coined the term Santa Claus rally . The markets continue to show underlying strength and many individual stocks remain in a strong position. While the near-term picture still looks very strong, traders should be cognizant of the significant resistance levels that SPY and DIA have yet to face. If there was a single level that would bring in sellers, it would be where SPY failed in 2008 near $143.55. Traders should watch this key area as we head into the next year. (For related reading, see Santa Claus Endorsement Deals .)
Excellent Chart
10 day CPCE....
Posted by curtis on 19th of Dec 2010 at 02:17 pm
Thanks for your great charts, marketguy, always enjoy seeing them and this one really points out how a pullback should be soon, maybe not tomorrow, but it's coming in the next week or 2, going by this chart.
THRX short trade idea
Posted by curtis on 17th of Dec 2010 at 09:12 pm
Had huge volume on the down day today, and has formed neg. div on RSI, and trying to on MACD - it needs to cross down, and 14 slo sto has just crossed below 80. Still would like to see it get below the 8 EMA, which it's been above since mid-November - to consider taking a short, but definitely one to watch with the large neg. volume spike today and neg. divergences.
It's obvious what's propping the market up now....
Tech high fliers look pooped!
Posted by curtis on 17th of Dec 2010 at 04:48 pm
....marketguy's still short the markets. As soon as he's out, it will go down in a huge pullback.
Mike's mid-day minute - AMAT
Posted by curtis on 17th of Dec 2010 at 03:06 pm
Mid-Day Minute for Fri December 17th 2010
Upgrade Adds to Powerful Chart Picture for AMAT
by Mike Paulenoff
Applied Materials (AMAT) was the beneficiary of a Barclay's upgrade this morning and an upwardly revised target price to 17 from 12, which is having a positive impact on the stock price.
An upgrade to an already powerful chart picture and technical set-up aligns the fundamentals and the technicals, in this case both bullish.
AMAT is heading next for a confrontation with its 2010 resistance line, now at 13.78, which if hurdled should trigger upside continuation to test 14.00/10.
WNR has been a good short all week
Posted by curtis on 17th of Dec 2010 at 02:24 pm
WNR has continued to be a good short all week, ever since it crossed below the bearish rising wedge it had been in for over a month on Monday. It closed in the 10.60s last Friday, and got down to the 8.70s today, still may be more room on the downside, but the major move of 15%+ has been put in over the last few days. And not only could have bought the Dec. 10 puts on Mon. AM at 10 cents, went to 65 later that day and 85 cents yesterday, but also bought the Dec. 9 puts today and they went from 5 cents early this AM to 25 cents this afternoon.
Mike's mid-day minute - Emini-SPX/Bears Squandered Opportunity
Posted by curtis on 16th of Dec 2010 at 12:58 pm
Mid-Day Minute for Thu December 16th 2010
Squandered Opportunity by Bears
by Mike Paulenoff
As we entered the noon hour, the S&P 500 saw yet another squandered opportunity by the bears to inflict some meaningful damage to the powerful upmove off of the late-Nov lows. Instead, the index, analyzed through its round-the-clock emini contract, pierced yesterday's low at 1228.75 by 1.25 points, but failed to follow through on the downside, and then pivoted to the upside with power.
This tells us that on every dip it seems that a "healthy short position" develops, but is quickly covered upon the slightest "lack of downside progress." And so we see that the e-SPH pivoted off of 1227.50 and has spiked about 10 points to the upside so far, which from a pattern perspectiive looks like a corrective sequence ended, and a new upleg has started.
That said, to really get some traction on the upside, the e-SPH must hurdle yest.'s rally peak at 1239.50. Otherwise, the messy sideways range-trade will continue for a while longer.
SWC short?
Short Palladium
Posted by curtis on 16th of Dec 2010 at 09:40 am
May want to take a look at shorting SWC, it's the largest platinum producer in the U.S, and also mines palladium. Looking at the platinum chart in the newsletter last night, this looks very similar, with the right shoulder half way formed and starting to finish heading down, along with the RSI, MACD and stochastics. Would like to see it get through the 20 MA and the 50 level on the RSI and stochastics just below, to confirm a better chance to make it to the 50 MA or lower. What do you think, Matt or Steve?
Title: Investopedia/Chart Advisor Newsletter-4 Red
Posted by curtis on 15th of Dec 2010 at 08:44 pm
4 Red Hot Copper Stocks
Commentary: Copper prices have been rising for several months and investors have been flocking to all things related to the industrial metal. There are several possible reasons for the rise in price, including dollar weakness, fears of inflation and even hopes of a strengthening economy. There are currently no ETFs physically backed by the metal, but there are a couple that track miners. Global X Copper Miners ETF (NYSE: COPX ) and iPath DJ-UBS Copper (NYSE: JJC ) are both trading near all-time highs and offer investors an alternative to trading an individual stock in this group.
However, looking to some of the individual names, there are many that have been showing incredible strength and could continue to rise with the metal. Freeport-McMoRan Copper & Gold, (NYSE: FCX) for instance, has doubled in just the past five months. Over the past two years, FCX has actually rallied approximately 100 points from its December 2008 low of $15.70. Despite the incredible run in FCX, the stock is showing few signs of weakness. It recently cleared a small consolidation , and is trading near all-time highs. The $110 level should be watched as the most recent breakout level for support on any weakness. Looking above, traders should monitor just above $127 as a possible level of significant resistance . This level coincides with all-time highs, and is where FCX topped out in the last bull market.
Southern Copper Corporation (NYSE: SCCO ) is a copper stock already testing all-time highs. SCCO has also experienced a sharp rally from its summer lows and is currently in a consolidation between the $40 and $47.50 level. It already cleared a smaller channel it was following within the base and is now attempting to clear its base. SCCO already poked above the base; traders should watch to see if SCCO can hold above $47.50 in the near term.
Encore Wire Corporation (Nasdaq: WIRE) is a copper stock that is in the midst of a breakout . WIRE was late to the breakout party earlier this fall, as it continued to consolidate while its peers were rallying. However, it finally cleared stiff resistance near $22 and has followed through nicely. WIRE may be a little extended for traders looking to initiate a position, but it should be monitored as a possible candidate for buying on a pullback. (For more, see The Anatomy Of Trading Breakouts .)

Source: StockCharts.com

Source: StockCharts.com
Lihua International (Nasdaq: LIWA ) is a Chinese copper stock showing an interesting pattern. LIWA cleared an important level near $9.50 in October and rallied into the $13 level in a few weeks. It has since been trading in a consolidation and is now attempting to break out of this pattern. Traders should monitor the $13 level, as LIWA has struggled with clearing this level in the past; a move above it would take LIWA to all-time highs.
Bottom Line
While the trend in copper stocks is well underway, they remain worth watching for traders, as copper may have room for even higher prices. If it continues on its trend, the miners should be the primary beneficiaries. Traders shouldn’t chase stocks that are extended, but these stocks are definitely worth watching for possible buying opportunities. (For more, see Taking A Shine To Copper .)
Mike's mid-day minute - FXI
Posted by curtis on 15th of Dec 2010 at 02:14 pm
Mid-Day Minute for Wed December 15th 2010
Big-Picture Pattern Still Bullish for China ETF
by Mike Paulenoff
From a big picture weekly chart perspective, the series of higher lows and higher highs off of the October 2008 bear market low at 19.35 is the dominant pattern that underpins the iShares FTSE/China 25 Equity Index (NYSE: FXI) right now.
As long as the major up trendline from October 2008 to the present (26 months) remains intact, now at 42.00/05, we will be looking for another loop to the upside towards 49.00-50.00 next.
Chart(s) of the Day video for short trade ideas
Posted by curtis on 15th of Dec 2010 at 03:03 am
http://www.thetechtrader.com/chartofday/
Have posted this link before, this guy - Harry Boxer, has some great and simple TA - a lot of it similar to what BPT does that works (mostly trendline breaks, patterns-flags, wedges, channels, head and shoulders, and moving average crossovers, uses on balance volume). This video has lots of short trade ideas, ones to keep in mind in case the market rolls over, or could play out anyway on breaks of support. As always, do your own additional TA with BPT's and your own indicators on various timeframes, these are all daily charts. May be able to re-short some of these even if the market and they snap back and fail at resistance on weak volume.
MYL trade idea
Posted by curtis on 15th of Dec 2010 at 02:45 am
MYL our Free Stock Pick for Wed Dec 15th 2010
Mylan, Inc. (MYL), one of the world’s leading generics and specialty pharmaceutical companies, was upgraded Tuesday to Outperform by Credit Suisse analyst Michael Faerm. He expects generic drug developers to perform well in the coming years as key blockbuster drugs lose patent protection and as generic pipeline opportunities grow.
MYL finished the session Tuesday at the highest close since May on strong volume, and it's likely to continue the trend to test the upper trend line of the bullish channel around the 21.60 area. Preferred entry (buy stop) price is 20.80, with a stop loss at 20.20.