Frequently Asked Questions:
Note: Please take the time to thoroughly read the FAQ questions and answers below regarding the universal KISS trend following system.
please take a moment to read over our disclaimer, trading involved risk, and past performance is not indicative of future results.
Overview
What is the KISS System?
The KISS system is a trend following system, which is long only. When the system goes long, it sets an initial stop, we call these Stops, smart trailing stops (STS). The stops are kept wide enough not to be overly triggered by noise, and get moved up to higher and higher levels over time if price is uptrending.
The STS stops give you an exit plan for protection to keep losses small, and/or to protect profits as the instrument moves up over time. The system allows one to avoid being long during strong market corrections and bear markets. It’s like having life insurance for your portfolio. While the system is profitable on a huge variety of stocks and ETF’s using the same settings, it is not perfect, nothing is, however it will be continually improved upon with new filters and rules over time.
The KISS systems can give one a methodical method for managing a long position with it’s STS stop technology.
Can You Show Me a Couple Examples of the KISS System?
See images below taking directly from the dynamic charts right from the KISS Tables:
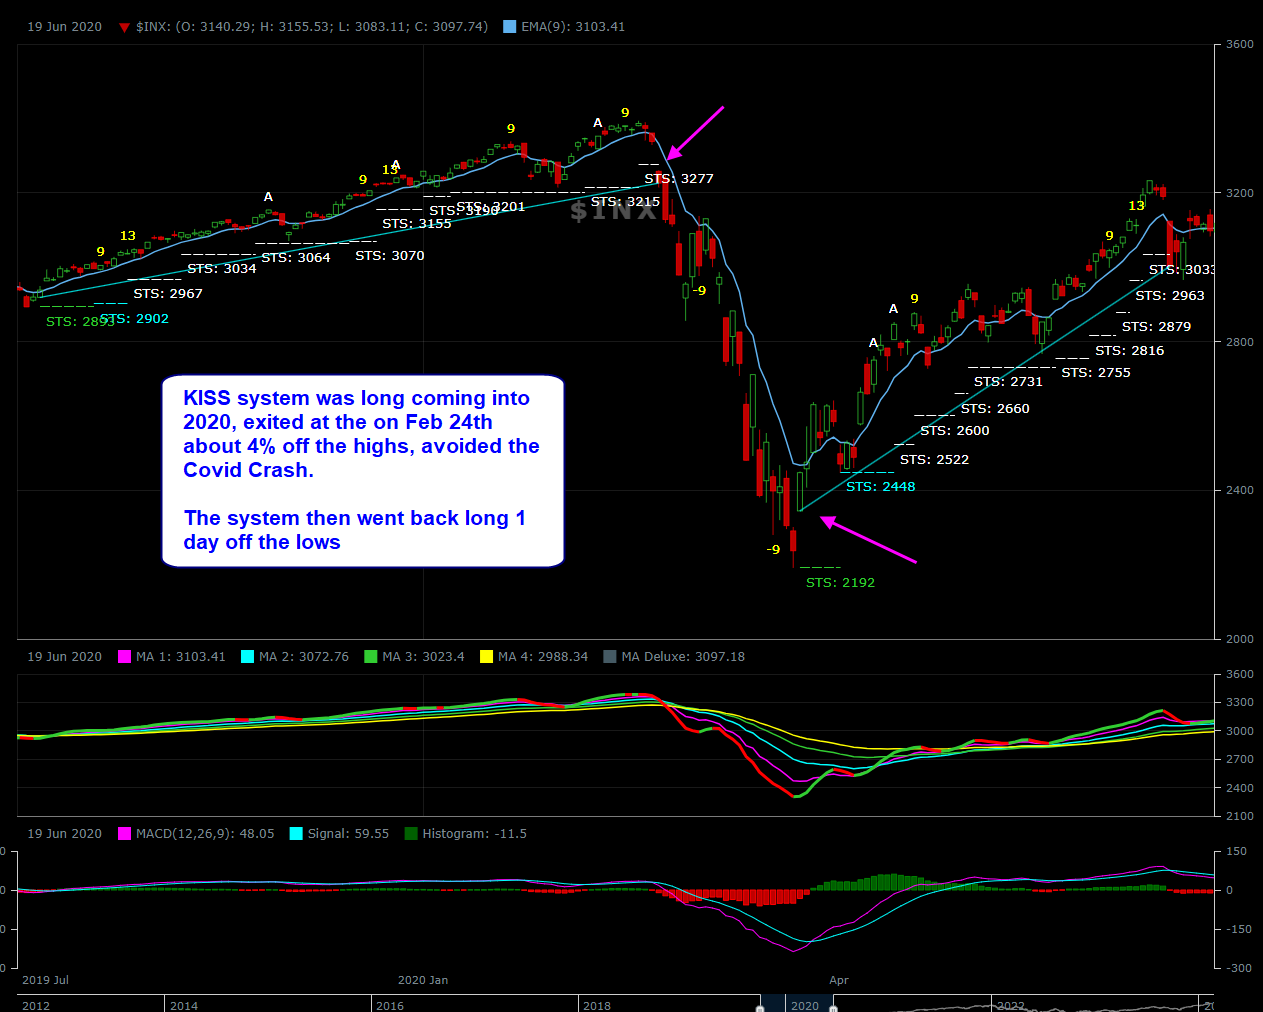
The first image shows the S&P 500 during the 2020 crash and how the KISS system was long going into 2020, and via the system exited the long on Feb 24th, approximately 4th off the highs, and avoided the brunt of that Covid Crash. The system then went back long 1 day off the lows. This is a great example of what the KISS System is designed to do - offer protection.
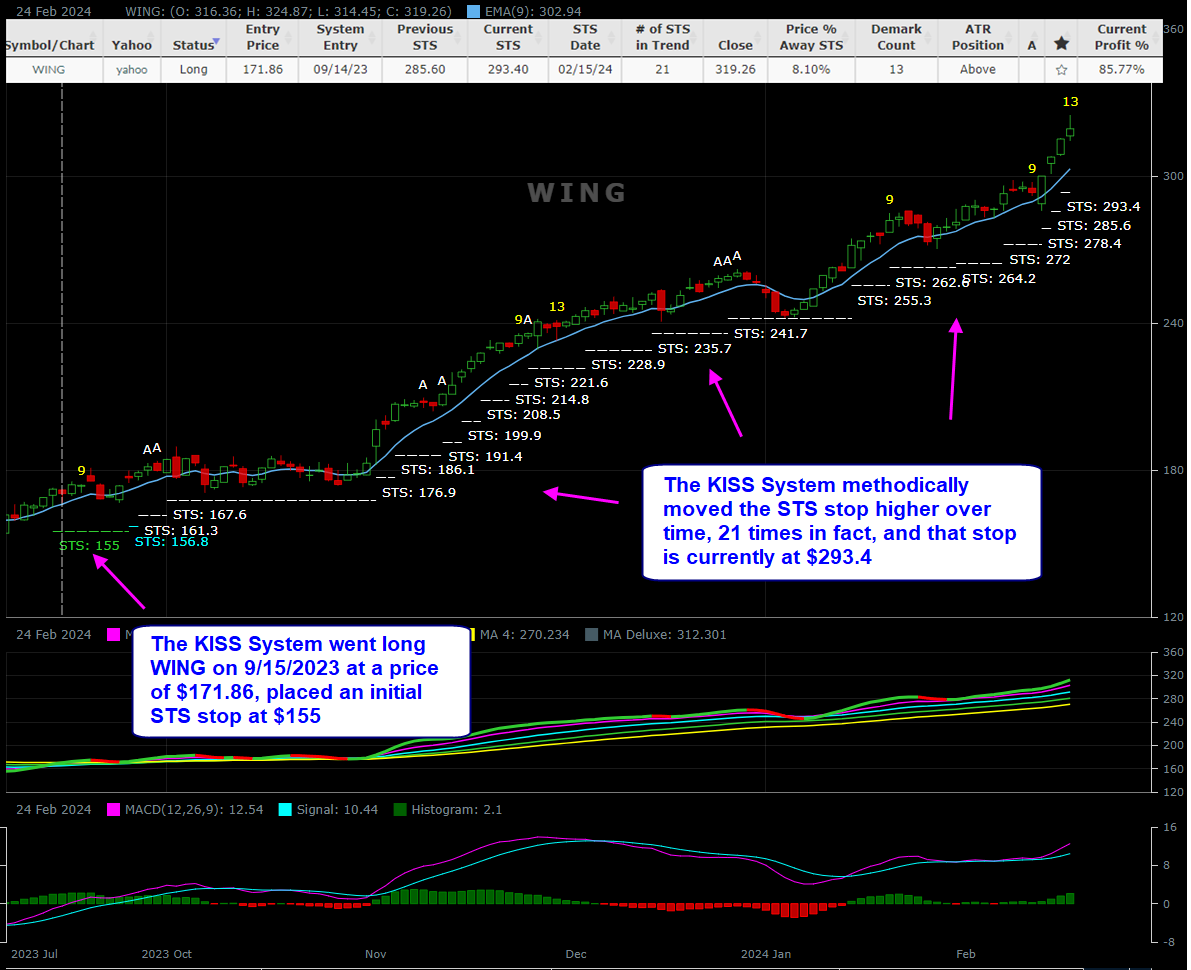
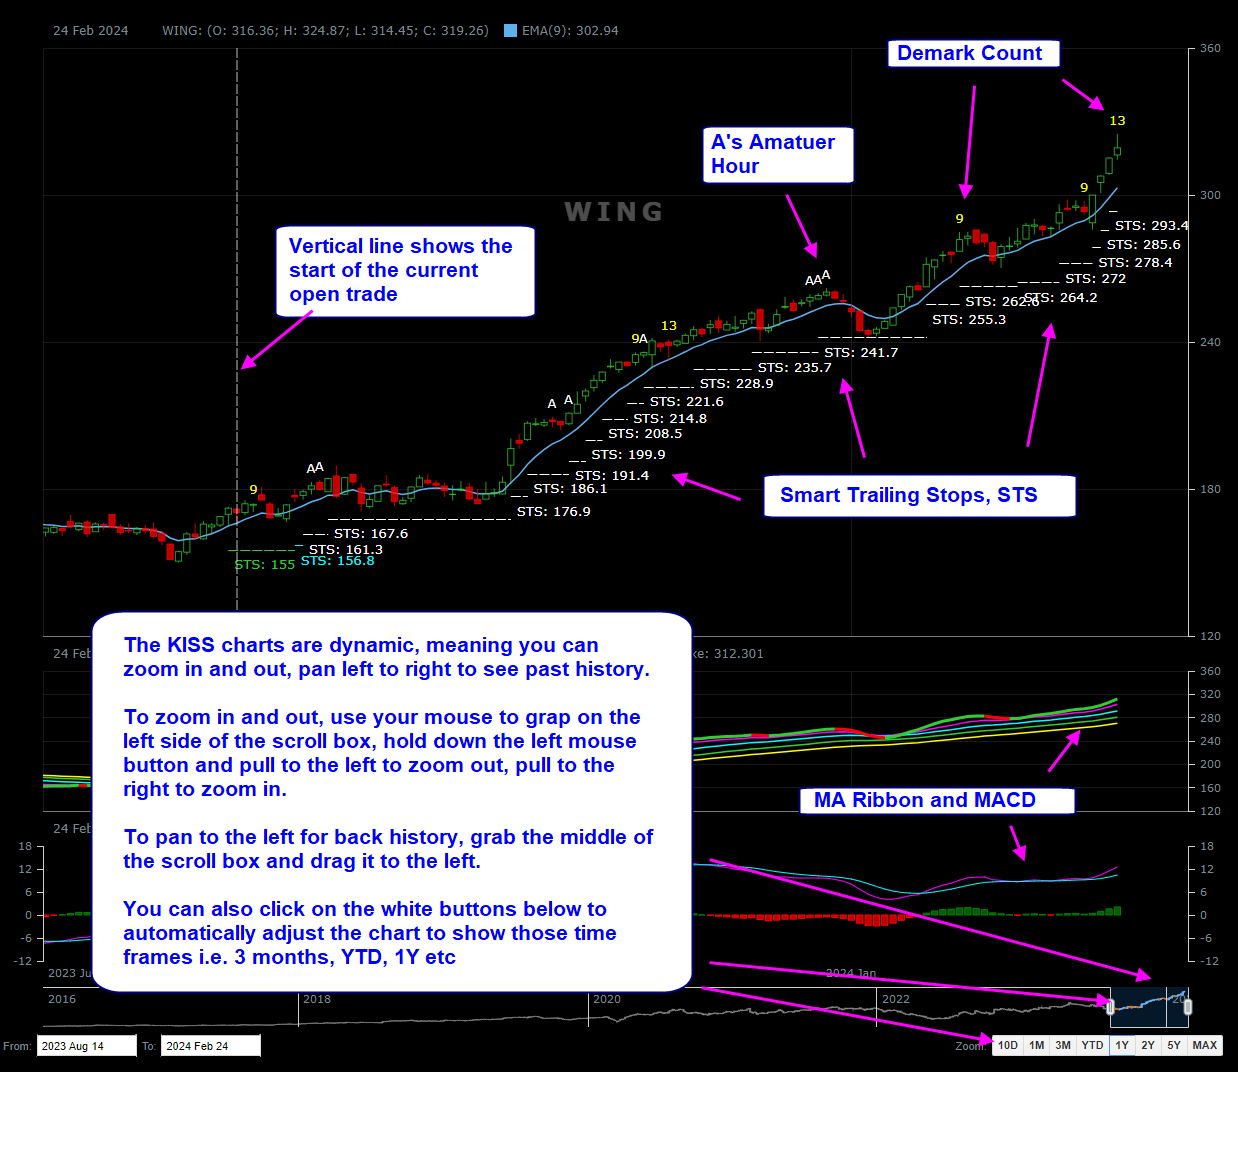
The next image shows a recent trade shows a KISS System long trade on WING that is still open at the time of this example. The system went long WING on 9/15/2023 at a price of $171.86, placed an initial STS stop at $155, and methodically moved it higher over time, 21 times in fact, and that stop is currently at $293.4, therefore the trade is wildly profitable now even if the current STS stop is hit. Also, note the other useful information on the chart such as the Demark Count (the Demark 13 might be a short-term warning of a pullback soon), the A’s, the MA ribbon, MACD etc - more info on these later on.
Important: Open trades are denoted via a vertical line from the entry, while previously closed trades have lines connecting the entry and exit.
Additionally - the vertical line drawn on the dynamic charts for the current open trade shows NOT on the trigger day, but on the next bar (the entry price is on the open of that bar). We do this for more of a real world scenario where many folks will likely not enter the trade in the after hrs market on the day they receive the notification, but instead wait to enter the trade on the following morning. Otherwise, the stats are slightly better to enter on the day of the trigger (not always as the next morning prices could gap and give you better or worse prices than the previous close).
From the 2 examples you showed above, it looks like each new STS always moved up to a higher price from the previous one, is that true?
In most cases this is what you will see, probably 90% or more of the time. However, there are times when the new STS will be at a lower price than the previous one. The reason for this is because the system is using multiple average true range calculations, and when the new STS stop drops lower than the previous one, the system likely handed off one of the ATR functions to a wider one, hence the stop gets wider - this is discussed below.
Why did you build the KISS System and why the name KISS
For almost 15 years I’ve dabbled with systems, almost exclusively mean-reversion systems, which we currently send out trade notifications to subscribers for both the SPY ETF and MES futures. Mean-reversion systems have high winning percentages but are in cash most of the time and are generally short-term trades in nature lasting 1 day to 1 - 2 weeks on average. Mean reversion systems are great at catching statistical overbought and oversold conditions in the markets and generally work best on the indexes, such as SPY, QQQ, and not as well on individual stocks.
For years I had a long-term trend-following system affectionately called the ‘Paint Dry System’, which per the name suggests, is like watching paint dry as trades can be held for years at times before there’s a new signal. The system was used on the S&P 500 index as a means for some folks (family and friends non-traders, to manage their S&P 500 401K holdings that they wanted to keep invested during bull markets, but stay out of bear markets such as 2008, 2000-late 2002 etc. The system was fine but boring, and since it was based on a monthly time frame, it wasn’t very adaptive to fast changing markets.
I’ve always had the dream to build a trend following system that works well on the indexes as well as individual stocks, a universal system so to speak. I set about do develop a system (originally for an RIA firm whom I was a partner with at the time and no longer with, that they could use to manage their clients accounts, who they have invested in various asset classes, typical of most advisors (Large Caps, Technology, Small Caps, International, Bonds, etc). As you may know, the problem with 95% or move of investment advisory firms (such as Edward Jones) is they are only buy and hold, they will never attempt to time the market, and will allow their clients to hold through entire bear market declines, while telling them to stay the course whenever they complain or call asking to get out of the market. This works fine in bull markets, but clients experience huge draw downs during bear market conditions that can take years to get back to break even. With this model, why would someone pay 1% - 1.5% management fees to an investment advisor, when that person could simply buy ETF’s such as SPY, QQQ, IWM, TLT, and get the same or higher returns without the fees?
The KISS system is long only because it was originally designed for a 401K type of account; one cannot short and most people simply hold index and bond ETF’s. The system was designed to universally work on most stocks, indexes, and ETF’s without backtesting, instruments that tend to trend well over time. The system gives one an systematic approach to managing their 401K’s and individual stocks with a series of protective stops that allow one to ride uptrending markets, and stay out of most bear market conditions, and to greatly limit drawdowns, that one typically has to go through during buy and hold, which can be 30% to 50% during a bear market.
The system can also be used like a half system, where one can use it to help manage current stocks/ETF’s that they are already holding and did not enter via the system; the stop technology is very useful to give one ideas for a trailing protective stop.
Basically the system either be used as a full system from entry to stop close out, or as a stop management tool for stocks that one already owns that were not entered originally via the system.
Why is the KISS System long only?
The KISS system is long only because it was originally designed for a 401K type of account, before I discovered that it could be used on the majority of mid to large cap stocks and ETF’s very effectively. Also, the vast majority of people do not short, and the markets are in uptrend conditions 80% or more of the time.
When the KISS system exits or stops out, is that a good signal to go short?
While that may work sometimes, it’s generally advised to use your own triggers when shorting. Read my comments above, the system is primarily designed for uptrending markets and conditions. Corrections and bear markets tend to be fast, violent, emotional, and over fairly quickly. Downtrending markets behave far differently than uptrending markets and entirely new parameters and rules would need to be deployed for shorting, such as much tighter stops, taking profits more quickly etc. The KISS system was designed to give the ample room needed to stay in uptrending conditions that could last for weeks and months at a time.
You stated that the KISS System is profitable on a majority of stocks, ETF’s, and trading instruments without backtesting?
Yes the system is profitable on a huge variety of stocks and ETF’s and that’s what makes the KISS system so exciting for me. I’ve been dabbling with systems for many years, primarily mean-reversion systems. However, all those systems, while they may produce profitable trades on one instrument or a few ETF’s using the same settings, for the majority of stocks and ETF’s, extensive backtesting and some curve fitting is required. The KISS system appears to have tapped into a universal function of the market where simply using the standard settings with no backtesting produces profitable systems with profit factors of 2, 3, 5 etc on most stocks, ETF’s, and indexes (excerpt for inverse ETF’s). That said nothing is perfect and nothing is guaranteed to keep working.
The KISS system is designed to catch trending moves, and if the instrument doesn’t trend well on that given time frame (low priced stocks, penny stocks, etc, then the KISS system may not be profitable for that instrument. An example is the GDX ETF, the daily KISS system has a profit factor less than 1, which means the KISS System has not been profitable in the long run for that instrument. GDX, for example, has been down 9 out of its 18 year history (50% of the time) and has not been profitable on the daily time frame - GDX simply doesn’t trend up long enough on a daily time frame to be a good fit for the KISS system. That said, if I move to a smaller time frame (130 min, 78 min etc) then it can catch trending moves, especially on the high performance versions.
Can the KISS systeme be used for inverse ETF’s?
Generally not without some tweaking of the settings, and zooming down to a much smaller time frame over the standard daily time frames. While the KISS System may catch some nice trades, the system was designed for uptrending markets. The markets spend the vast majority of their time in uptrends and sideways chop, perhaps 85% - 90% of the time, whereas bear markets and large declines tend to be only a very small percentage of the overall long-term market trend.
Also, downtrends and bear markets are not simply inversions of bull market uptrends where you can take the chart of an uptrend and simply flip it upside down. The markets move based on long term fundamentals, psychology, and emotion. Uptrending markets can last for very long periods of time and simply drift higher. You may have heard the phrase, ‘topping is a process’ and that’s very true, the market can melt higher for long periods of time before finally getting exhausted.
Downtrends and corrections on the other hand tend to be sharp and fast, very emotional, and over quickly. Therefore, the same conditions that one may use to catch uptrending conditions, cannot simply use the inverse of those settings. Systems to catch downtrending moves have to have much tighter parameters and stops, with profits being taken much more quickly than an uptrending market where you need to give room for the instrument to trend higher.
What are the KISS System parameters?
The KISS system is simple but extremely complicated with all of the logic that works synergistically together and far too much to go into great detail. Plus, the exact logic is proprietary and not something I am willing to divulge.
That said, here's some general information that may help. First off the system is not a curve-fit system, such as a moving average crossover system. In fact the system doesn’t use moving average crossovers at all for signals, though it does reference various moving averages as guides and filters. As I discussed before, the system is designed to catch uptrending conditions, and thus attempts to keep its STS stop wide enough to avoid getting chopped out on noise and sideways movements, but tight enough to keep you from giving a lot of profits back and keeping draw downs very small. Drawdowns can be 1/5 to 1/10 of typical buy and hold.
The system adapts to market conditions and changes with volatility by using the average true range of the market. In fact, the system uses up to three average true range calculations to adapt with the markets and attempts to stay in an uptrend for as long as possible. The system also has a mean-reversion component where the system can trigger a long condition after a strong sell off in the market after a strong reversal up candle. I call this the ‘washout’ trade, where the system can at times nearly catch 1 or 2 candles off a major low after a sell off, such as early March 2020 after the Covid crash, see image below.
The system also has an Elliot Wave like component where it will look for 3-wave abc pullbacks in the market or individual stocks and buy a reversal candle up after a 3 wave move. During trending moves, counter trend pullbacks tend to 3-wave ABC like in nature and the system has logic to try and identify these as low risk long entries. See the diagram below:
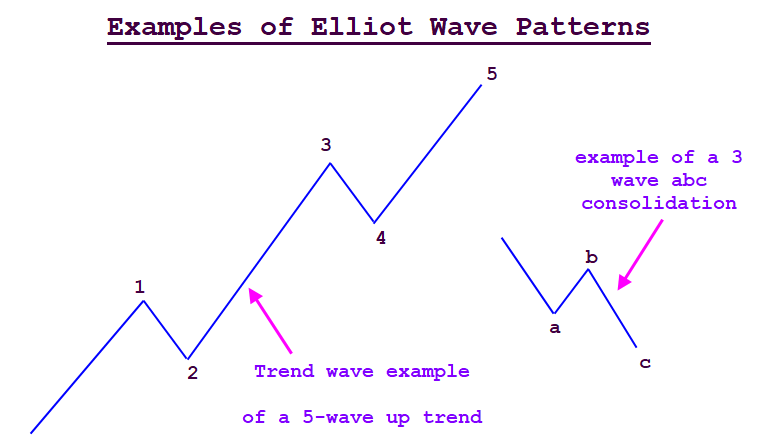
When the system first goes long it sets an initial smart trailing stop STS, and if price trends higher over time, the system will intelligently raise the stop higher over time, keeping it wide enough to avoid a lot of chop but tight enough to give you great protection. Price consolidations in uptrending markets many times form abc like patterns, and this is what enables the system to quickly get back into the trend.
What are the KISS Systems Tables?
The KISS Systems tables are an amazing resource with nothing else out there like it. The standard KISS Systems tables show a summary table, which tracks the system running on over 750 stocks and ETF’s (with more being added over time) and these stocks/ETF’s are grouped into baskets that you see as buttons, which contain groupings of these stocks/ETFs. You can track how the KISS system is trading all these instruments (for example you can see the KISS system is trading all the Dow Jones 30 stocks, or all the S&P 500 stocks, all the Nasdaq 100 stocks, and you can also use the search box to find a particular stock or ETF. The standardized non-optimized KISS system is running across every one of these instruments i.e. the same settings are used for every one of these stocks and ETF’s located in the baskets (except the high performance basket, which uses optimized settings).
Please discuss how to read and use the KISS Systems tables
The KISS systems tables contain a wealth of information.
Here’s a description of the Baskets:

- BPT Basket: Contains the major indexes SPX, SPY, UPRO, SSO, QQQ, and a couple widely followed big cap stocks. This section is free
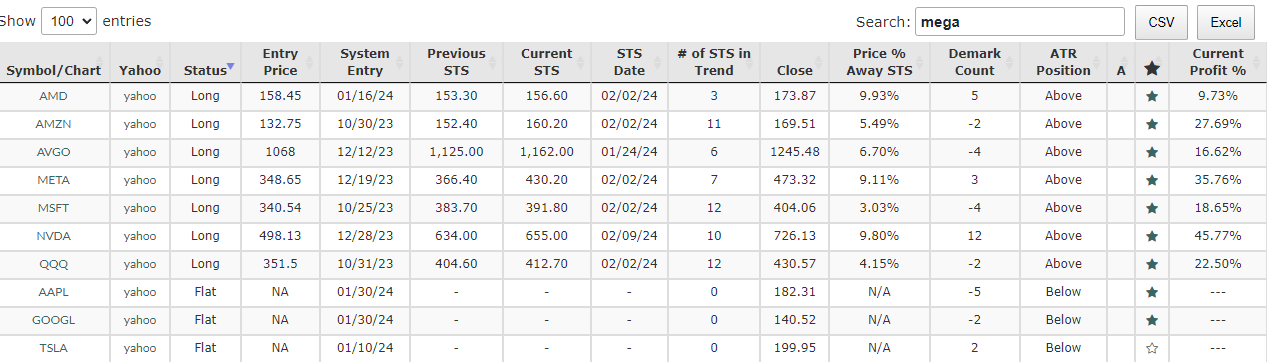
- Mega 10 Basket: Contains the top big cap tech stocks that have huge weightings on the market indexes (AAPL, META, MSFT, etc)
- Nasdaq 100: Contains all the Nasdaq 100 stocks
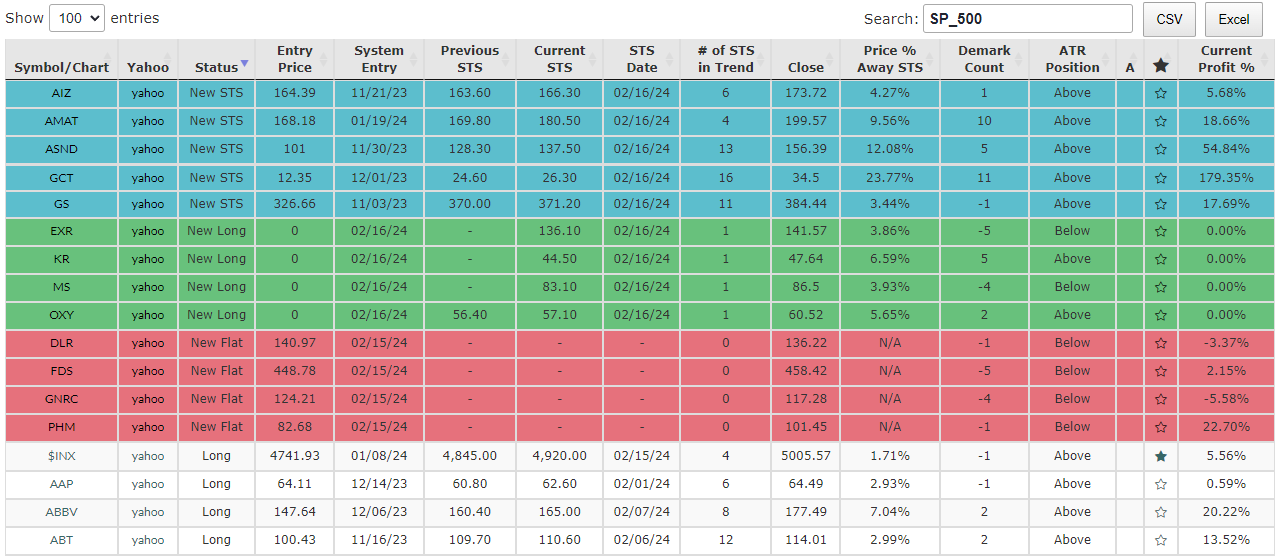
- S&P 500: Contains all the S&P 500 stocks
- Top 100 ETS’s: Contains well over 100 ETF’s with more being added over time
- DJI: Contains all the Dow Jones 30 stocks
- Popular: Contains the top 20 stocks and ETF’s that subscribers are tracking
- MISC: This is where I’m adding new stocks per requests
- Favorites: A personal tab that contains all the favorites that you’ve selected (and these get emailed to you whenever there is a change/updated to one of your selected favorites, such as a new long entry, a new STS stop, etc)
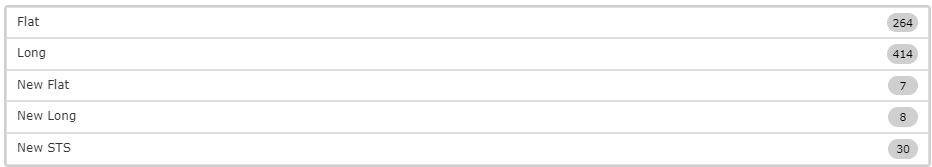
Next, below the Basket’s (tabs) and above the tables, you will see a condensed summary of what the systems did that day across all the baskets.
- Flat - shows the number of stocks across all baskets that are currently flat, not in a long position
- Long - shows the number of stocks where the system took a new 1st entry long that day
- New Flat - shows the number of symbols the system was long and exited that day and went flat
- New STS - shows the number of symbols have been long where a new STS stop was generated for that day
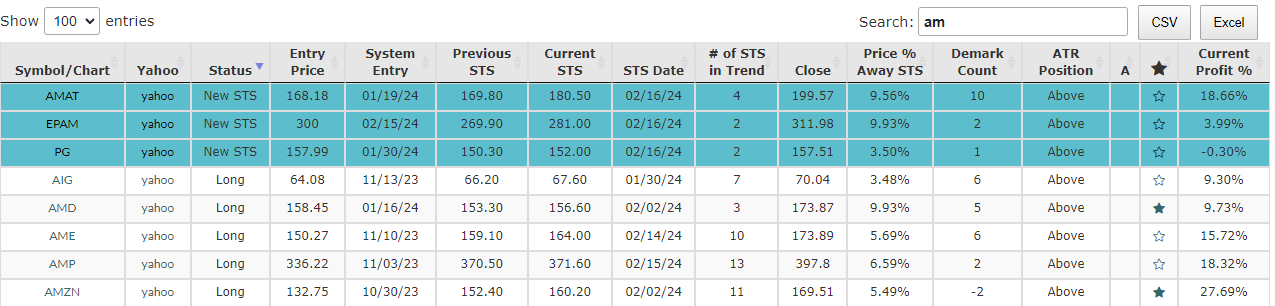
Next, below the condensed summary table, there is a search box on the right hand side that you can also use to search for individual stock/ETF symbols by symbol or by company name vs having to dig through the tables to find them. Please note that sometimes more than one symbol will show up when the search term is a part of multiple symbols; for example a search using ‘AM’ results in 33 results because AM is commonly part of many words and symbols.
Finally let’s discuss the tables:
The tables contain a summary of the KISS Systems for the baskets. The headers can be sorted by simply clicking on them. For example you can sort by symbol to display alphabetical order. You can sort by status. You can sort by # of STS in Trend, or by price % away from STS, or by Demark Count, by A’s, and by Current Profit %.
Next, see the summary basket below for the Mega 10 basket. This basket contains 10 large cap tech stocks, and at a glance you can see that the KISS system is long 7 out of the 10 stocks, the % G/L of the open positions, where the current STS stop is etc.
Next, take a look at the table below regarding the shaded row colors:
Rows that are highlighted in blue show at a glance the long systems that generated new STS stops that day. Green colored rows show new system longs. Rows highlighted in red show systems that were long but closed that day via closing below their most recent STS stop. Rows that are white, not colored, either no changes occurred to an open system or the system is flat.
Next let’s discuss the column headers:
Symbol/Chart: in addition to showing the status of the KISS system for that symbol, if you click on the symbol you can see an actual dynamic chart that pops out in a separate browser window. This chart shows an actual daily chart plot of the symbol, and plots the current system trades, along with the past trades. The open system trade is shown via a vertical dotted line, and past trades show connecting lines from entry to exit. You can see the progression of the STS stops. You can also zoom in and out of the chart and pan to the left by using the scroll bar on the bottom of the chart: Click the left corner, hold and drag to zoom in or out, or click in the middle of that scroll bar window to pan backwards and forwards in chart history.
The charts also contain Demark counts, A’s show up on the chart (showing Amateur Hour buying/selling), along with the BPT MA Deluxe MA ribbon, and the MACD.
Yahoo: this header links you to the Yahoo Finance page for that symbol if you wish to look up additional info on the stock/ETF.
Status: Shows you the status of the KISS system for that symbol, Flat, Long, New Long
Entry Price: Is the entry price for the system on the next day’s open. The new long signals occur on the closing bar, and for a real world scenario where most people may not enter the trade in after hrs, but will enter the next morning on the open, we choose to show the entry price as the next day’s opening price. Realize that you will get alerted the previous day when the tables update and when you receive your KISS Email notification.
Previous STS: Previous STS is the previous STS stop price
Current STS: Is the current STS stop price when the system is in a long position
STS Date: STS date is the date that the most recent STS was generated
# of STS In Trend: Shows how many consecutive STS stops have been generated in the current trend.
Close: The closing price of the instrument from the last update
Price % Away STS: Shows the percentage away the current closing price is above the STS stop. Useful information because when price is very far above from the STS, price is vulnerable for a pullback,and when price is very close entries could be considered with a tight stop.
Demark Count: Shows the current Demark Count, also displayed on the dynamic chart. Google Demark Count for more information
ATR Position: ATR is average true range, Above and Below designates if price is above or below a 14 length weighted ATR
A: A means amateur hour, it occurs after a price runup and after decreasing volume. In downtrends it shows up after an extended downtrend and means that price has been declining on lighter volume. A’s tend to show up near inflection points when price is vulnerable to a pullback. A’s are also displayed on the dynamic chart
*: The Star designates favorites. The Star is unfilled by default, set favorites by clicking on the Stars and they will stay highlighted designating that you selected those symbols as favorites. In order to remove a favorite, simply click on the star again to unfill it. The selected favorites are then saved into the favorites tab! The website will automatically send you updates via email and SMS whenever a change occurs to one of your favorites (new entry, new STS stop, exit). You must select the checkbox to receive emails in the favorites section.
Current Profit %: Shows the current % G/L of the open trade.
VERY IMPORTANT - for the standard KISS Systems, when these trigger a new long entry, this gets added to the tables that day shortly after the cash market close, as well as sending a trade notification email (if you have that symbol set as a favorite) to notify you on the day the system triggered.
HOWEVER, on the trade tables, the entry price is shown as the next day’s opening price, and the % GL is also computed based on this, NOT from the previous day’s close when the system triggered. We do this for more of a real world scenario where many folks will likely not enter the trade in the after hrs market on the day they receive the notification, but instead wait to enter the trade on the following morning. Otherwise, the stats are slightly better to enter on the day of the trigger (not always as the next morning prices could gap and give you better or worse prices than the previous close).
Additionally - the vertical line drawn on the dynamic charts for the current open trade shows NOT on the trigger day, but on the next bar (the entry price is on the open of that bar)
Can you show an example of one of the dynamic KISS charts from the KISS Tables?
Sure, but as you know I already showed two examples above. Here’s a chart of WING again. You can see the system entry, the progression of the STS stops, various useful indicators such as the Demark Count, the A’s Amateur Hour, MA ribbon, MACD.
Note that these are dynamic charts, meaning you can zoom in and out, pan left and right to see past history etc. We purchased and installed a charting software that we installed on our server, the KISS systems automatically plot these charts using that software.
When are the KISS Systems tables updated?
The standard daily KISS Systems tables and charts are updated once a day shortly after the cash market close shortly after 4 pm EST. Once the systems are updated, a custom email is generated and sent to each subscriber if there is a change/update to one of the favorites they selected.
The High Performance KISS Systems will be updated multiple times intra day because of their smaller time frames, and emails along with SMS notifications will also be sent intra day.
Please discuss the favorites section and notifications I’ll receive?
As described above, by clicking on the * Star in the columns for each symbol, you can save those symbols as favorites, which show up in the Favorites basket
Inside the Favorites basket you will see all of the stock symbols you selected as favorites. To remove favorites simply click on the Star icon to unhighlight from a filled back to an open star.
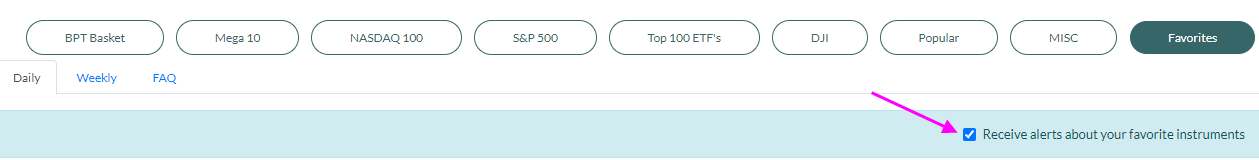
In the favorites section there’s a checkbox on the right hand side just below the basket buttons. You must check this box in order to automatically receive email update notifications for your favorites (new entries, new STS stops, exits).
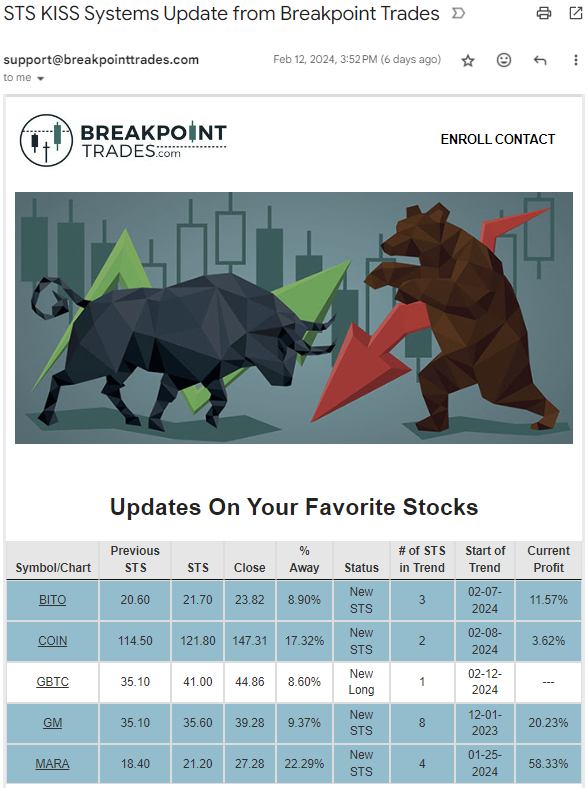
Can you show me an example of an email notification I’ll receive for the favorites I’ve selected?
See attached image. This was taken directly from my Gmail account.
Important: All emails will have the title ‘STS KISS Systems Update from Breakpoint Trades’ and these emails are sent from the same email address: support@breakpointtrades.com Email services these days can be overly aggressive in their attempt to control spam, and may at times send our STS email alerts to a spam folder or promotions folder that you do not see from your primary inbox. Since you know the email address of the alerts, I suggest white labeling our email address or creating a filter in your email where all emails from support@breakpointtrades.com go to, that way you won’t miss the alerts!
The image below shows what a typical email alert from the KISS tables looks like. On this table you can see new STS stops were generated for 4 of my favorites, while GBTC was a brand new long, which triggered that day. The system only sends updates when there is a change - this email shows 5 stock symbols that had changed that day, however I have around 30 favorites saved.
Do the KISS Systems stop out at the STS price intra day or do they wait for a closing bar below the STS?
The standard (non high performance) KISS systems only close out the trade if price closes below the STS.
The specialized high performance versions stop out if the STS is hit intra day, therefore one can set GTC stops for these to automatically trigger.
The standard KISS Systems do not stop out intra day at the STS? Can you explain some options and strategies that I may consider?
Yes at this moment (this may change in the future) the standard KISS Systems only close out/stop out of a long trade if price closes below the STS. Here’s a couple options that I employ:
1. One option is to simply wait for the closing price confirmation like the tables currently do.
2. A strategy that I have employed is to set a GTC stop at the STS stop price, and if that stop loss ends up getting hit and the price closes below it to officially close out the system trade, great, it worked out. If however price stops me out intra day by going below the STS but manages to close back above the STS, I may consider simply re-entering the trade again. I know that some subscribers employ this method. To make this decision I’ll look at various time frames and charts as well.
What do I do if I miss a system trade or wish to buy into a stock that has already been long via the KISS system for a while?
There’s no easy answer here, but here’s some things I consider: First off how long has the system been long, and how many STS stops have been generated in the trend at hand? If the system only recently went long and has maybe 1 or 2 STS stops, then there could be plenty of meat on the bone if the trend continues. If the system has been in the trade for a long time and has generated 12 or 20 STS stops, then perhaps the trend is getting longer in the tooth. Again there’s no easy one answer here and you simply have to use our subjective analysis to determine if entering the trade makes sense for you or not.
Price % Away STS: This is another filter and method that I use at times to either wait on entering a trade if the system takes a long but price has a large % distance above the current STS. For example, let’s say the system takes a new long entry, however the price was quite extended and you see that price is 18% above the most recent STS. That’s pretty far away and one could try and wait for the price to pull back and get closer to the STS.
Also, the Price % Away from the STS can be used to look for open long systems where price is close to the current STS, such as 1 or 2% away. I always suggest using other analysis to support your decision, however in such cases if wrong your stop is close, and that’s a big part of successful trading, keeping losses small.
Also, another strategy one can employ either as a filter for waiting to enter a new system trade, or to go long a stock that the system has already been long in.
High Performance KISS Versions Q&A
What is the difference between the standard KISS systems and the high performance versions?
The standard versions of the KISS systems power all the other baskets of stocks and ETF’s (well over 700 symbols). The same universal internal KISS settings are used for all of these stocks and ETF’s, and all of these are based on daily charts.
The high performance versions of the KISS system is used on the groups of symbols that are located in the High Performance basket. The KISS systems in this section is not limited to daily time frames, but is run on multiple time frames depending on the instrument, the smallest time frame being 30 min charts, and also 78 min (5 bars in a day), 130 min (3 bars in a day), and 195 min (½ day) charts. The smaller time frames allow the system to capture more trading opportunities because of the higher turnover, and many times reduce the drawdowns even more.
Additionally, the same universal settings are not being used across these instruments like the baskets. The high performance systems are backtested to get higher performance over the default settings.
The high performance KISS versions are backtested, isn’t that a bad thing because of curve fitting?
Backtesting has a very bad reputation and for good reason: There are 1000’s and 1000’s of systems, and many are backtested to the nth degree and look great on past hypothetical trades, but fall apart in a real world scenario with live trades going forward. The problem I’ve seen is that these developers/traders run very wide backtests across many variables that produce strong curve fitting that falls apart. In my experience backtesting is fine and is necessary as long as it is done intelligently and targeted, vs broad based wide tests on many variables. One also has to keep an eye on the profit curve of the system going forward and when the profit curve begins to flatten out or trend day, a new backtest may be required.
First off, our very popular 21 mean-reversion systems were all derived initially from backtesting. Think about it, mean reversion-systems are derived through identifying oversold and overbought conditions in the market that are too far stretched from their mean, where price is likely to have a ‘mean-reversion’ move back to the ‘mean’. An example would be: the SPY ETF is above its 200 day MA and has had 10 consecutive down days in a row, and per a backtest you find that over 30 years when this condition occurred, 92% of the time in the past price bounced/rebounded from such conditions. You have to run a backtest initially to find those conditions i.e. you don’t know if 8 days or 10 days or 12 days is enough until you run a test. That’s an example of where a backtest is needed in order to gather that data needed.
The mean-reversion systems were all derived through backtesting, and have worked for many years, with some minor tweaks along the way on a few of them, most have not been touched for years, therefore my real world observations have been that if backtests are done correctly they can produce working systems for a long time.
Again, nothing is guaranteed, and per the CTFC and FTC disclaimers that must be shown:
Trading performance displayed herein is hypothetical. The following Commodity Futures Trading Commission (CFTC) disclaimer should be noted. Hypothetical performance results have many inherent limitations, some of which are described below. No representation is being made that any account will or is likely to achieve profits or losses similar to those shown. In fact, there are frequently sharp differences between hypothetical performance results and the actual results subsequently achieved by any particular trading program. One of the limitations of hypothetical performance trading results is that they are generally prepared with the benefit of hindsight. In addition, hypothetical trading does not involve financial risk, and no hypothetical trading record can completely account for the impact of financial risk in actual trading. For example, the ability to withstand losses or to adhere to a particular trading program in spite of trading losses are material points which can also adversely affect actual trading results. There are numerous other factors related to the markets in general or to the implementation of any specific trading program which cannot be fully accounted for in the preparation of hypothetical performance results and all of which can adversely affect actual trading results.
Because the high performance systems are derived through backtesting and since we don’t have a confirmed trade history of these results on the website, we are not charging for these versions, we are including them with the standard subscription fee. That may change down the road after the systems validate themselves.
You stated above that the high performance KISS systems do not wait for a close confirmation, they can stop out intra day at the STS stops?
Yes, the high performance versions do not use a closing price confirmation. This also makes setting GTC stop losses easy, you simply set a GTC stop loss and each time you receive a notification of a new STS stop, you go into your account and adjust your stop price with the system, rinse and repeat until you are finally stopped out.
Very mechanical and methodical.
What is the trade performance like compared to traditional buy and hold, winning percentages, etc?
We plan to add trade statistics to the High Performance versions where you will be able to see the trade history and various statistics.
IMPORTANT CONSIDERATIONS when considering the high performance versions, especially the smaller time frames 30 min, 78 min:
One thing I’ve observed and something I need to point out: Is that the small time frames (while they produce higher total gains and lower draw downs) tend to have a lower winning percentage over higher time frames. For example a 130 min or 195 min system may have 60% to nearly 80% winning trades, whereas a 78 min or 30 min for some ETF’s may drop down to 60%, 50% or in the mid 40% winning percent trade history. The profit factor also drops. However, what you get in place of that is higher total gains and usually smaller drawdowns.
Considerations while trading these: When a system has 40 to 50% winning trades, you have to be willing to accept that there can and will be times when there are 2, 3, 4 losing trades in a row. That can be difficult to deal with psychologically when first trading a system if your first set of trades happens to be a few losing trades in a row. If this happens to a new individual first trying these systems, it may cause them to unfairly conclude that the system is bad , when in reality that’s just a normal part of statistics from a system that has 50% winning trades. You MUST realize these things if you decide to follow these systems!
If you cannot handle a system that loses 50% of its trades, then consider a higher time frame, such as 130 min, 195 min, even though the total returns will be lower, the winning percentage will generally be much higher with much less trade activity.
How are you going to charge for the KISS systems, and is there a free version?
I’m not listing prices here as we have not yet decided on that, however here’s how it will be structured.
The KISS systems tables have been on the website in beta for a year now, they’ve been open to everyone to use and the majority of the subscribers are actively using them, have set up favorites, and are actively receiving daily email notifications when changes to their favorites occur.
There are a series of tabs/baskets that are actively followed via the KISS systems. The BPT Basket will be free and open to everyone. We’ll include a handful of index ETF’s, and maybe a couple widely followed stocks, such as MSFT, NVDA etc.
The other baskets will come at a cost, and that cost will also include the high performance basket. Initially there will be several subscription types, such as a monthly, quarterly, and a yearly subscription - all these offer the same thing, but there’s a cost savings by paying for more time up front.
What are your plans for the KISS systems and the backtested high performance versions?
The KISS system is not static, my goal would be to add additional logic and filters over time to improve the system even more. Basically, the system is never fully finished, it’s always a work in progress that will evolve and grow. Off the top of my head, things I’d like to add are additional Elliot Wave logic, and also perhaps a scaleout or profit target component. I’d also like to add logic to detect very overbought conditions that may have the system either tighten up the STS stops, or reduce position size.
With regards to the High Performance systems, I plan to add more stocks and ETF’s over time, and I will keep an eye on the performance and profit curves and I will re-backtest or adjust settings when necessary.