BPT Weekend Newsletter Sunday March 24th, 2024 - free
Disclaimer: Intraday Chart Links will show up as daily charts unless you have an active stockcharts.com membership and are signed in, you can sign up here.
1
Technical Analysis of the markets and trading systems Week of March 24 - 29th, 2024
Table of Contents:
1. Opening Discussion, KISS systems major update soon
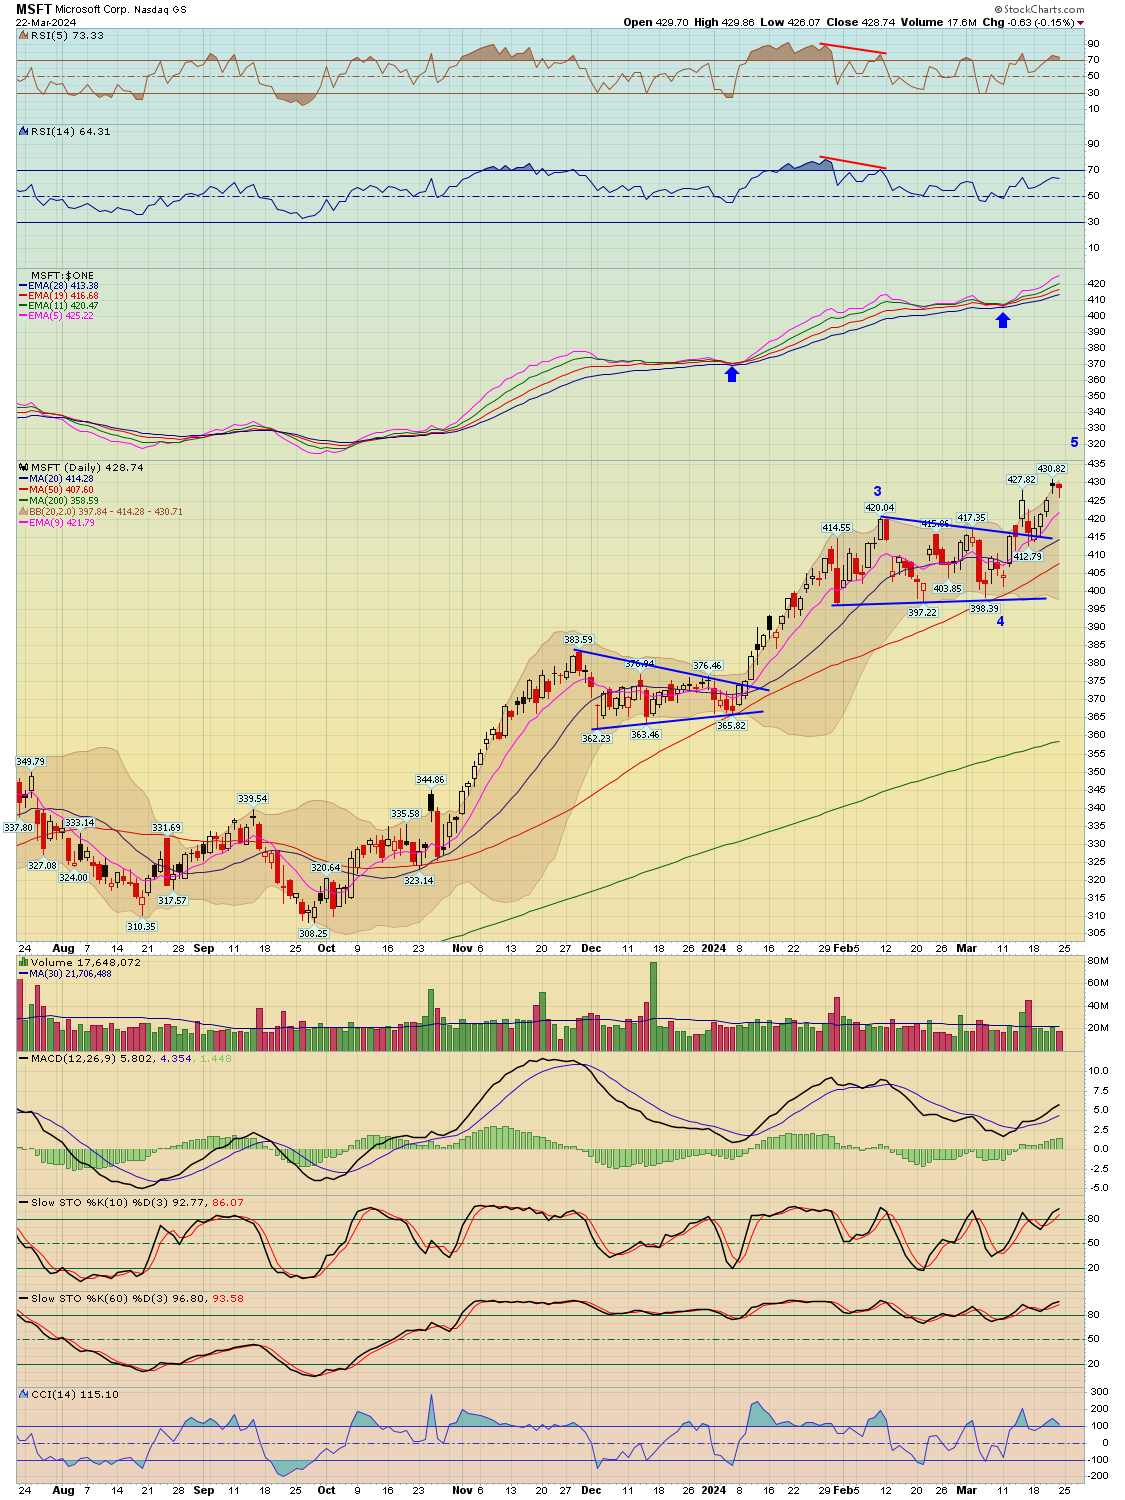
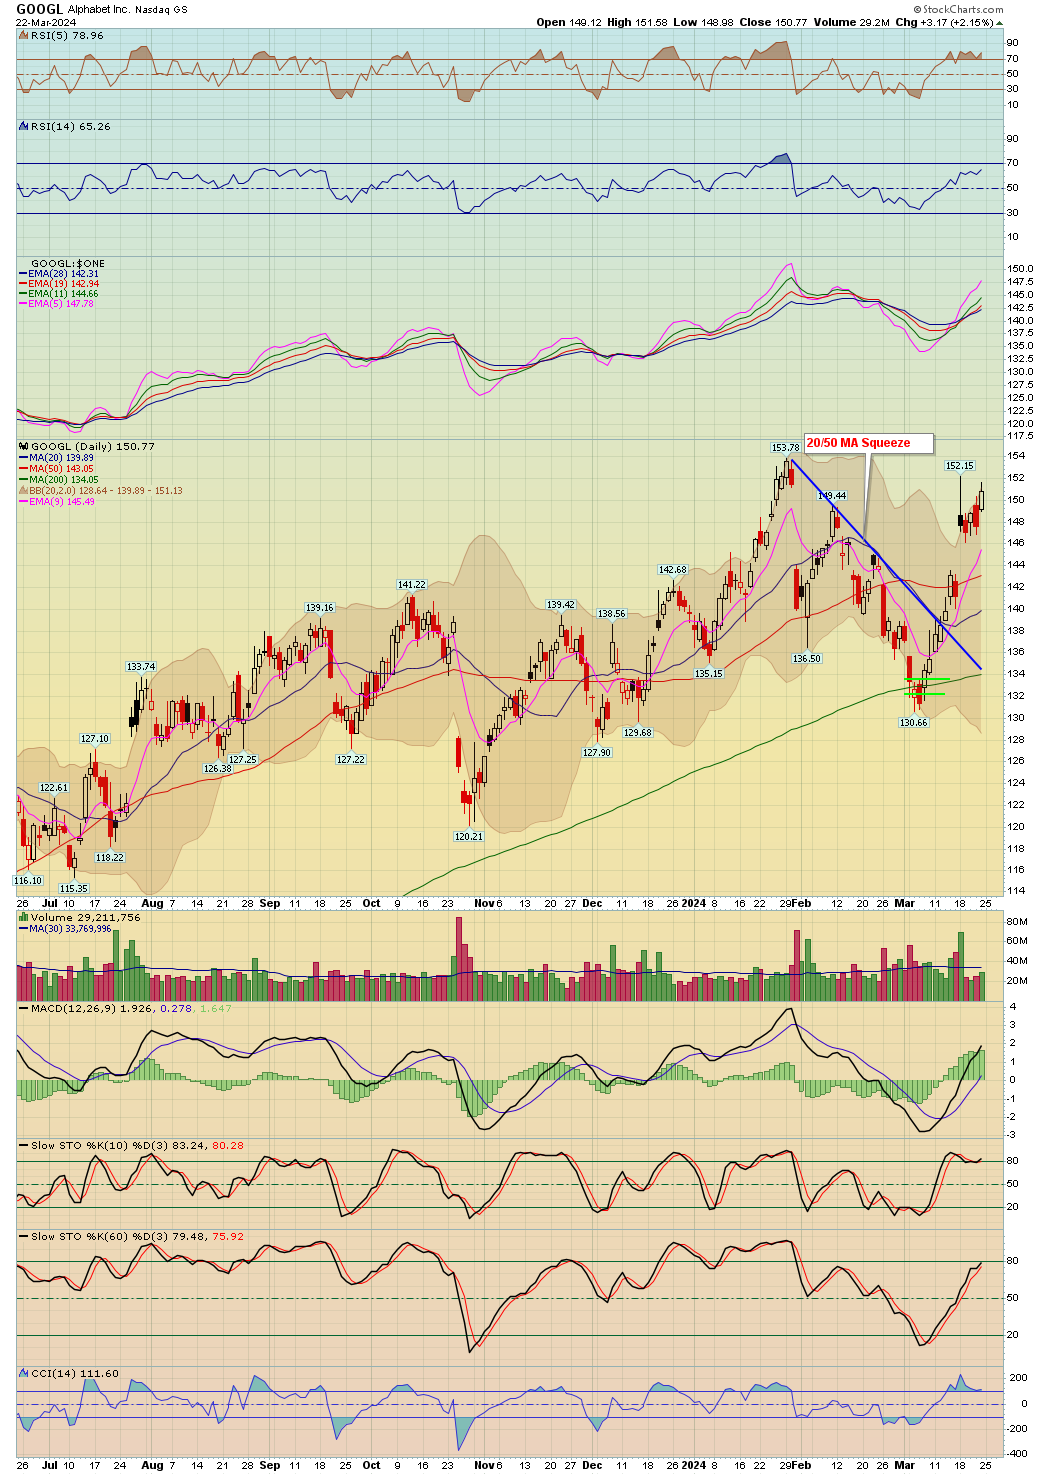
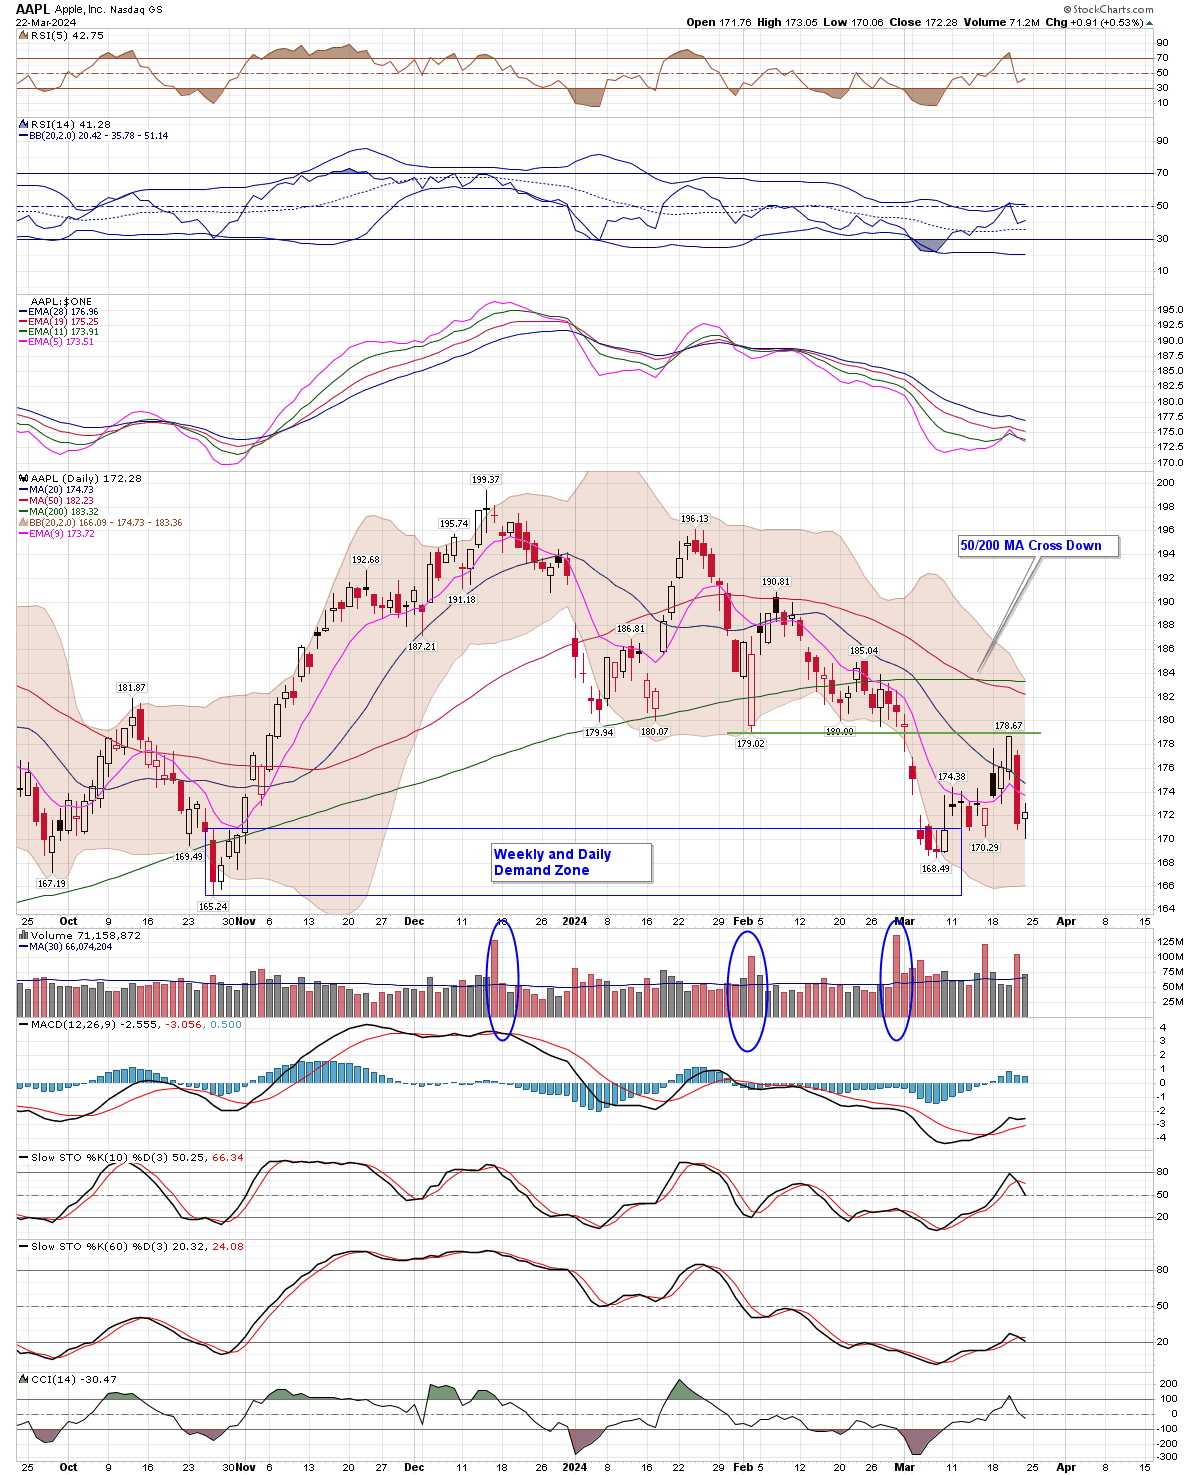
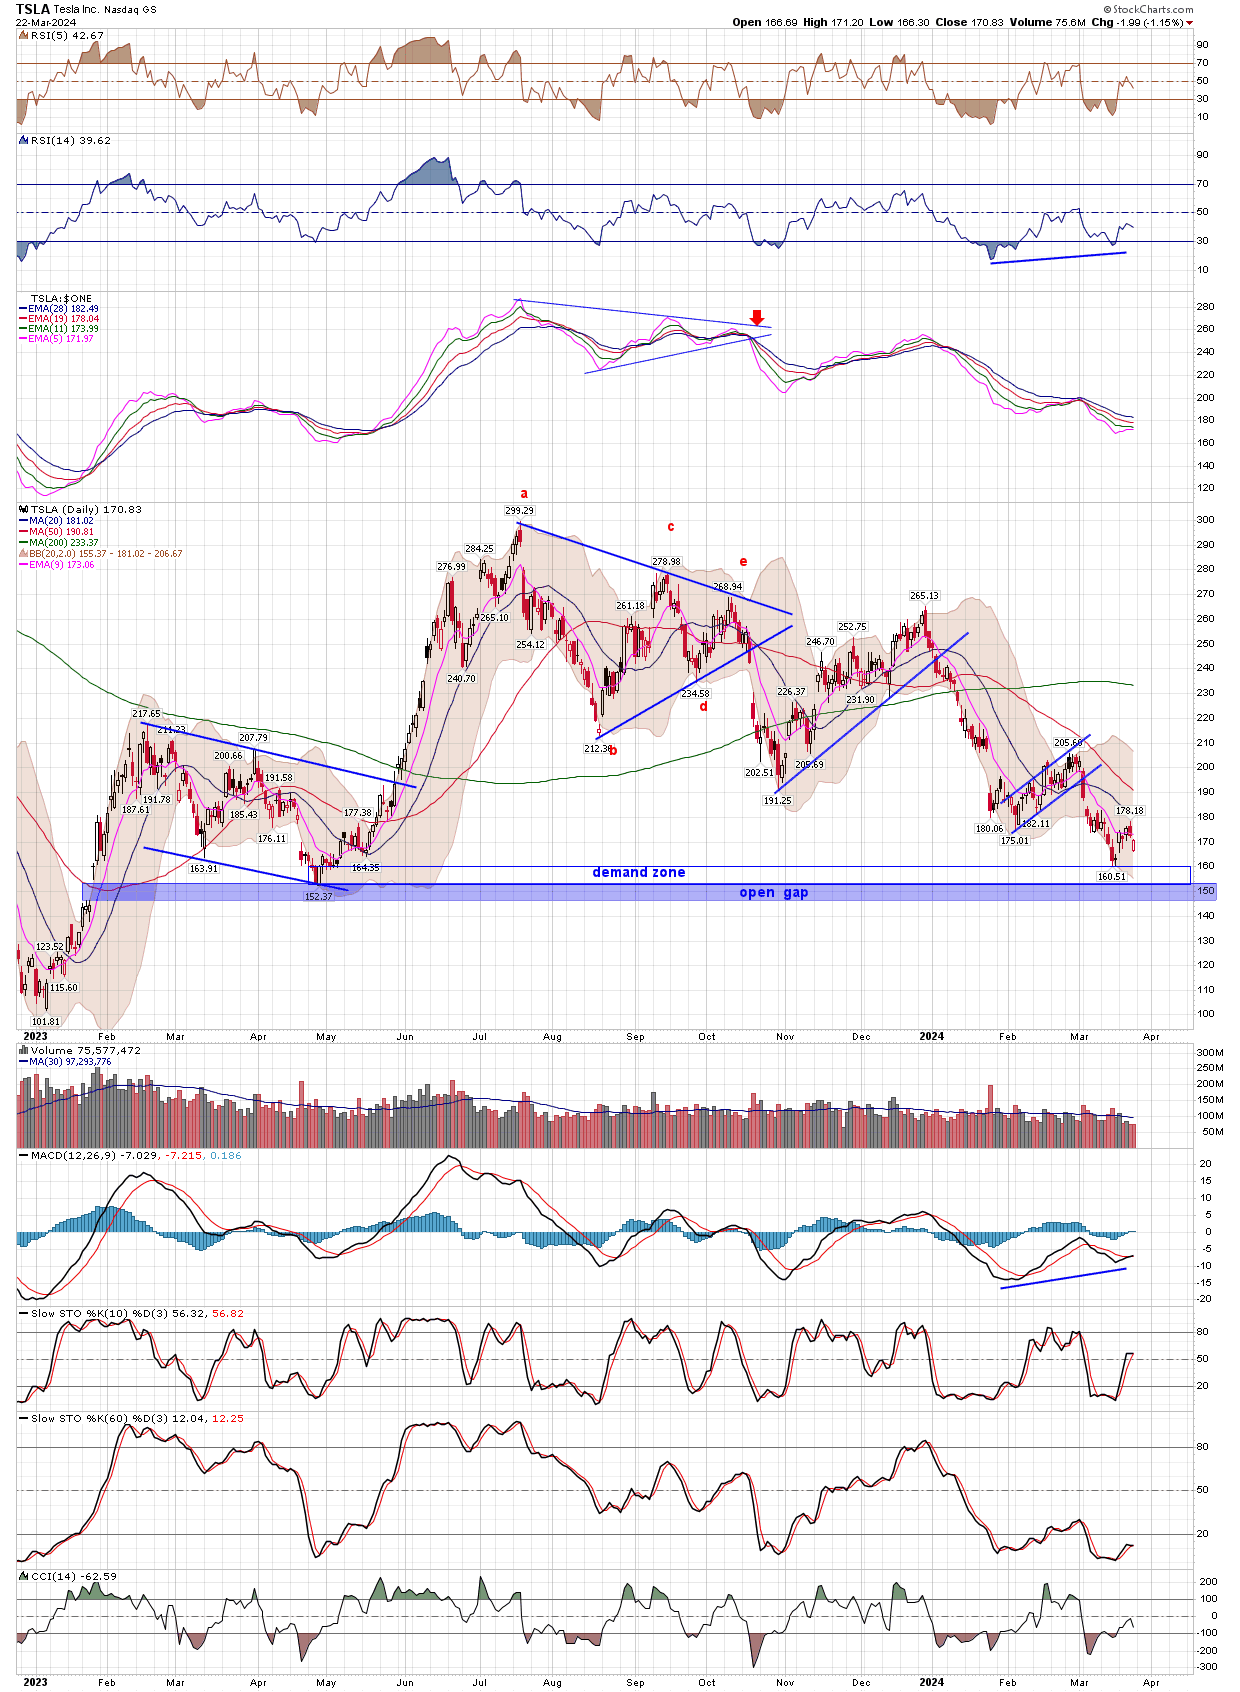
2. General Market Analysis: SPX and Other Major Indices top down fashion higher to lower time frames) and look at the major big cap tech stocks (NVDA, AAPL etc)
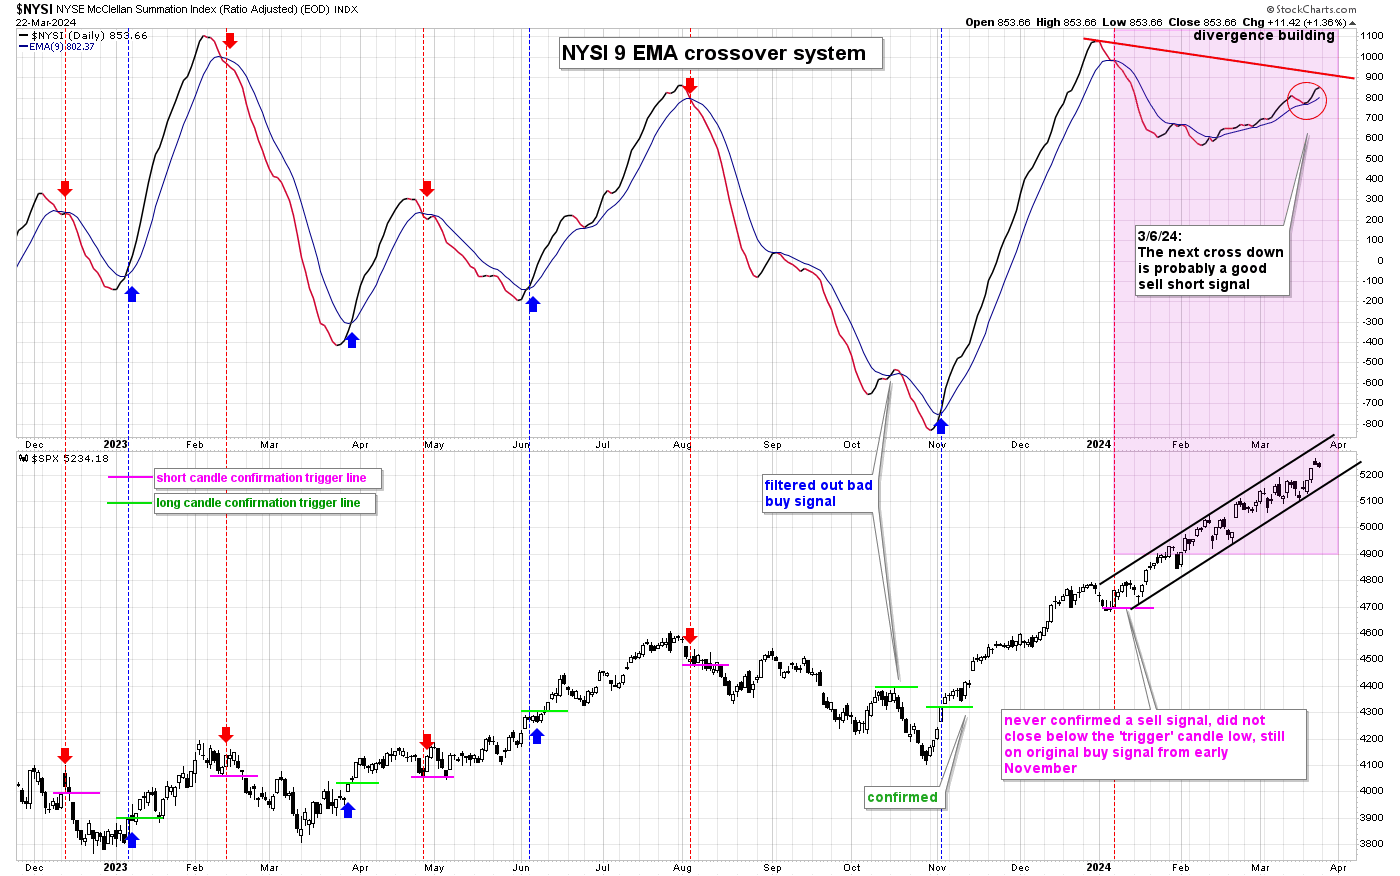
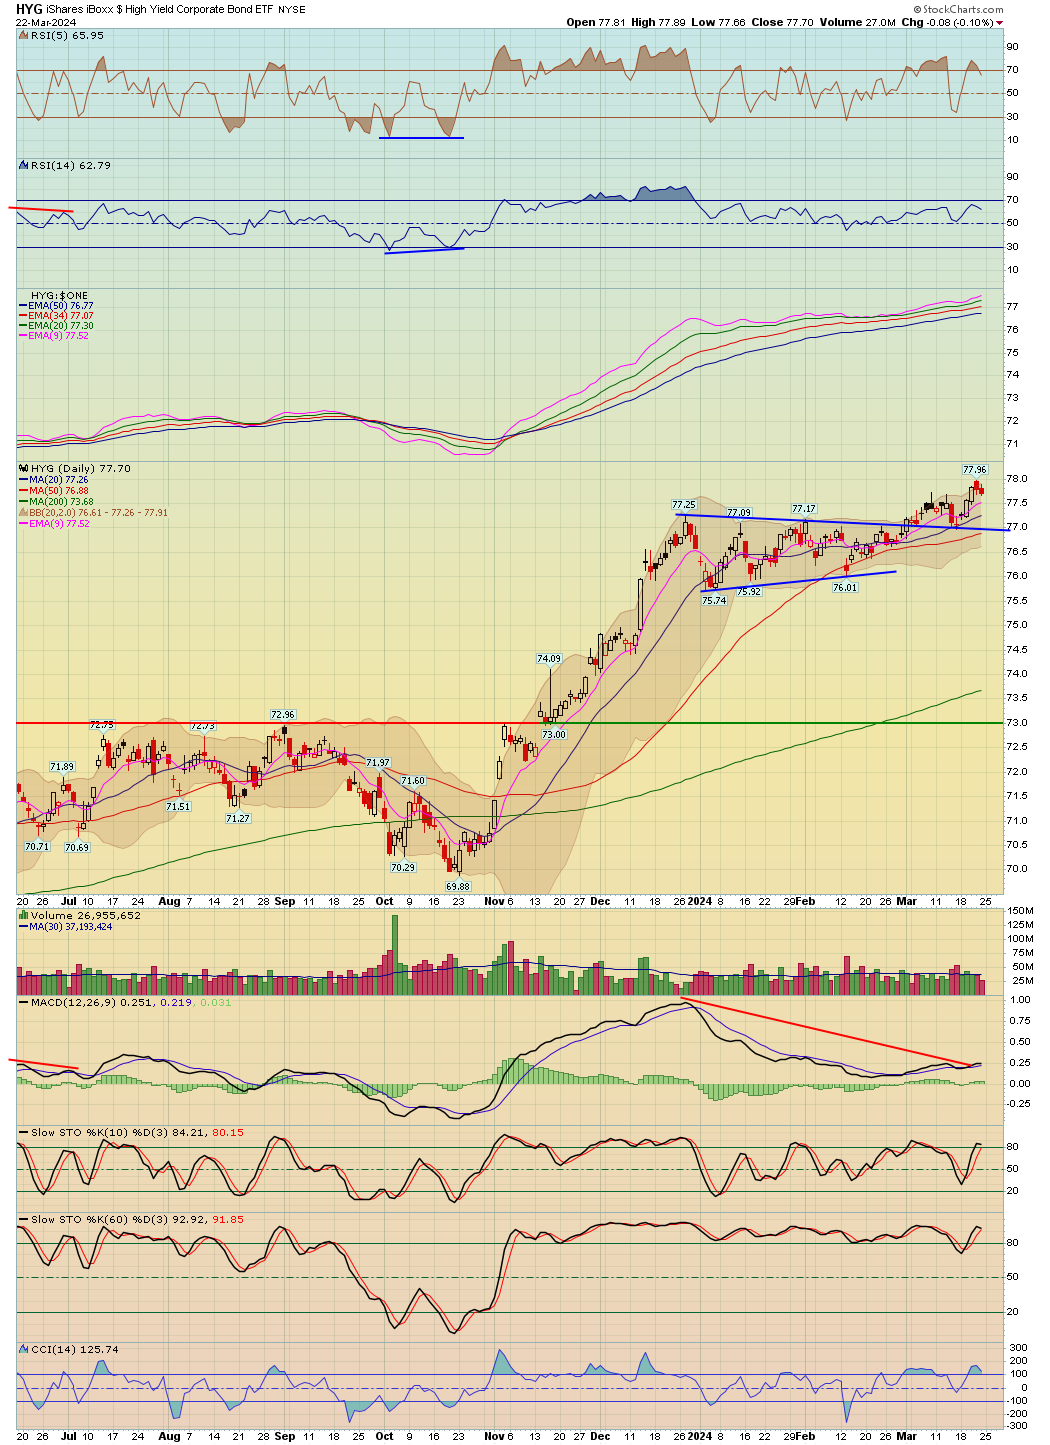
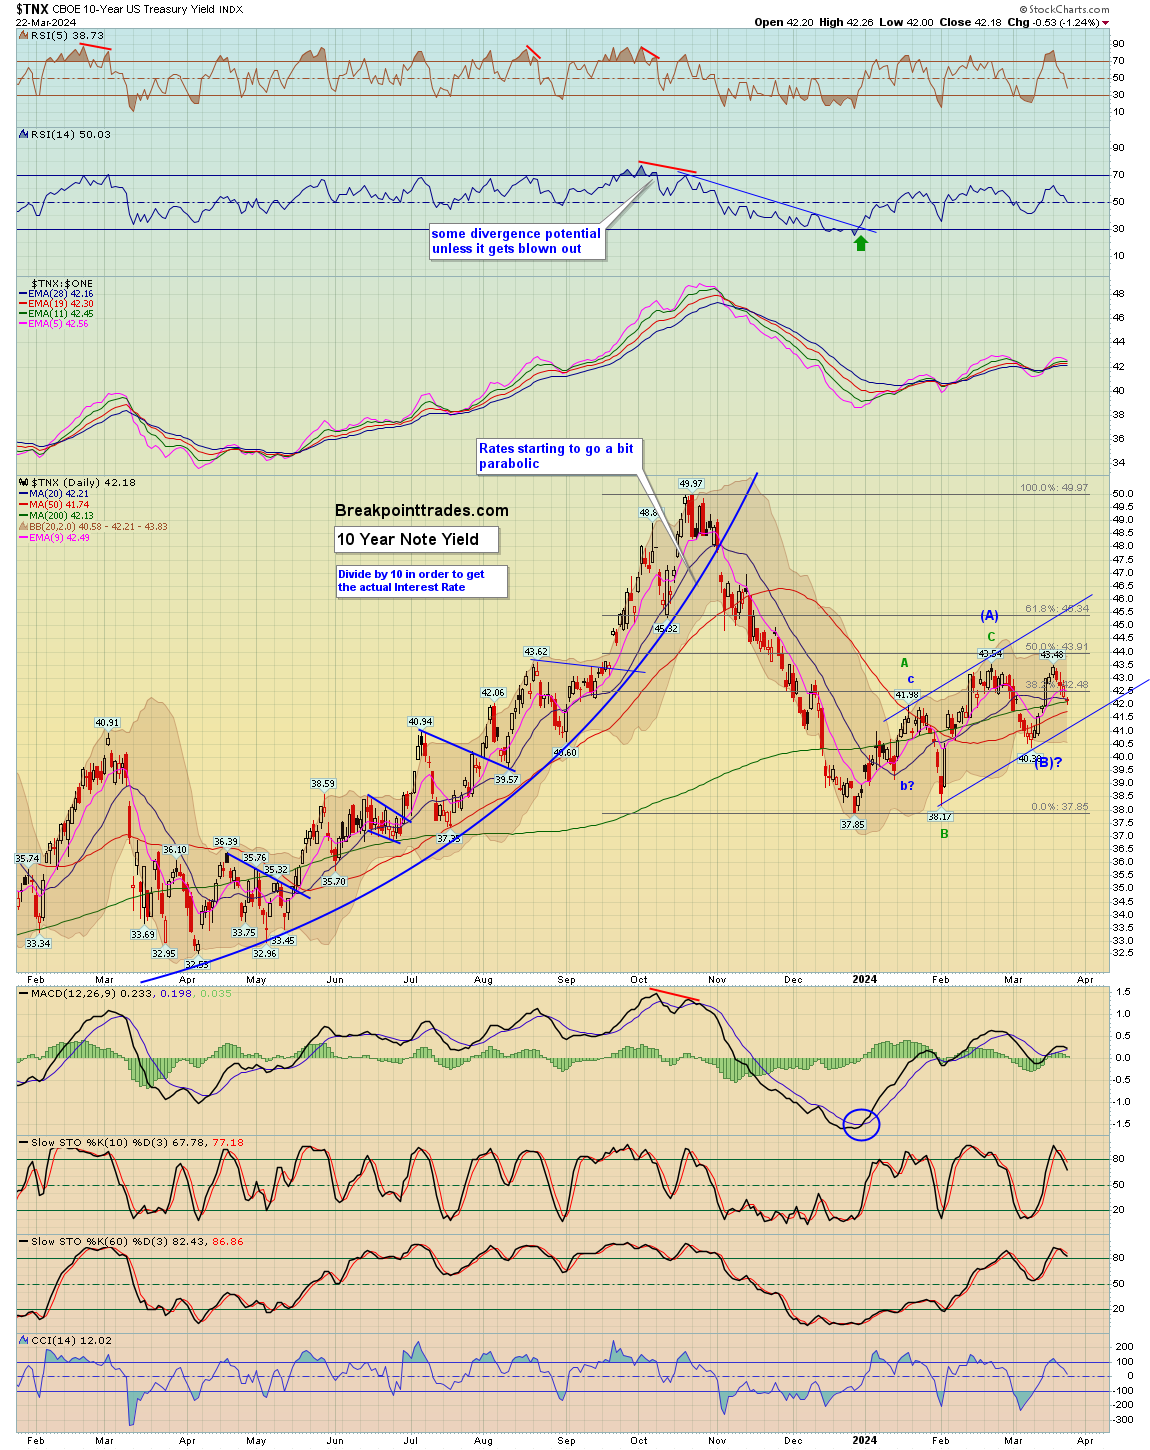
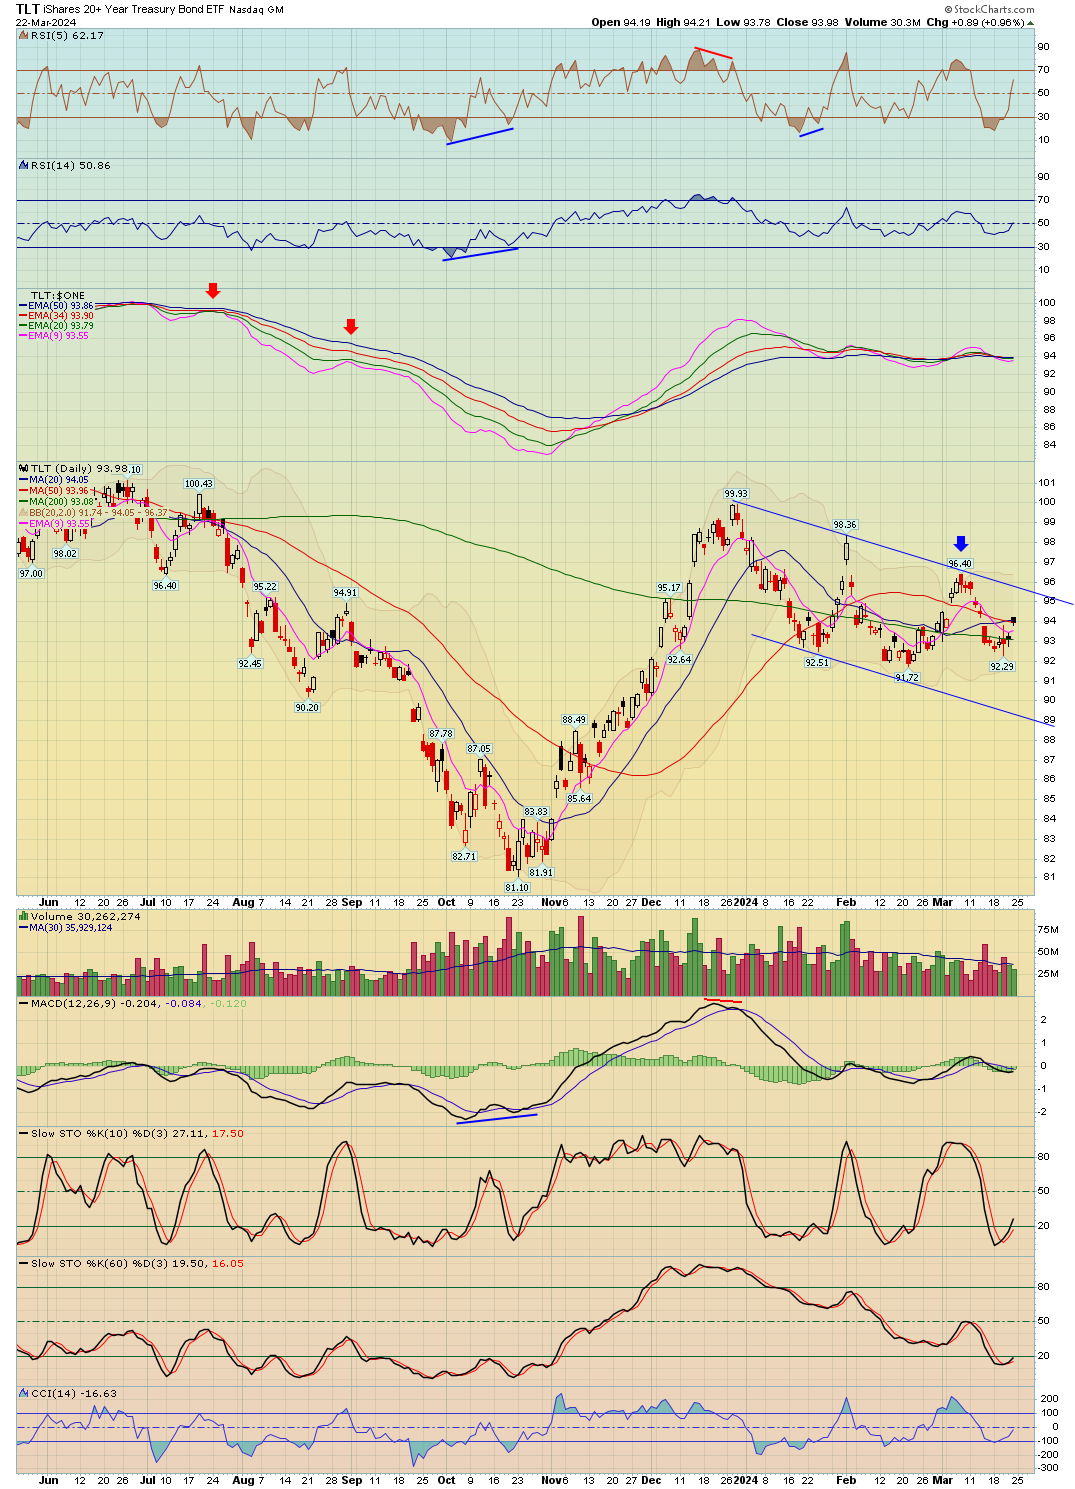
3. Custom Indicators/Systems (VIX, NYAD) and Bonds (TLT/HYG), 10-Year Yield
4. Sectors Overview
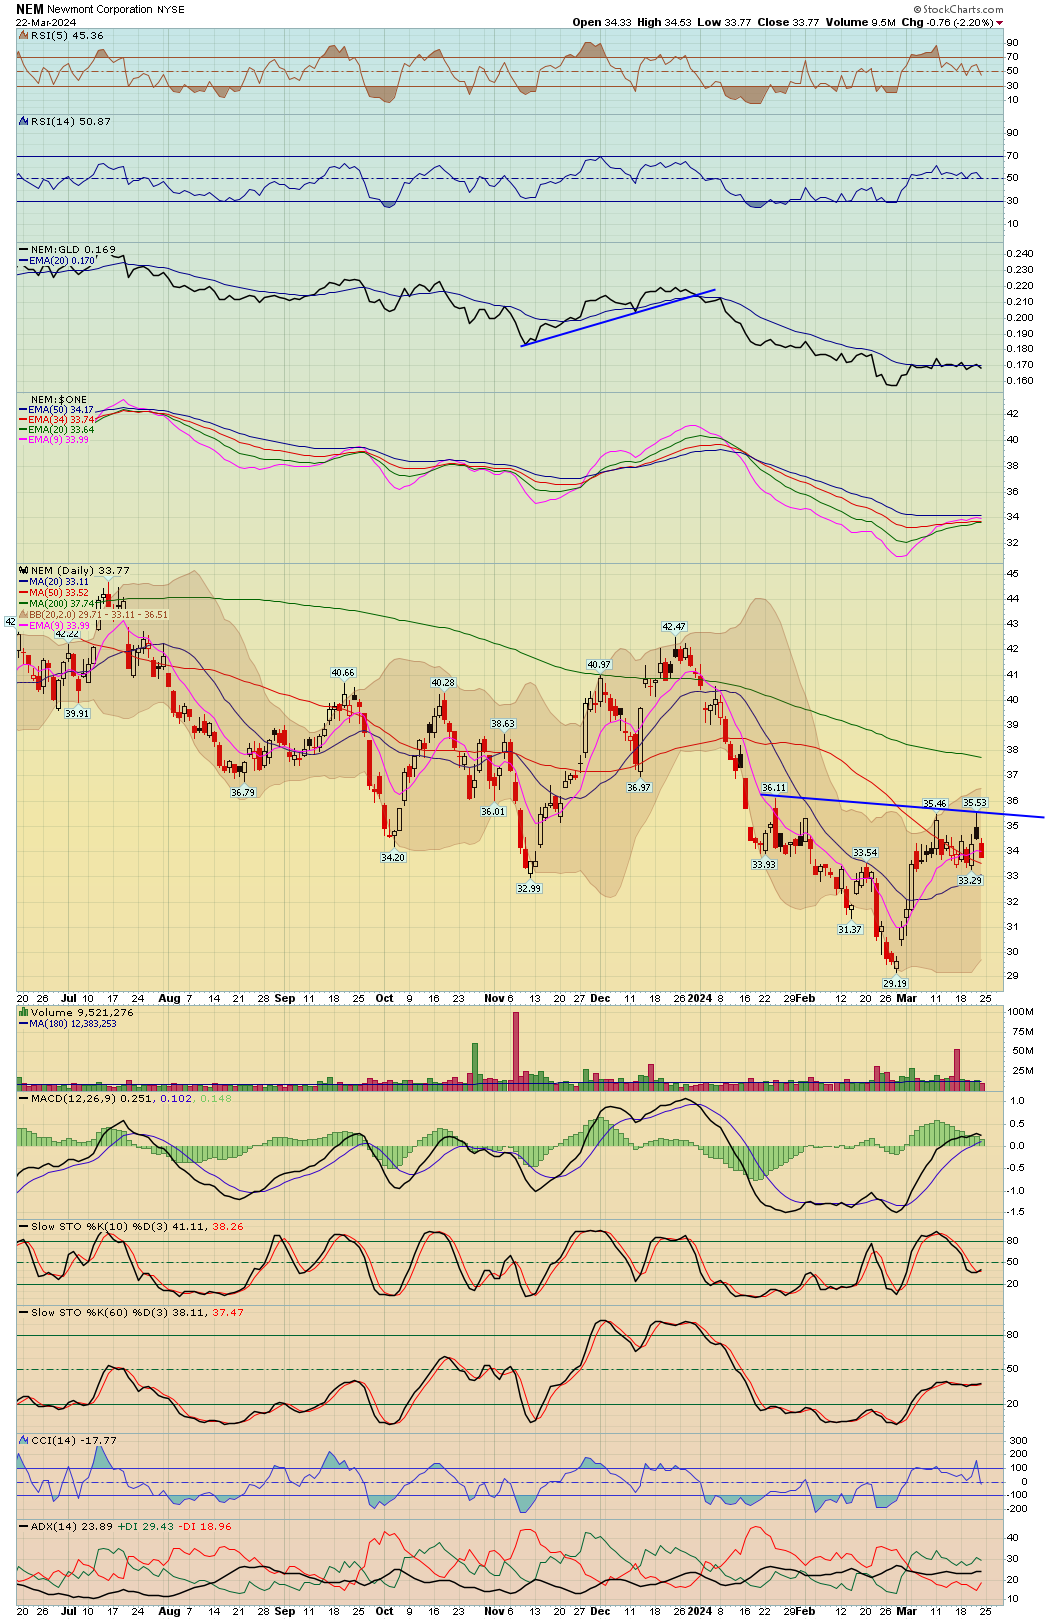
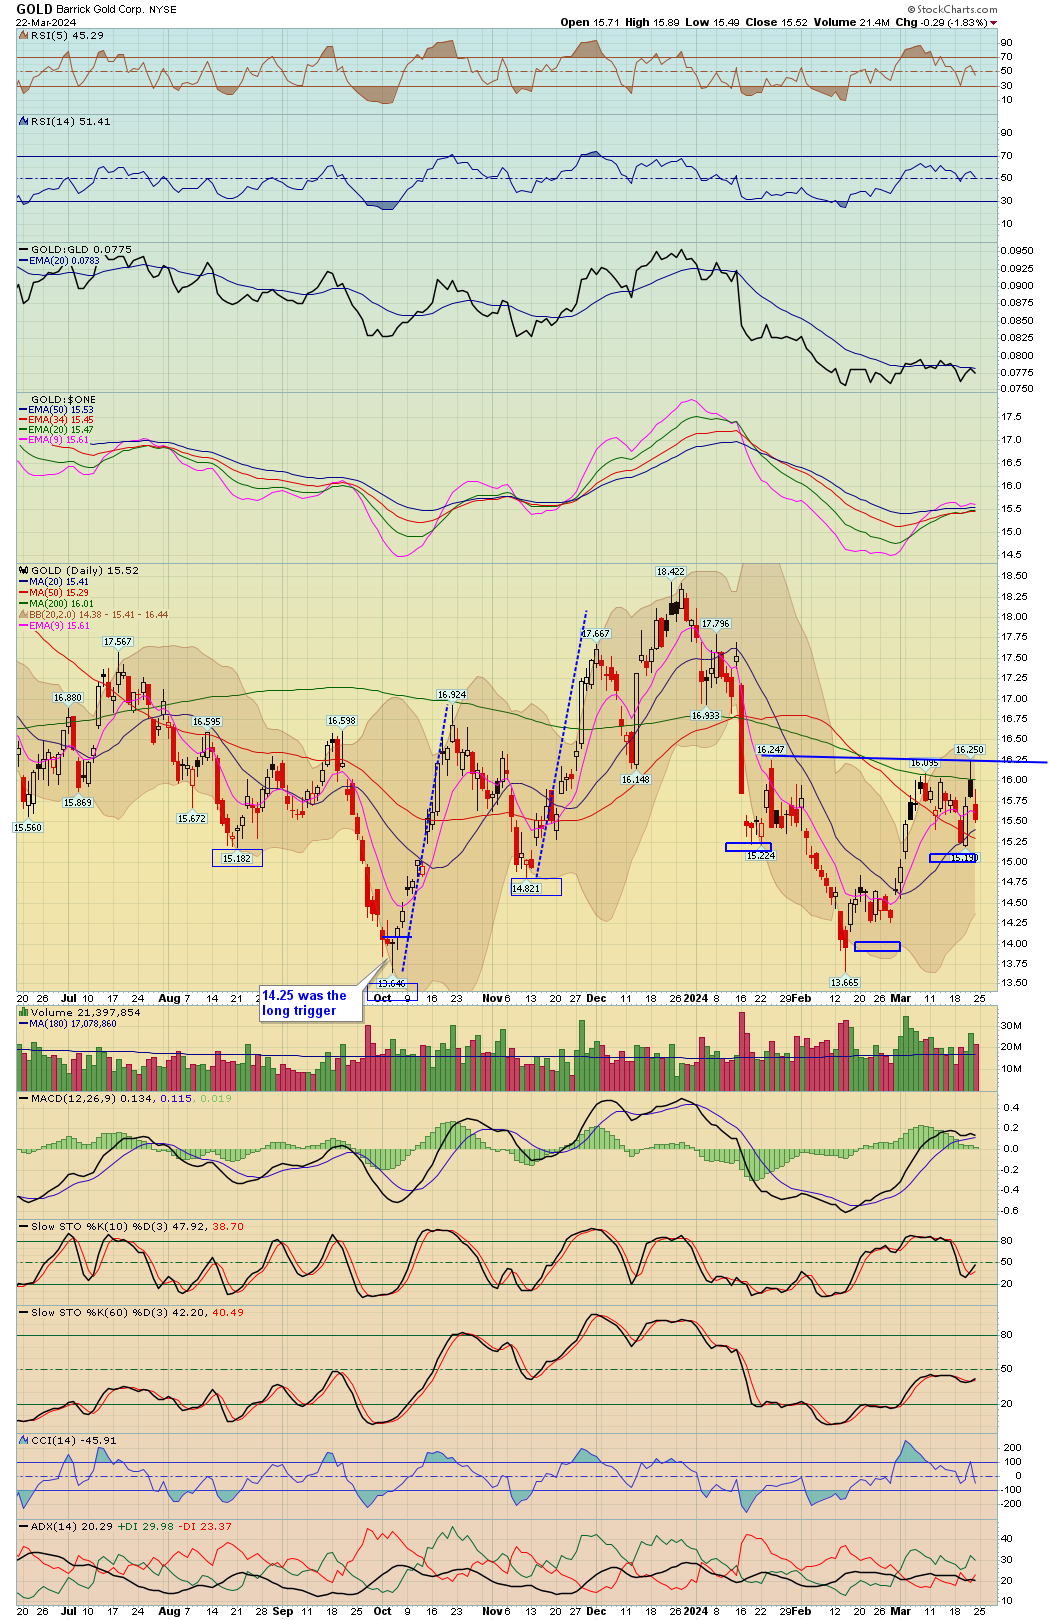
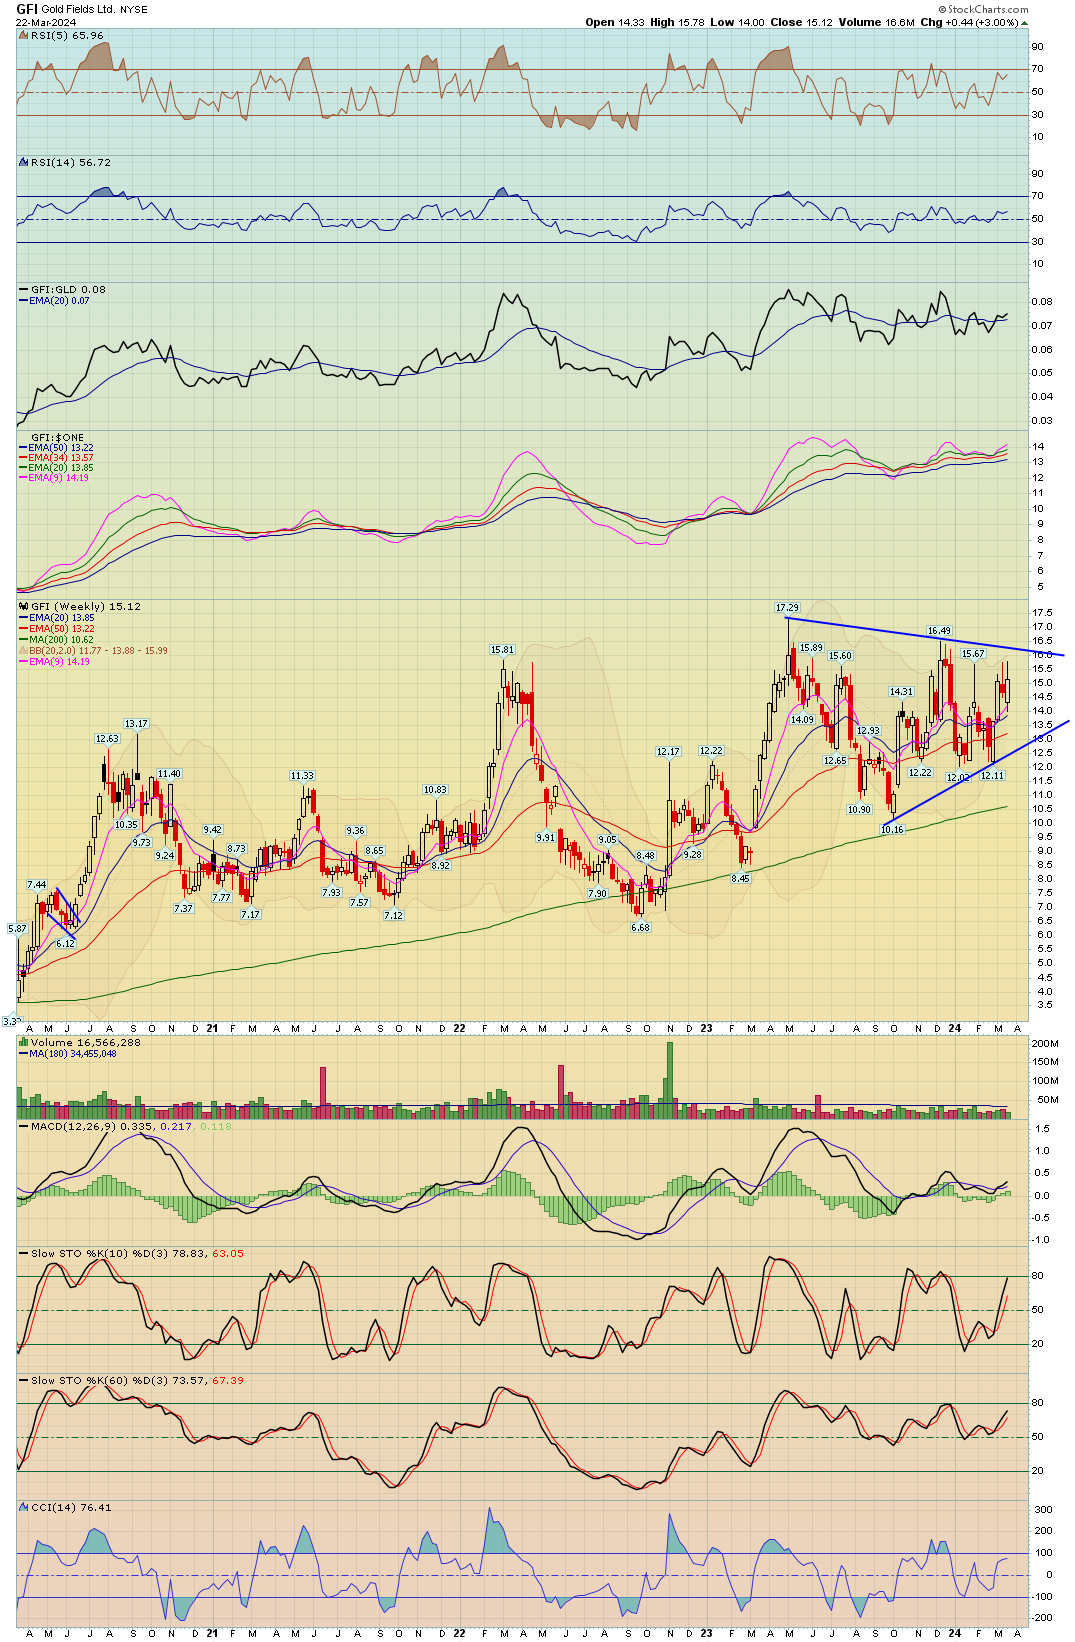
5. US Dollar, Commodities, Crypto, Precious Metals and GDX and individual mining stocks
6. Trade Ideas
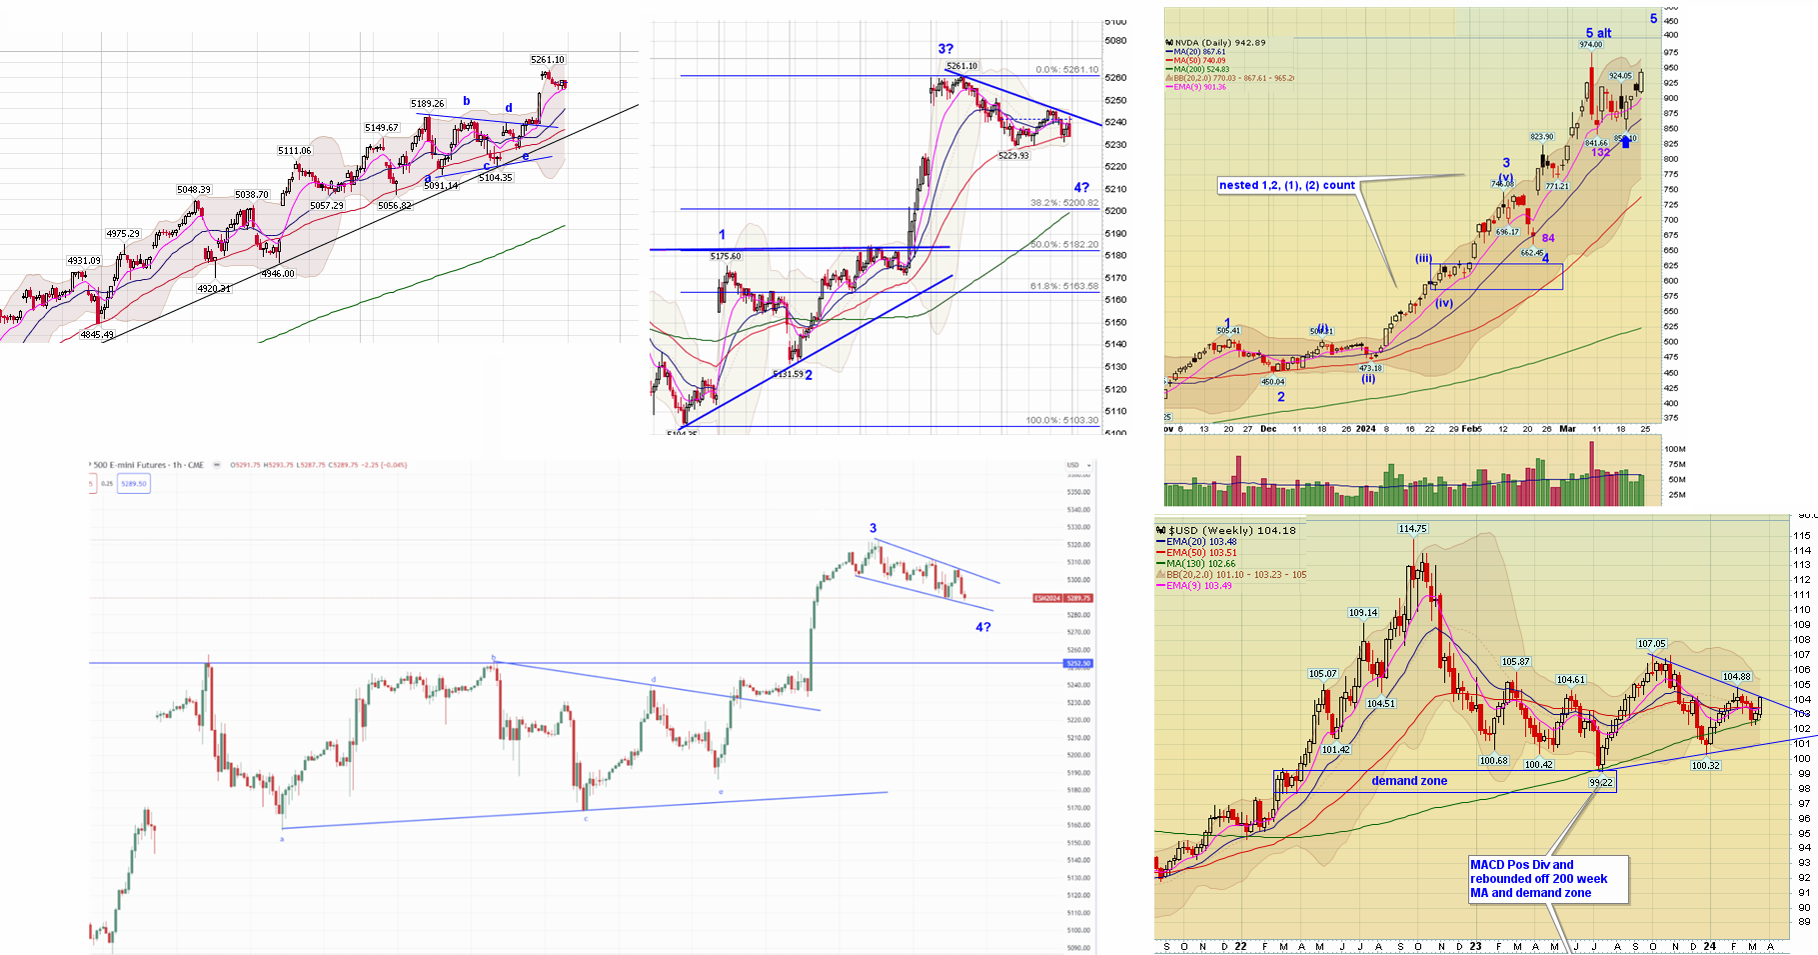
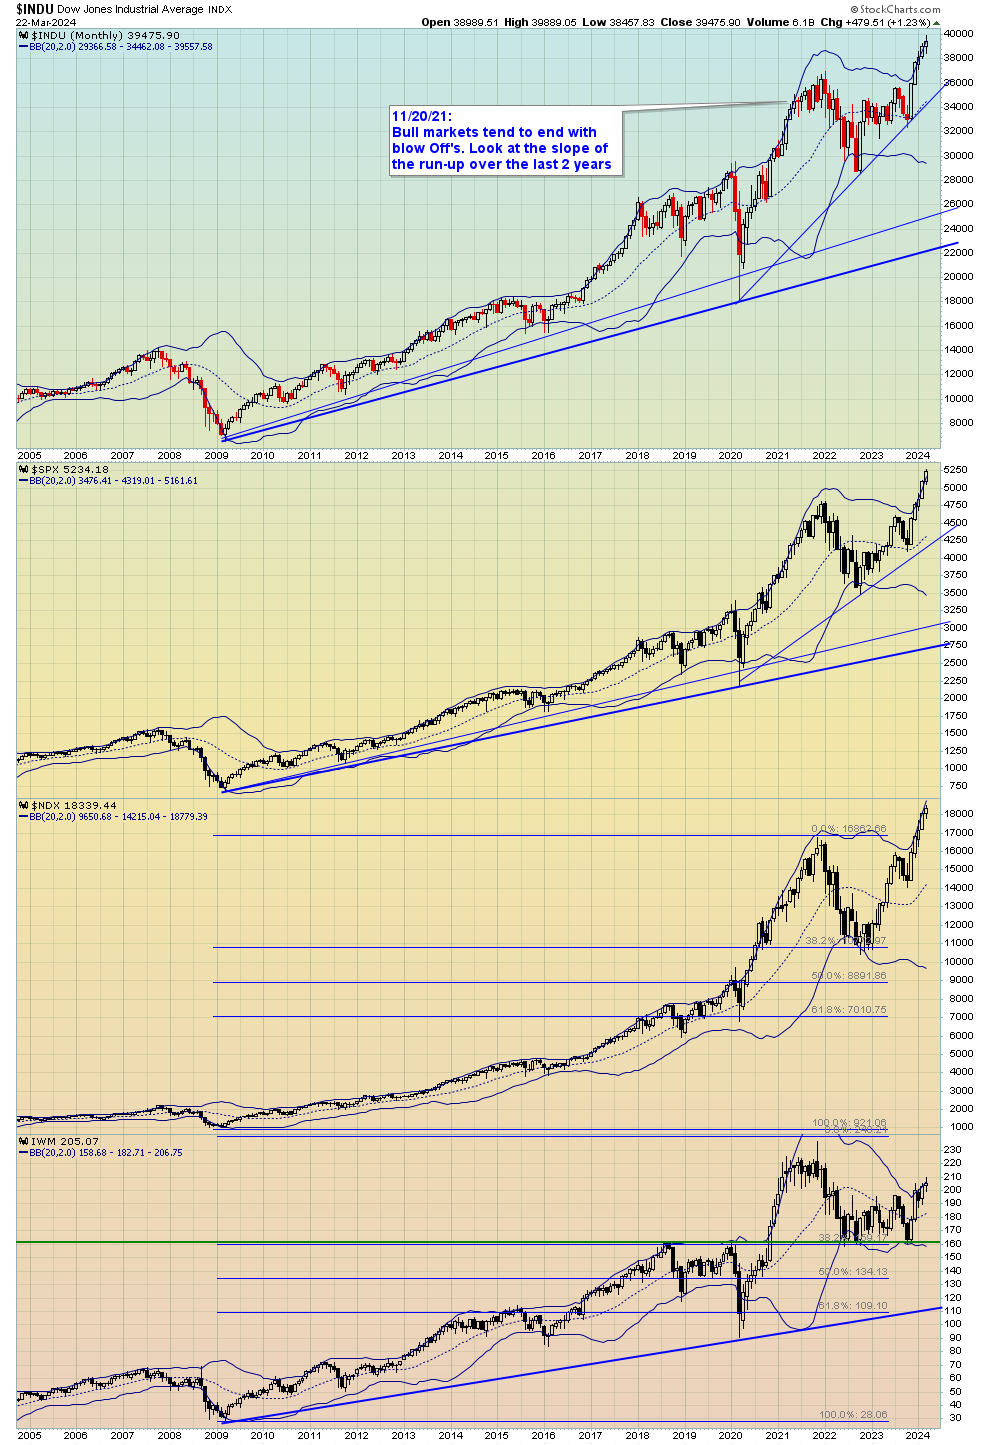
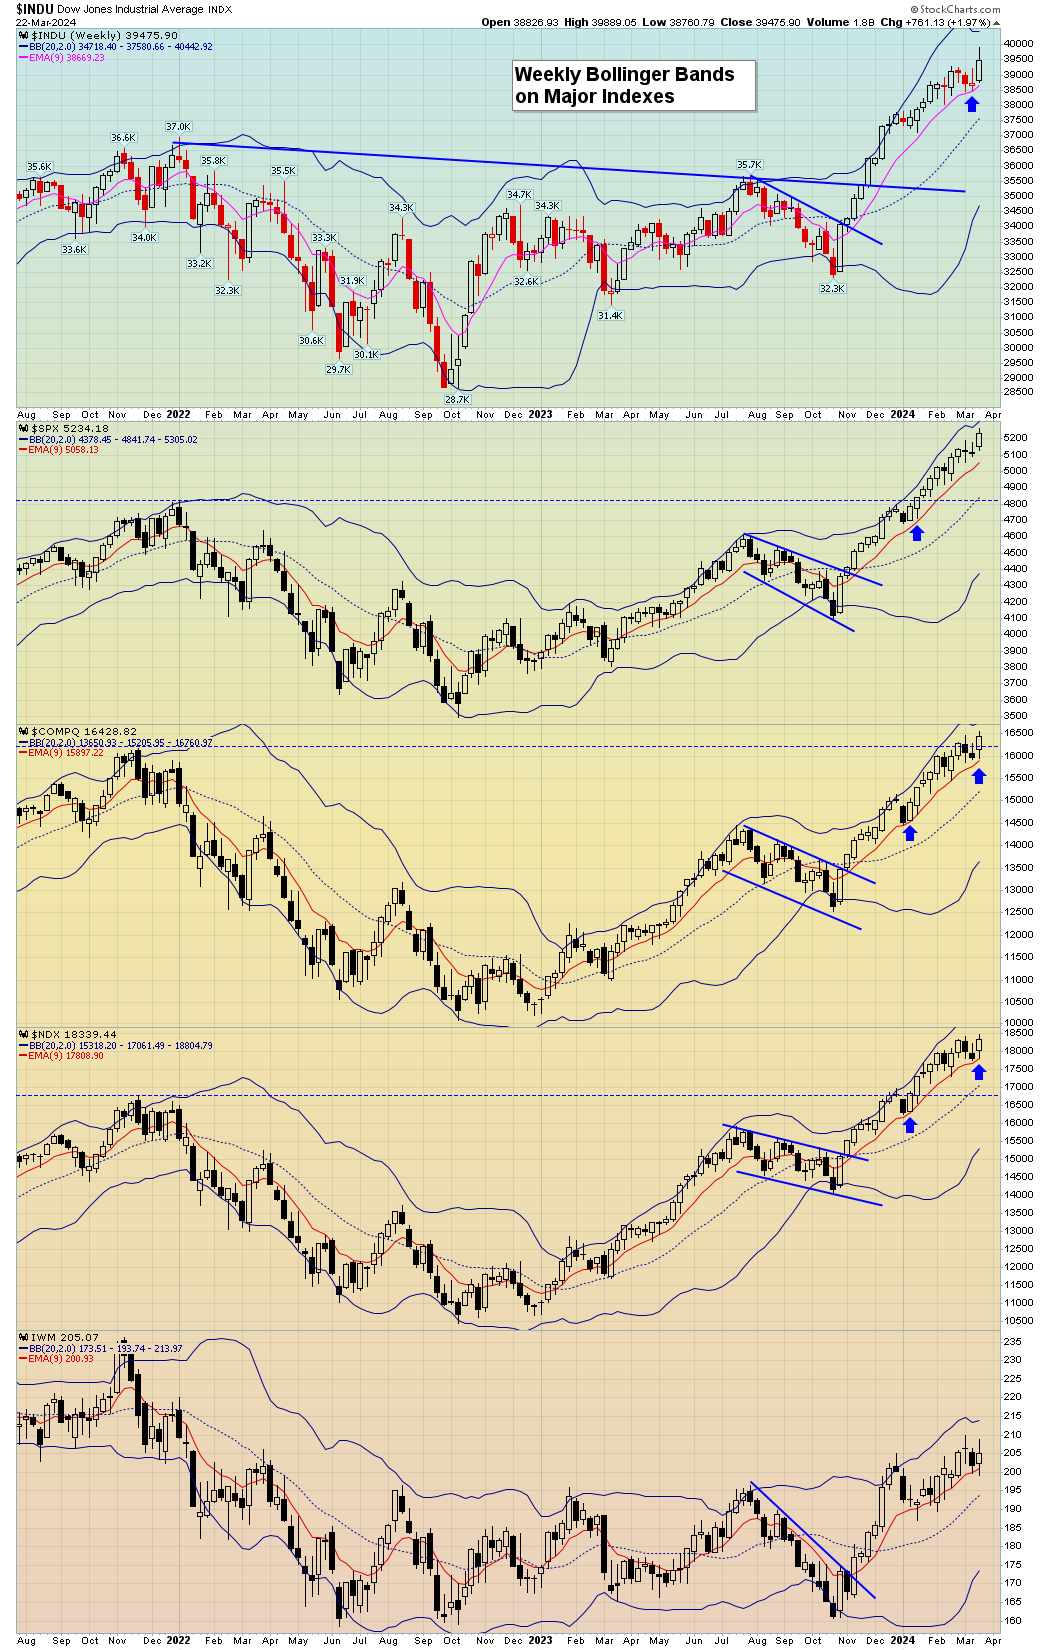
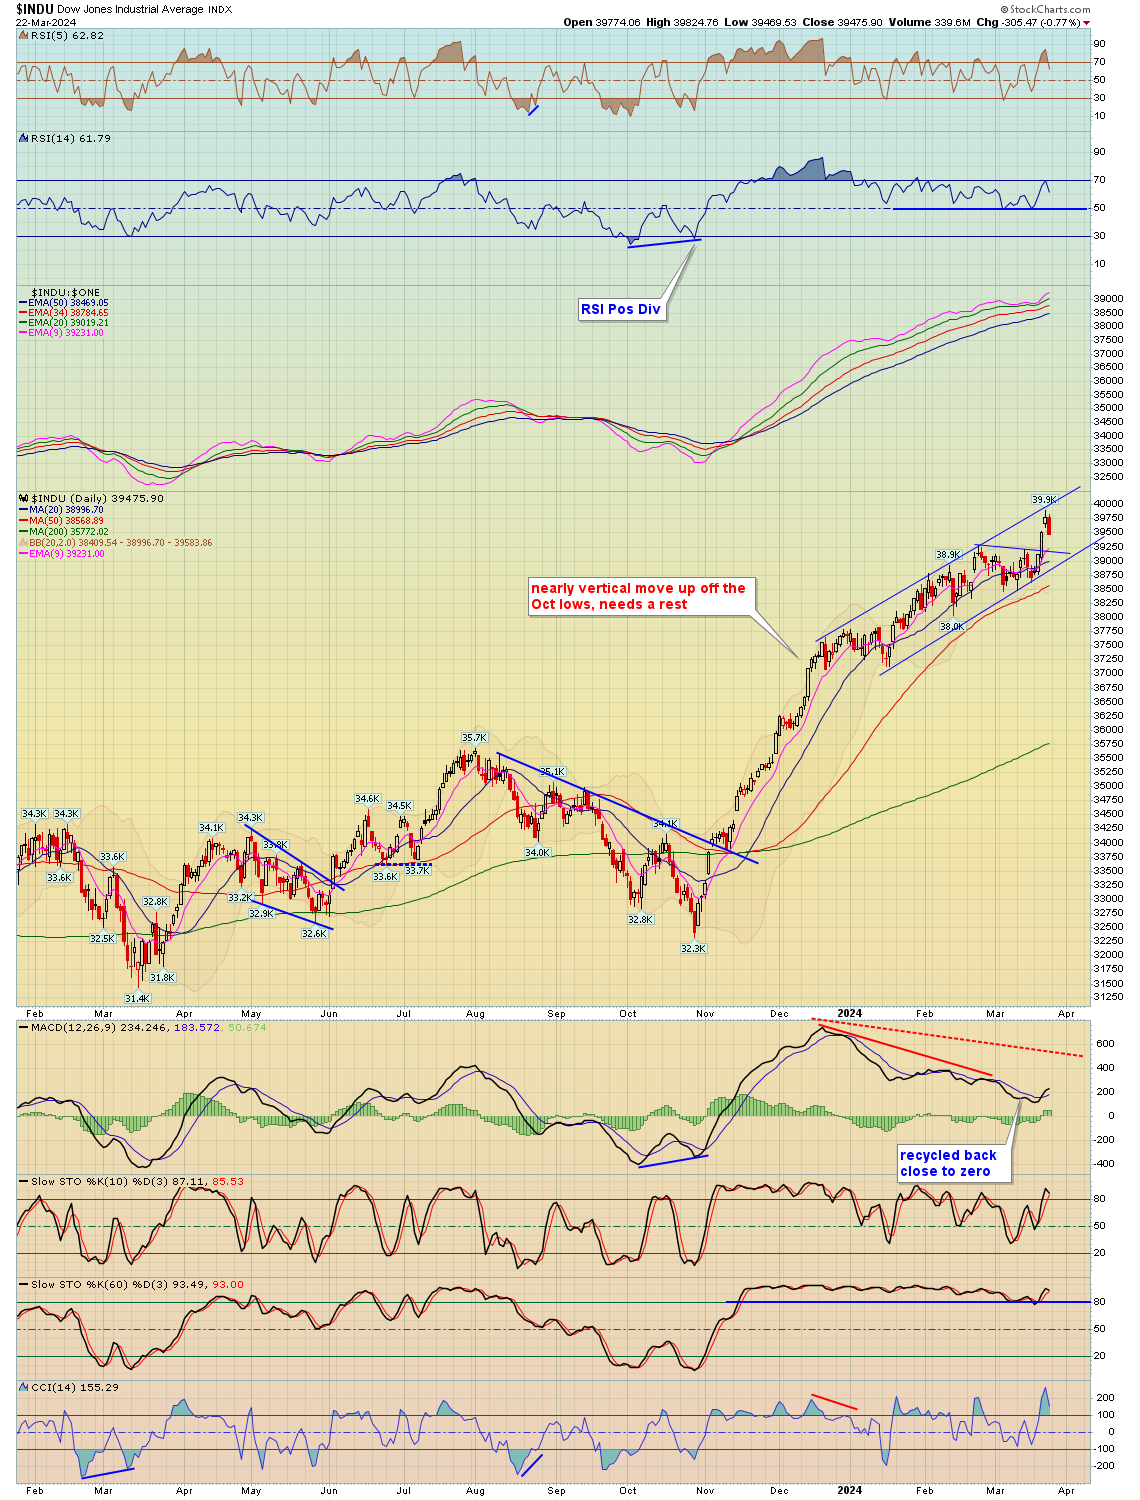
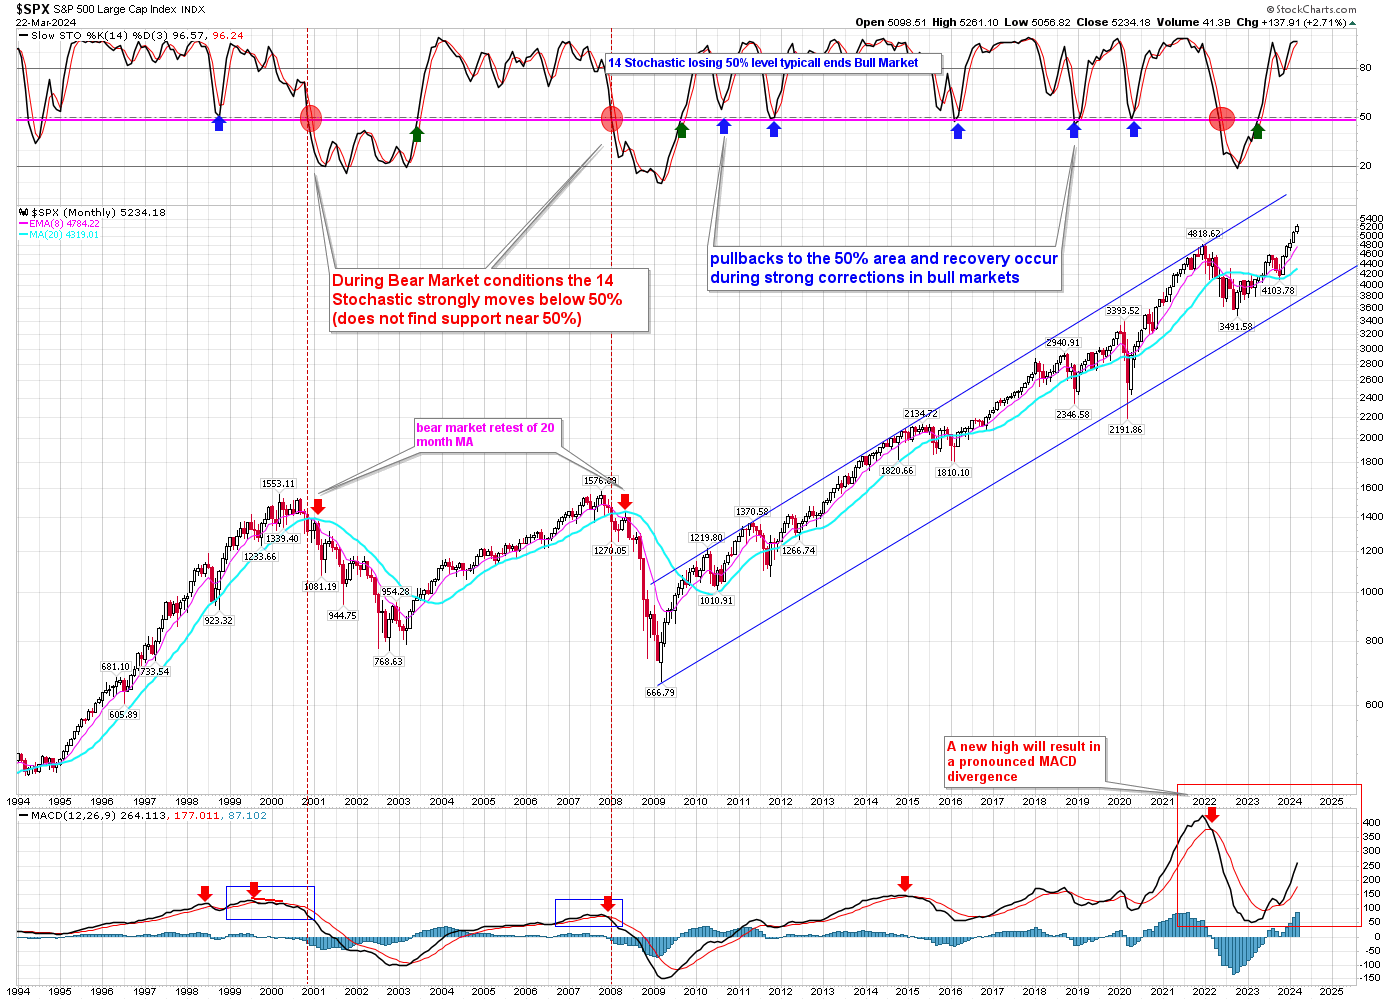
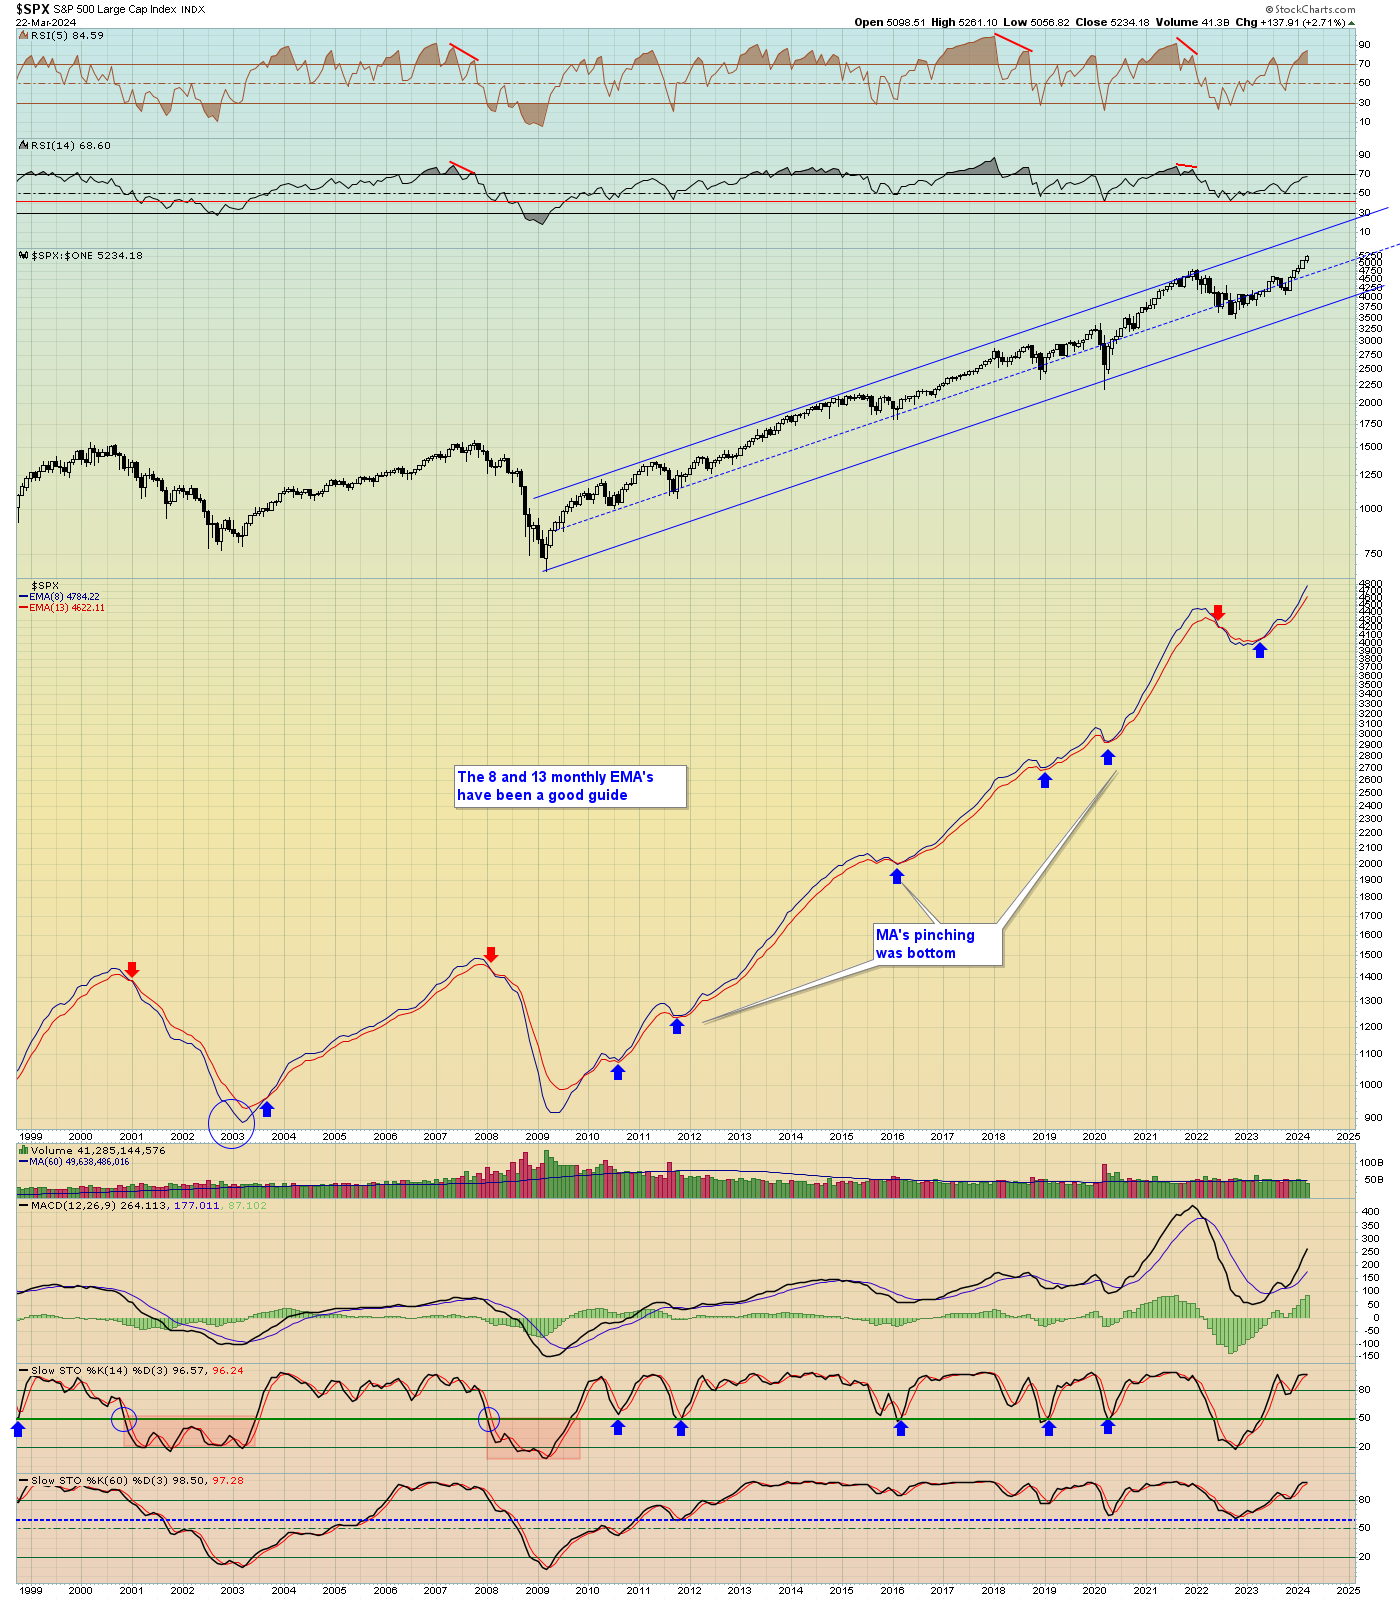
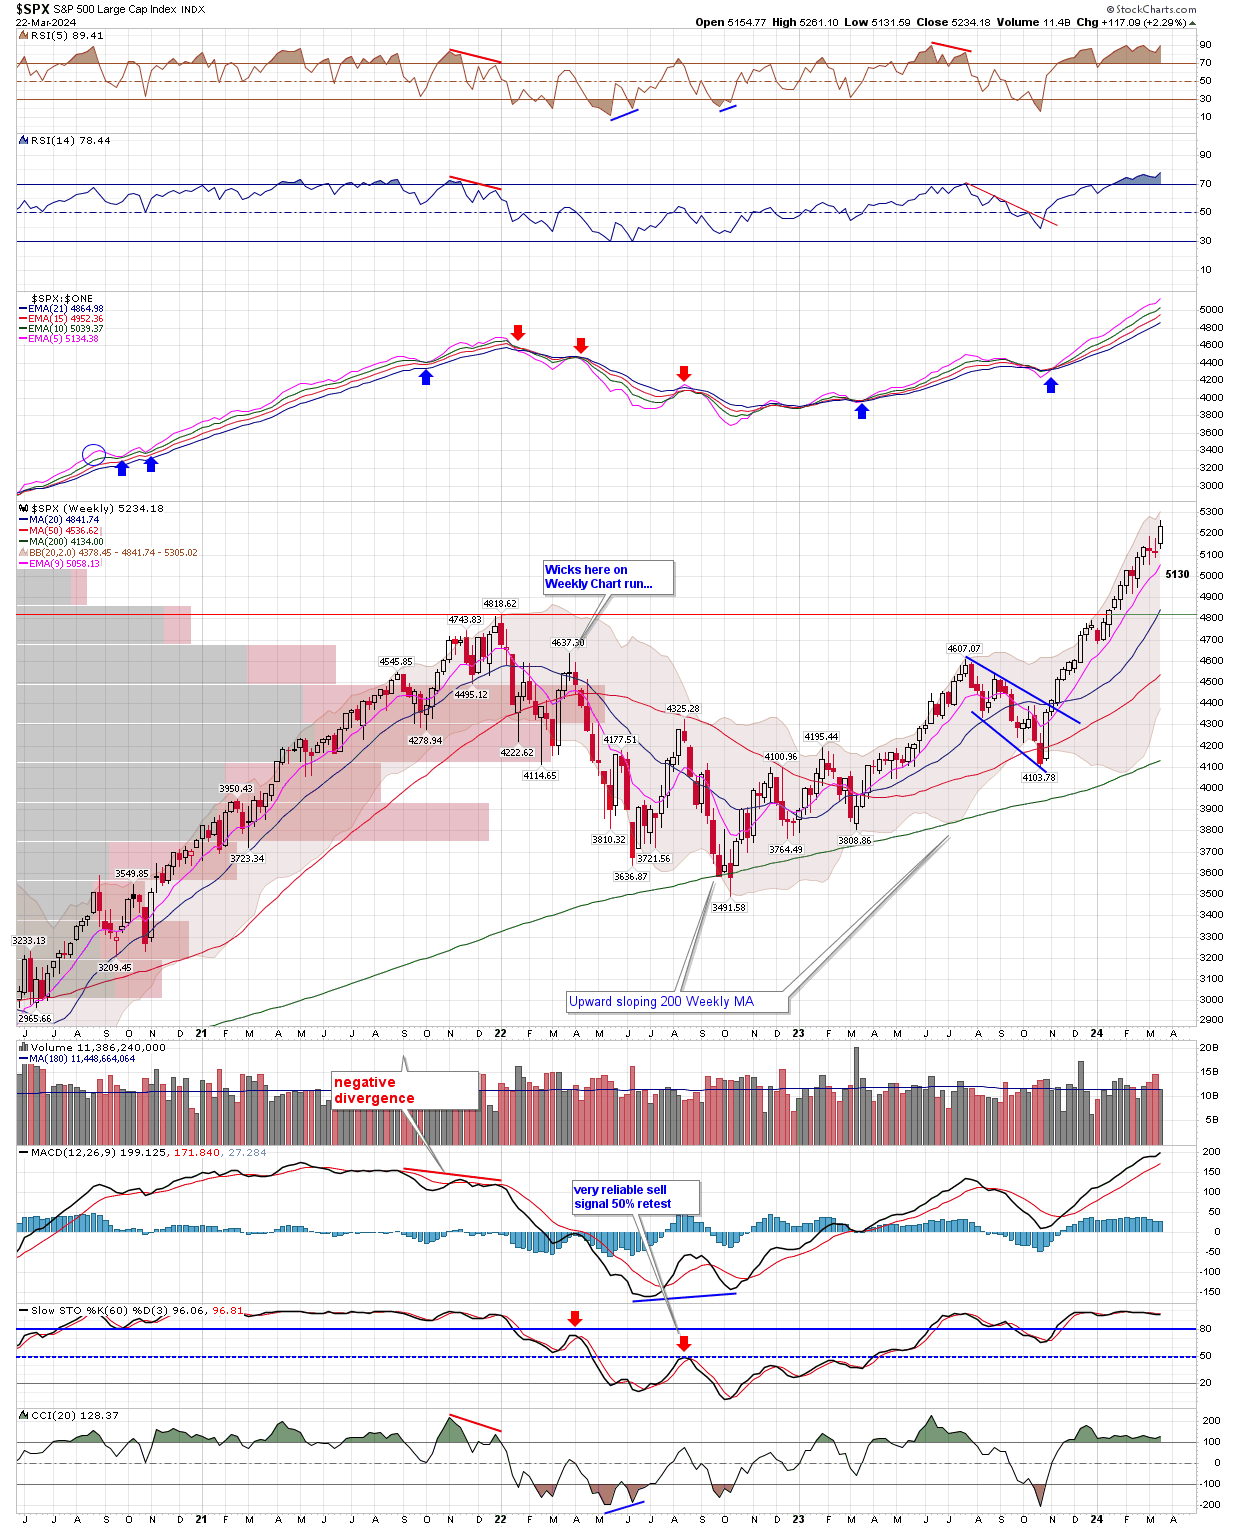
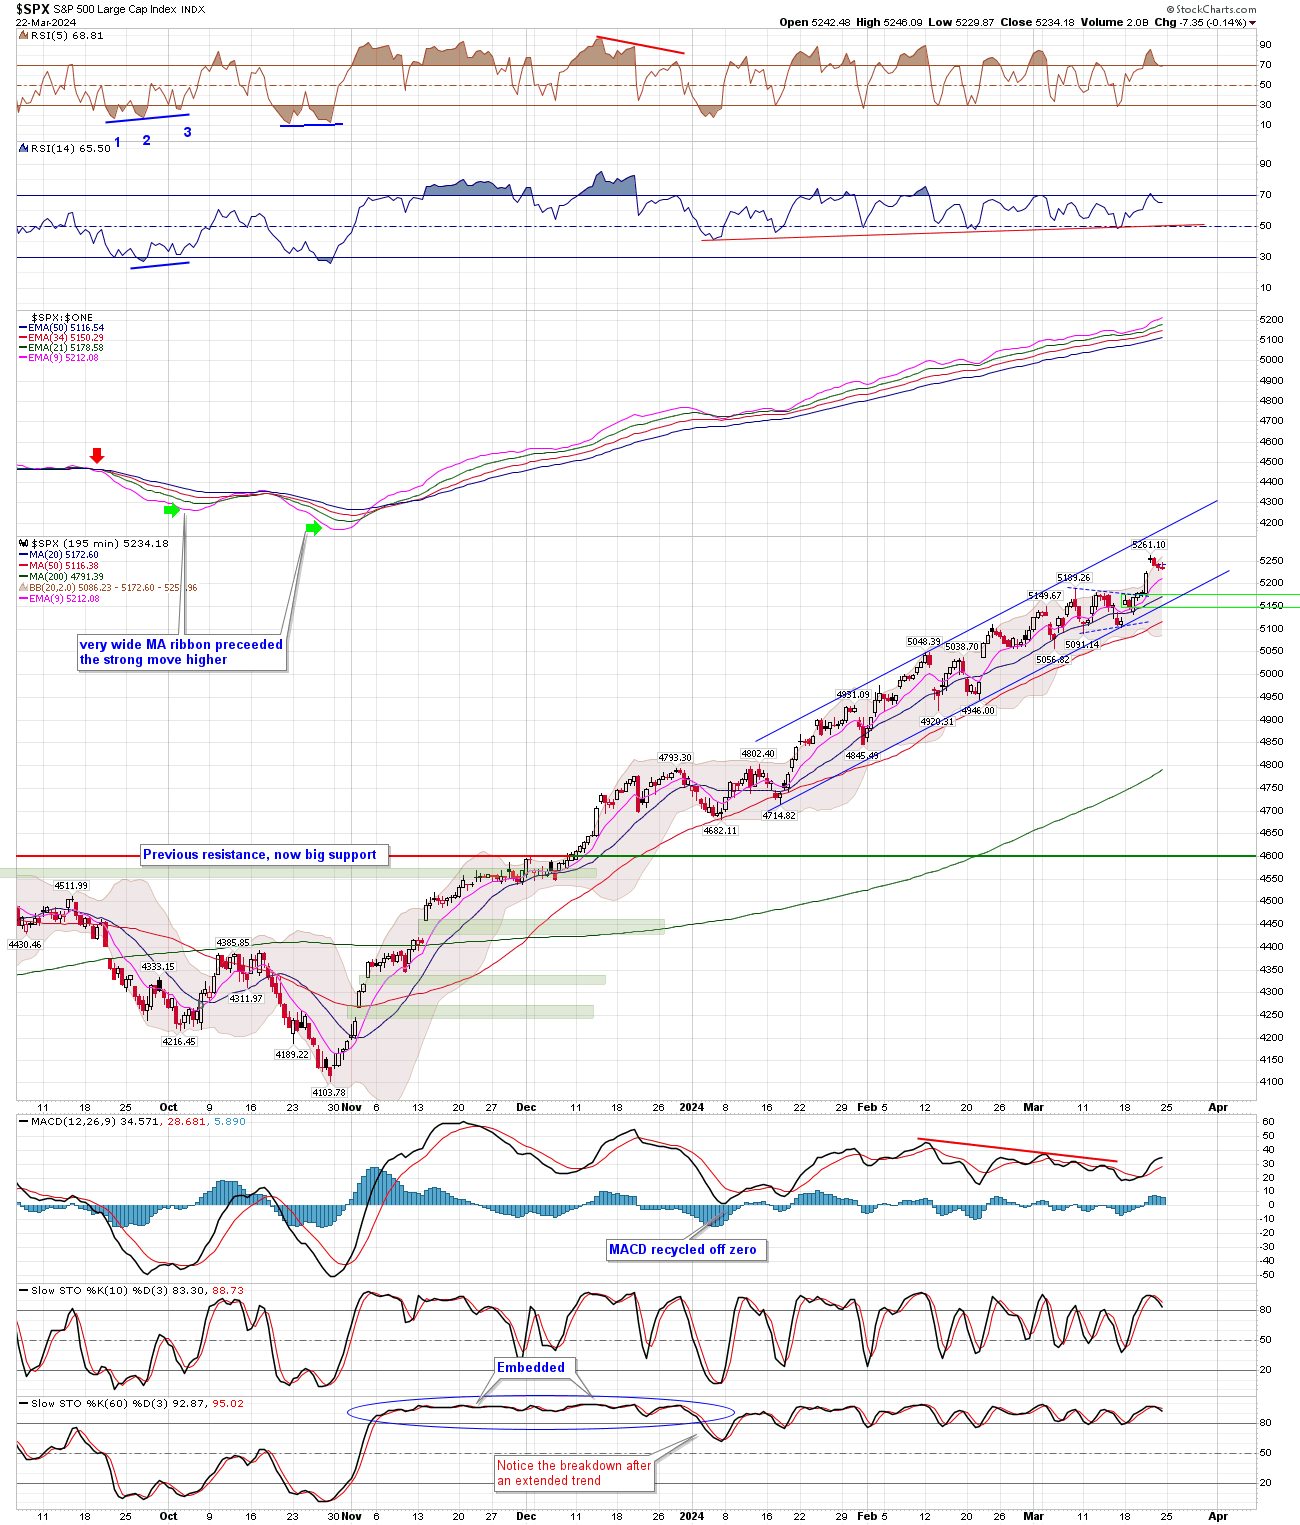
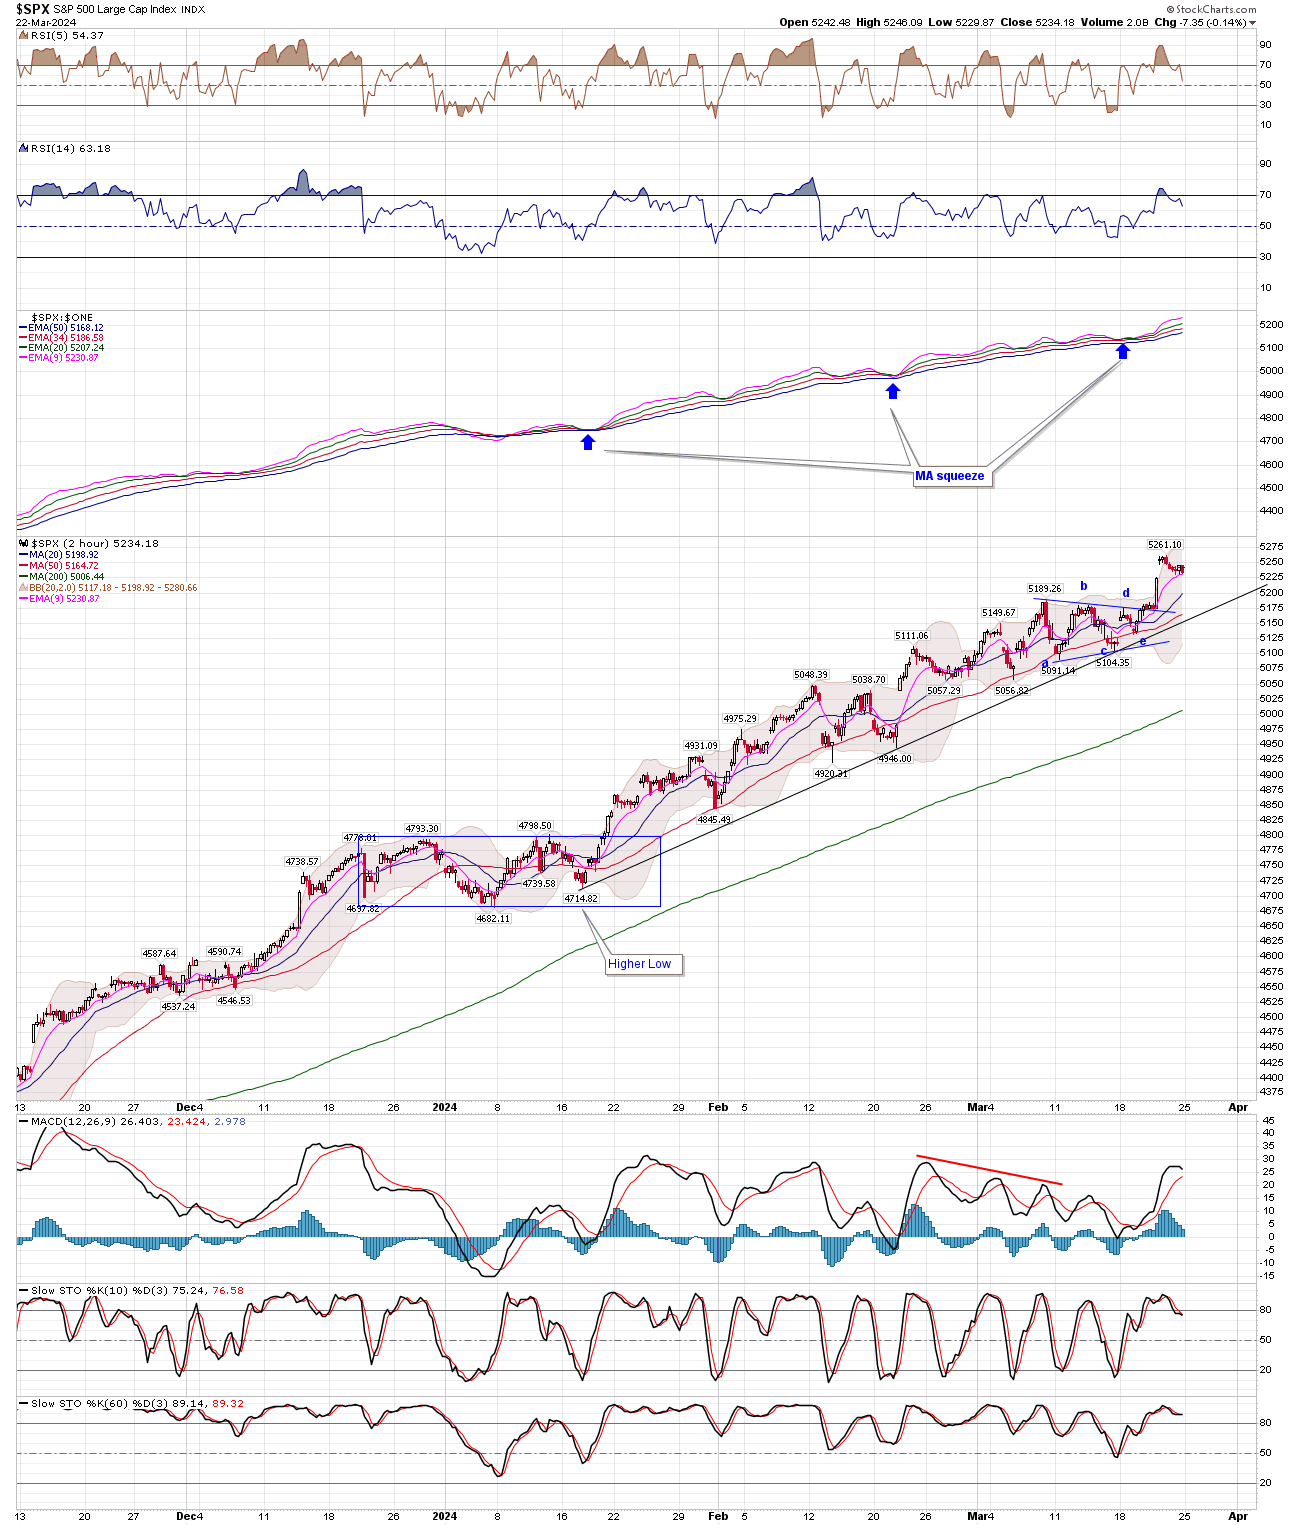
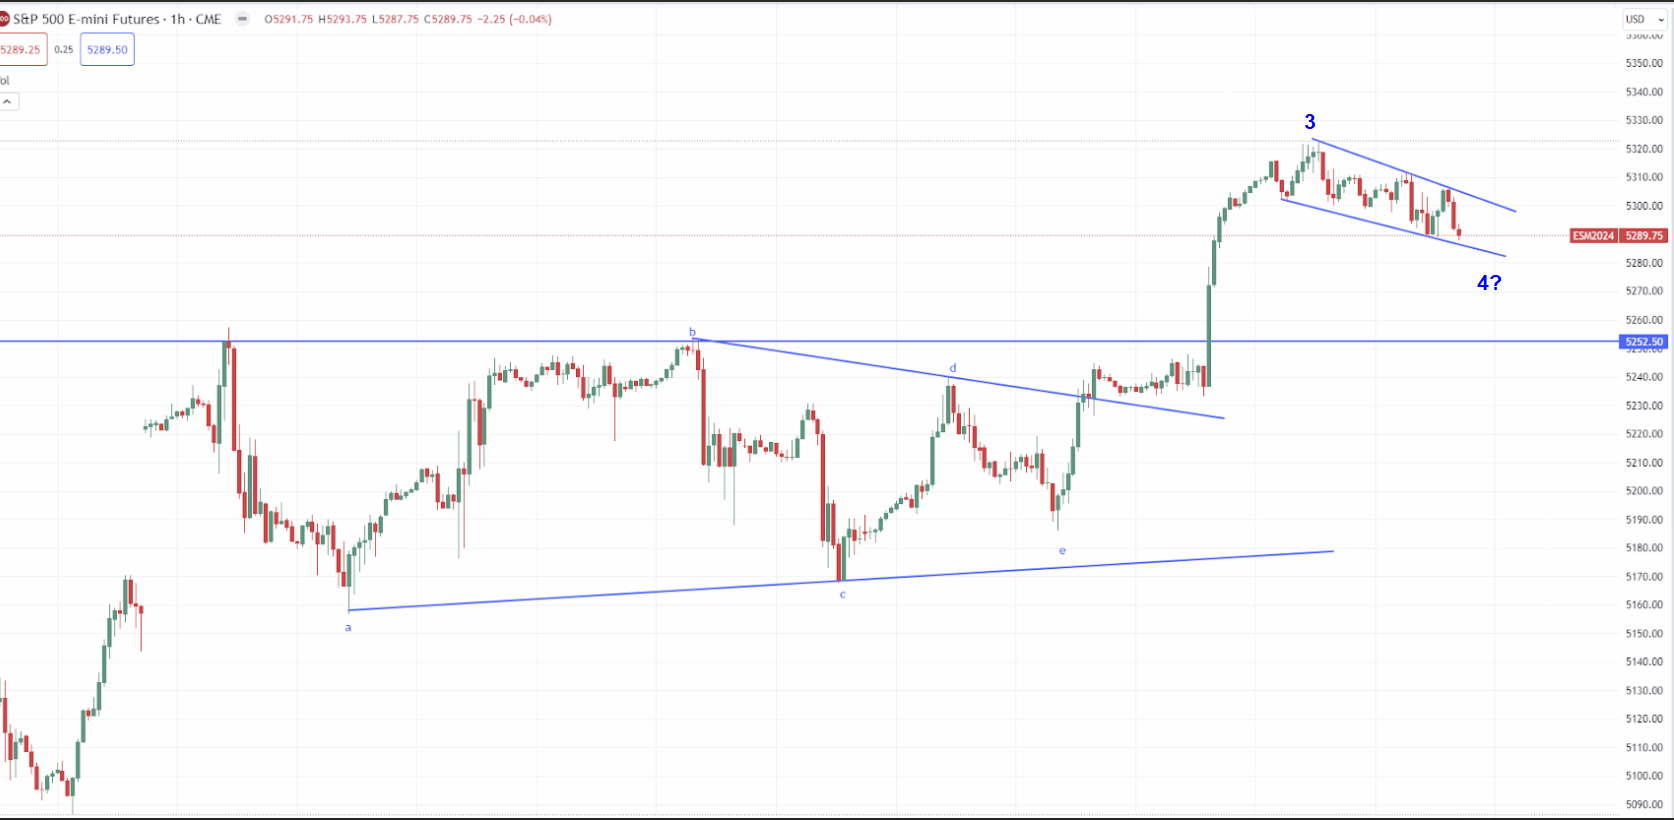
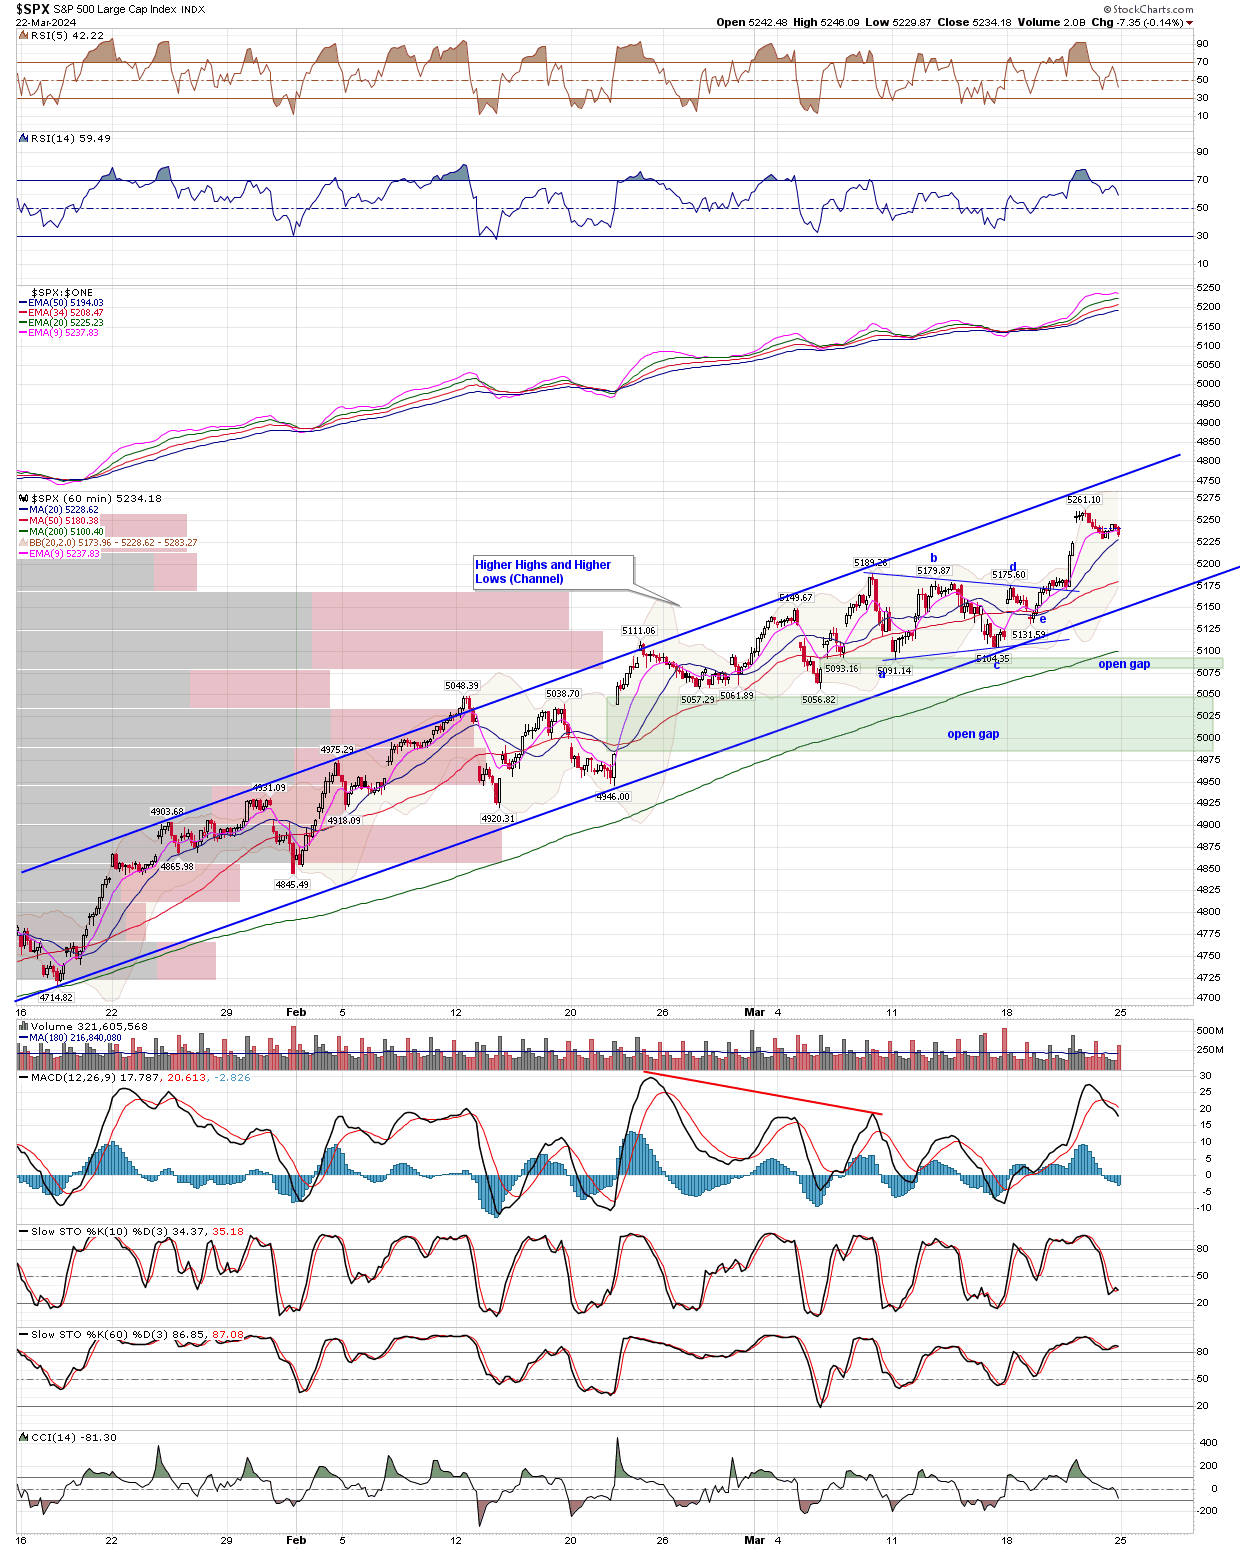
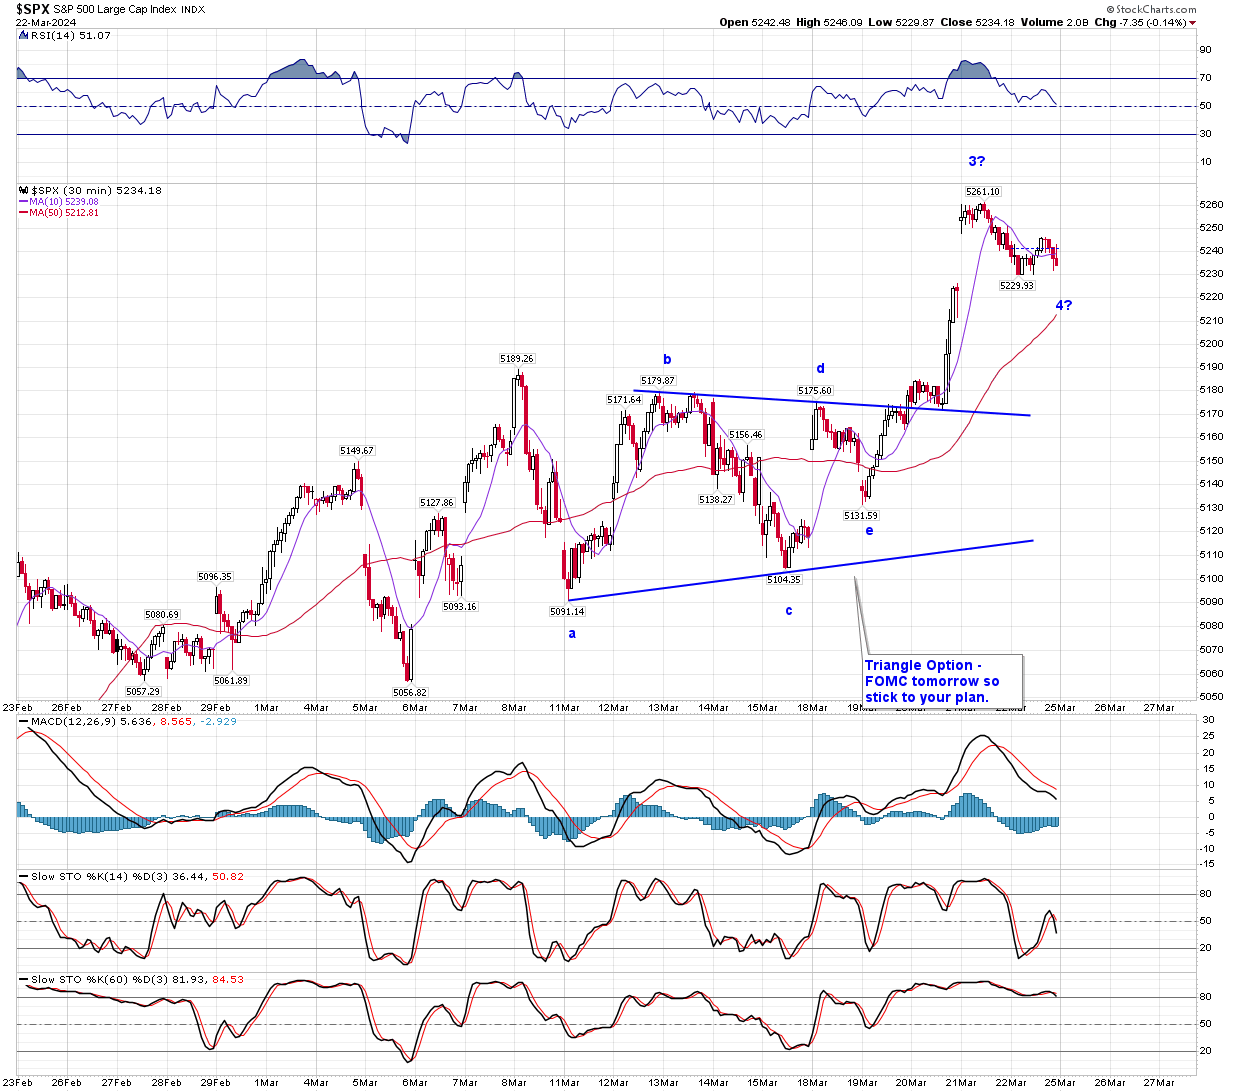
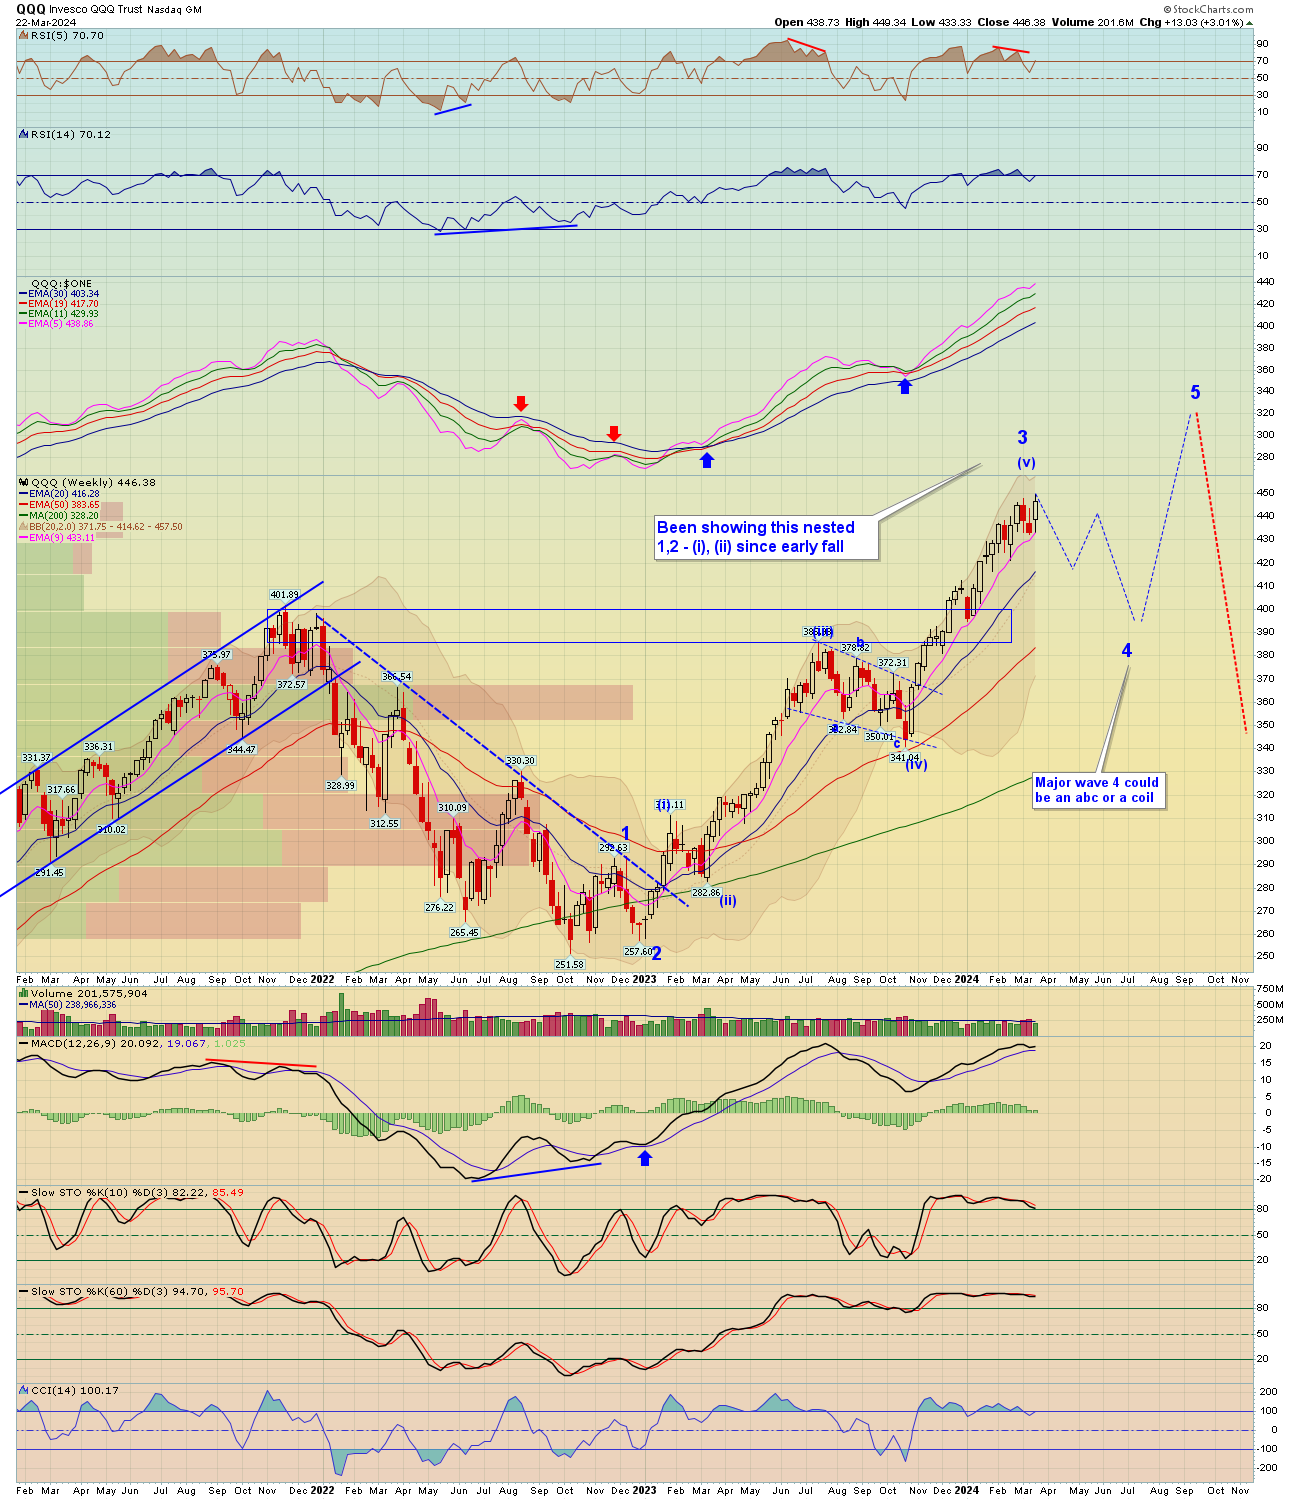
Market Comments: The 'bulls' continue to have the Football, and have had it since late October, which has made this uptrend quite impressive getting close to 5 months now. Early last week we pointed out very obvious coil triangle patterns on the S&P 500 and favored this as a 4th wave with another pop to the upside, which we got thus pushing the S&P 500 to close over 5200 new all time highs! For the week the SPX gained +2.3%, the Dow Jones +2%, the Nasdaq +3%, and the Russell 2000 +1.6%.
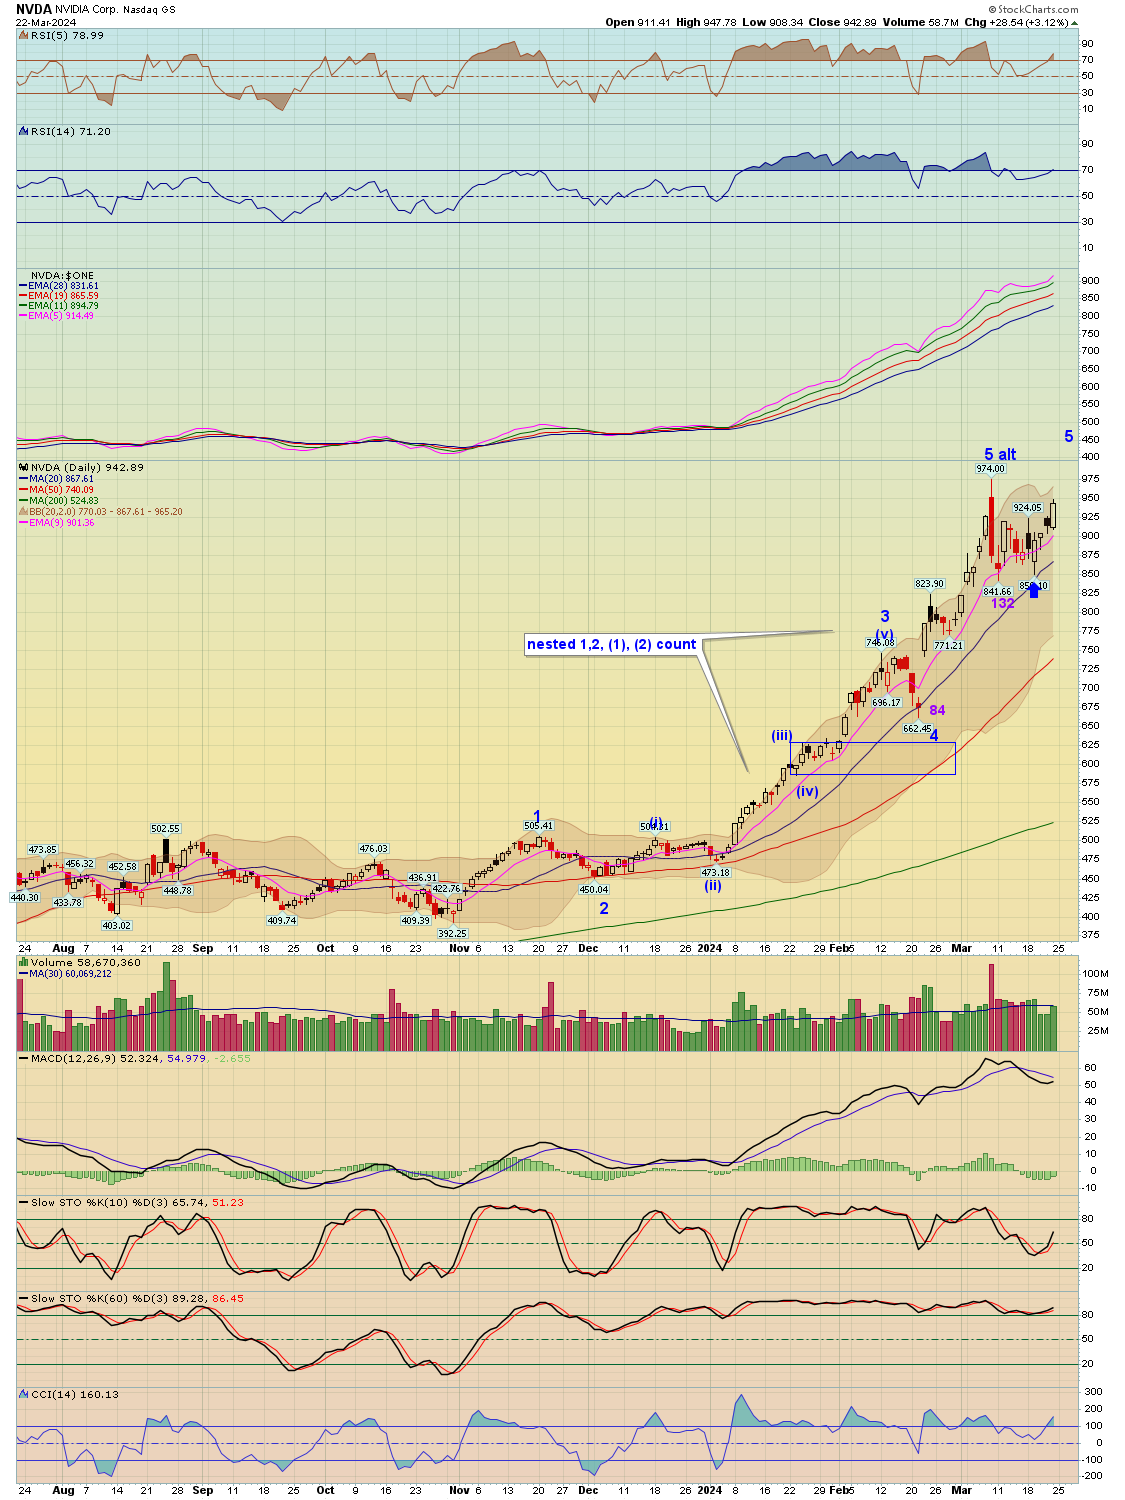
Watch: US Dollar, 10-year, and NVDA
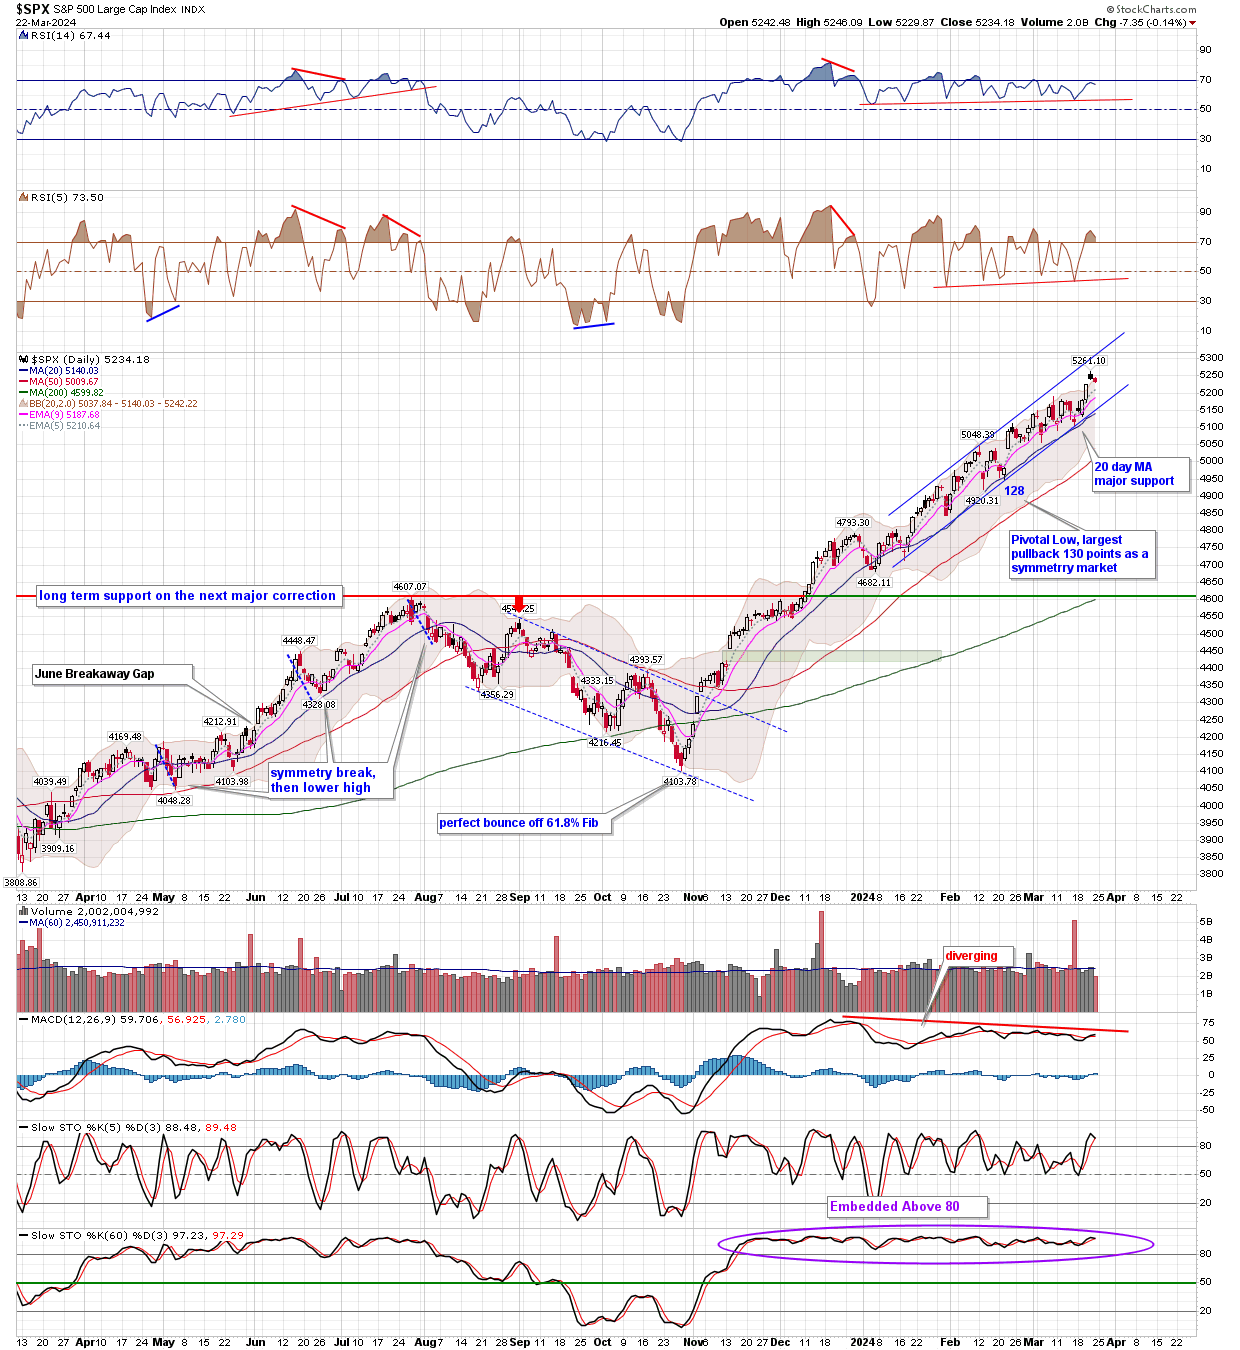
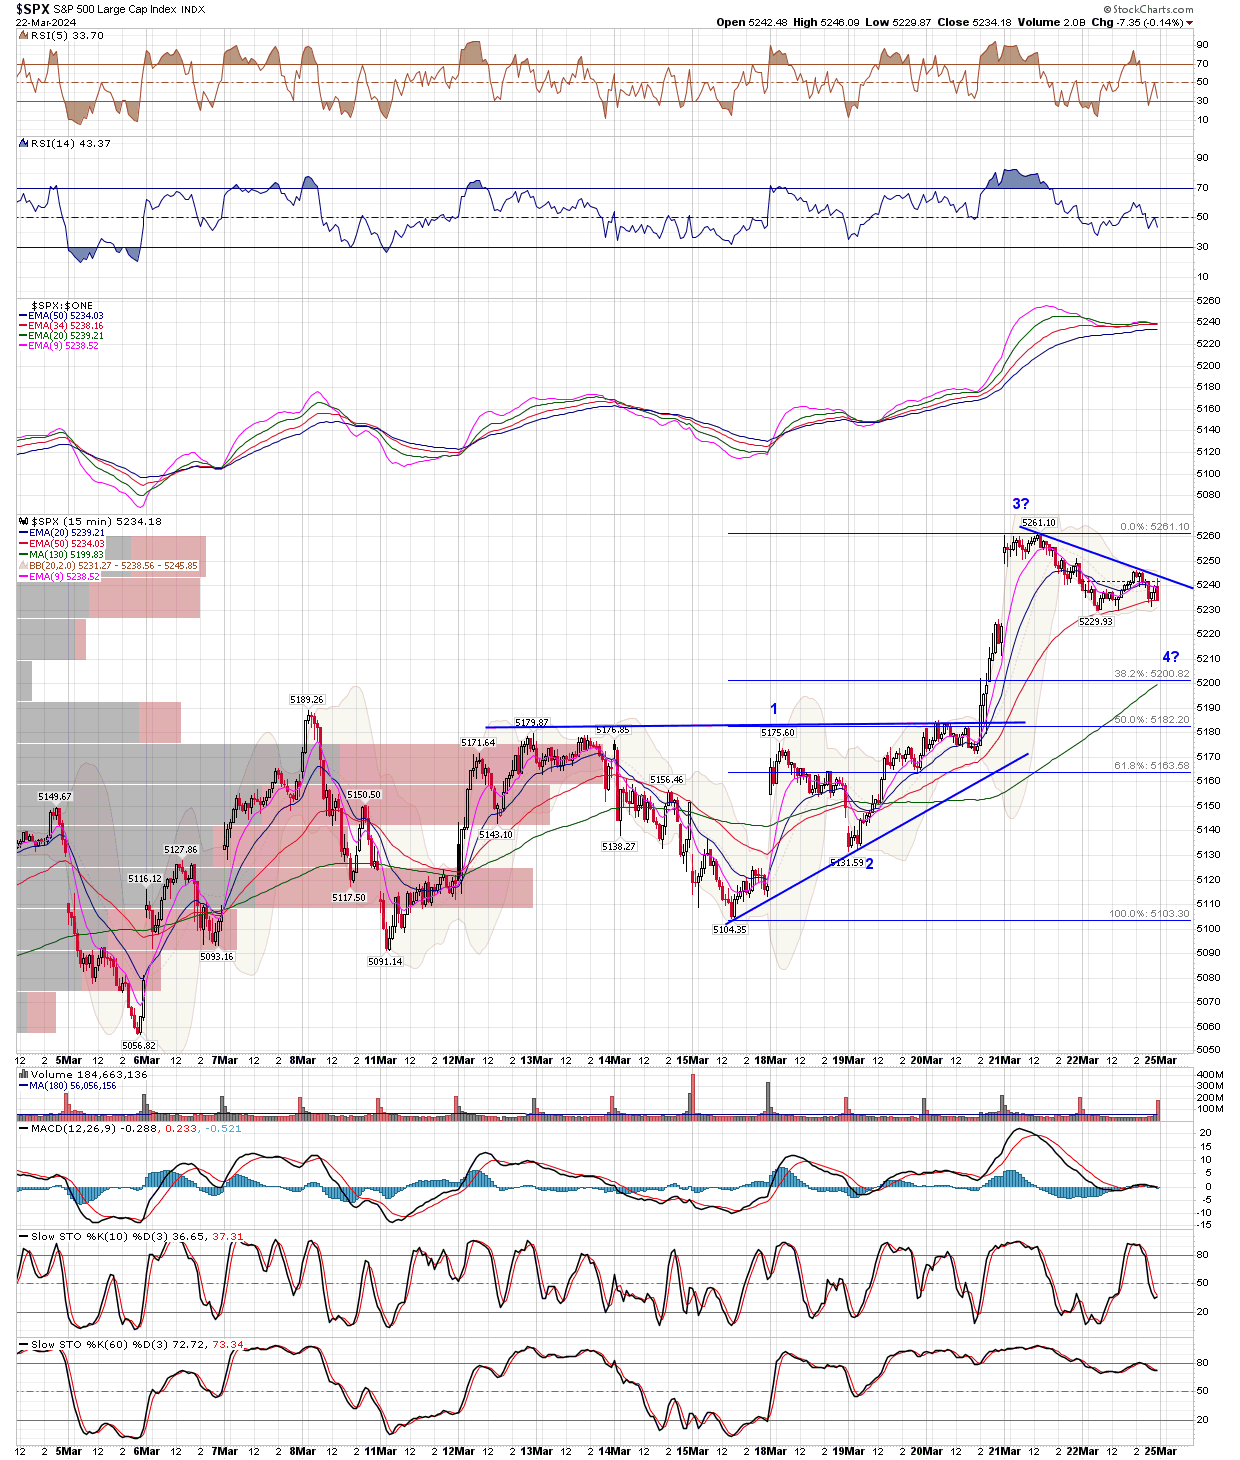
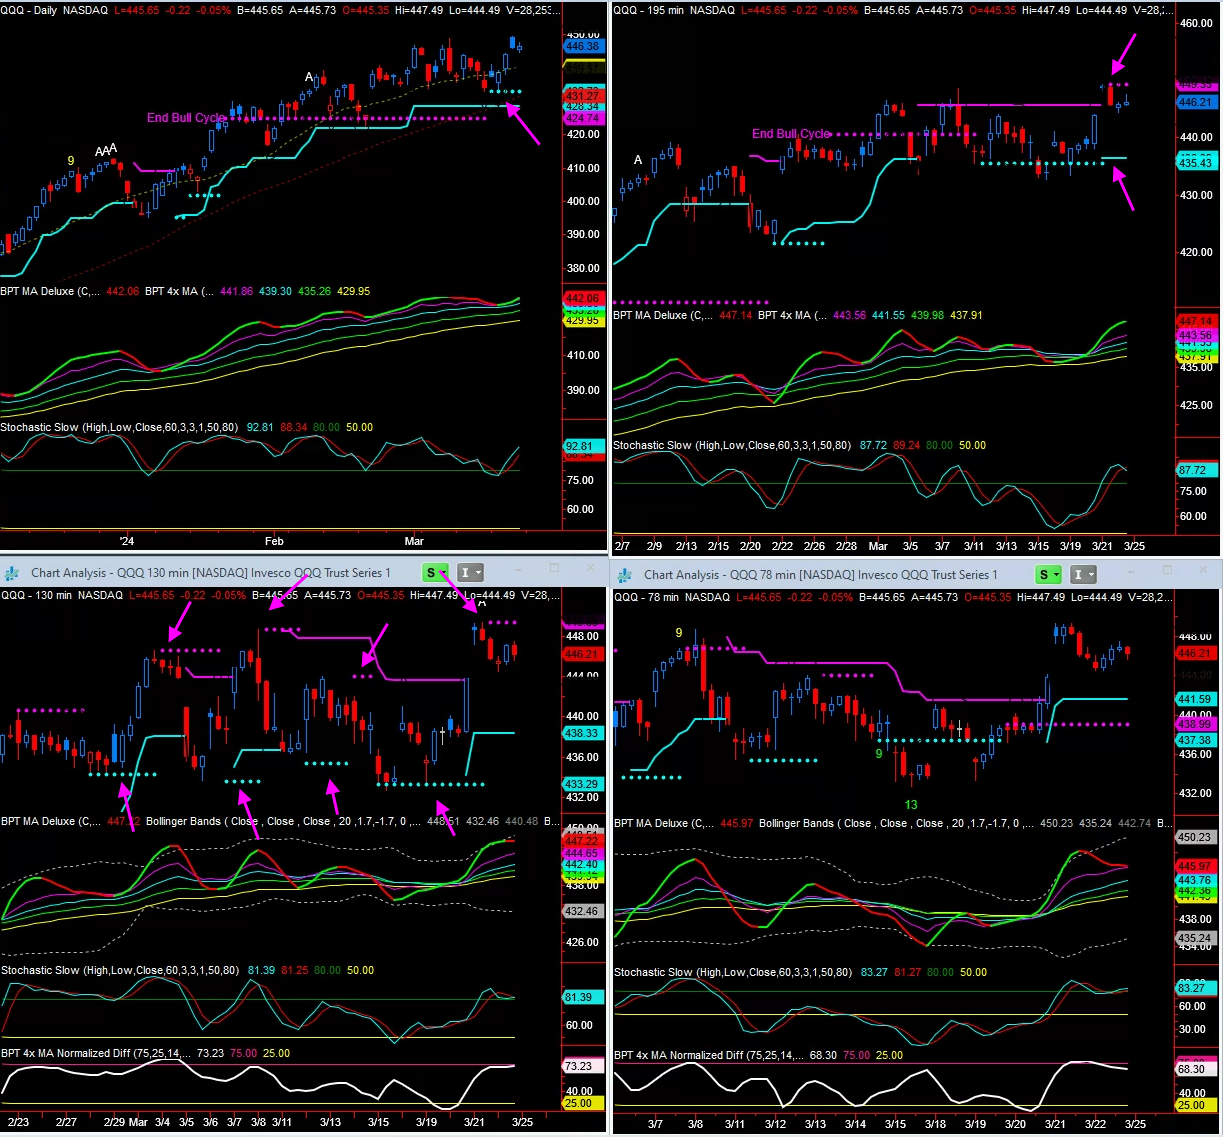
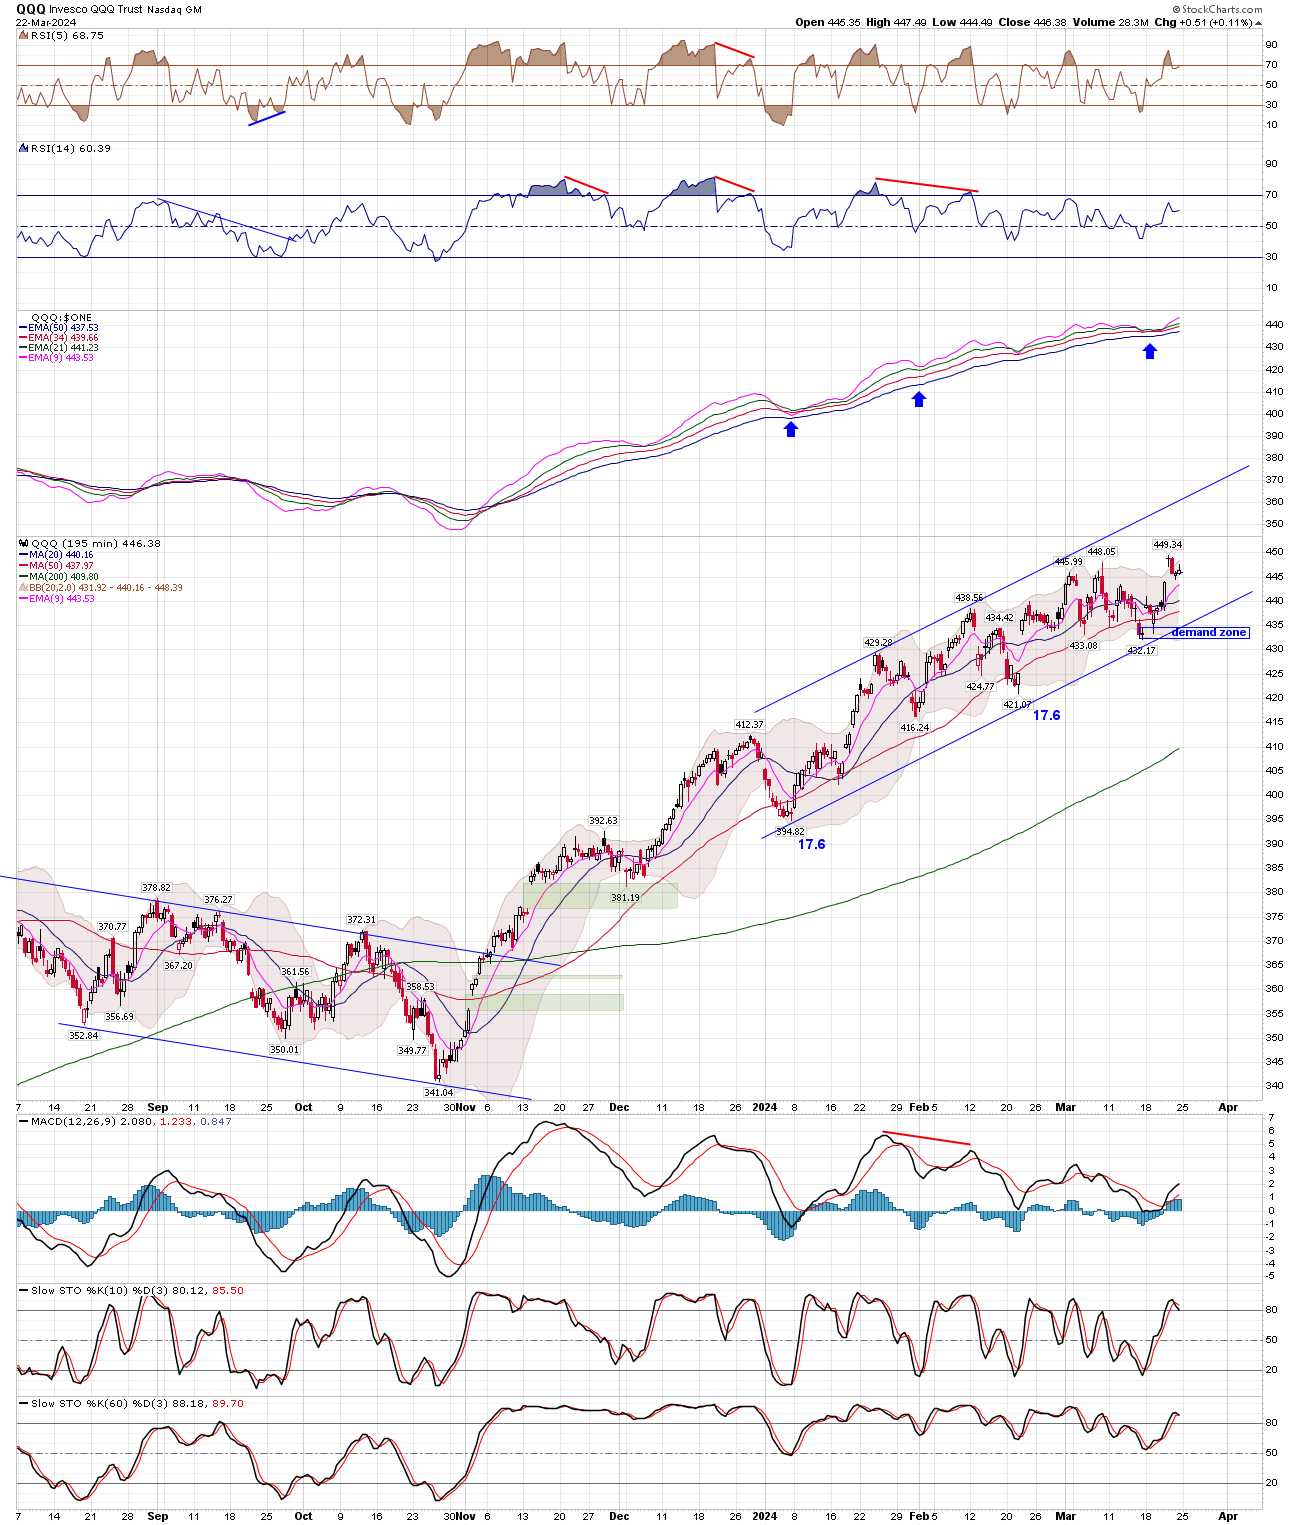
Short-term: After the pop out of the coil into Thursday's high and pullback that extended into Friday, for now we are favoring this as another 4th wave of some degree with yet another pop to the upside. That said, it's getting trickier now and late in the game (may not be much blood left in the turnup should we get another pop to a new high). If the pullback on the SPX falls below 5175 it would overlap and negate the short-term wave 5 structure. The 20-day MA is your important support.
- The largest pullback during this entire uptrend was about 130 points on the S&P 500, meaning a pullback below 5130 would be required to break uptrend symmetry.
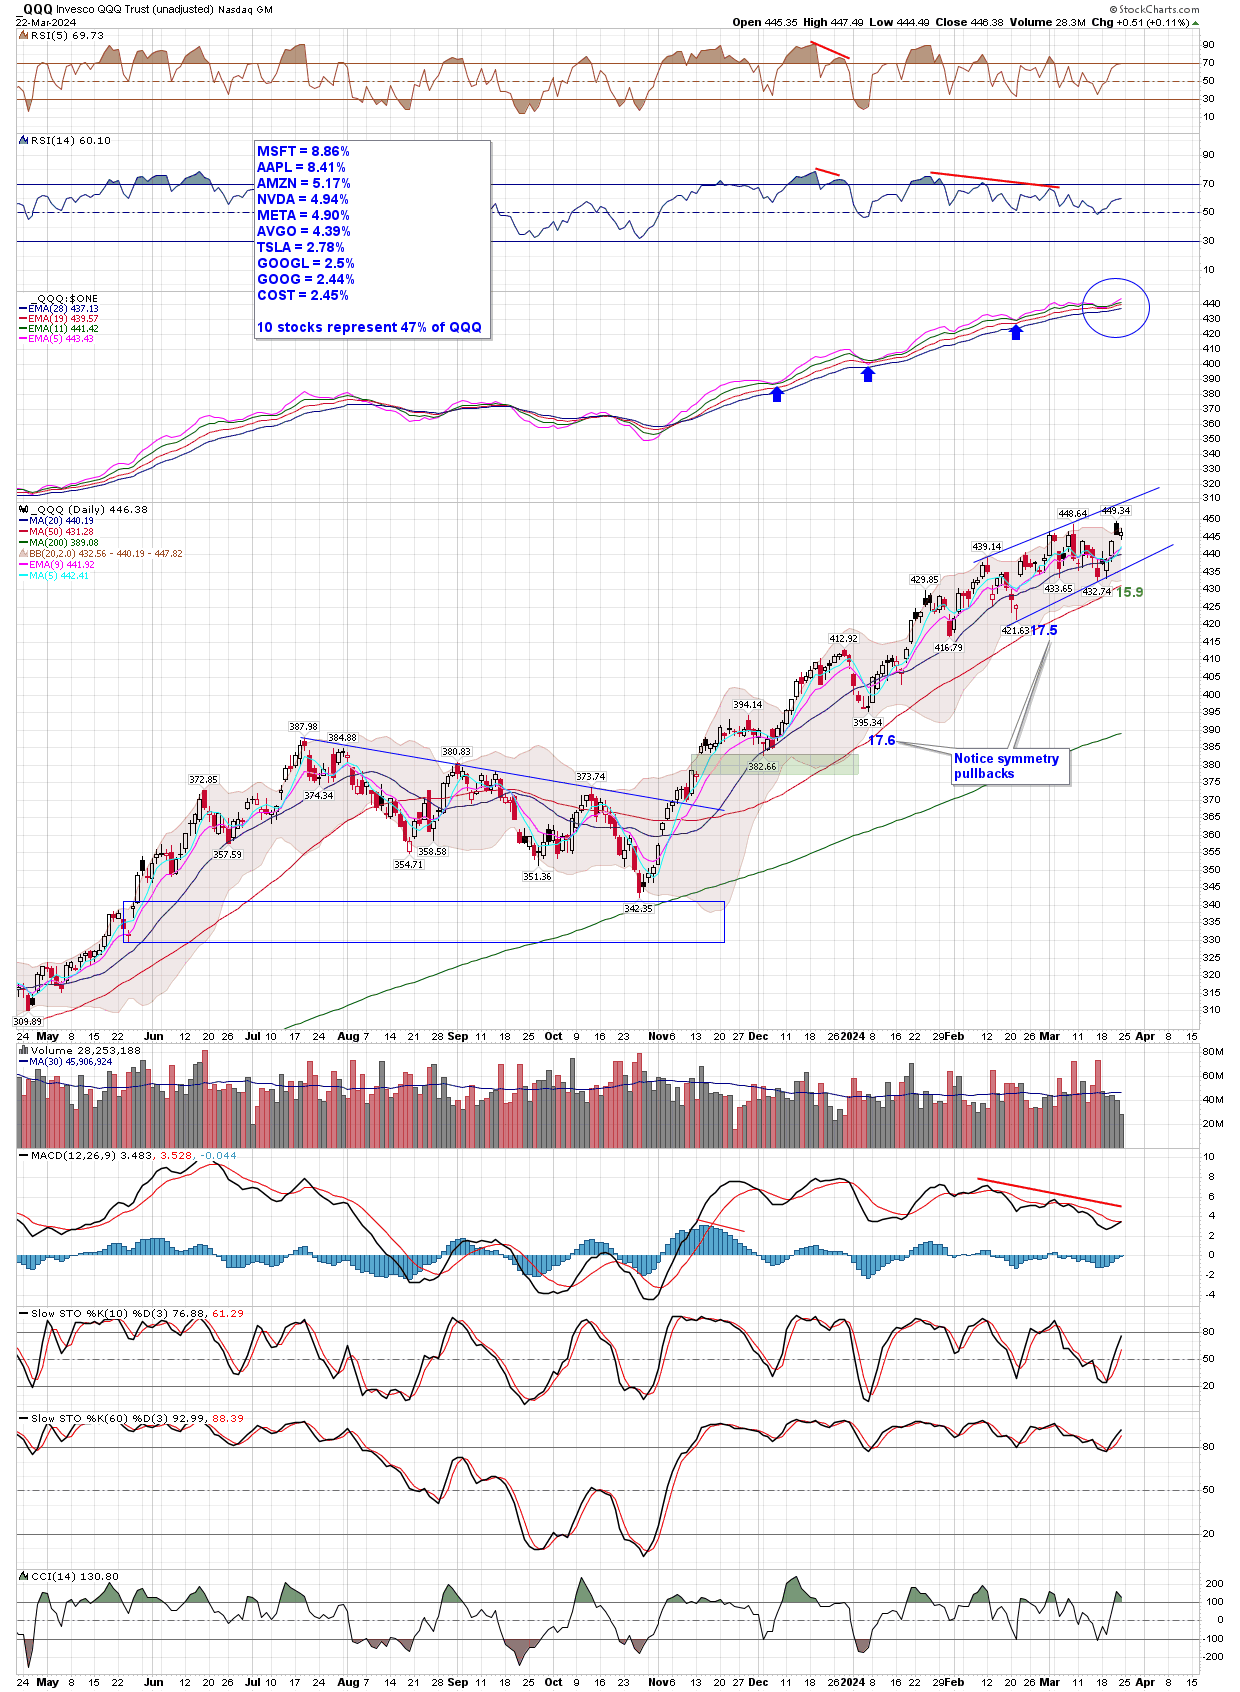
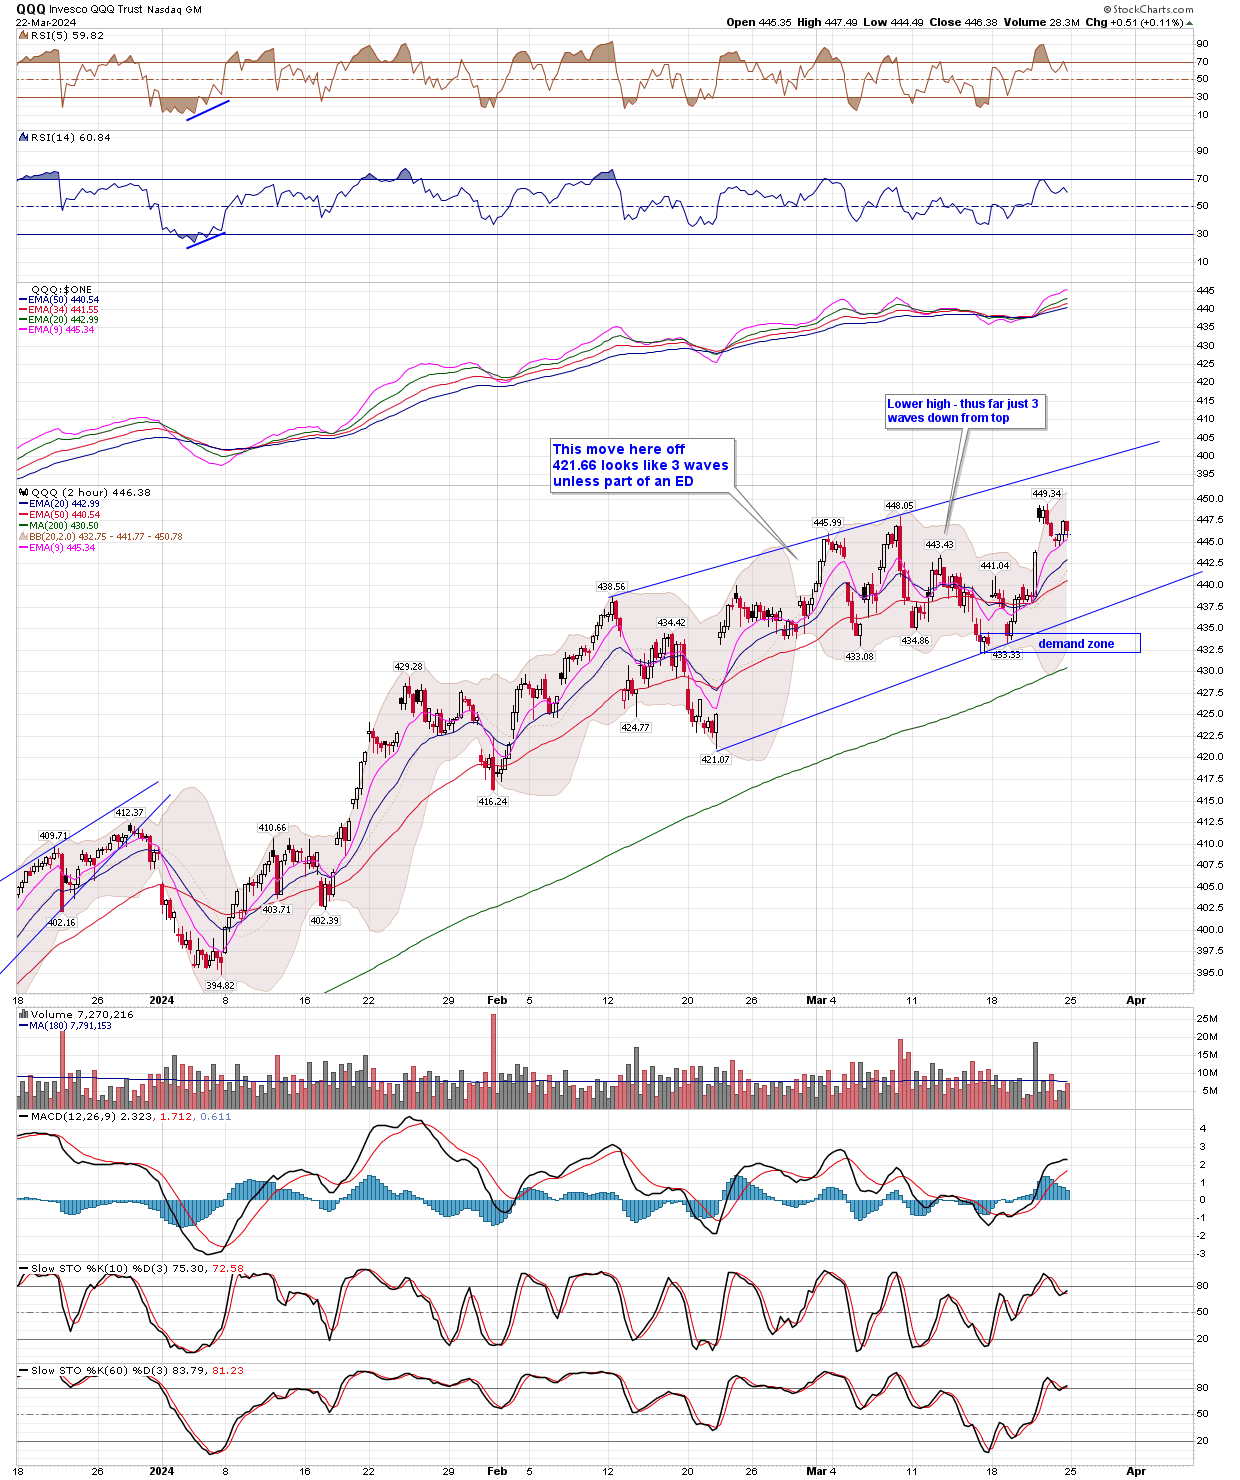
- For the QQQ, the largest pullback has been 17.6 points
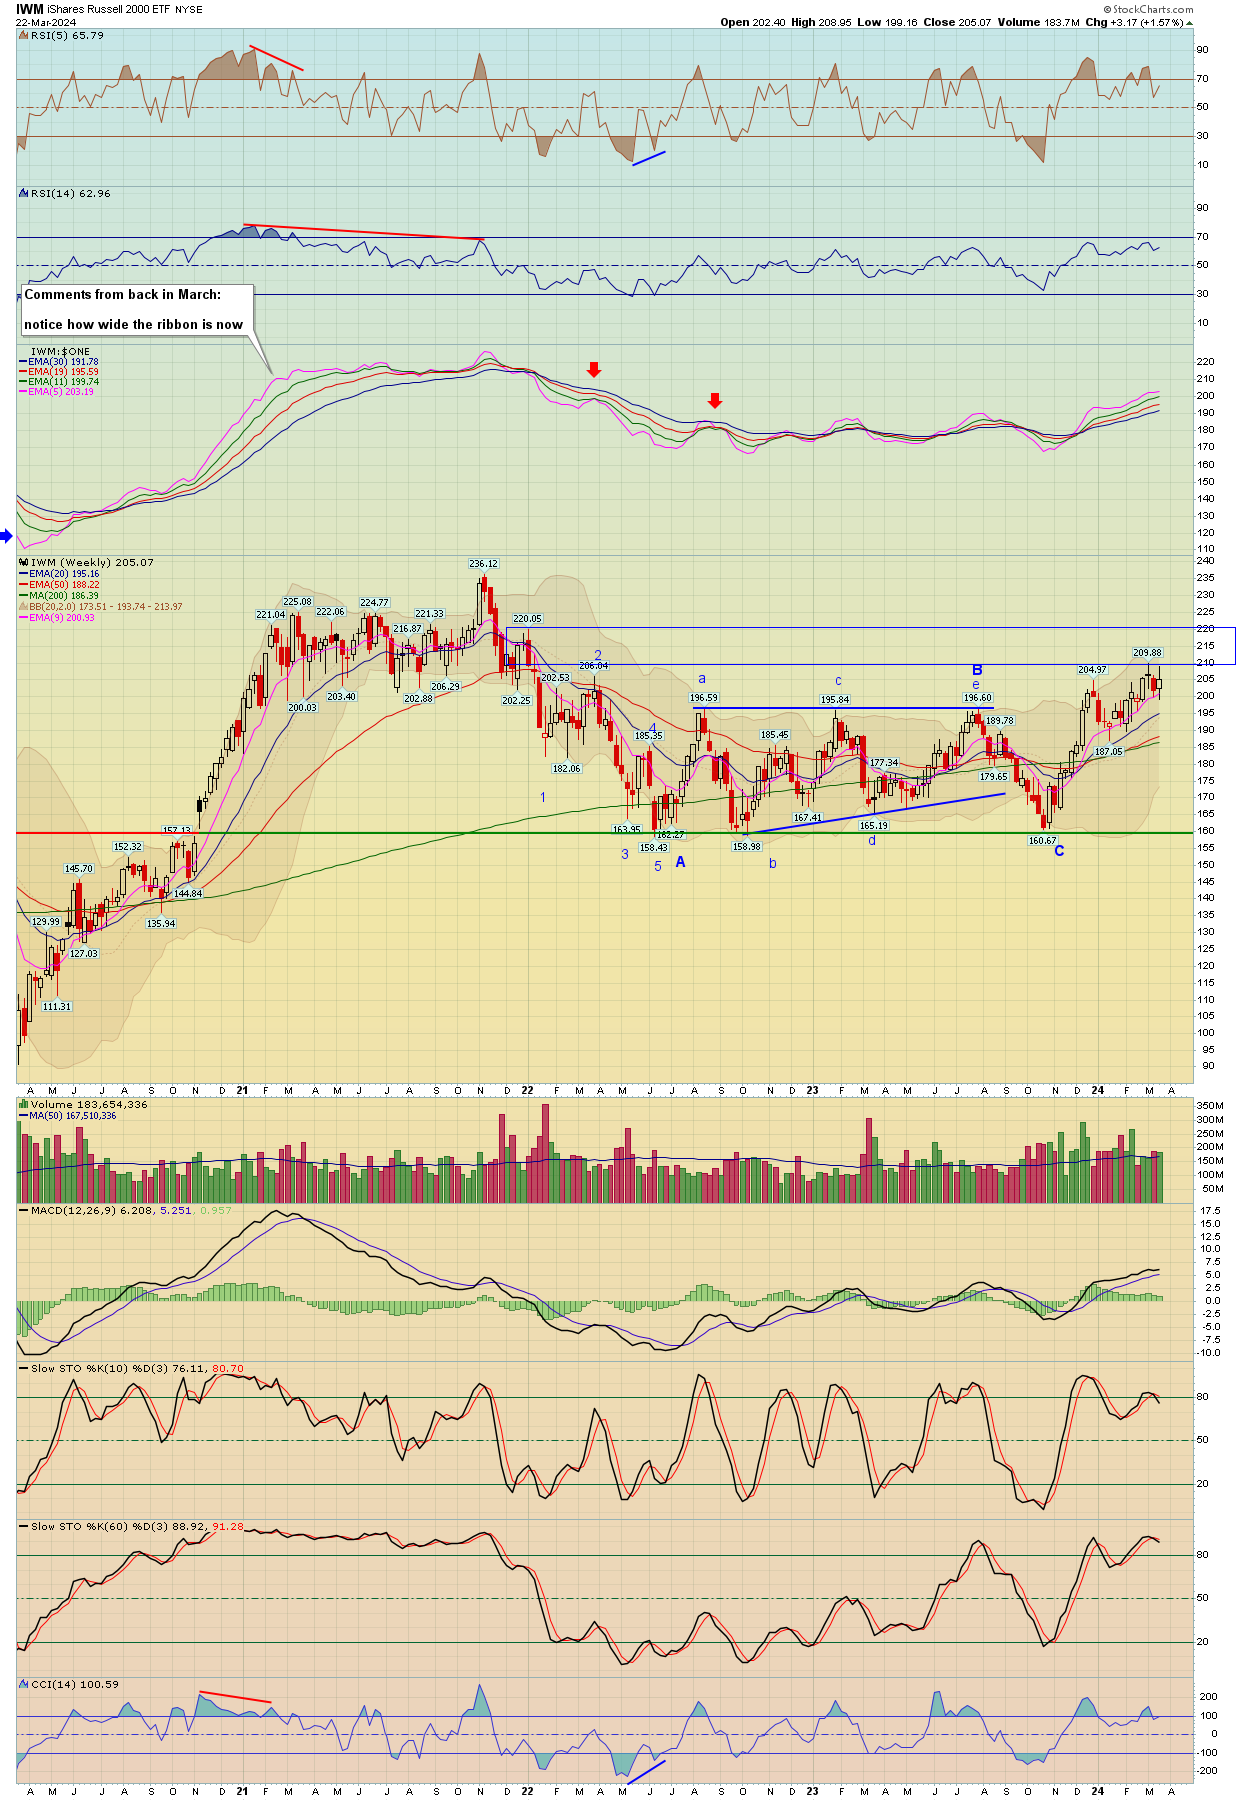
- IWM appears to be some sort of rising wedge pattern wave 5
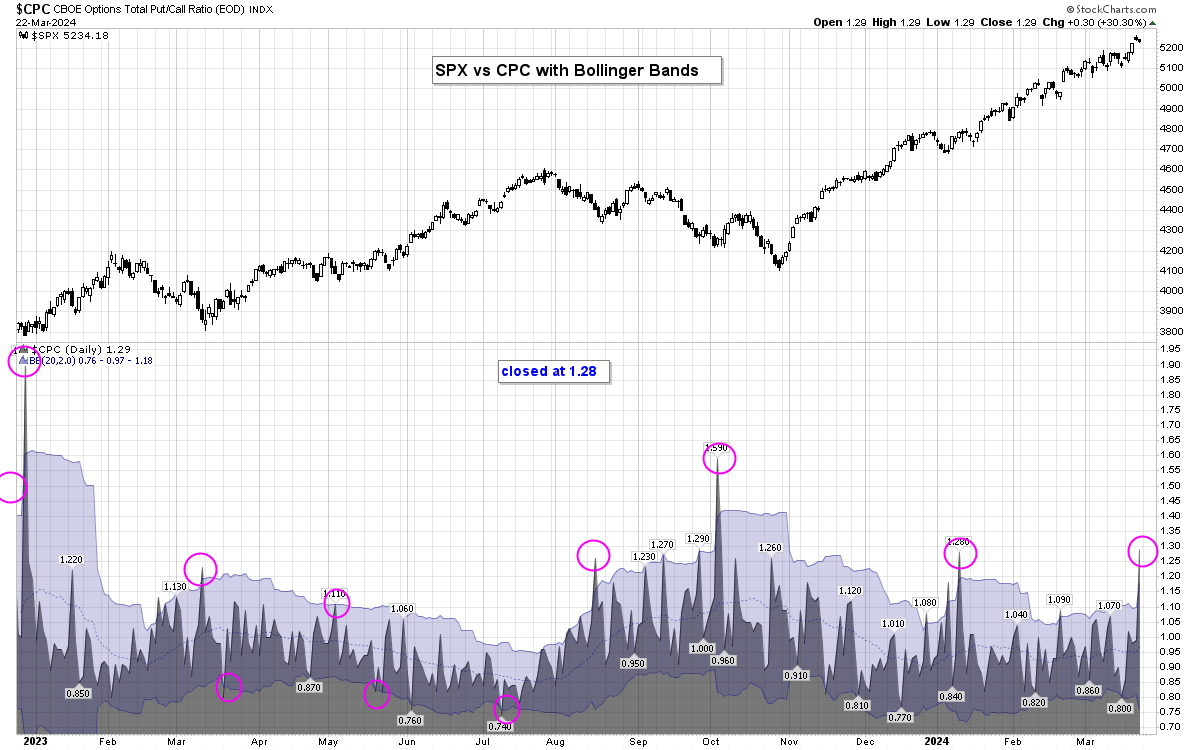
- Curious spike on the CPI Put/Call ratio to 1.29 on Friday despite the market being almost at all time highs
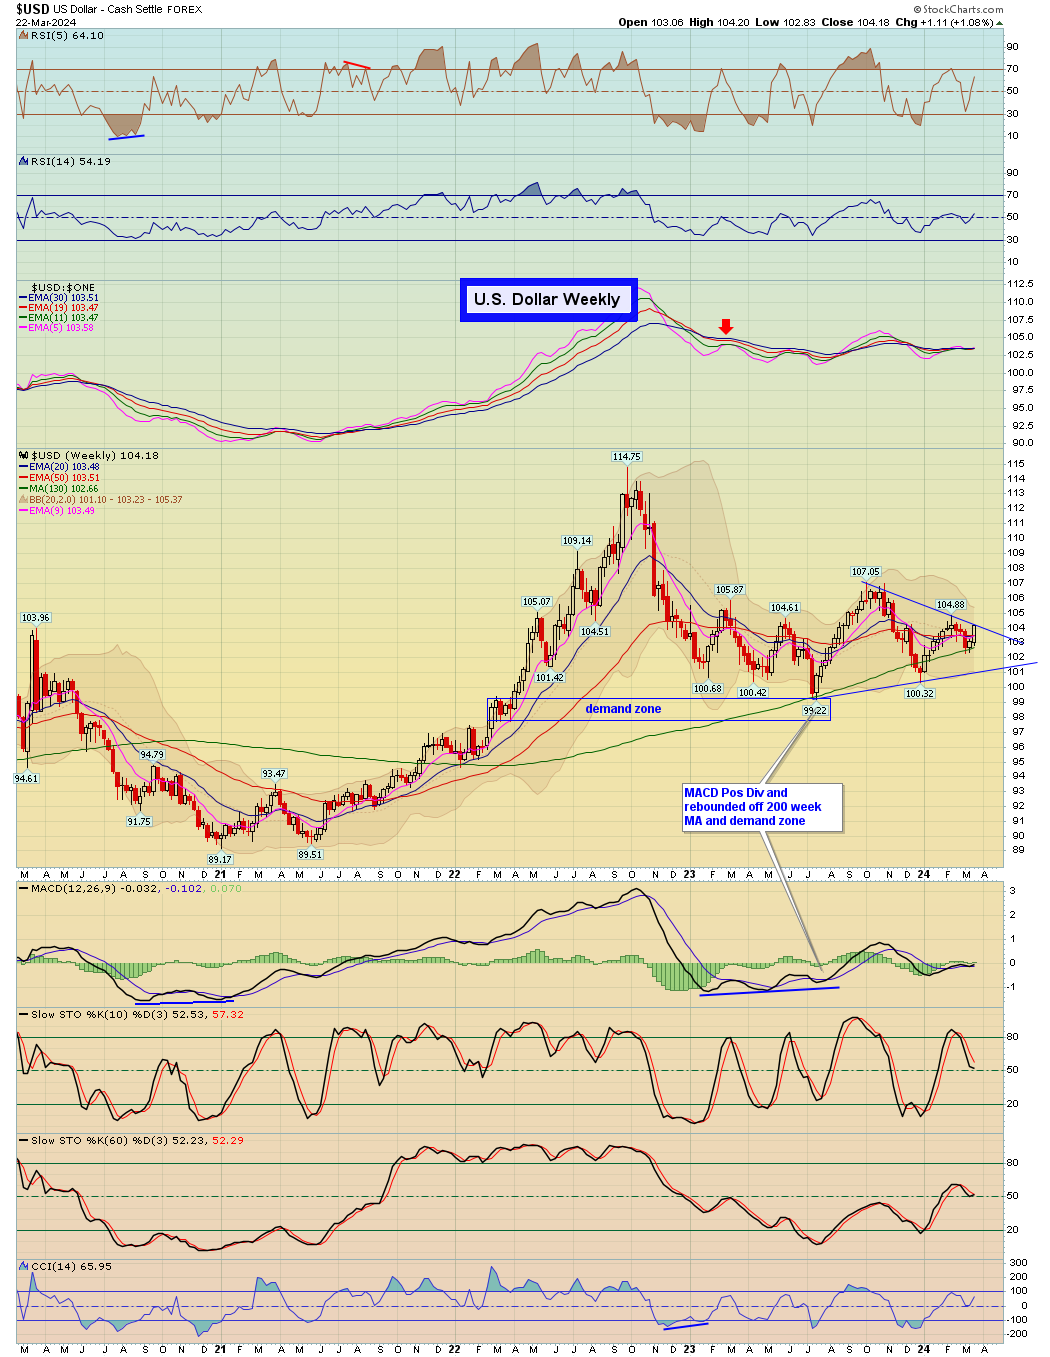
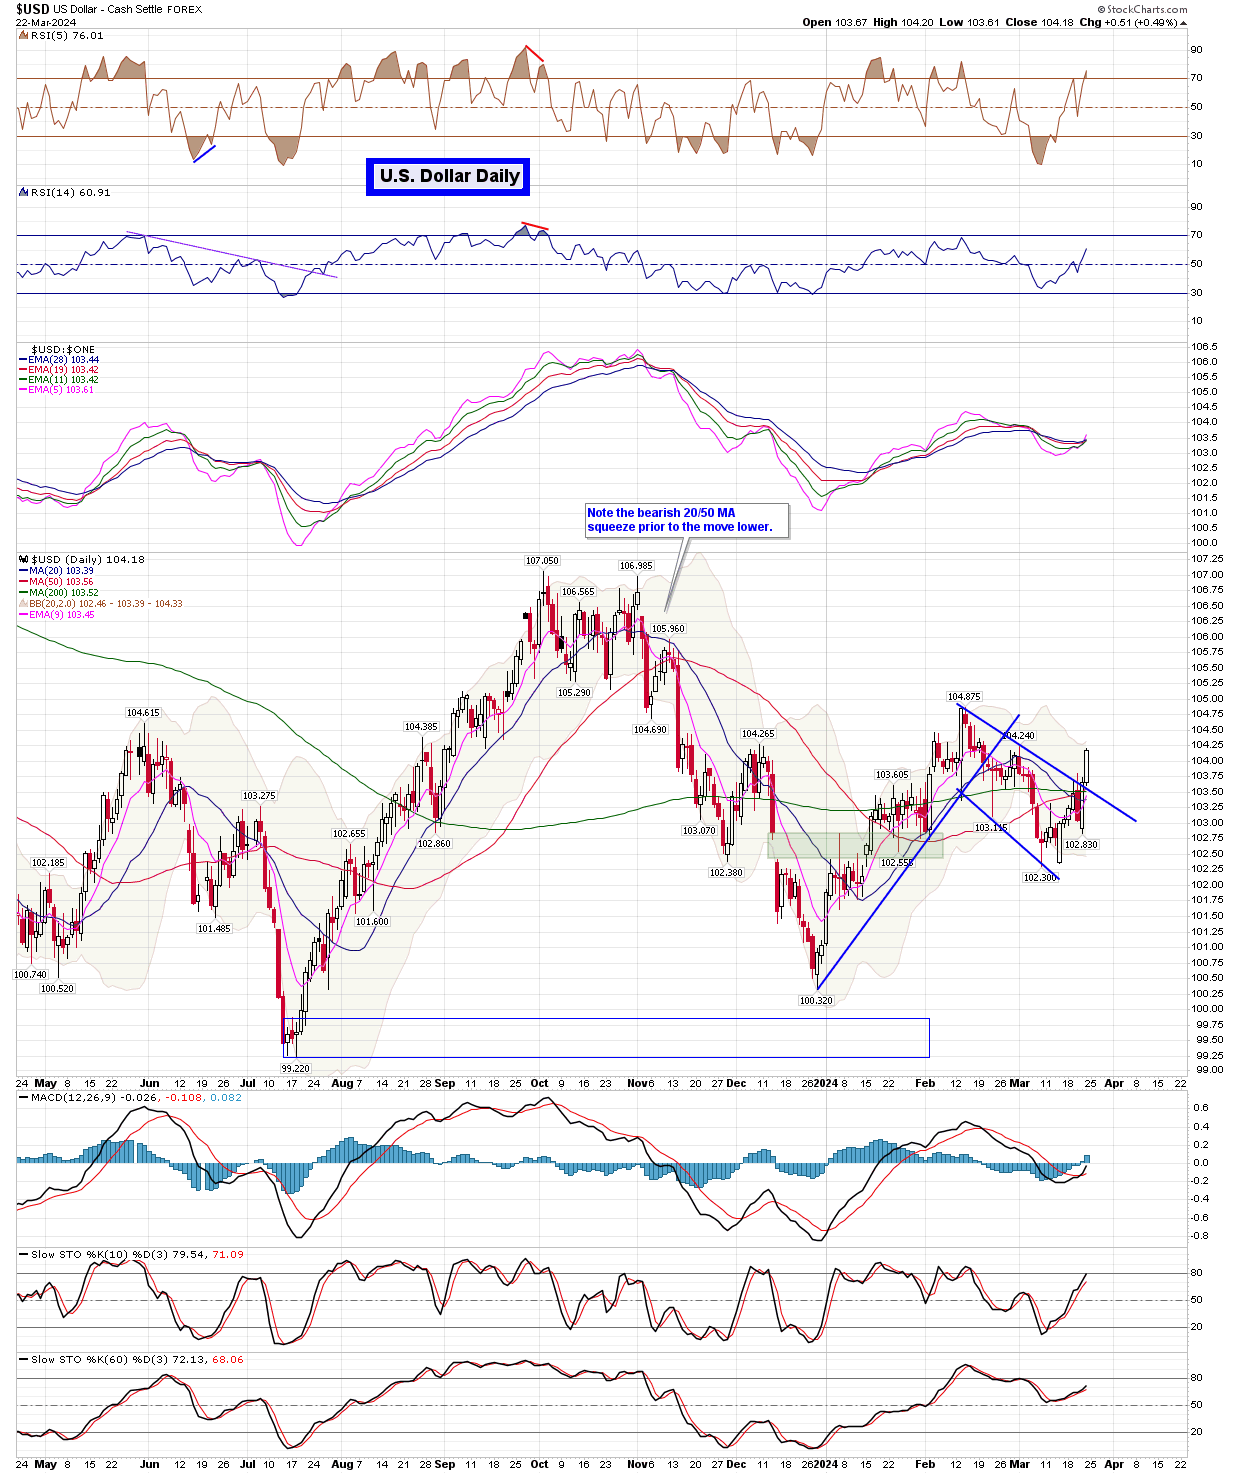
- The US Dollar had a strong week gaining +1.1%
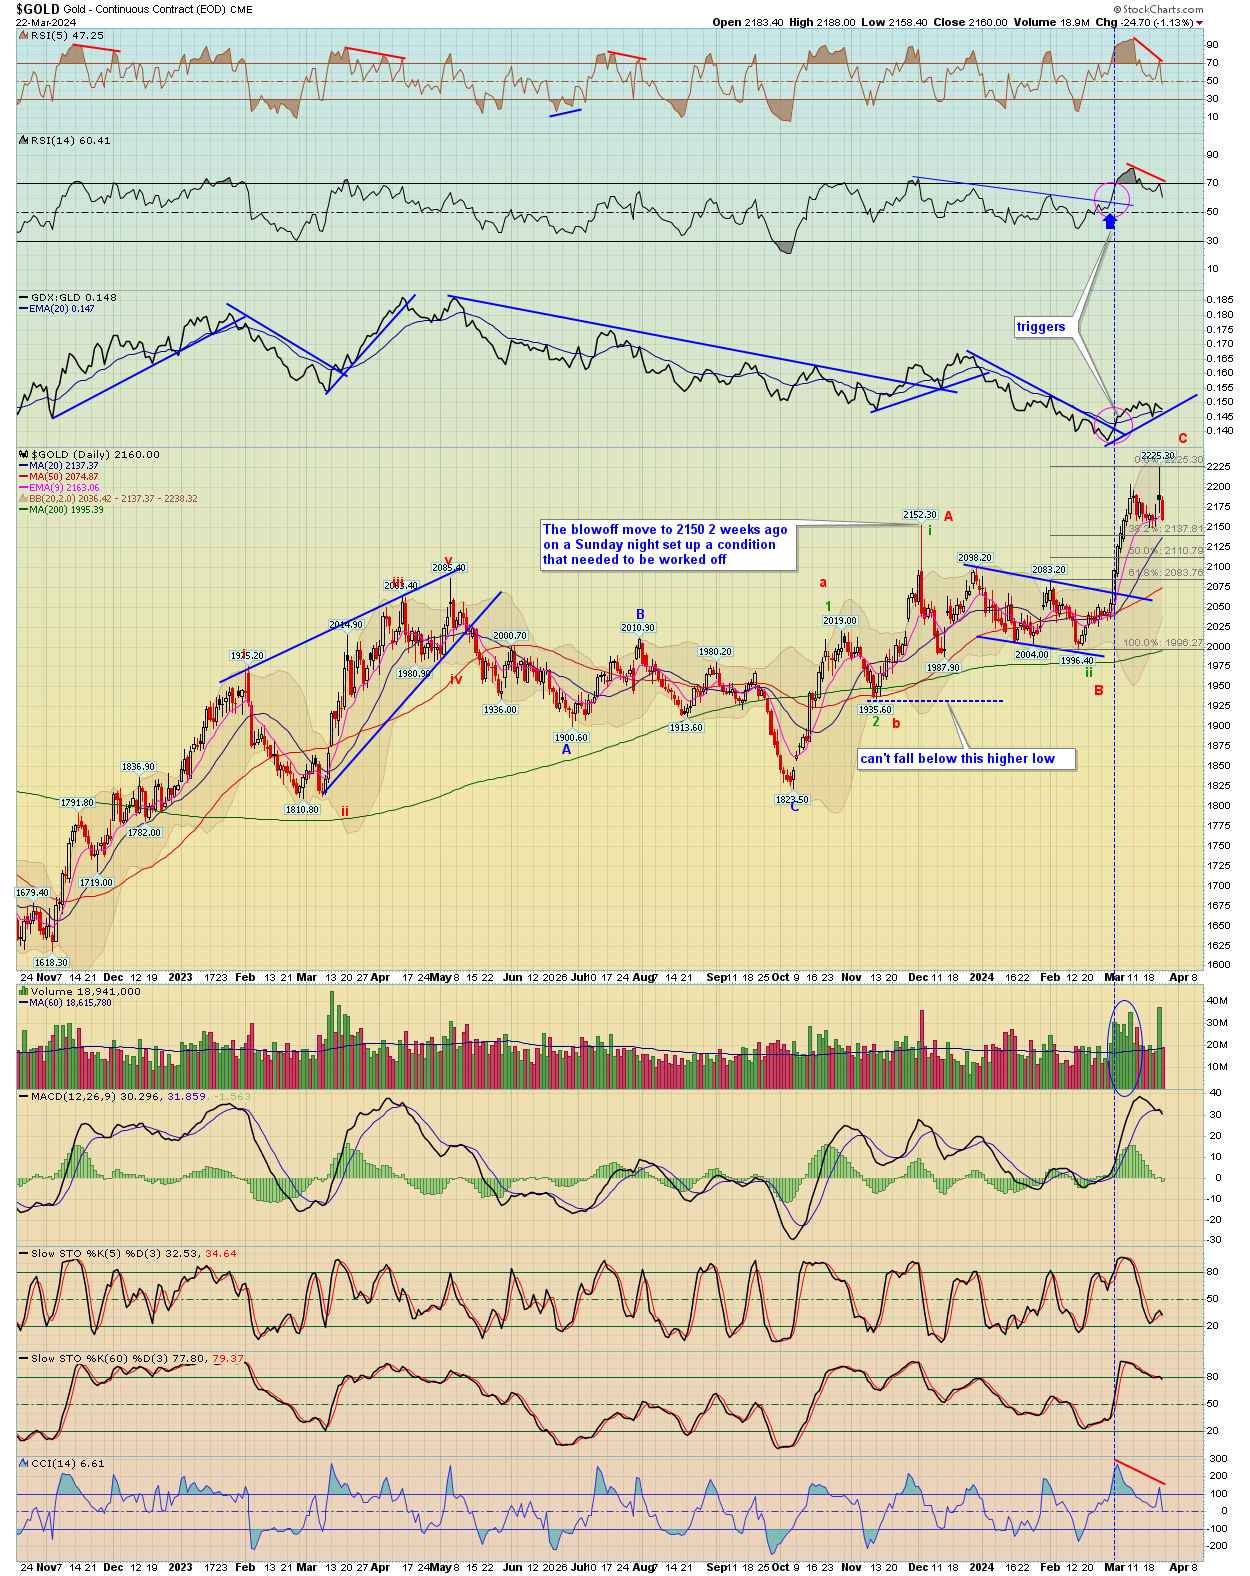
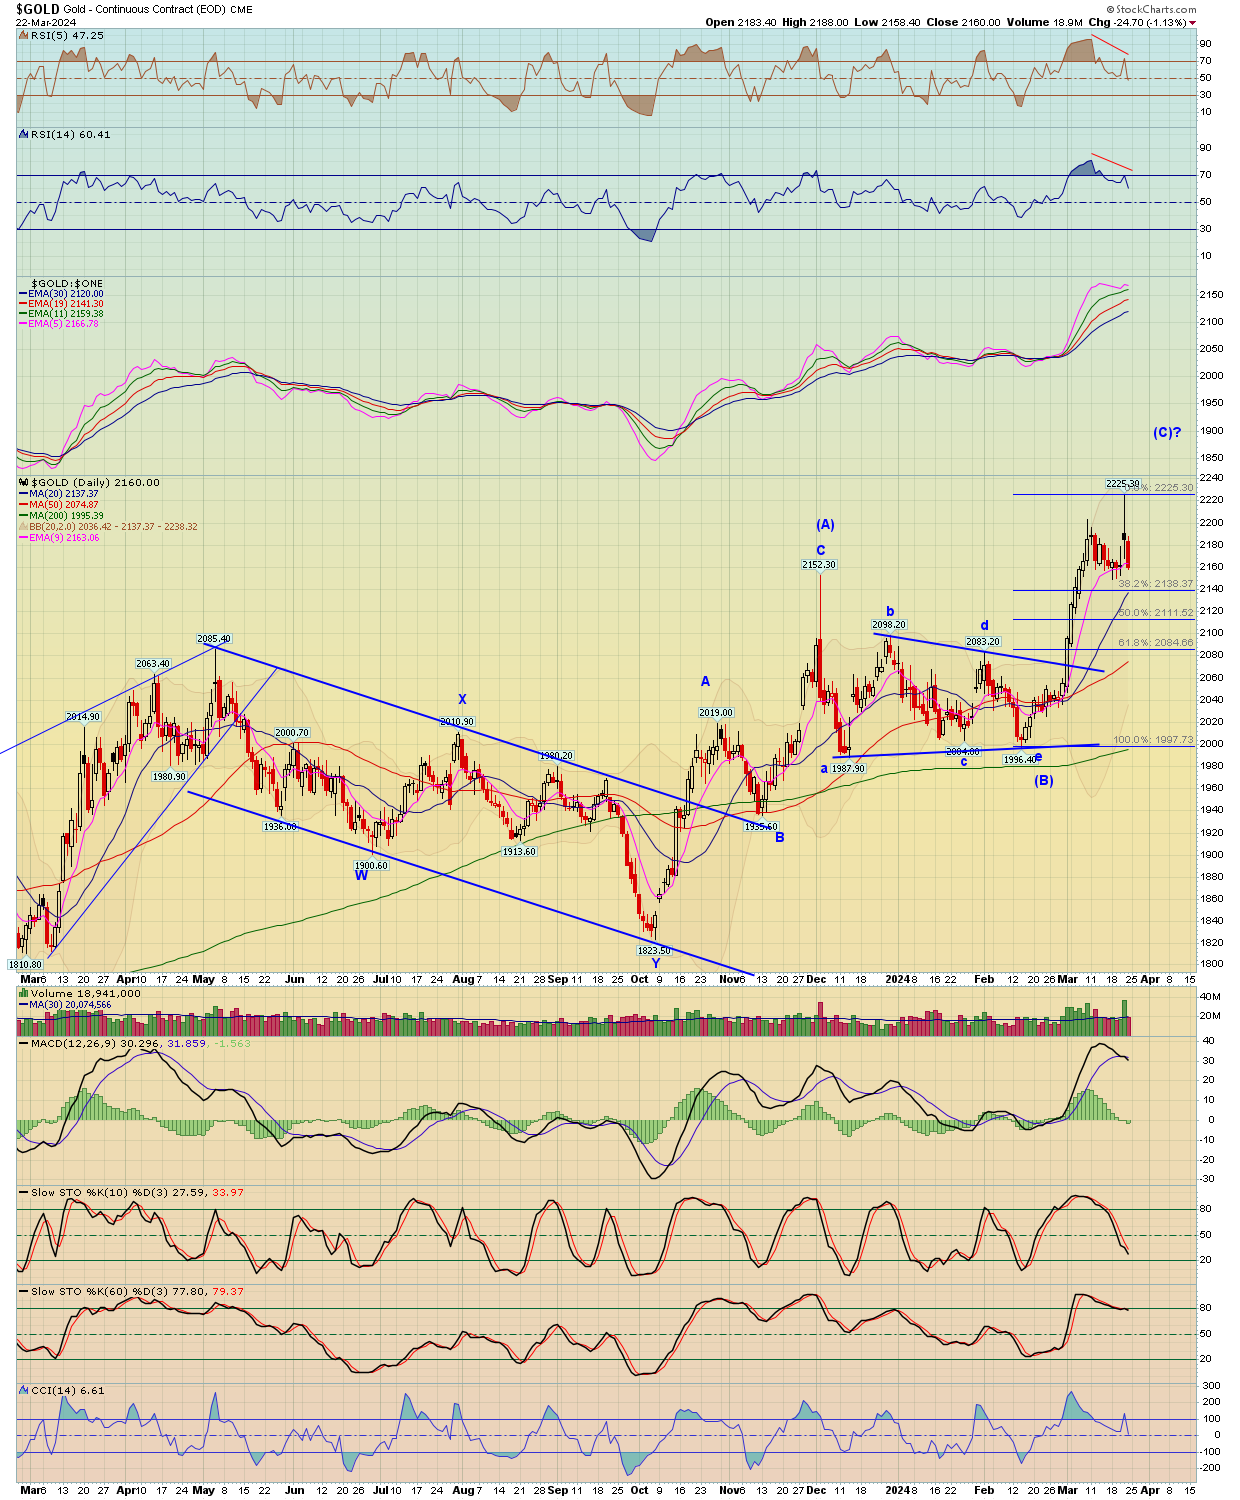
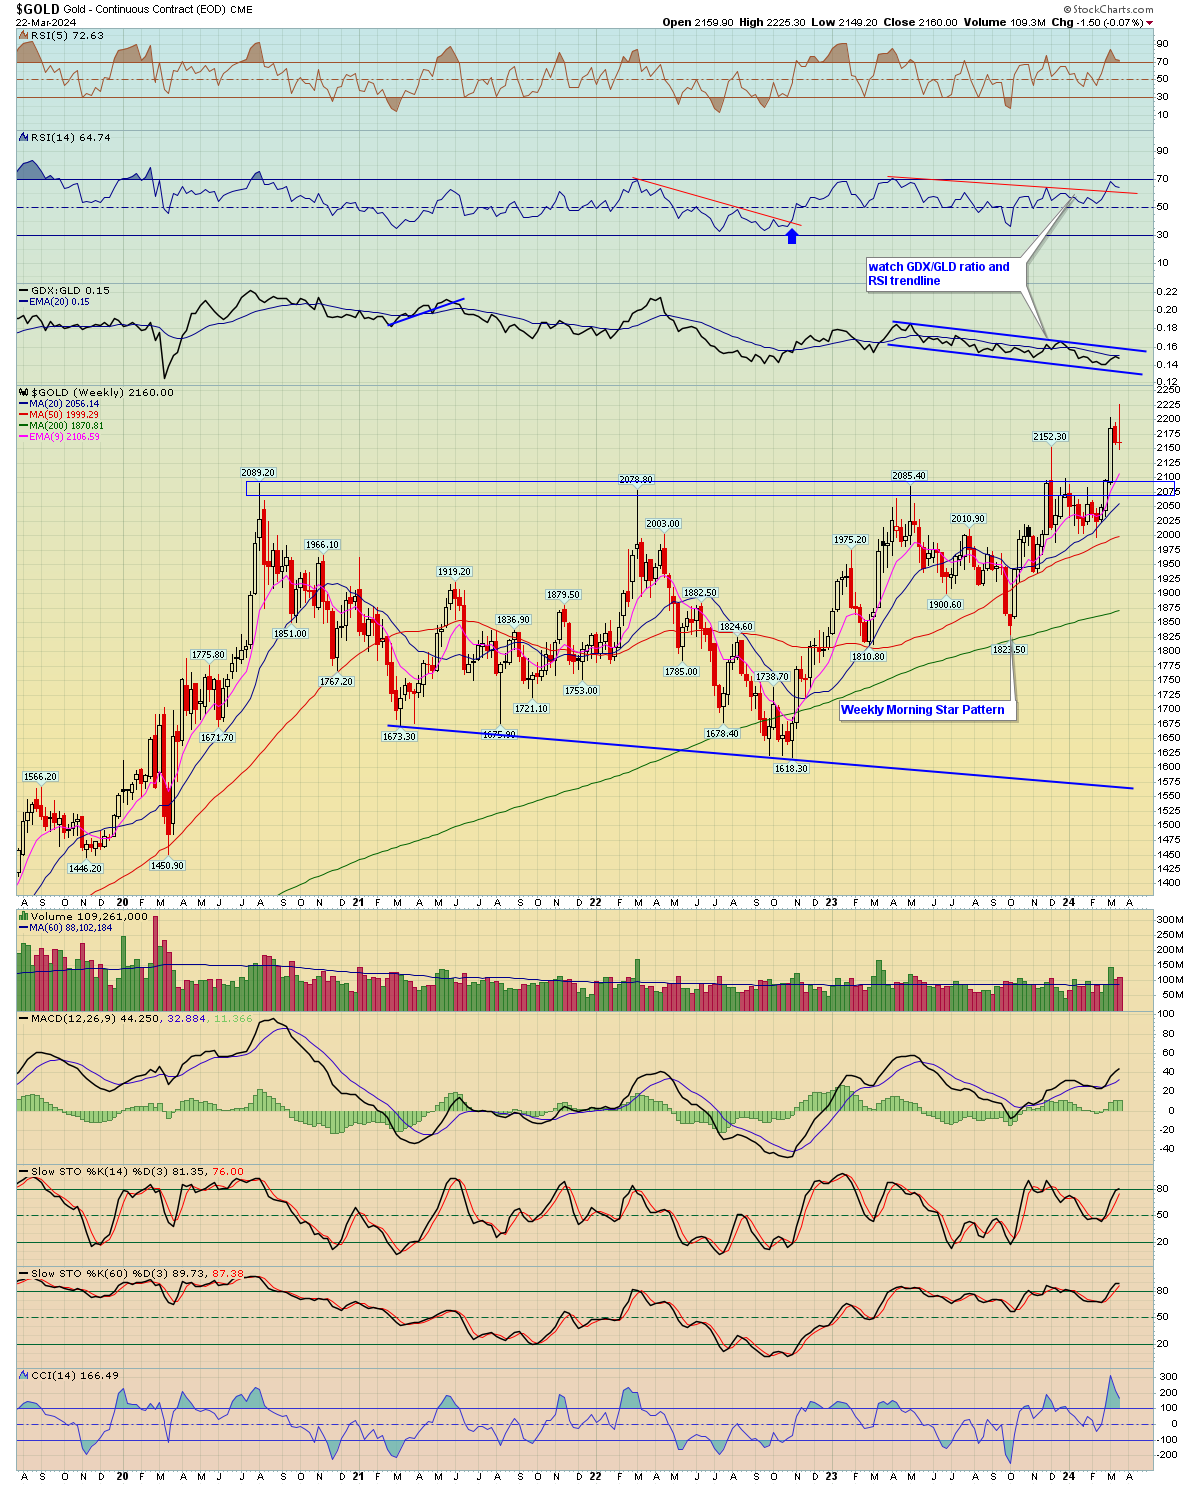
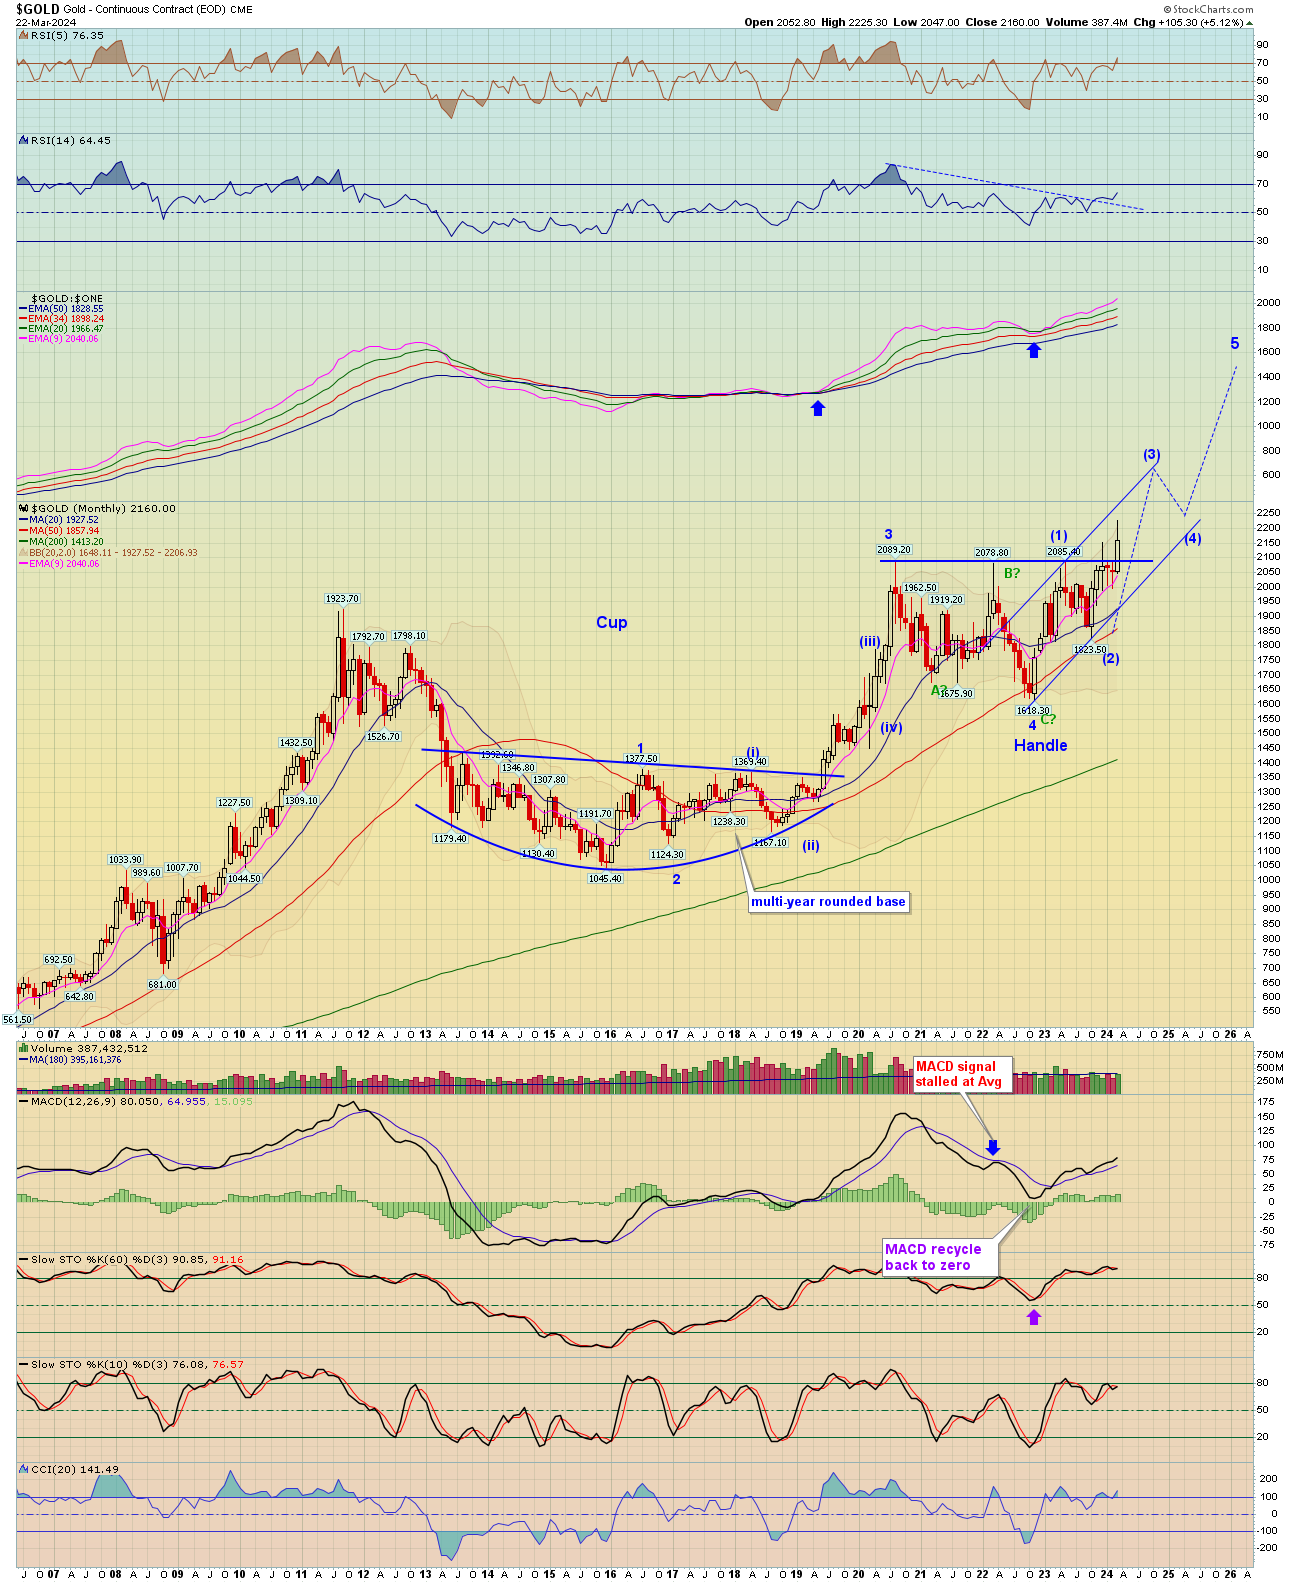
- Gold spiked to a high of 2225 before pulling back and closing at 2160. The daily chart of gold made a divergent high on that last push
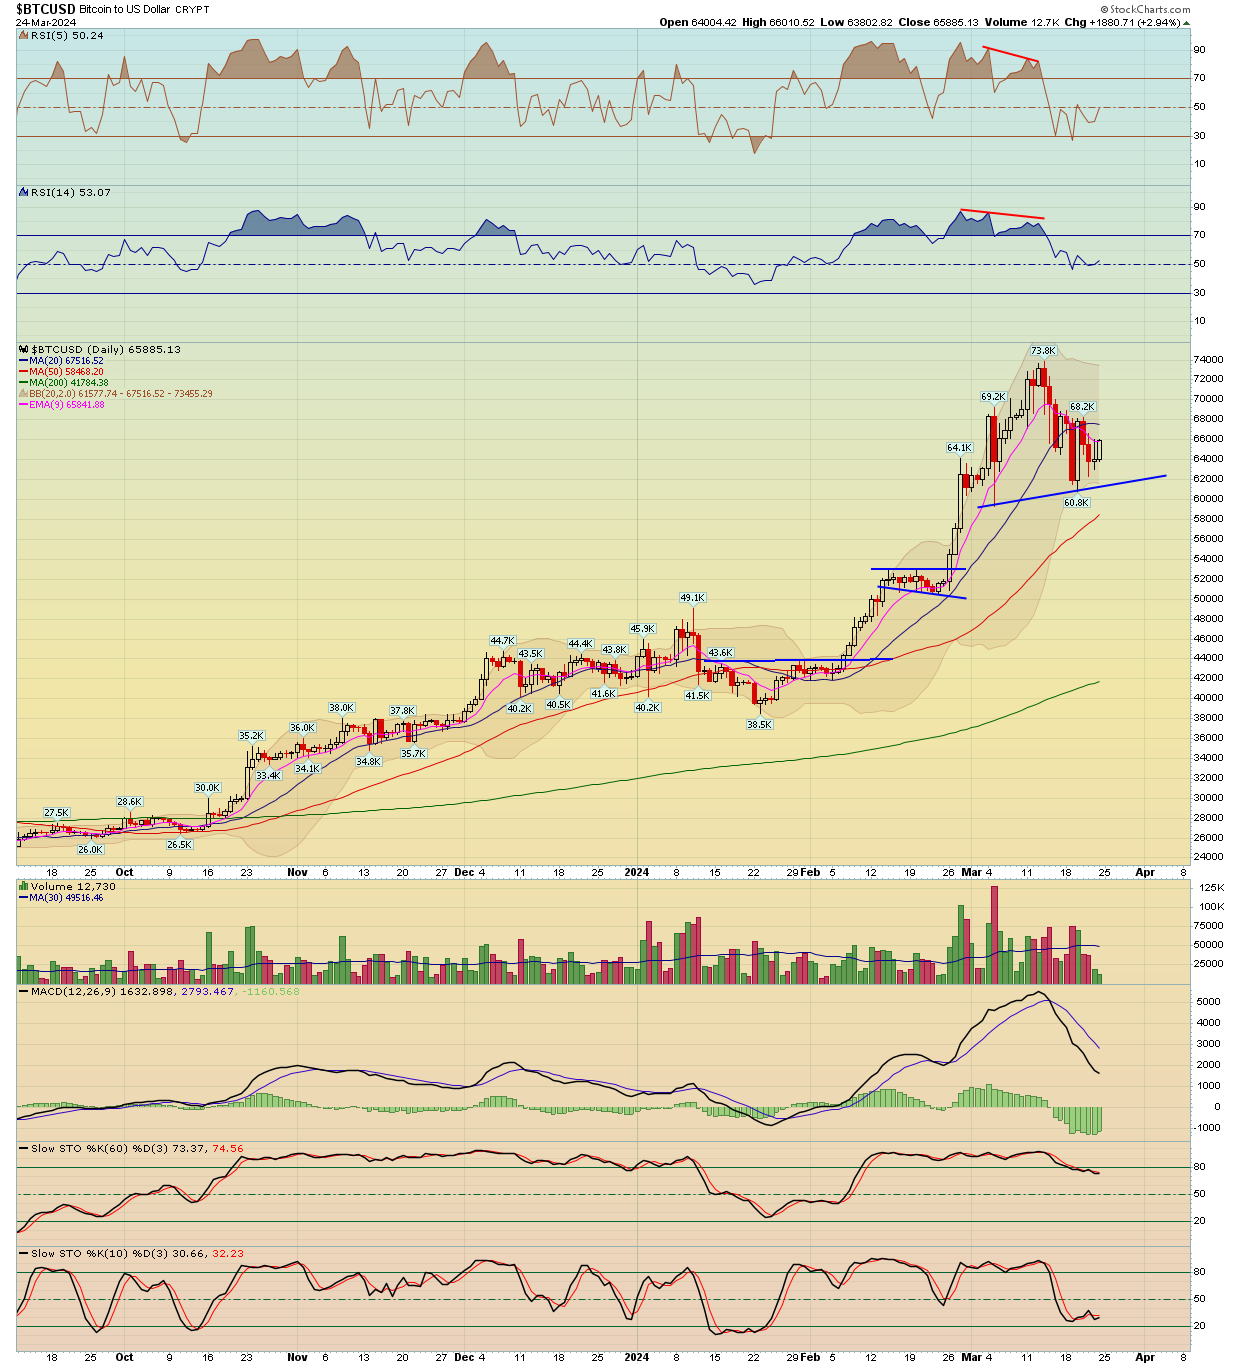
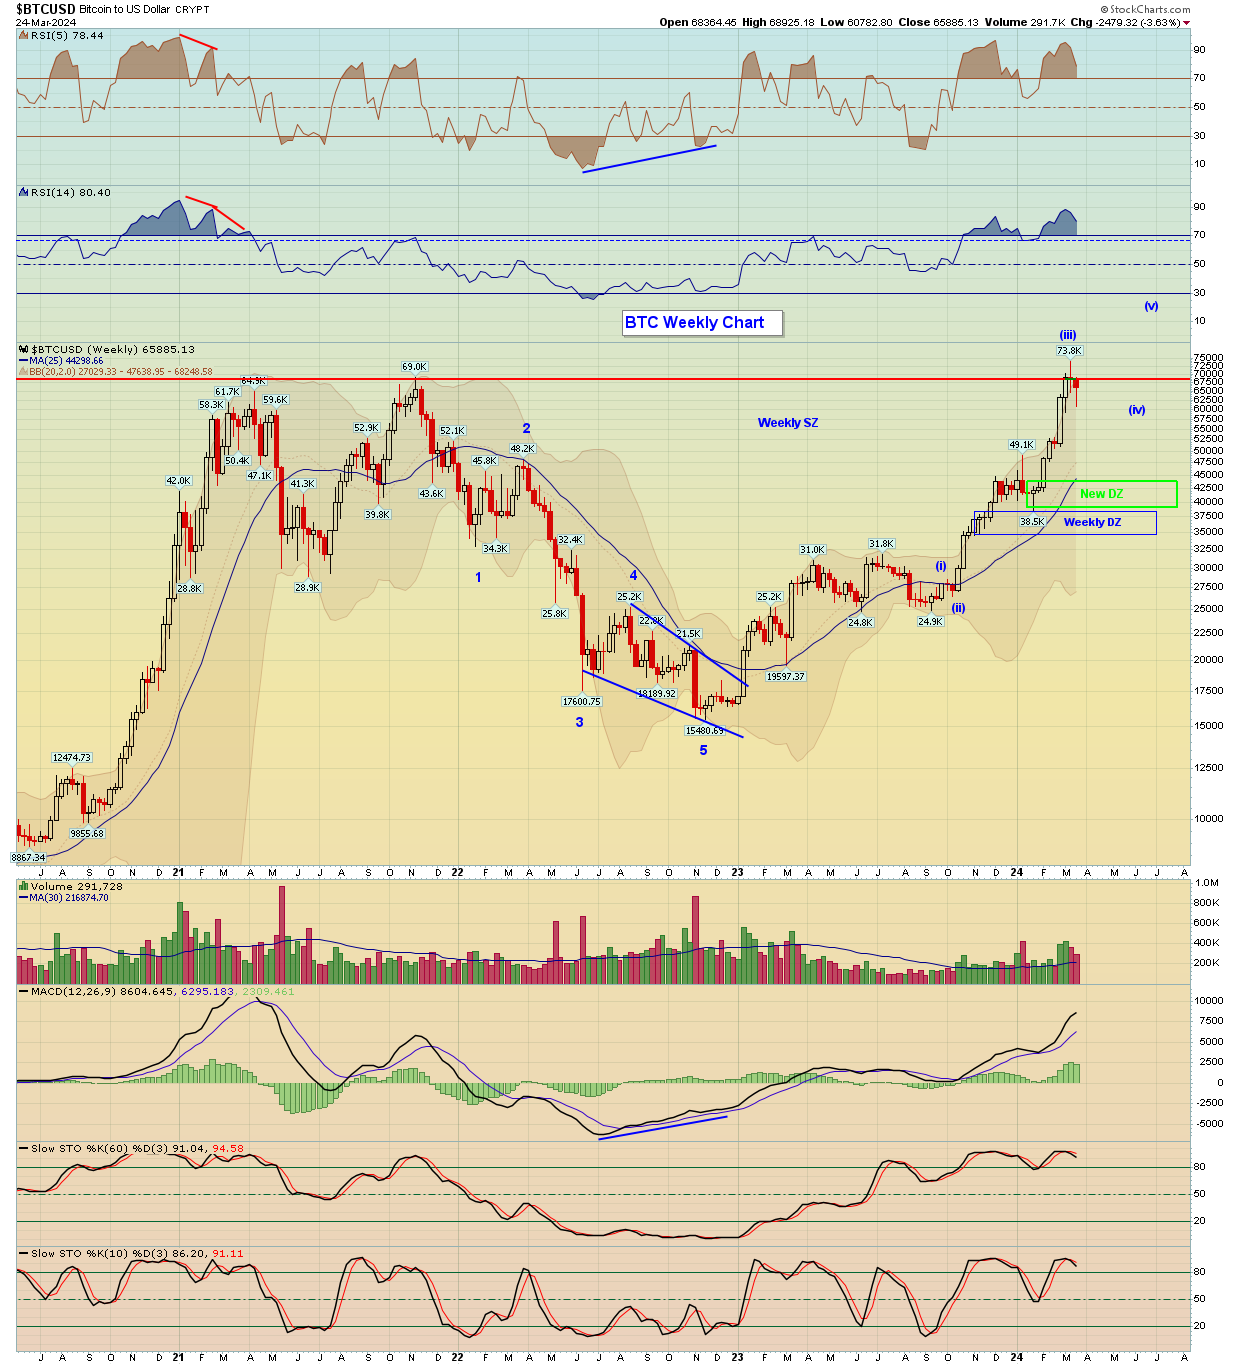
- Bitcoin formed a weekly doji candle last week and last week lost -4.4%
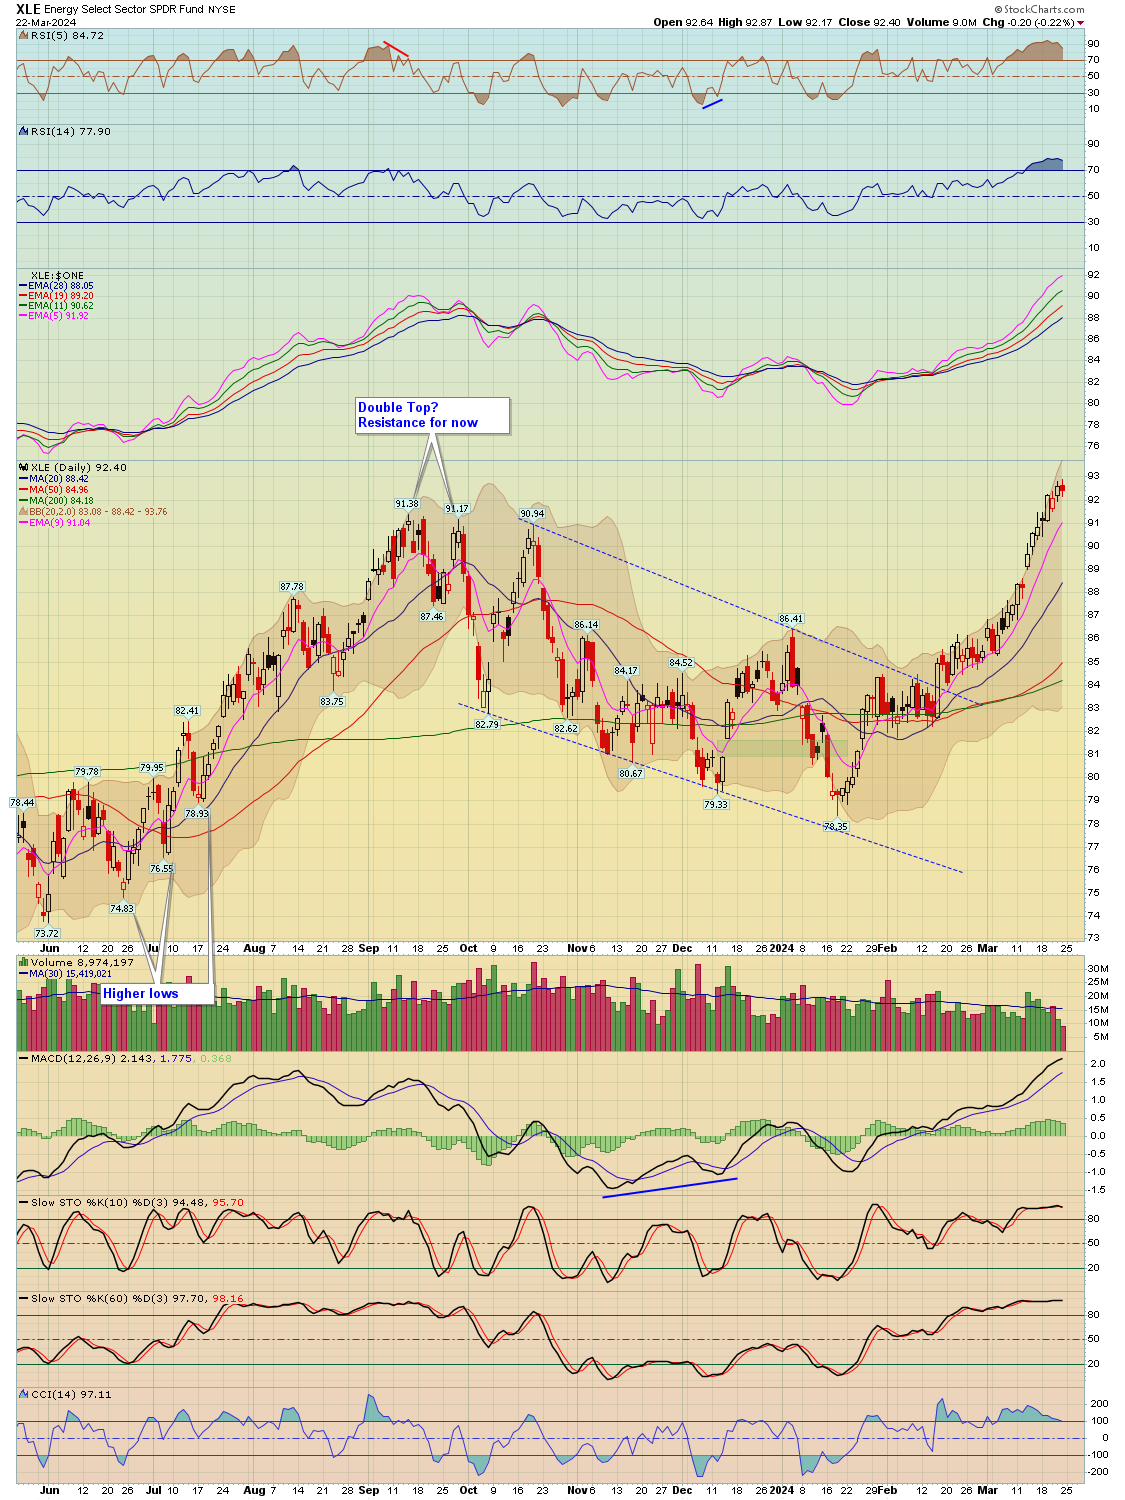
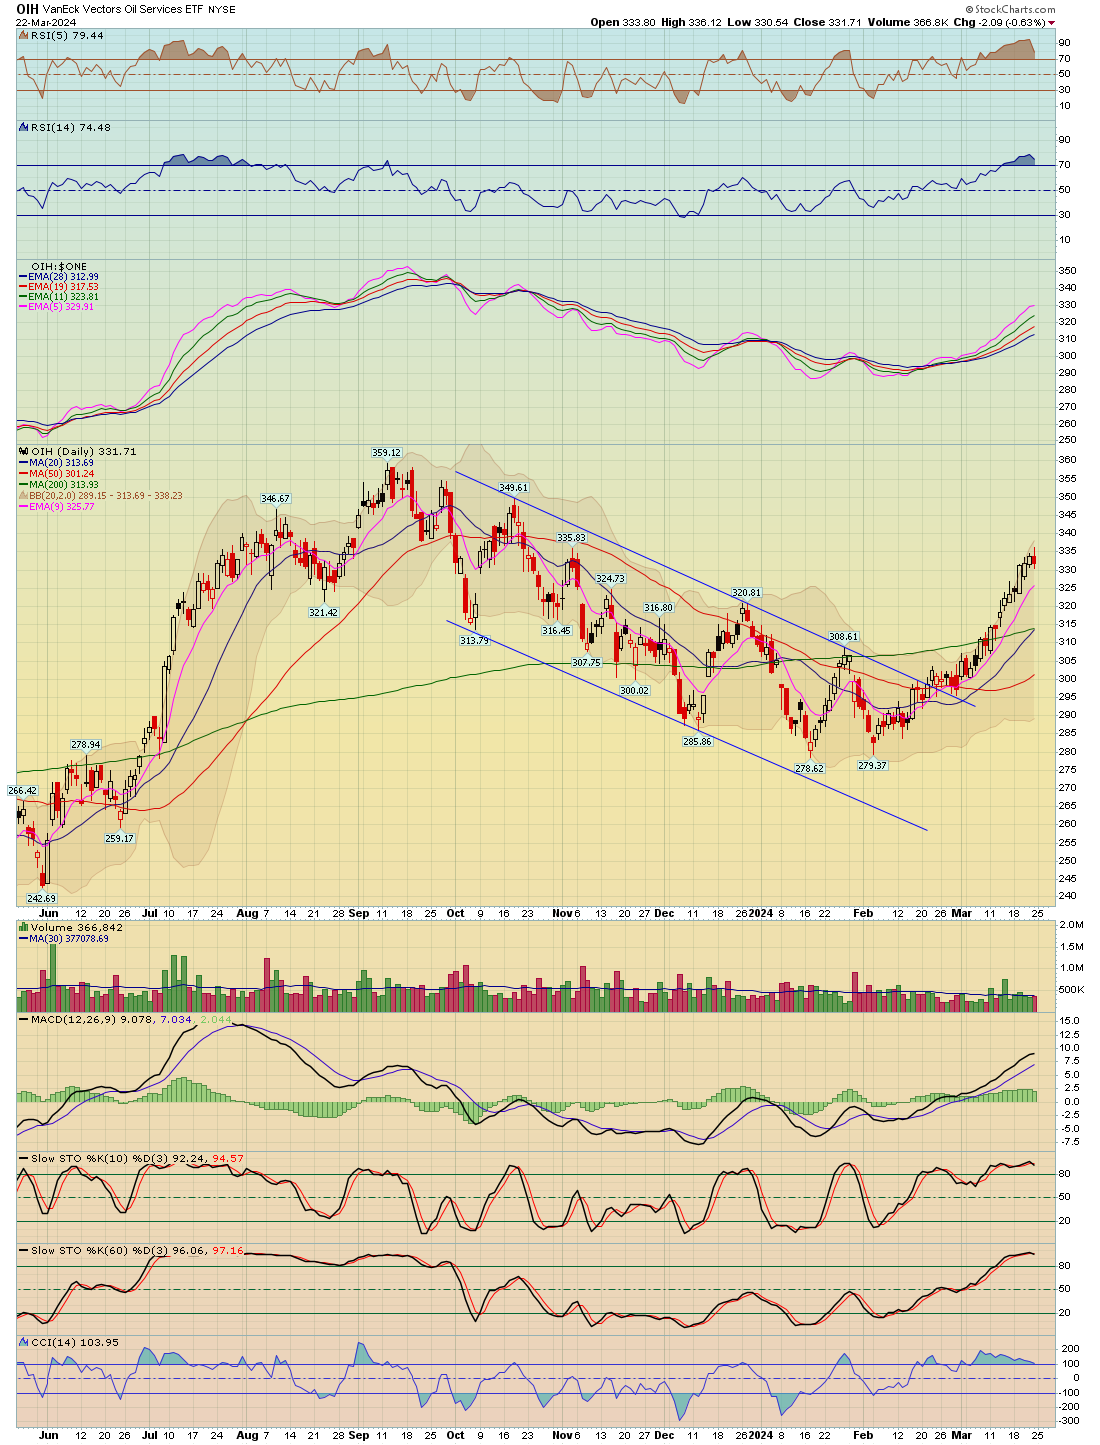
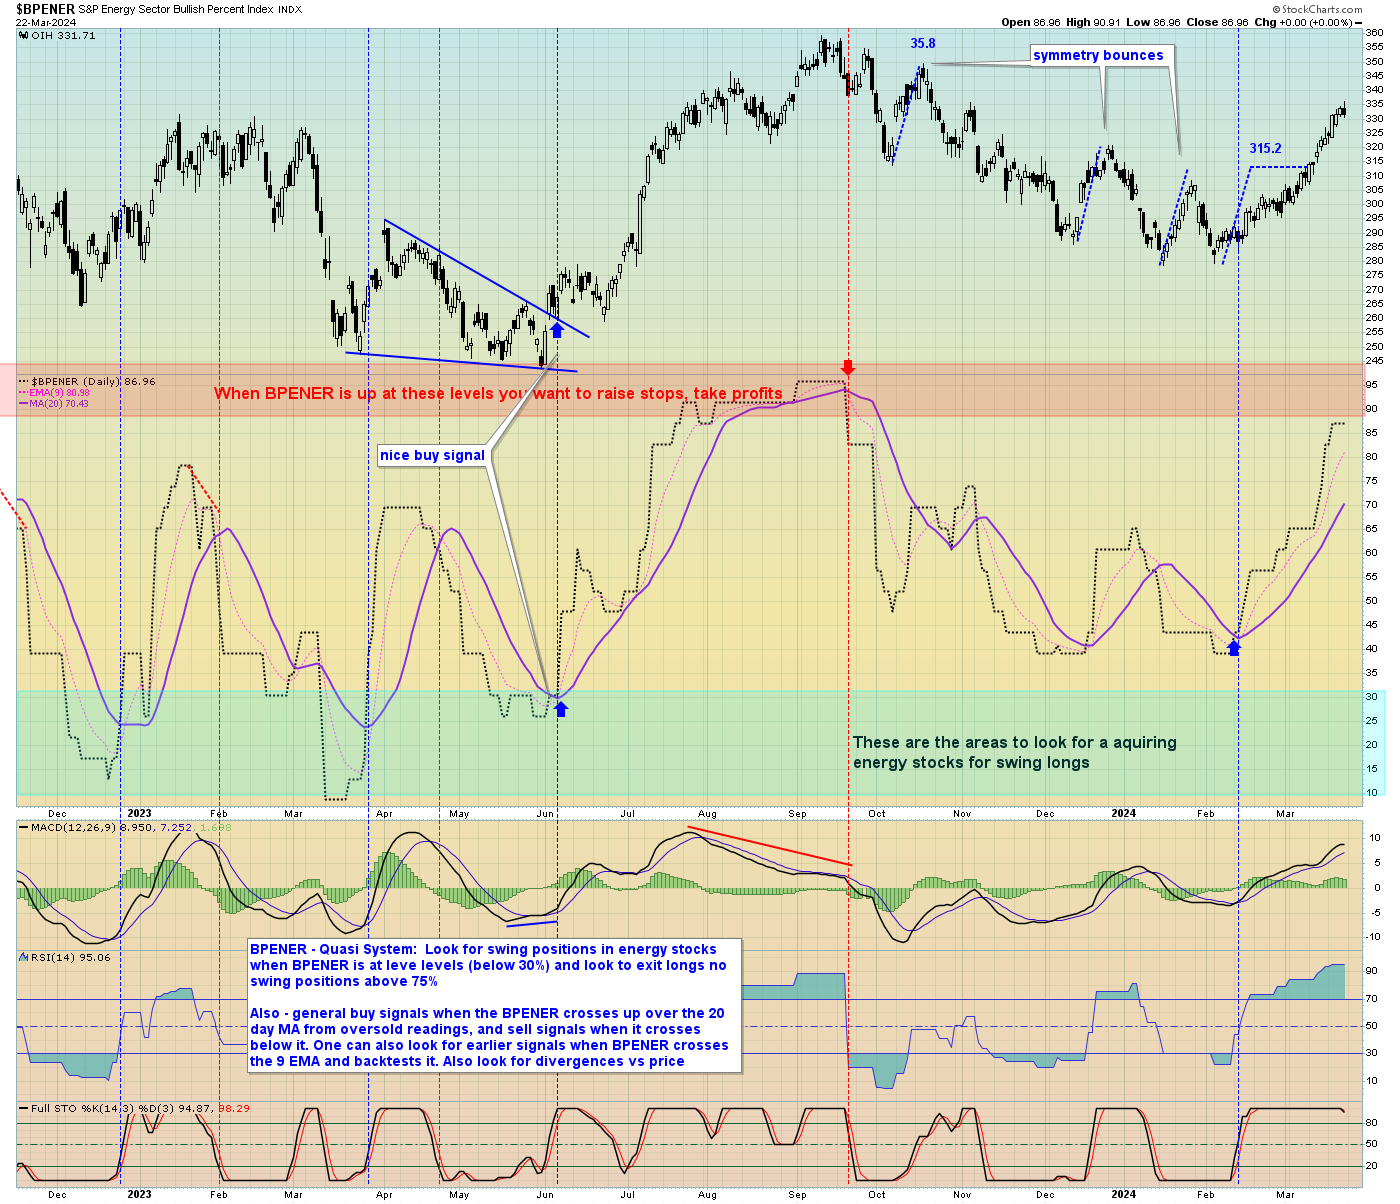
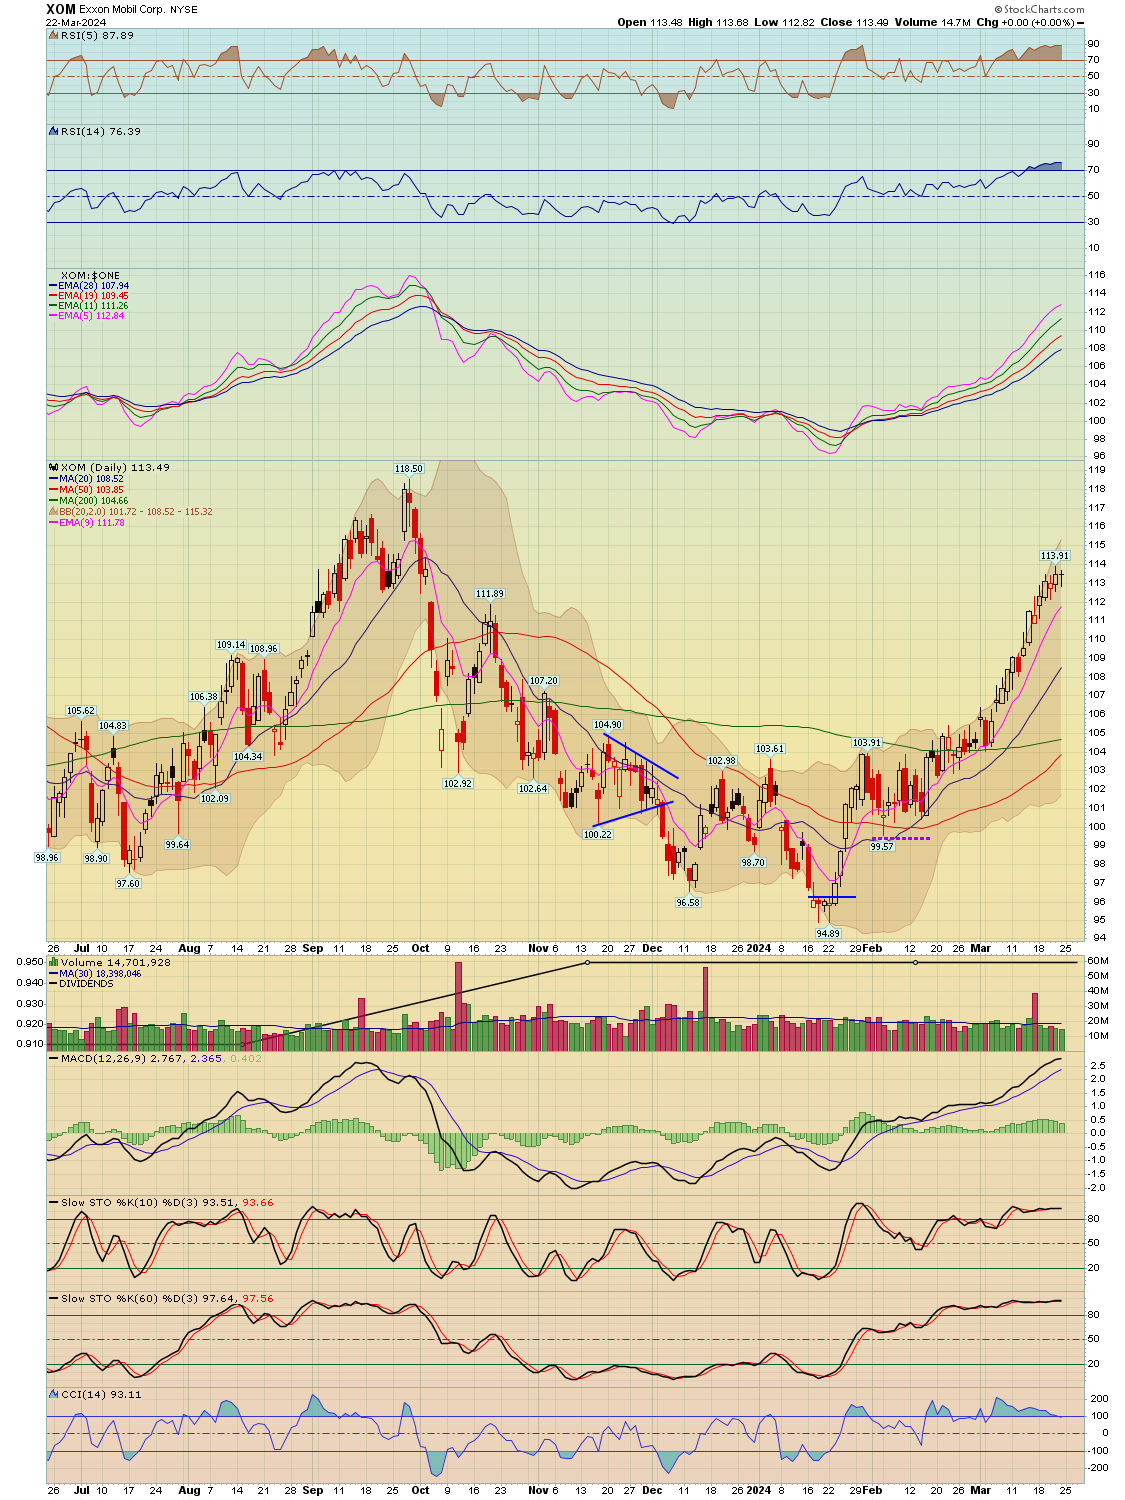
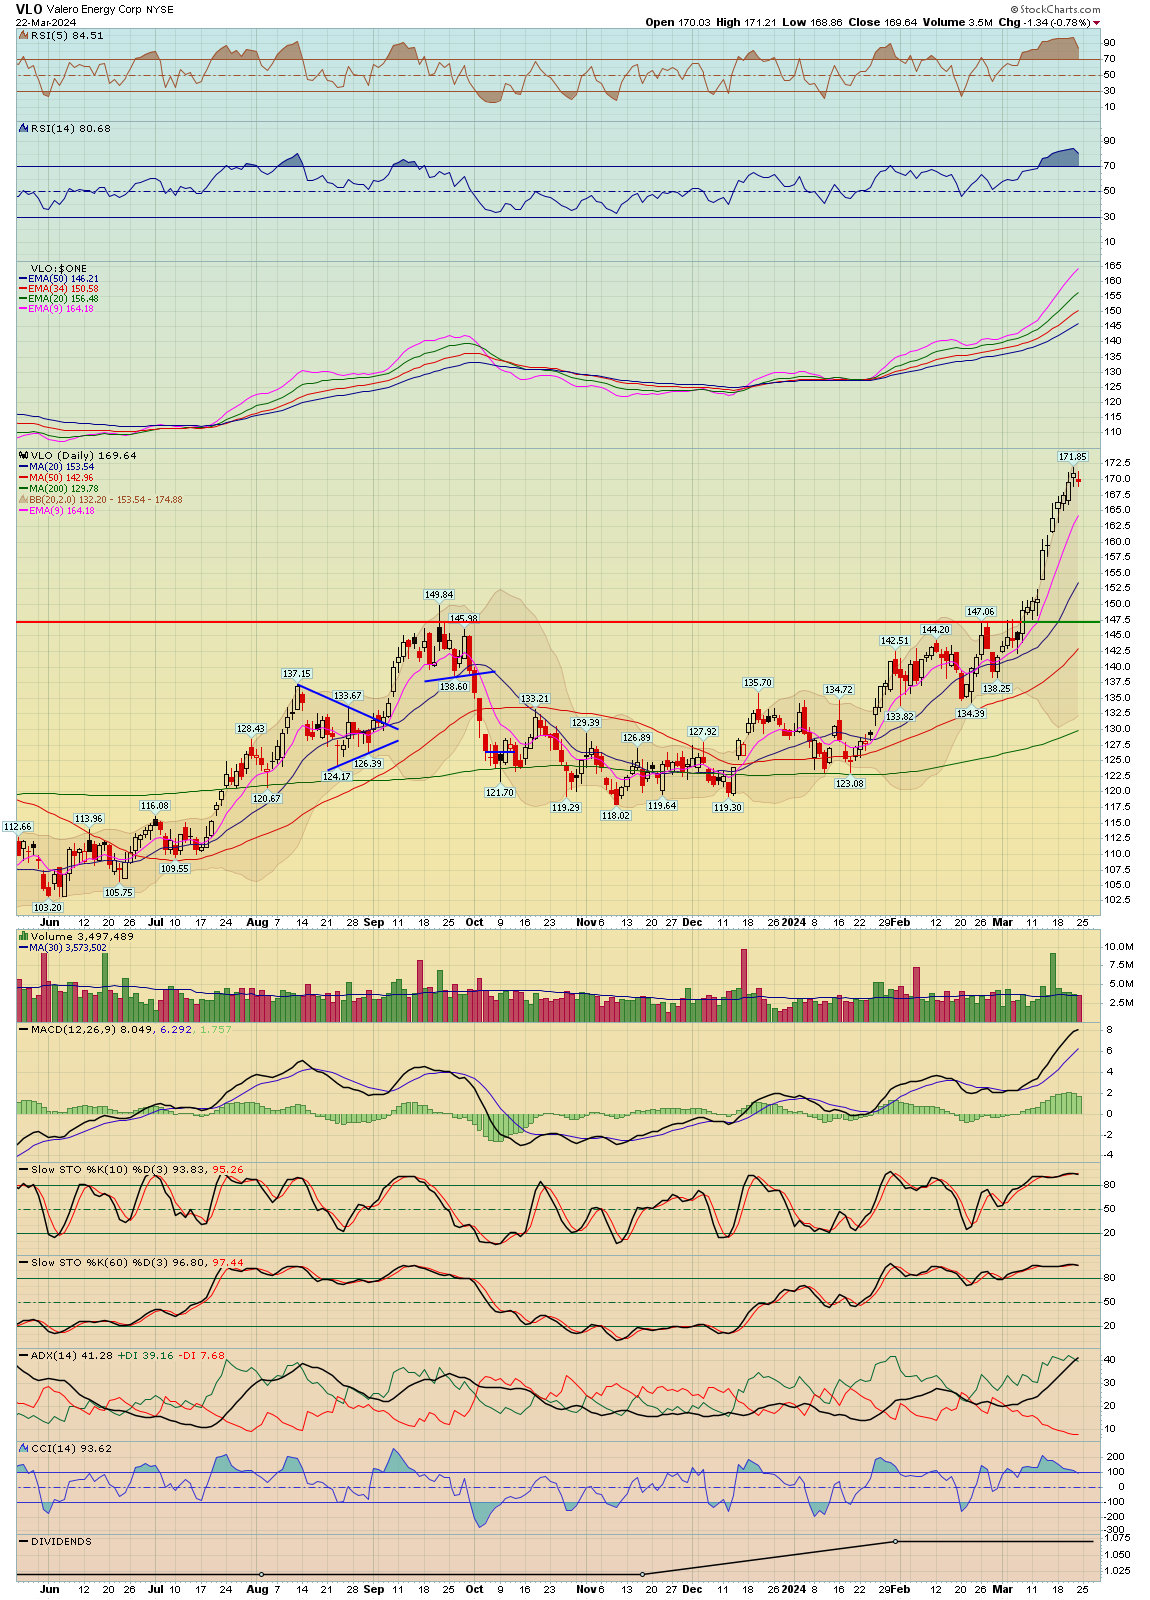
- Energy Stocks once again had a great week but may be getting extended here
Economic News This week:
New Home Sales - Monday
FHFA Housing Price, S&P Case Shiller, Consumer Confidence - Tuesday
MBA Mortgage Apps, Crude Inventories - Wednesday
Initial Claims, GDP 3rd Est, Chicago PMI, Pending Home Sales, Nat Gas Inventories - Thursday
-----
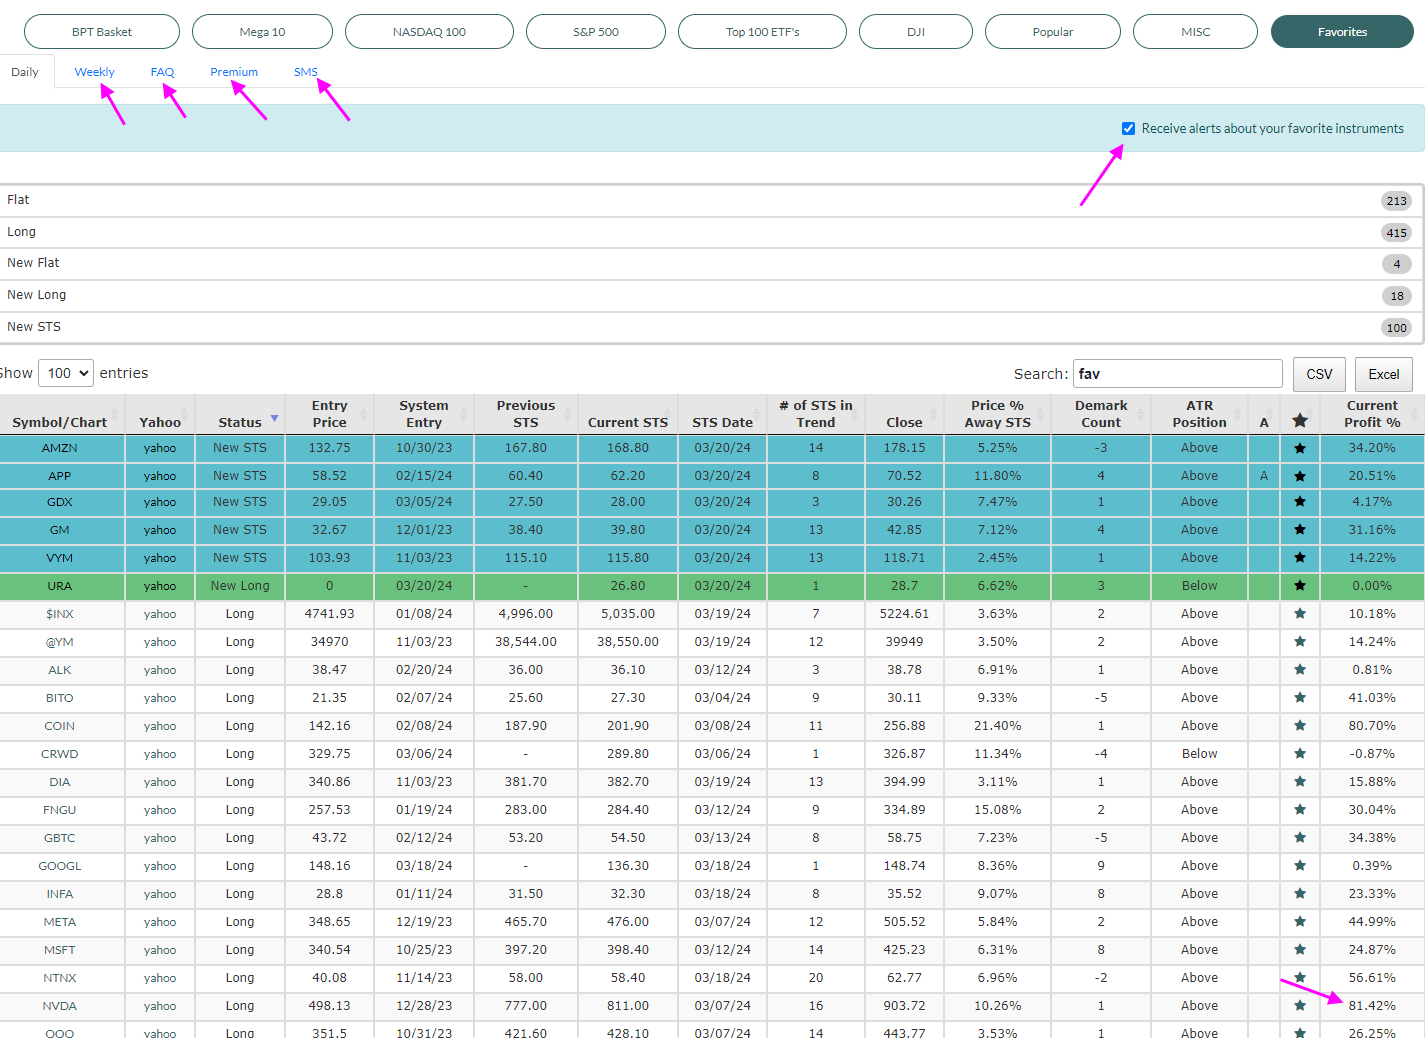
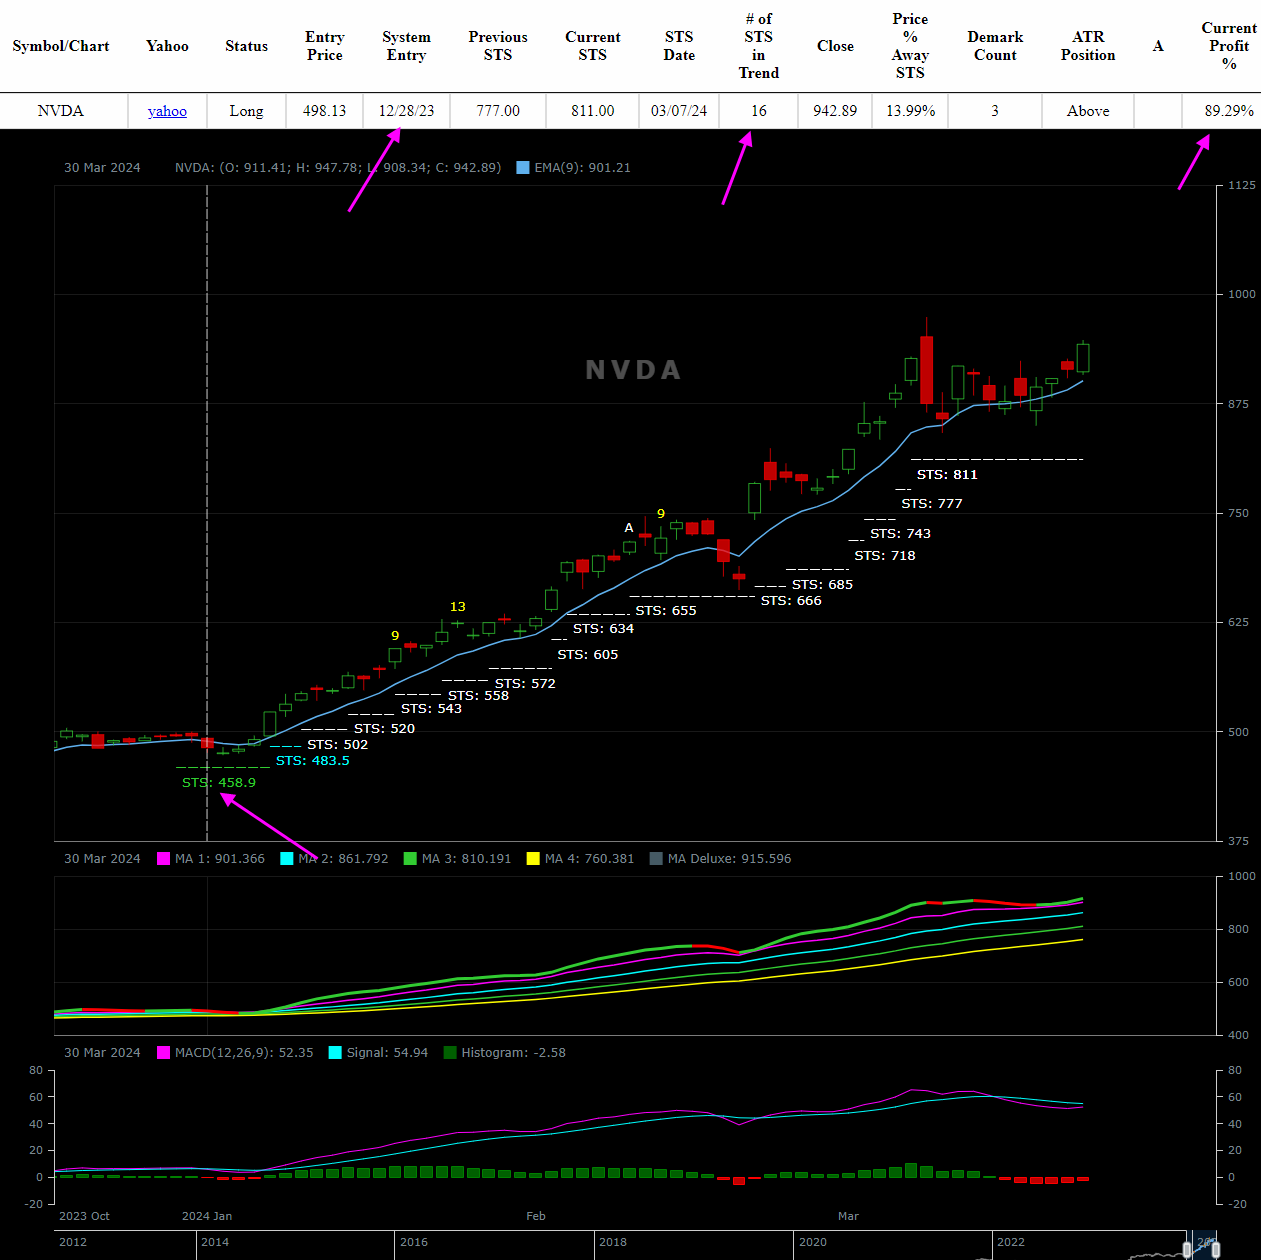
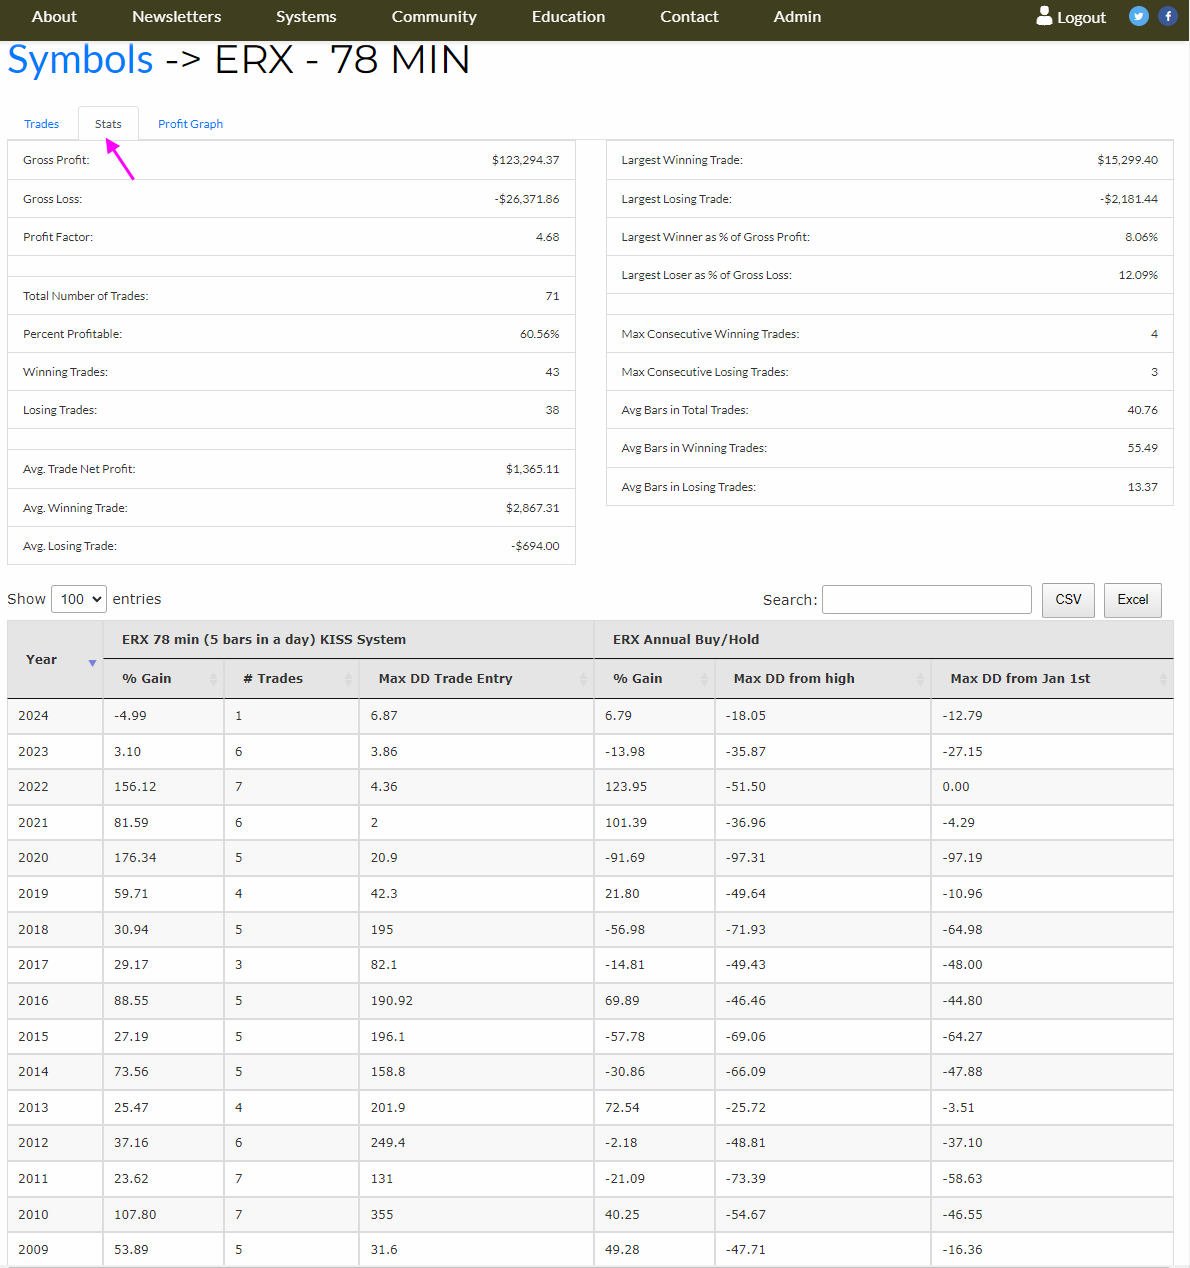
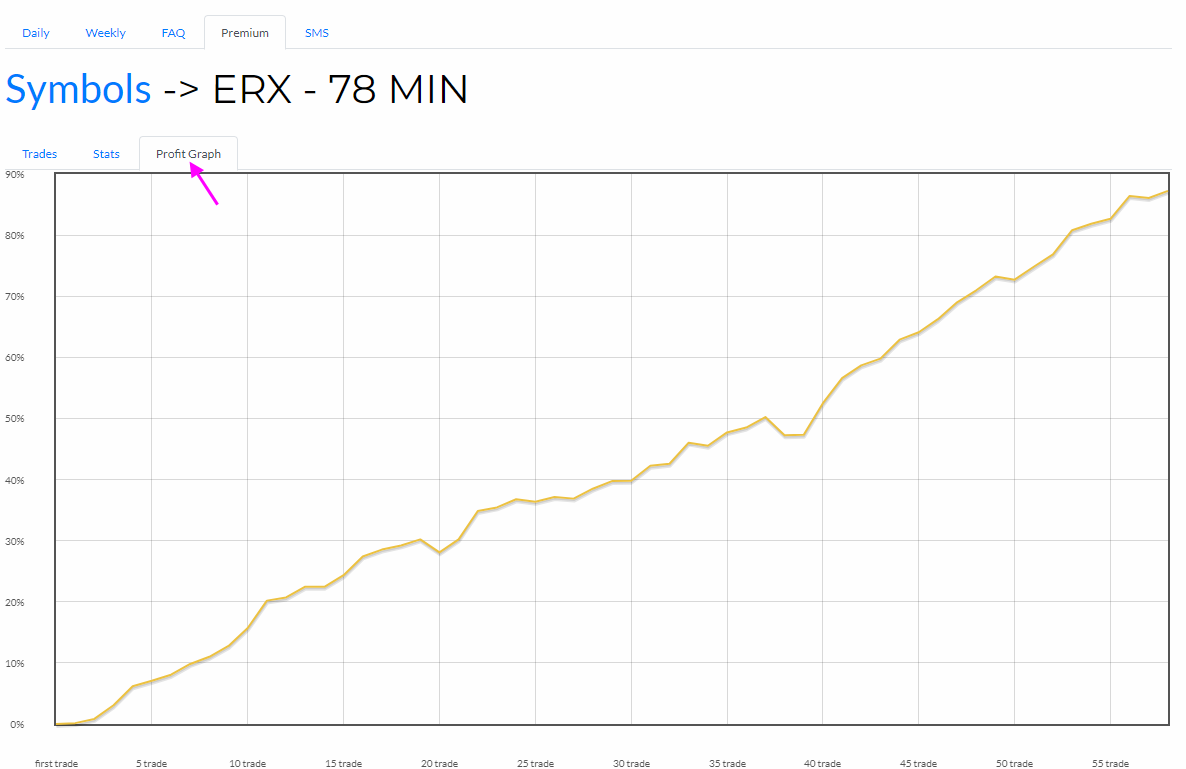
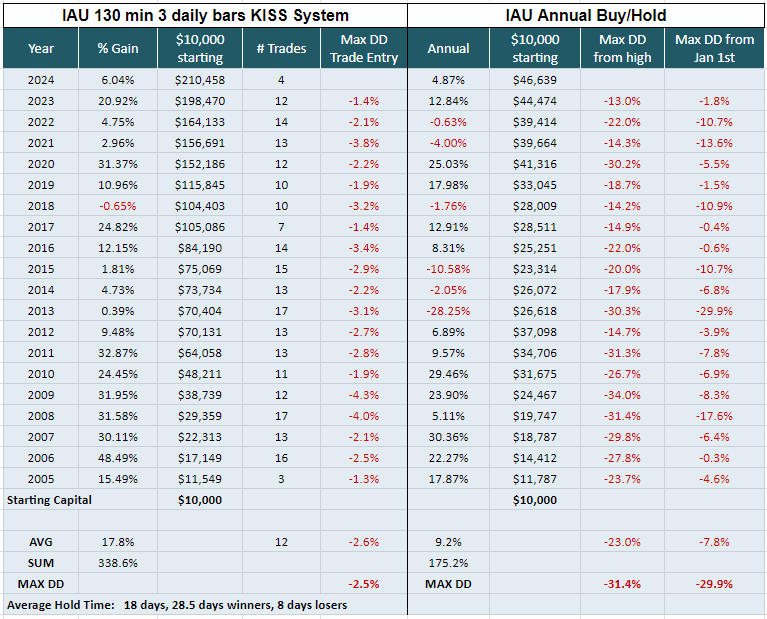
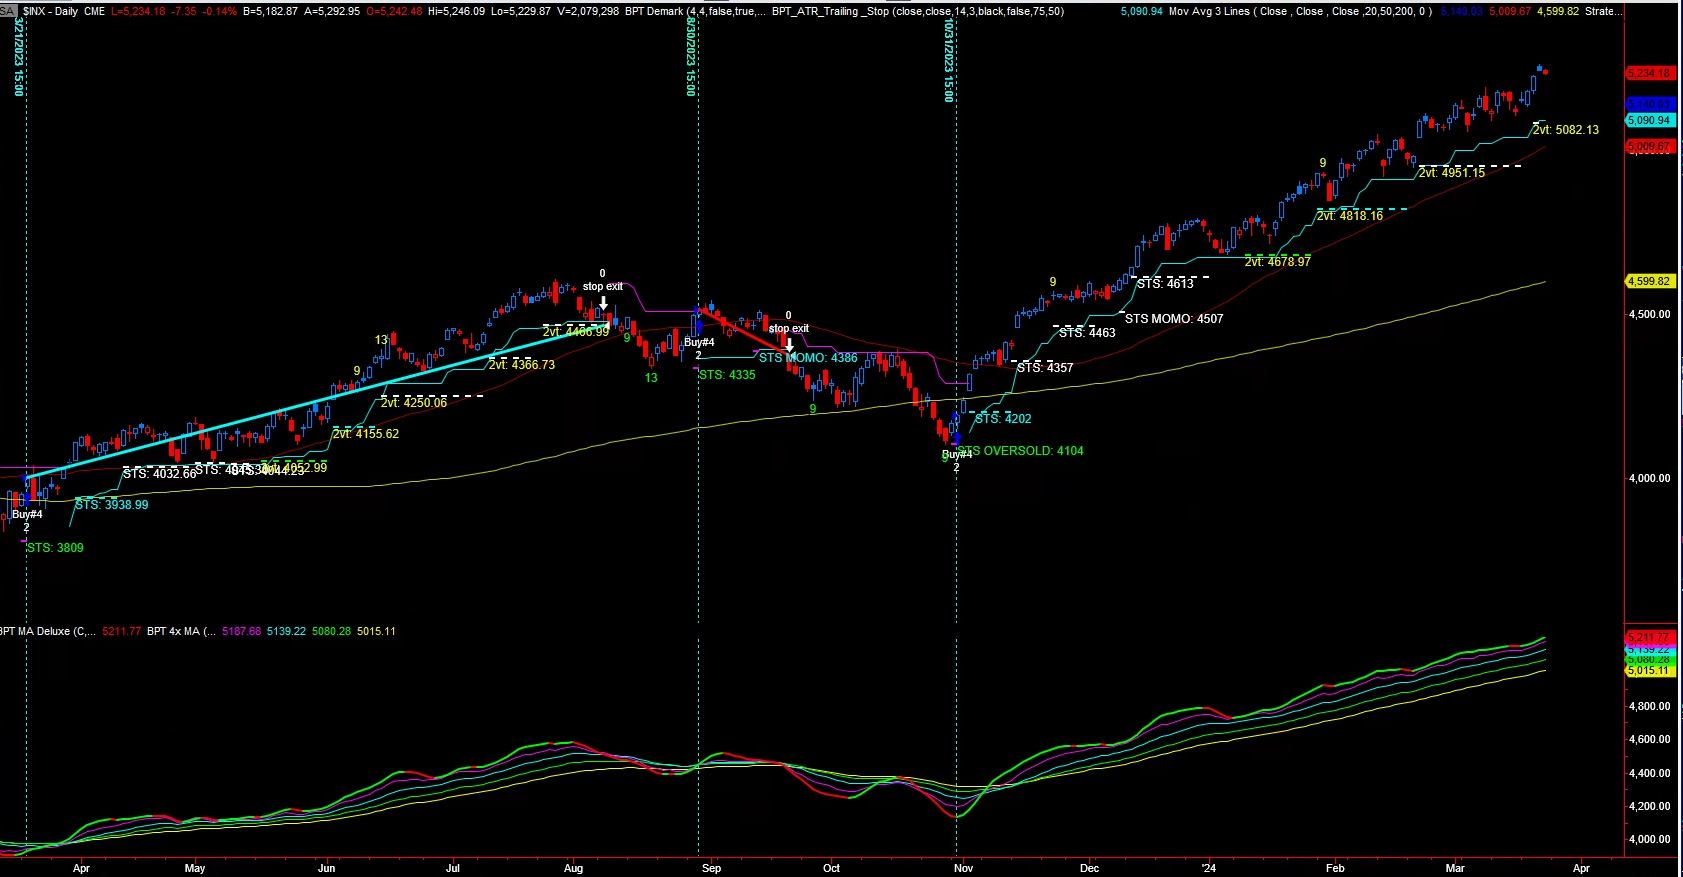
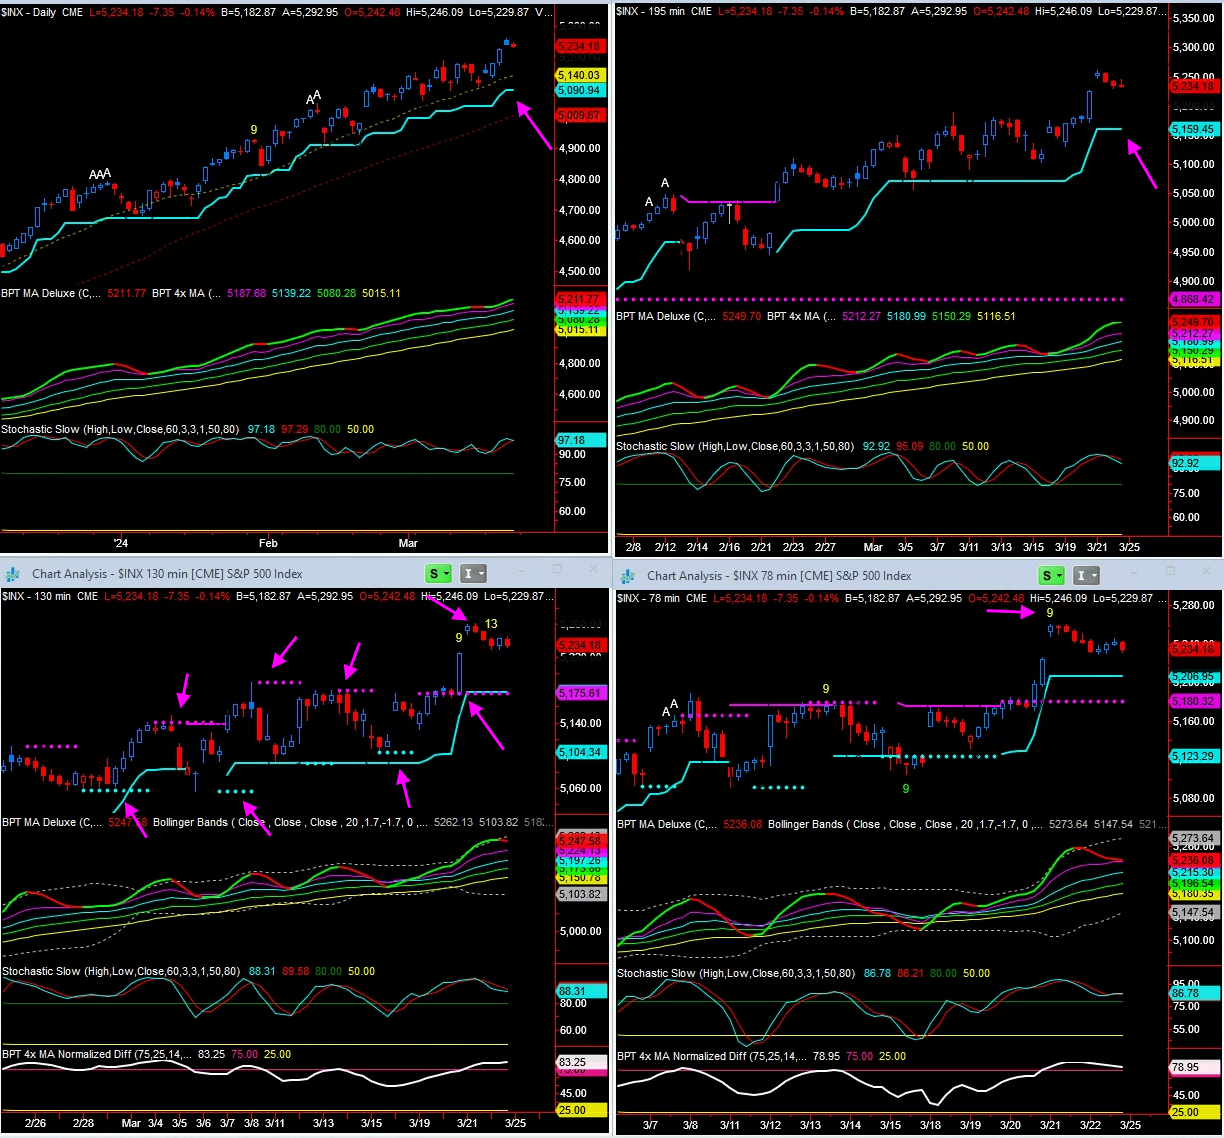
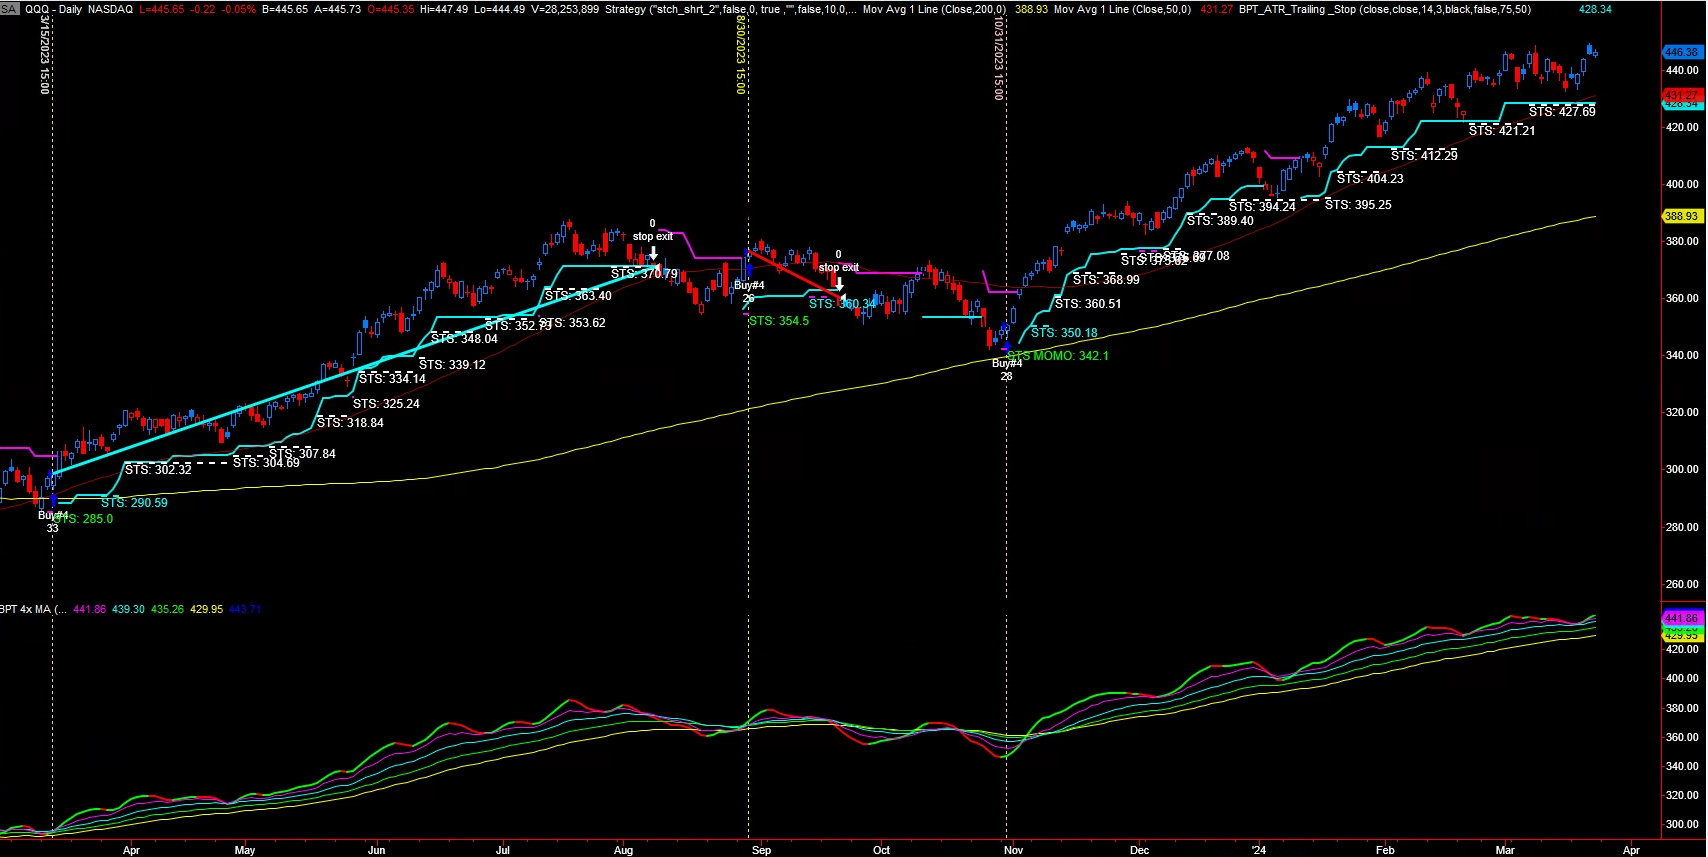
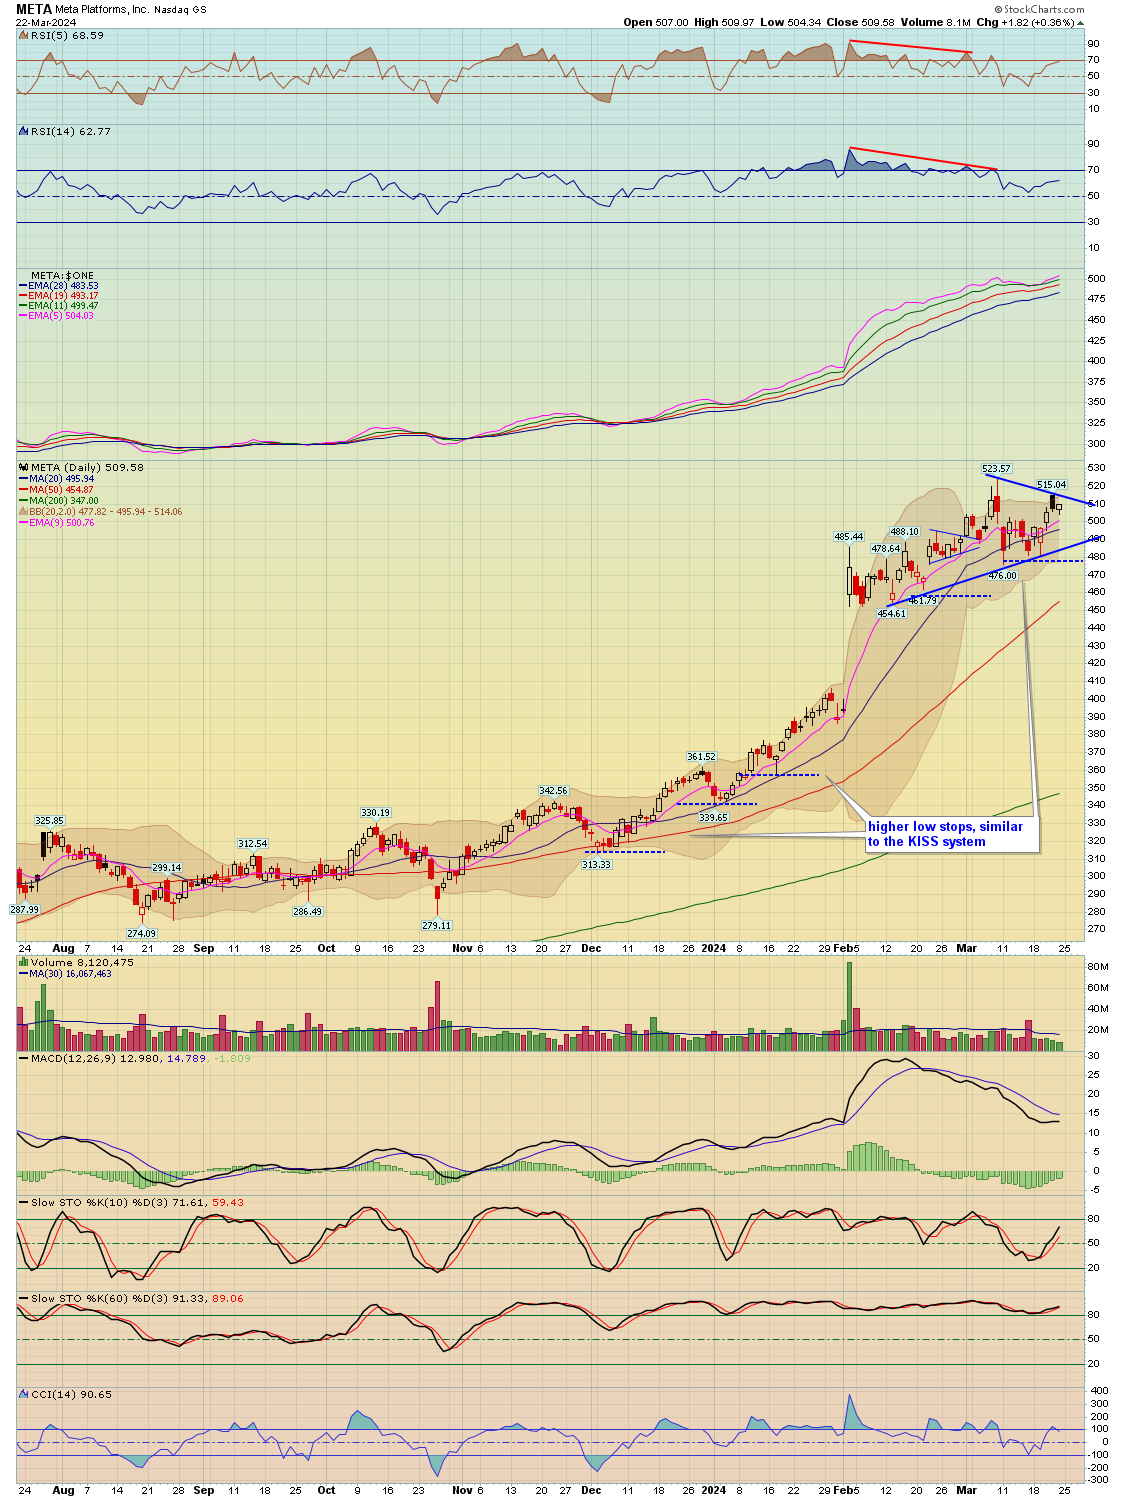
The KISS systems continue to kick ass! The nice thing about the KISS systems is that they allow us to follow the trend, but with a protective stop, sort of like life insurance for your portfolio.
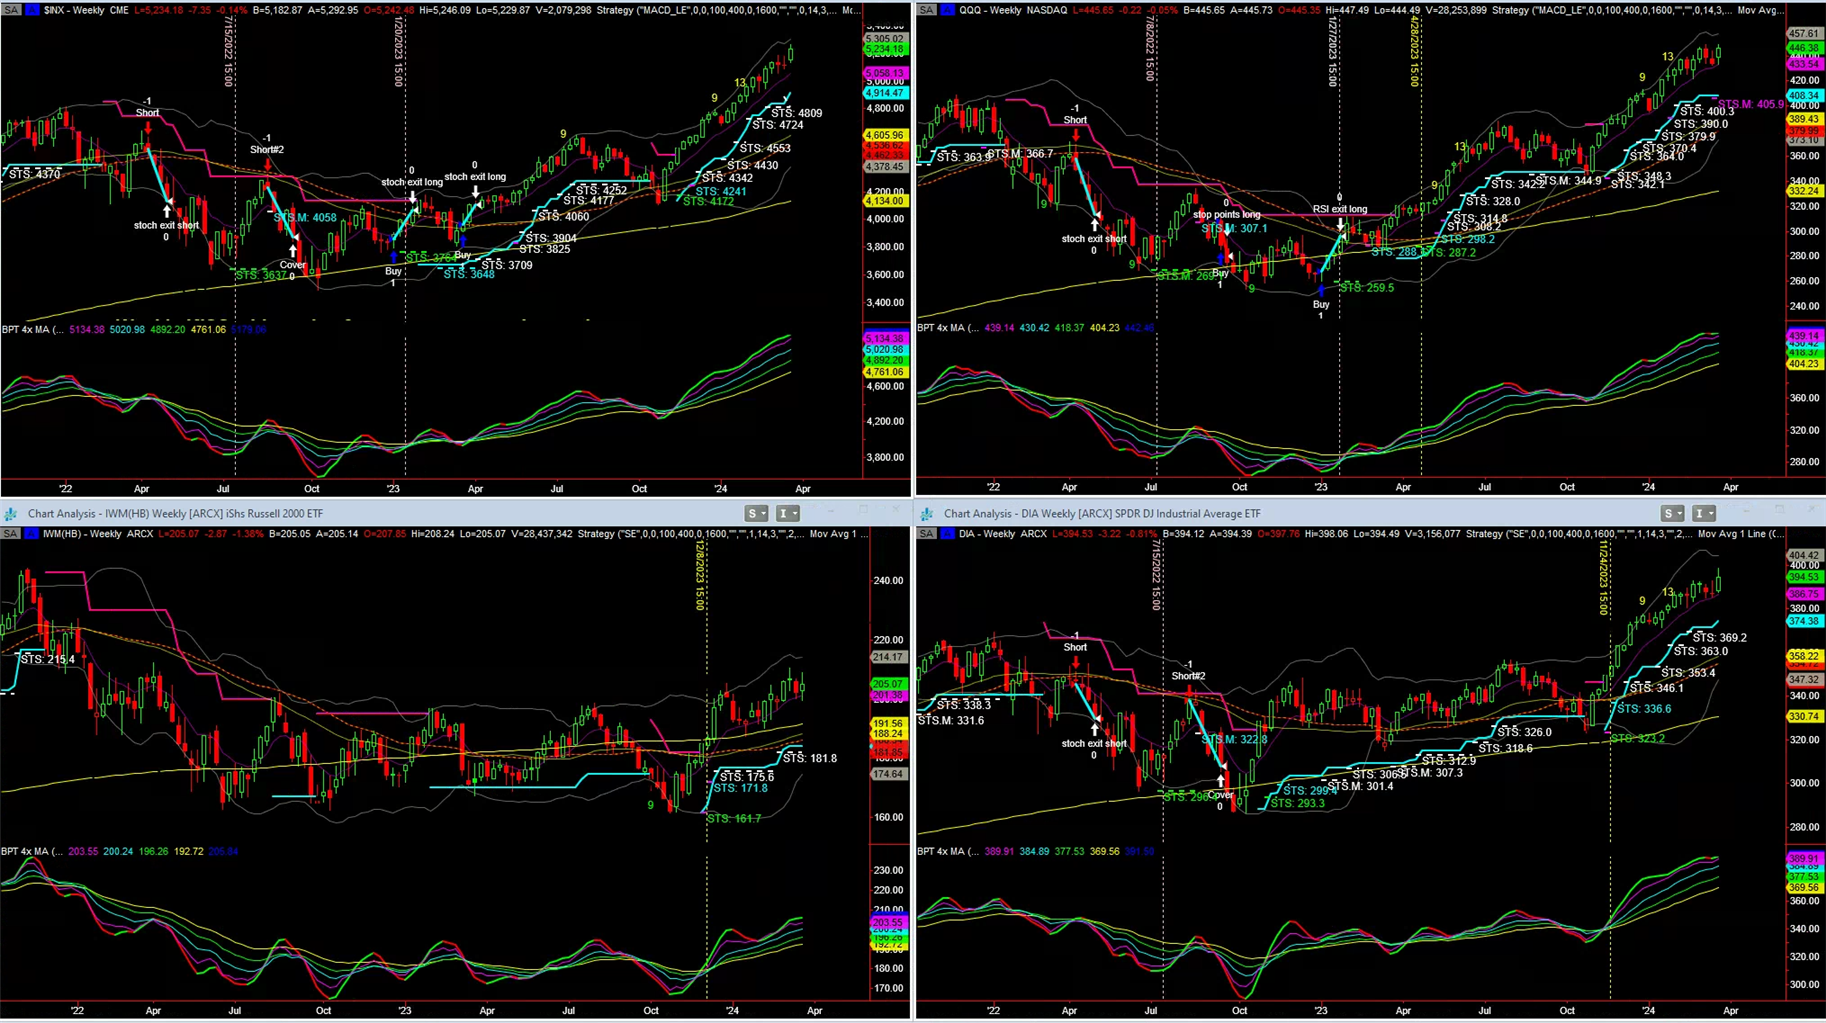
The KISS Systems for the indexes and many large cap stocks have been long since October just off the lows and are doing well. The KISS systems did their job avoiding a lot of the correction and going back long 2 to 3 days off the lows, thus capturing this rally with protection. KISS STS Tables for Indexes, ETF's, Stocks
2
3
4
5
6
7
8
| Major Indexes | Index Symbol | ETF Symbol | % G / L Day | % G / L Week | Close |
|---|---|---|---|---|---|
| Dow Jones | INDU - W | DIA - W | -0.77% | 1.97% | 39,475.90 |
| S&P 500 | SPX - W | SPY - W | -0.14% | 2.29% | 5,234.18 |
| Nasdaq | COMPQ - W | 0.16% | 2.85% | 16,428.82 | |
| NDX 100 | NDX - W | QQQ - W | 0.10% | 2.98% | 18,339.44 |
| Russel 2000 (Small Caps) | IWM - W | -1.38% | 1.57% | 205.07 |
| Market Sectors | Index Symbol | ETF Symbol | % G / L Day | % G / L Week | Close |
|---|---|---|---|---|---|
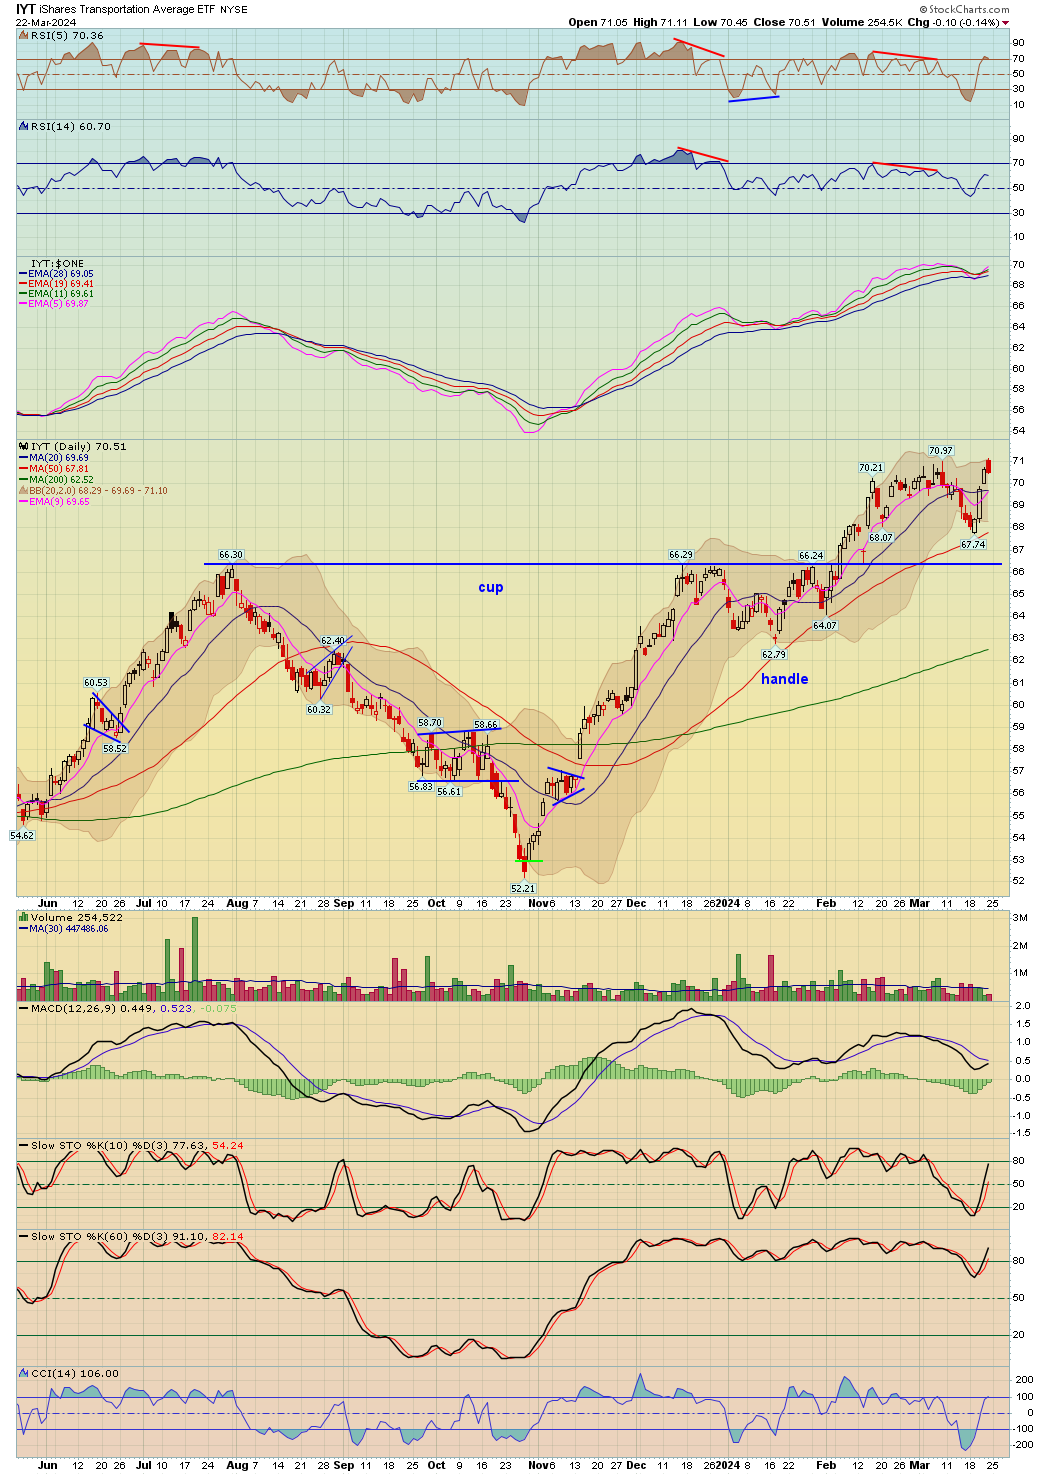
| Transports | TRAN - W | IYT - W | 0.06% | 3.31% | 16,010.98 |
| Banks | BKX - W | -1.50% | 3.72% | 101.70 | |
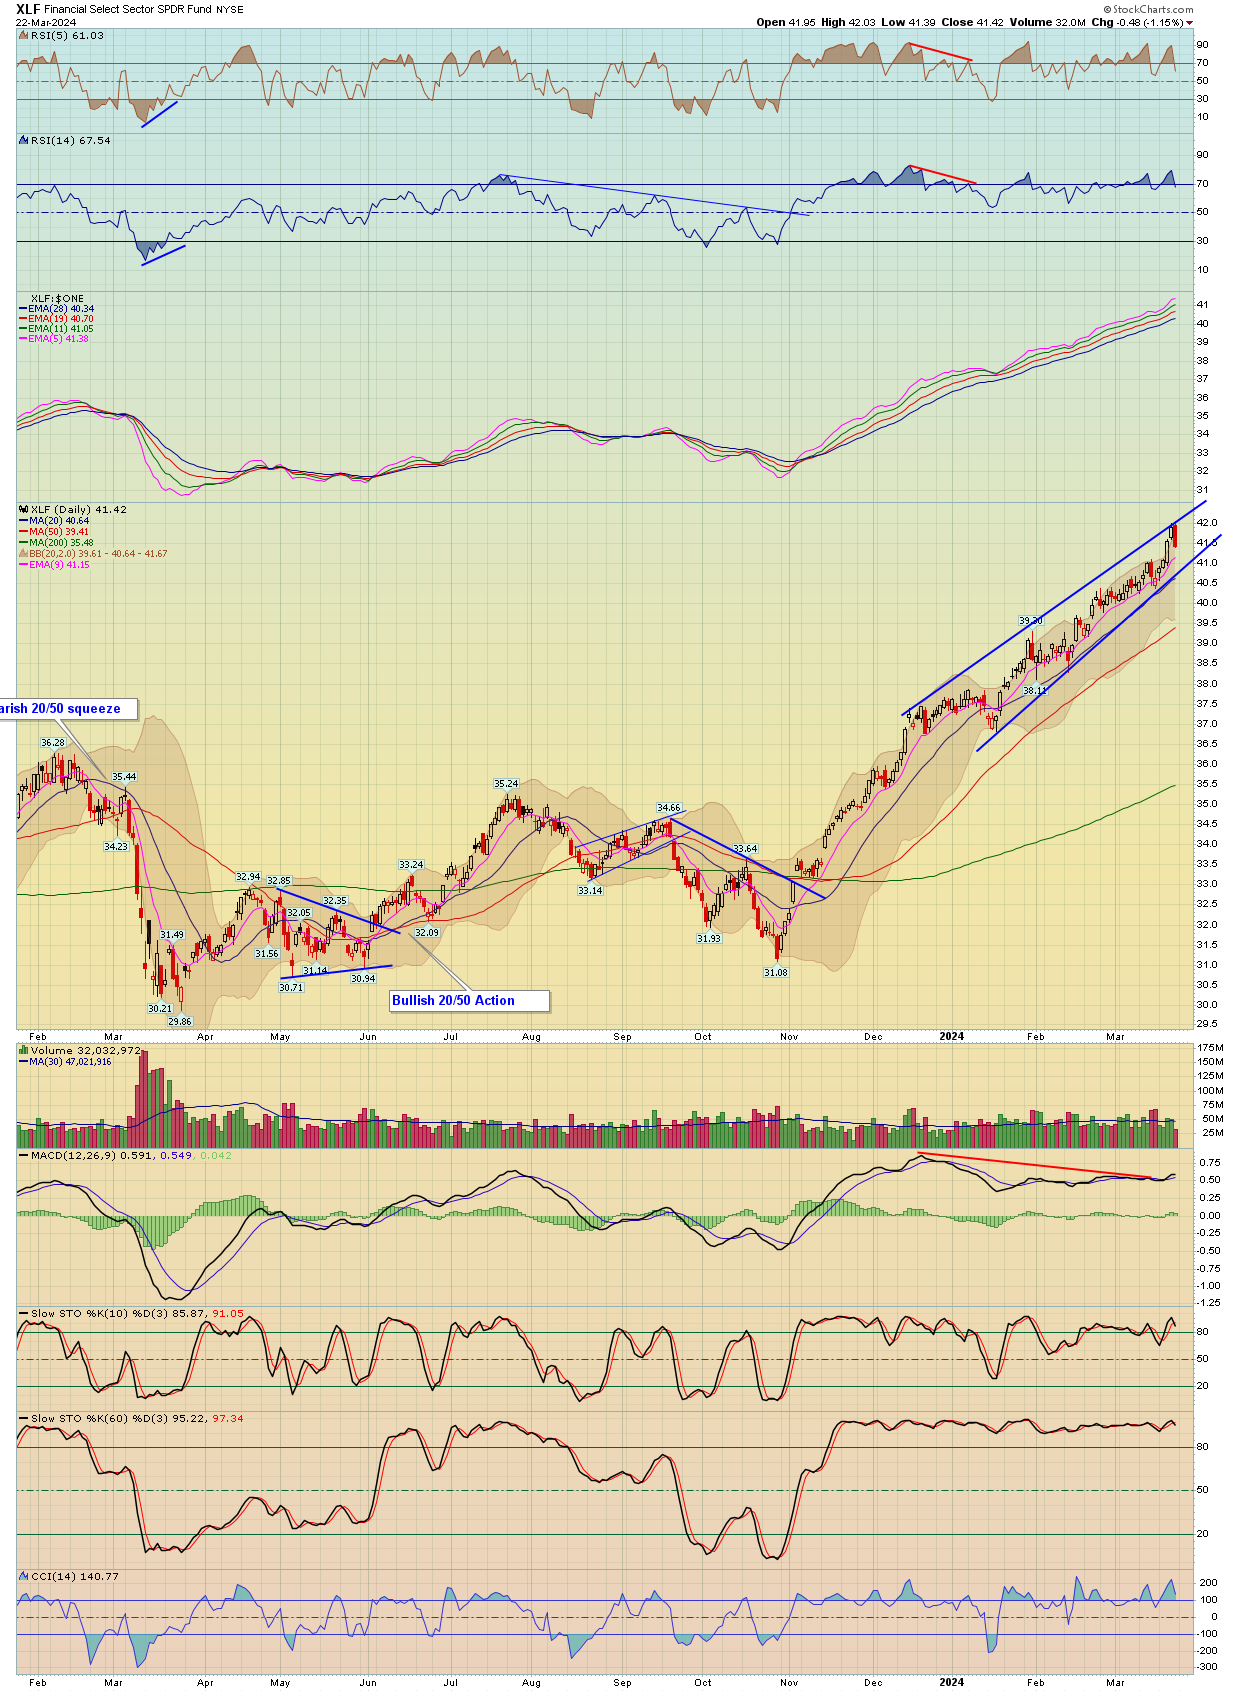
| Financials | XLF - W | -1.15% | 1.93% | 41.42 | |
| Brokers | XBD - W | -1.71% | 1.82% | 601.76 | |
| XLE (Energy Select) | XLE - W | -0.22% | 1.73% | 92.40 | |
| Oil Service Holders | OIH - W | -0.63% | 2.61% | 331.71 | |
| Technology | XLK - W | 0.03% | 2.25% | 209.91 | |
| Semiconductor | SOX - W | SMH - W | 0.21% | 3.16% | 4,908.26 |
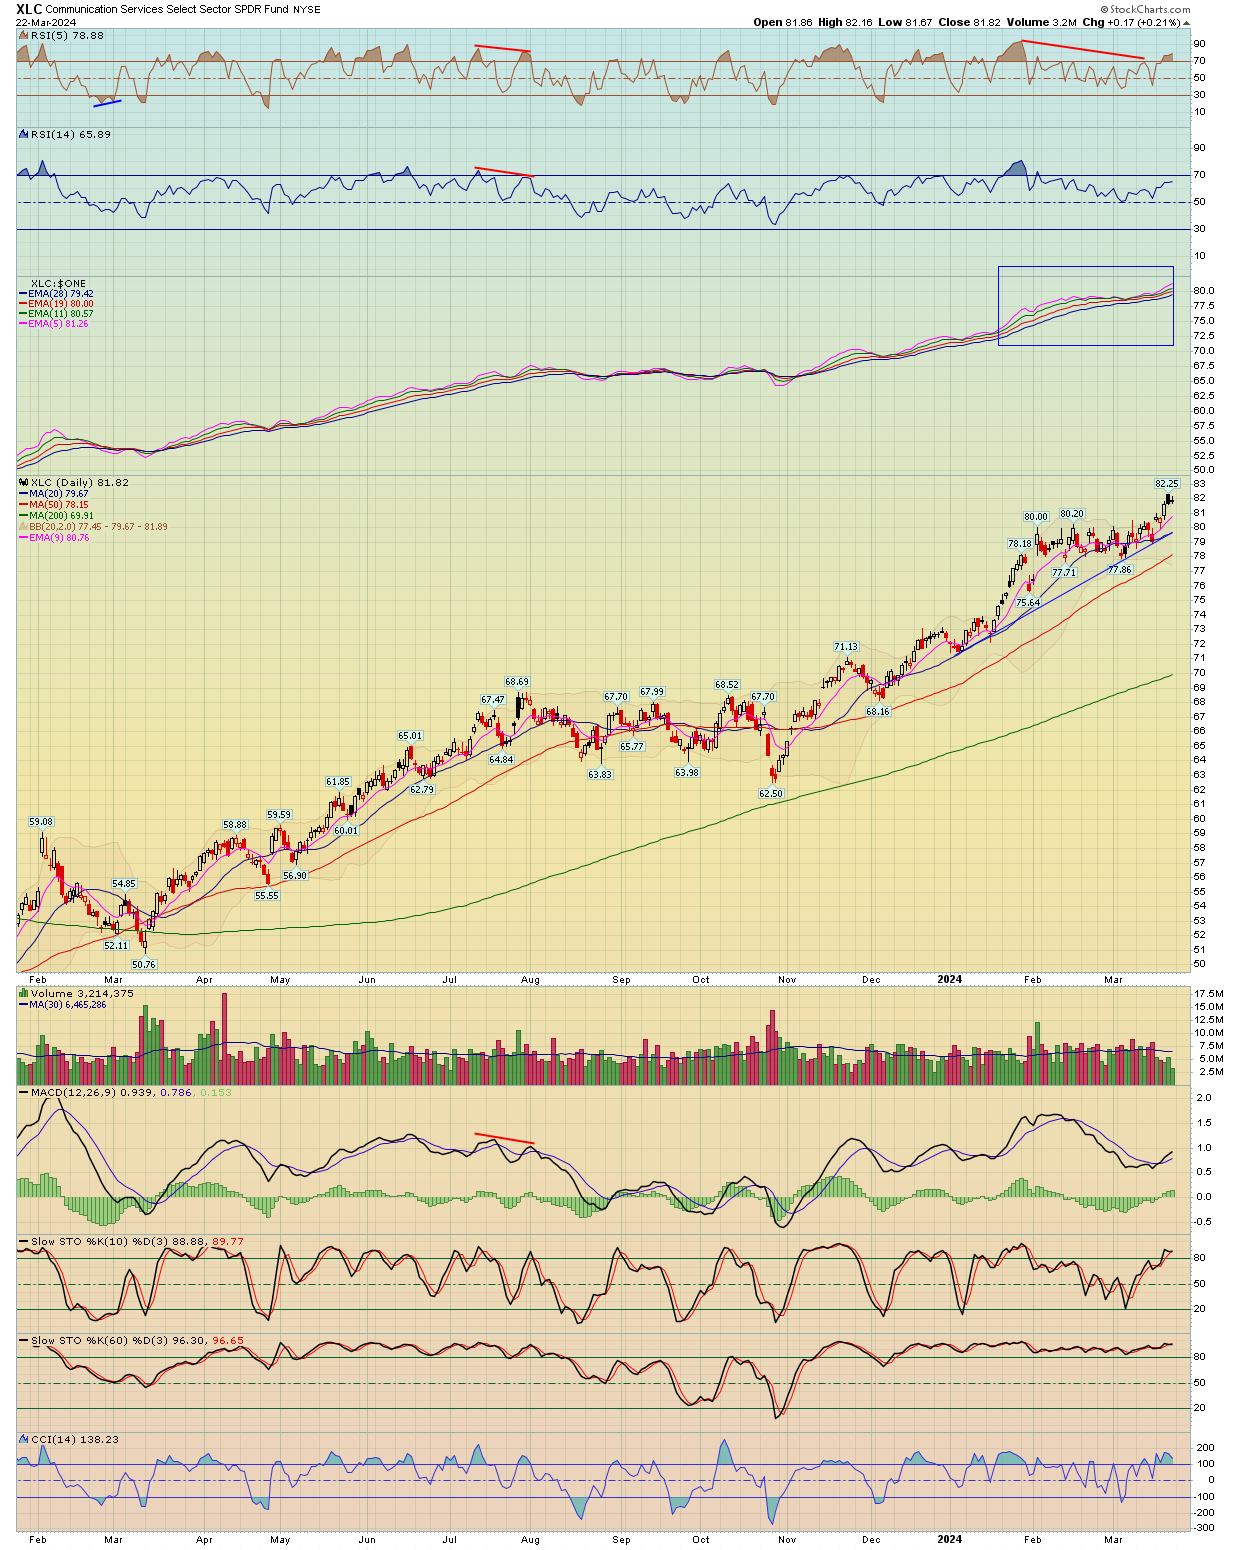
| Communication Services | XLC - W | 0.21% | 3.47% | 81.82 | |
| Retail | XRT - W | -1.18% | 2.33% | 77.22 | |
| Consumer Staples | XLP - W | -0.49% | 0.88% | 75.64 | |
| Consumer Discretionary | XLY - W | -0.87% | 2.85% | 182.72 | |
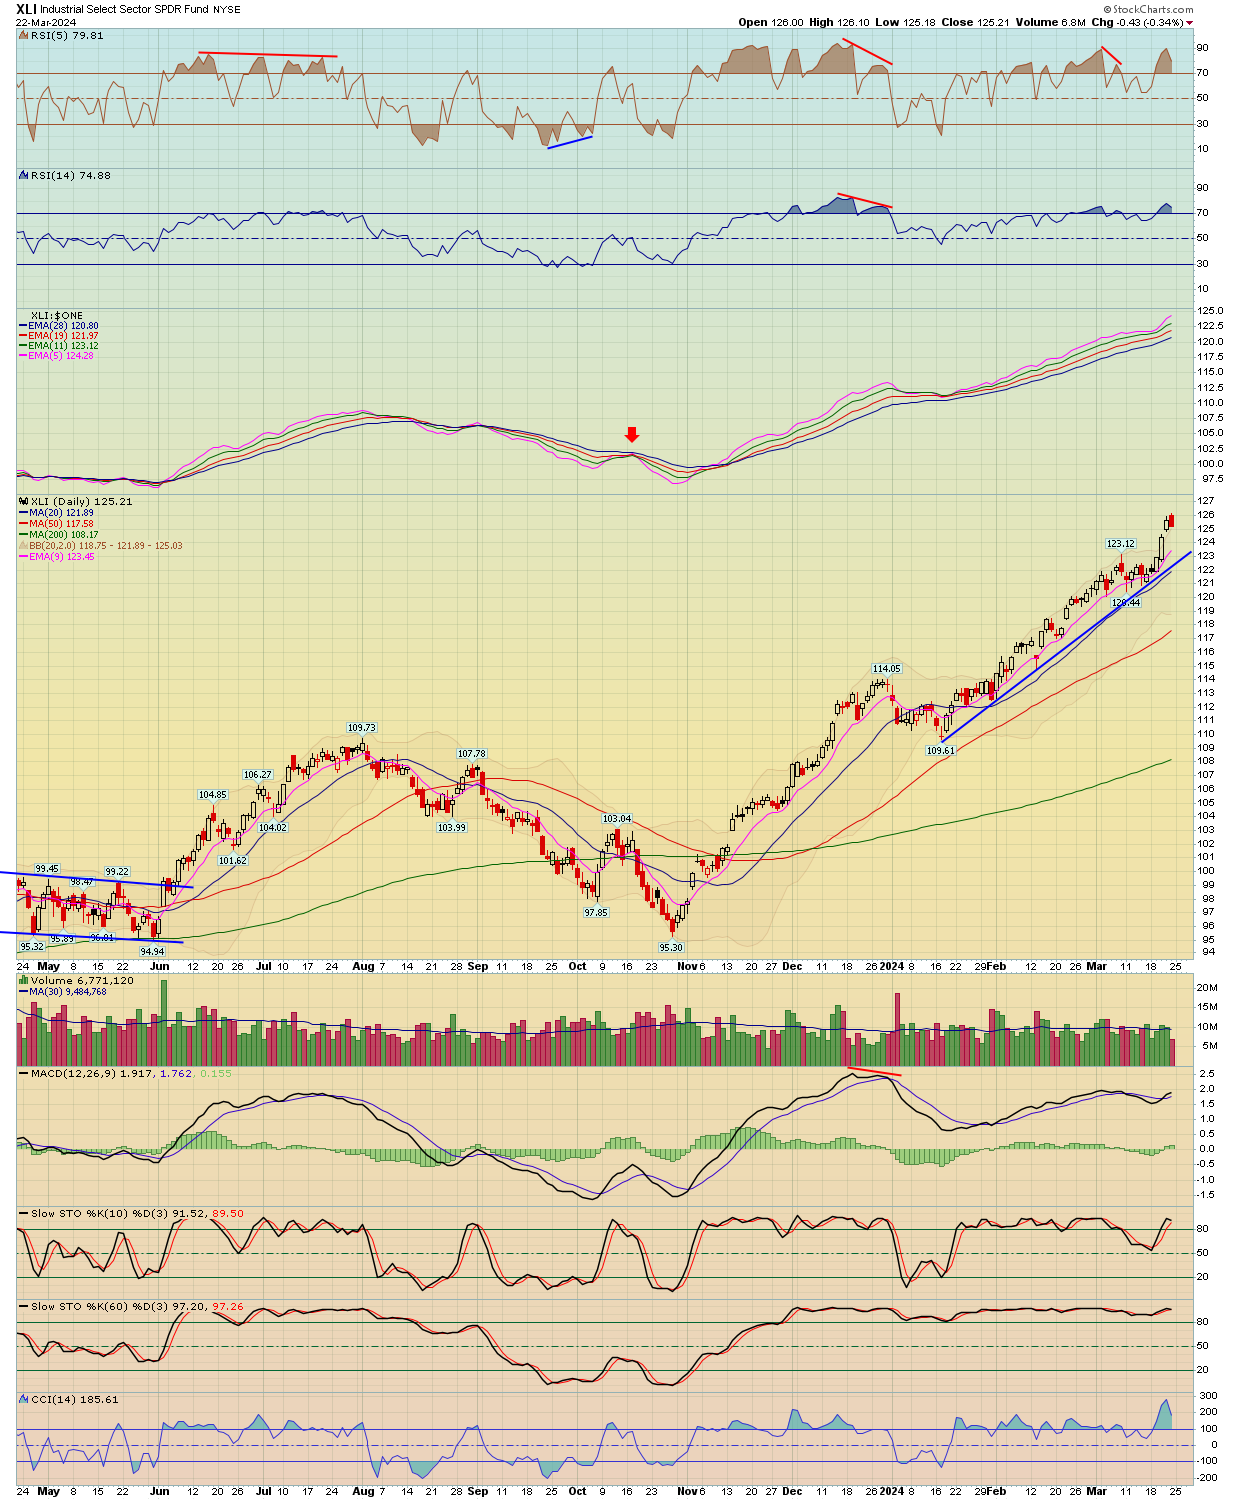
| Industrials | XLI - W | -0.34% | 2.91% | 125.21 | |
| Real Estate | IYR - W | -1.32% | -0.02% | 87.89 | |
| Homebuilders | HGX - W | XHB - W | -0.17% | 4.84% | 725.83 |
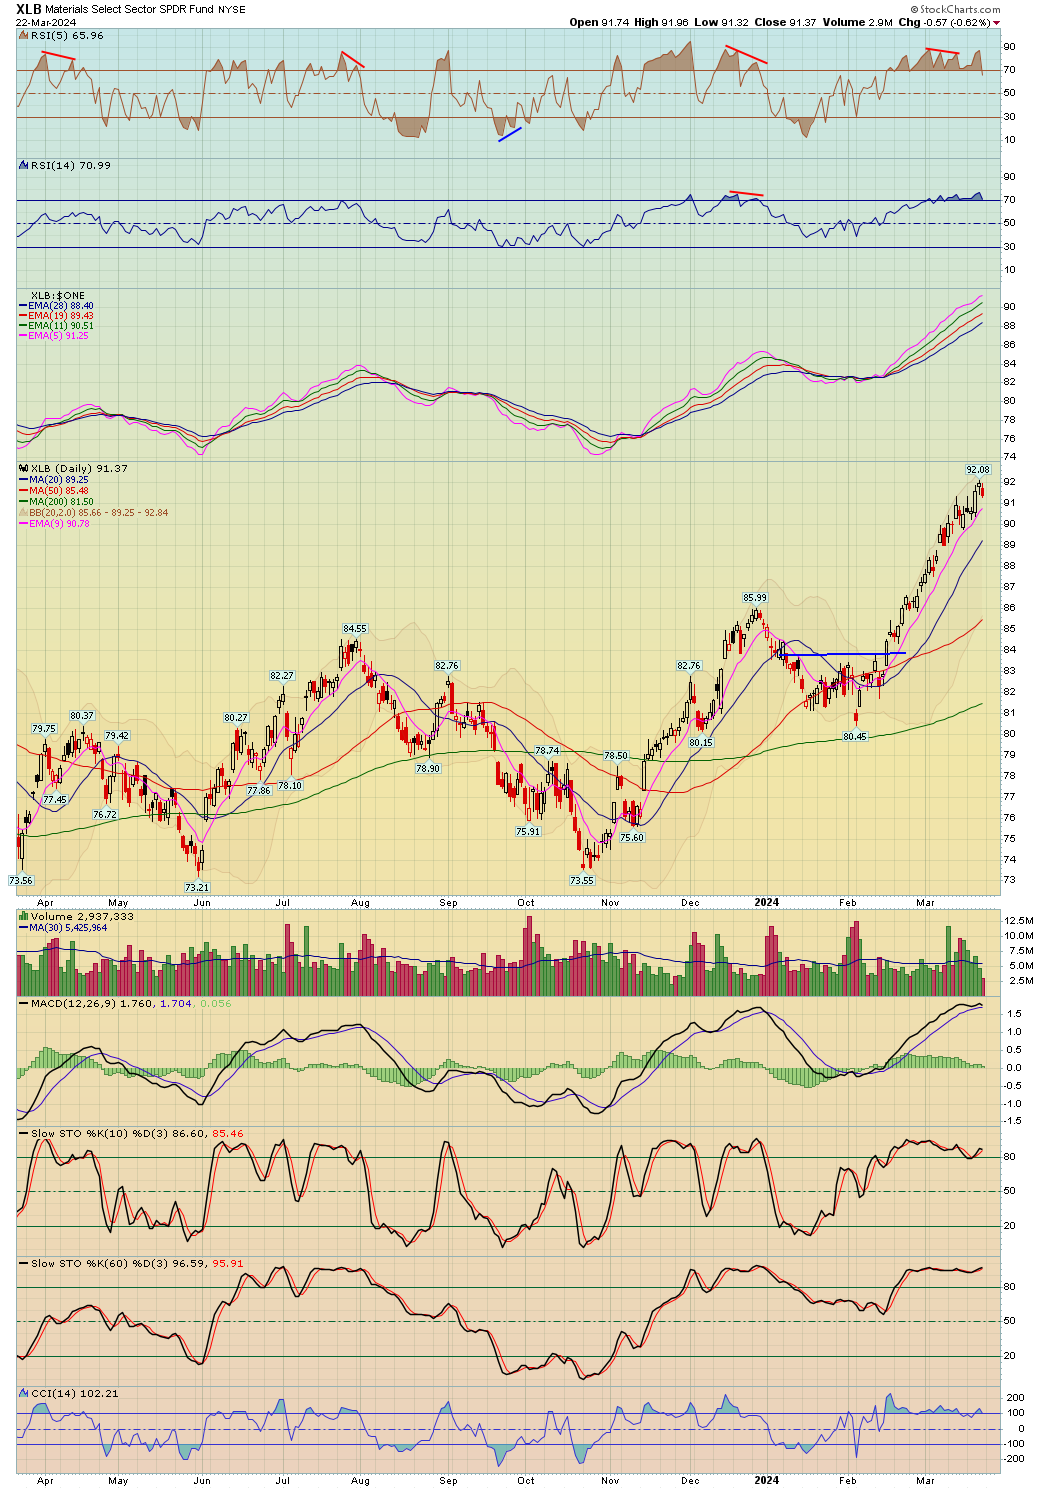
| Materials | XLB - W | -0.62% | 0.99% | 91.37 | |
| Metals And Mining | XME - W | -0.91% | 2.70% | 57.94 | |
| Biotechnology | BTK - W | XBI - W | -0.46% | 1.18% | 5,266.13 |
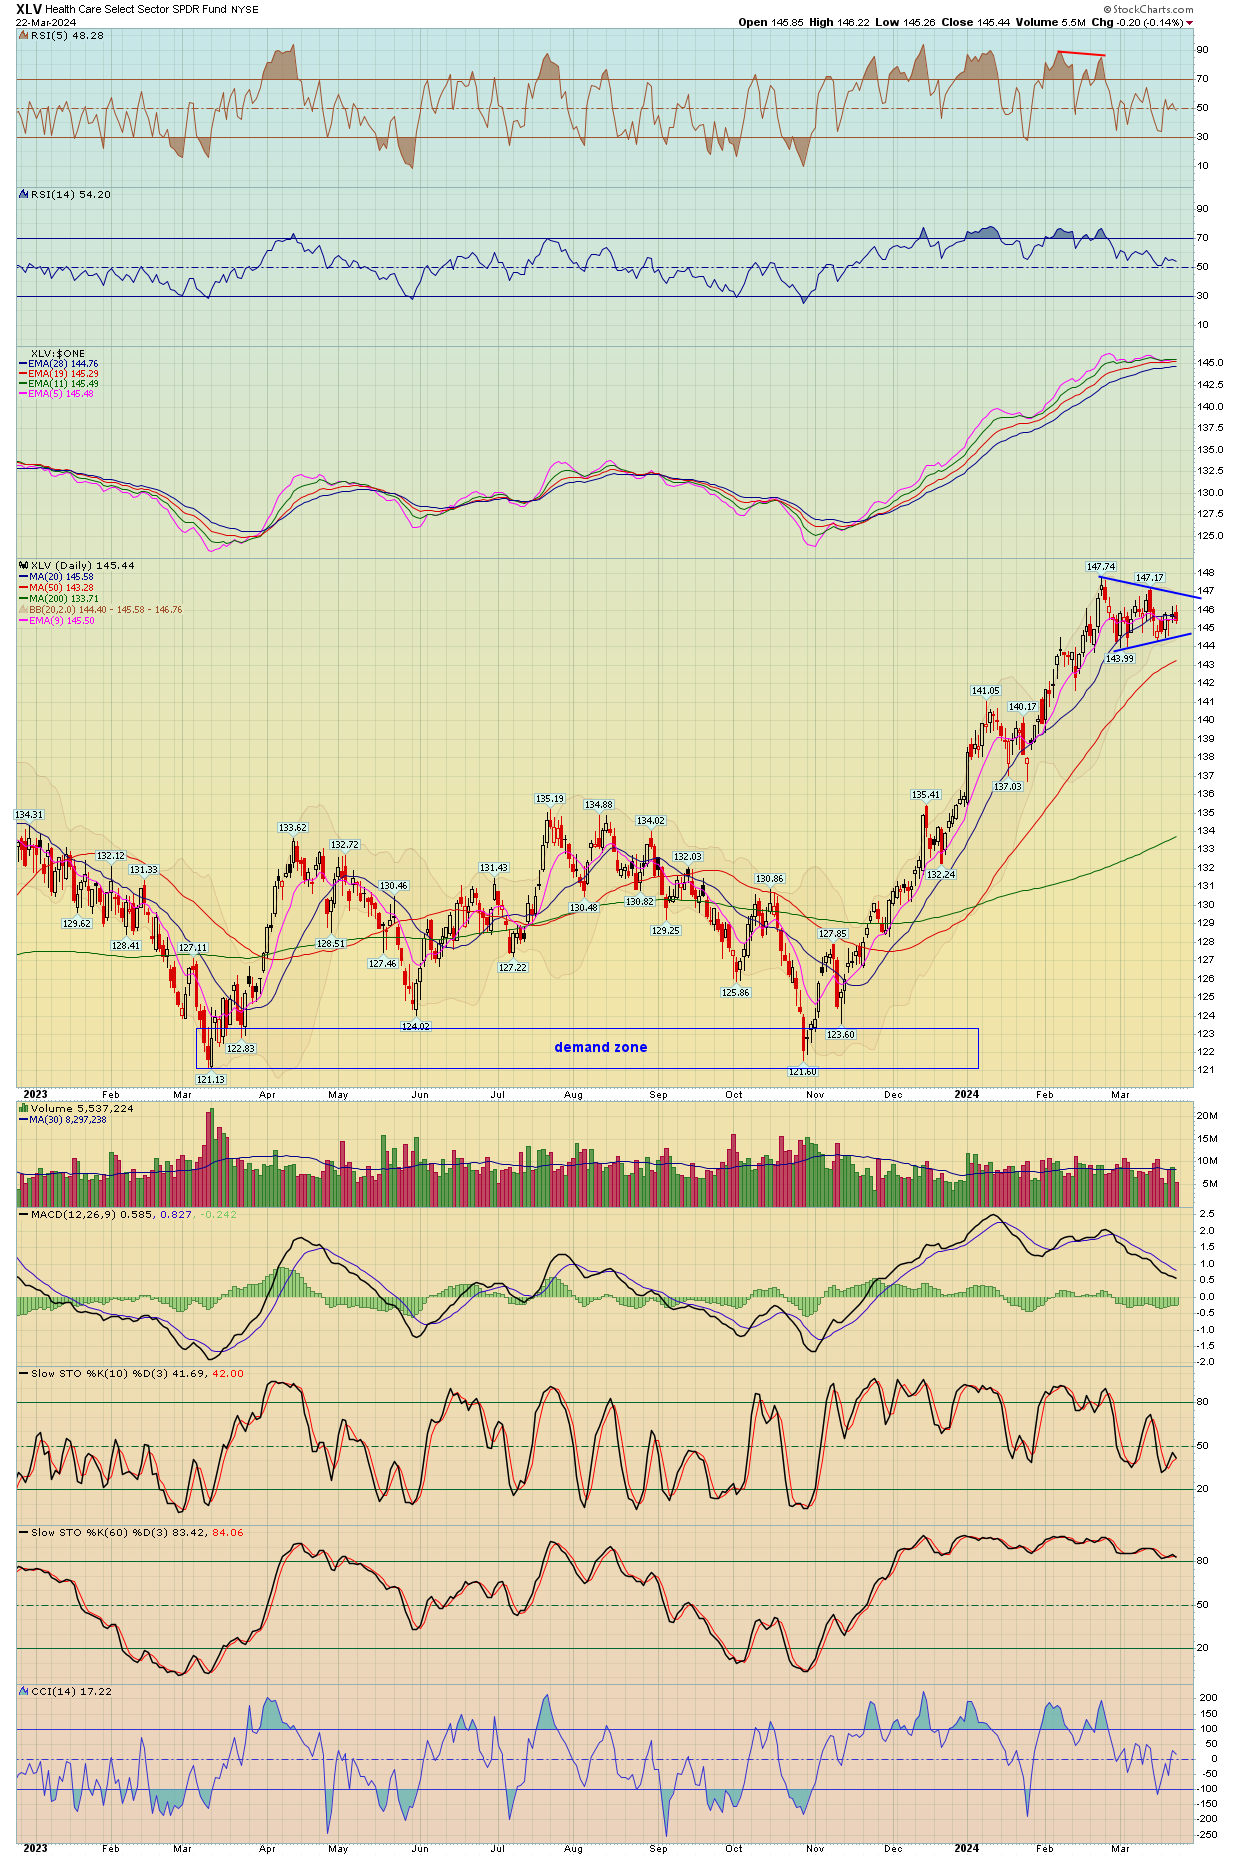
| Healthcare | XLV - W | -0.14% | 0.42% | 145.44 | |
| Drugs | DRG - W | -0.06% | -0.17% | 1,009.48 | |
| Utilities | UTIL - W | XLU - W | -0.06% | 0.95% | 858.37 |
| Currencies | Index Symbol | ETF Symbol | % G / L Day | % G / L Week | Close |
|---|---|---|---|---|---|
| US Dollar | UUP - W | 0.53% | 1.22% | 28.32 | |
| Euro | XEU - W | FXE - W | -0.48% | -0.76% | 108.07 |
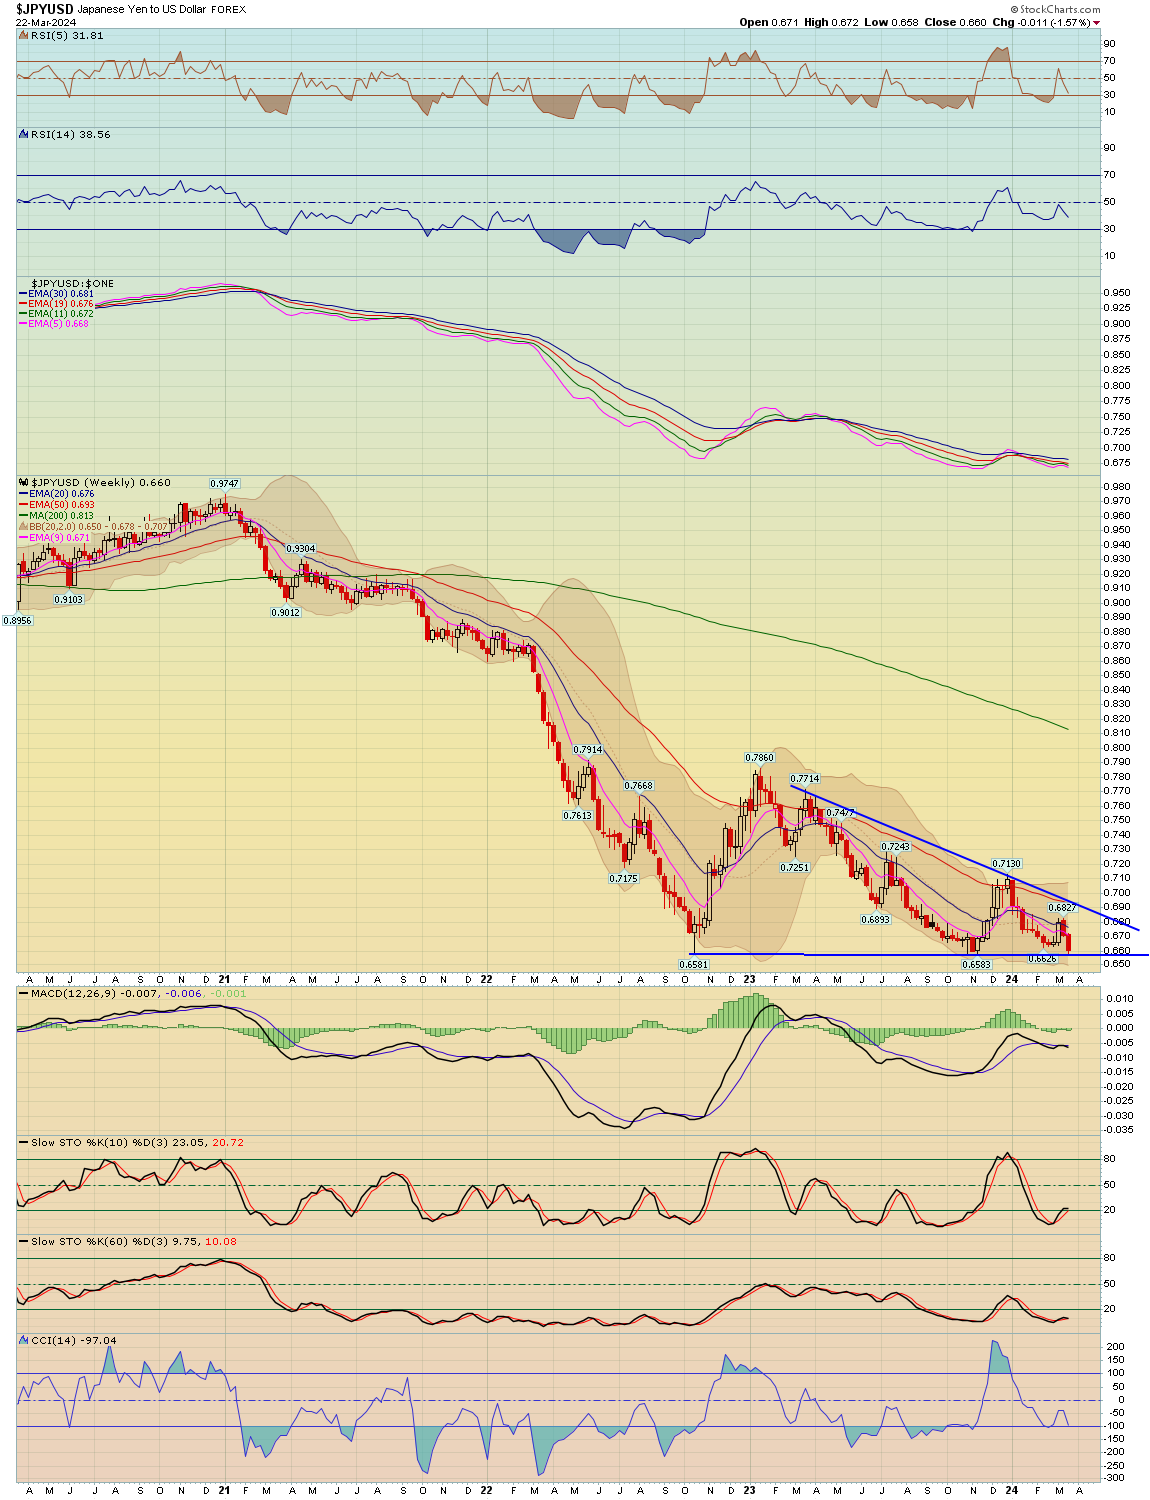
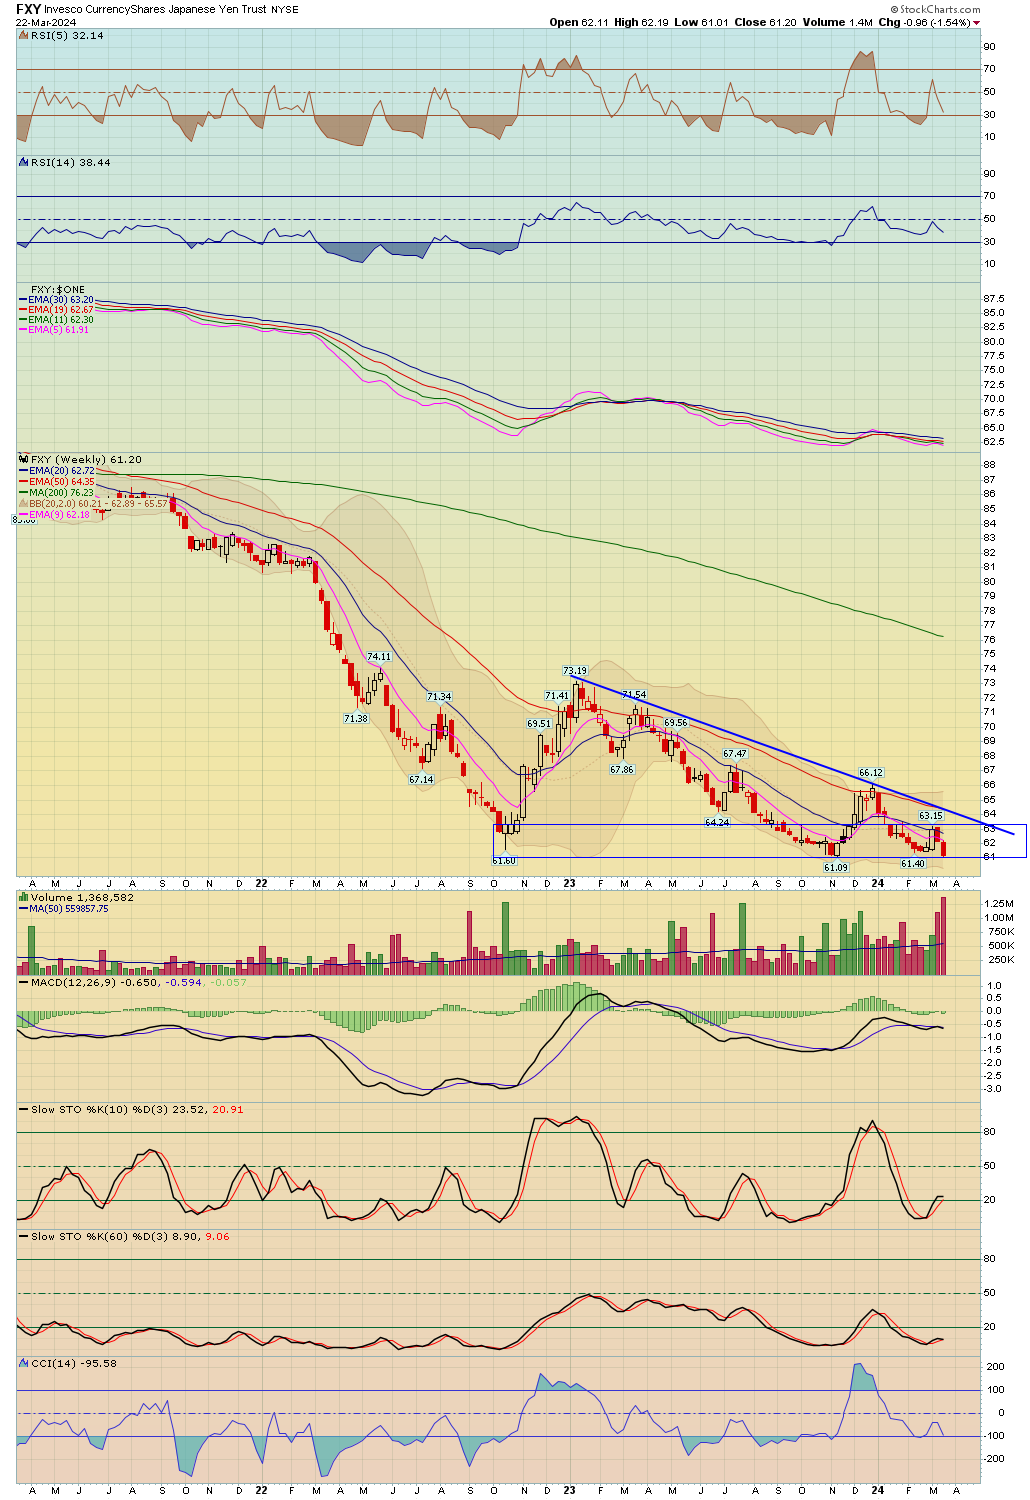
| Yen | XJY - W | FXY - W | 0.16% | -1.56% | 66.05 |
| Australian | XAD - W | FXA - W | -0.86% | -0.84% | 65.14 |
| British Pound | XBP - W | FXB - W | -0.49% | -1.04% | 126.00 |
| Chinese Yuan | CYB - W | 0.00% | 0.00% | 24.27 | |
| Canadian Dollar | CDW - W | FXC - W | -0.54% | -0.70% | 73.50 |
| Swiss Franc | XSF - W | FXF - W | 0.06% | -1.48% | 111.48 |
| Cryptocurrencies | Index Symbol | ETF Symbol | % G / L Day | % G / L Week | Close |
|---|---|---|---|---|---|
| Bitcoin | BTCUSD - W | -3.04% | -7.12% | 63,499.48 | |
| Bitcoin Cash | BCHUSD - W | -0.73% | 2.25% | 411.39 | |
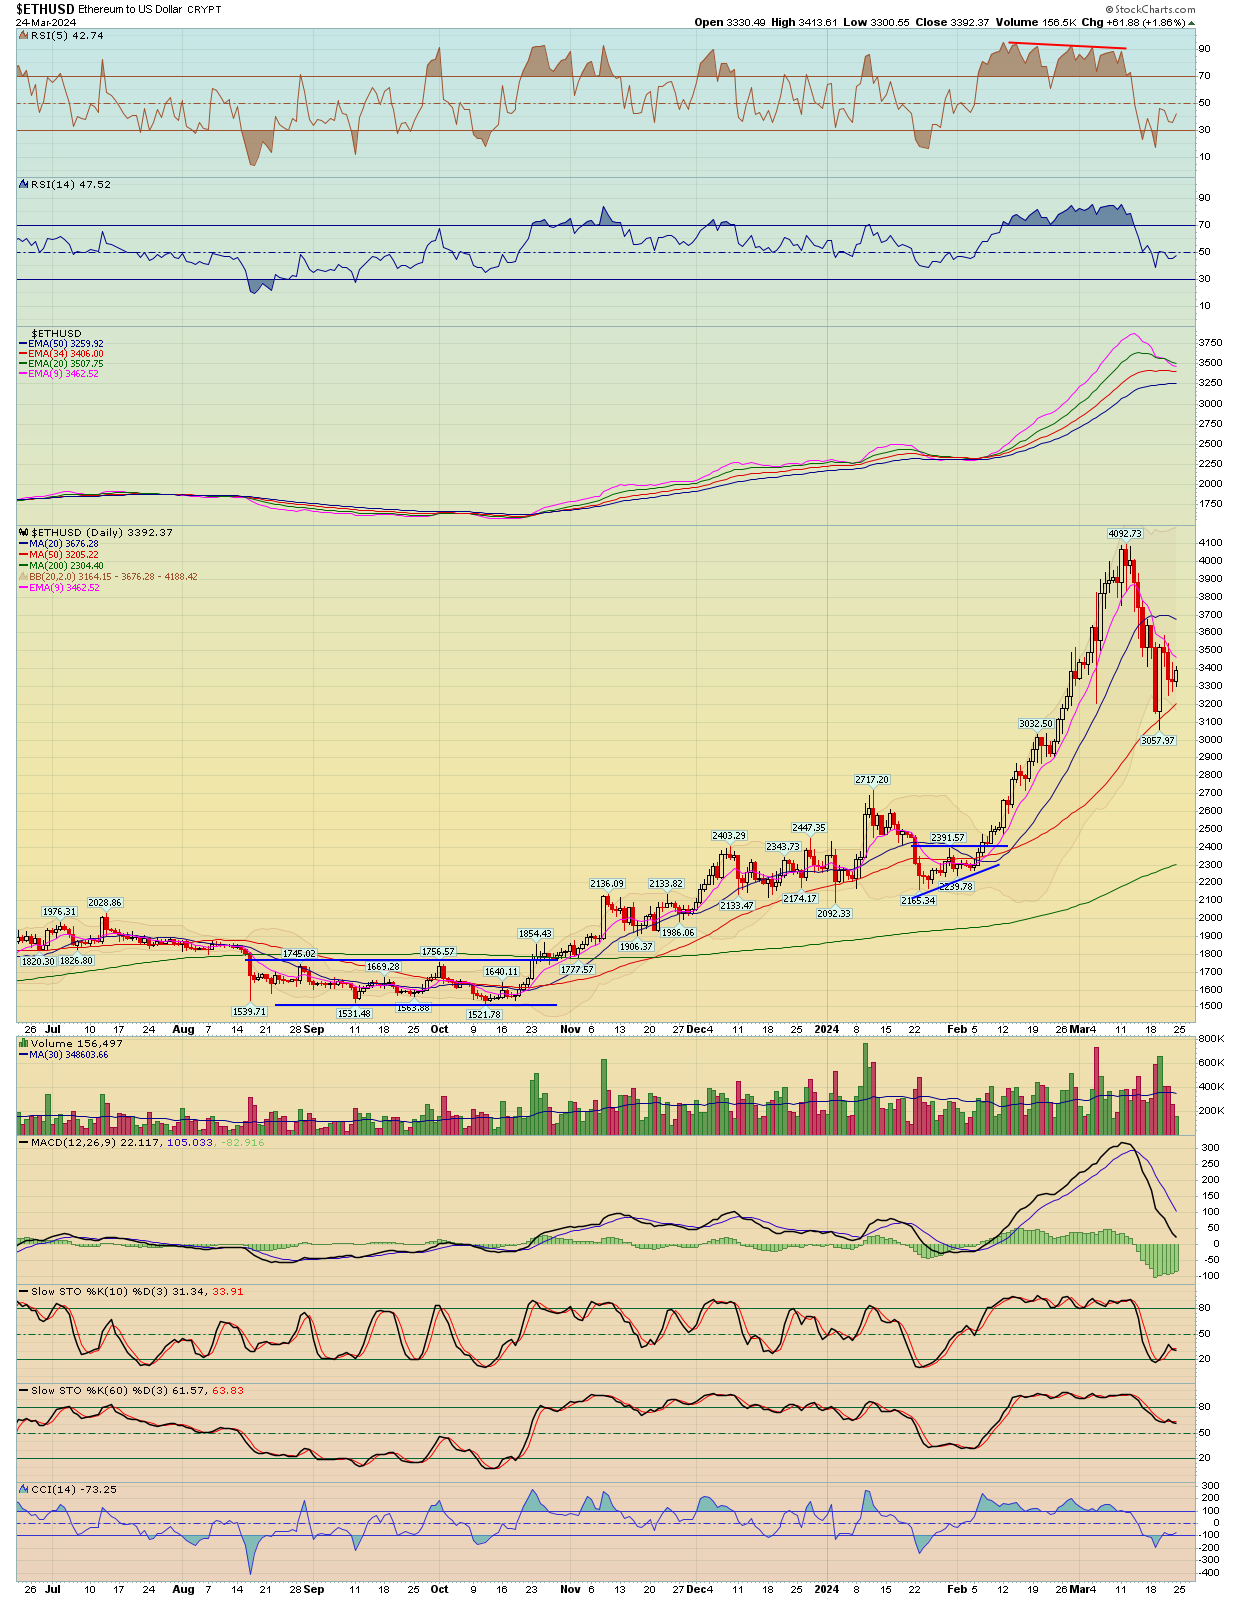
| Etherium | ETHUSD - W | -5.02% | -8.92% | 3,316.66 | |
| Monero | XMRUSD - W | -3.17% | -4.18% | 133.77 | |
| Litecoin | LTCUSD - W | -3.54% | -3.68% | 82.69 | |
| Ripple | XRPUSD - W | -4.06% | -0.71% | 0.61 |
| Commodities | Index Symbol | ETF Symbol | % G / L Day | % G / L Week | Close |
|---|---|---|---|---|---|
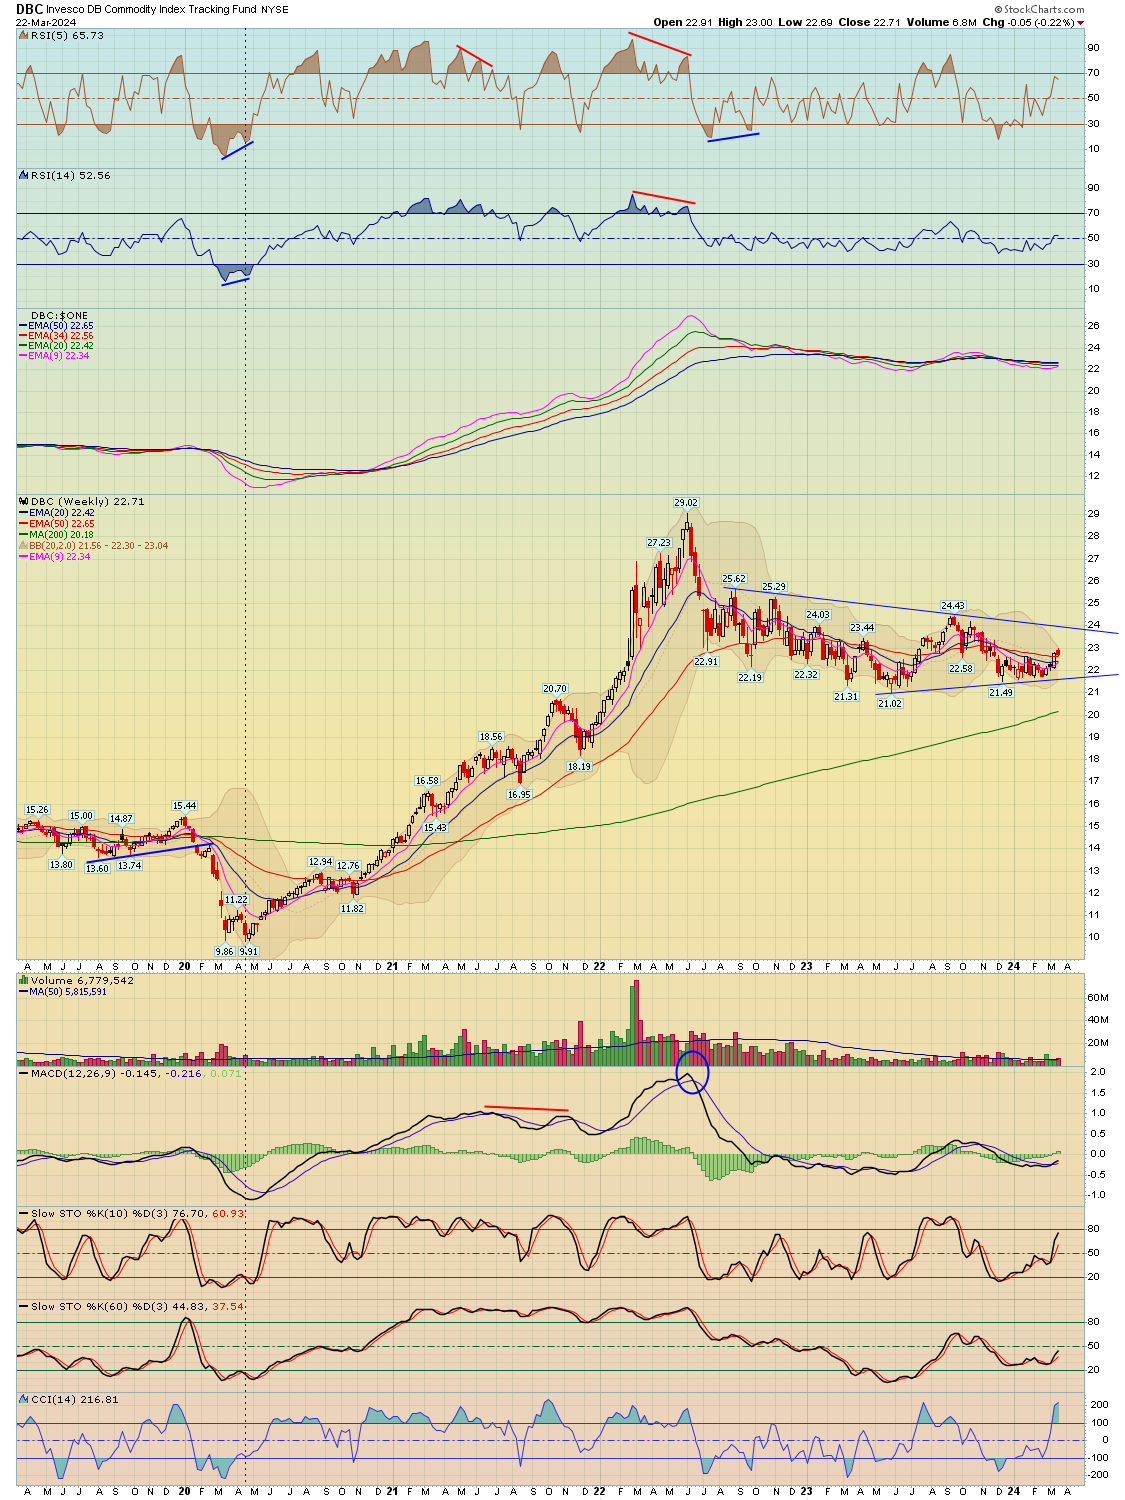
| Commodities | DBC - W | -0.70% | -0.22% | 22.71 | |
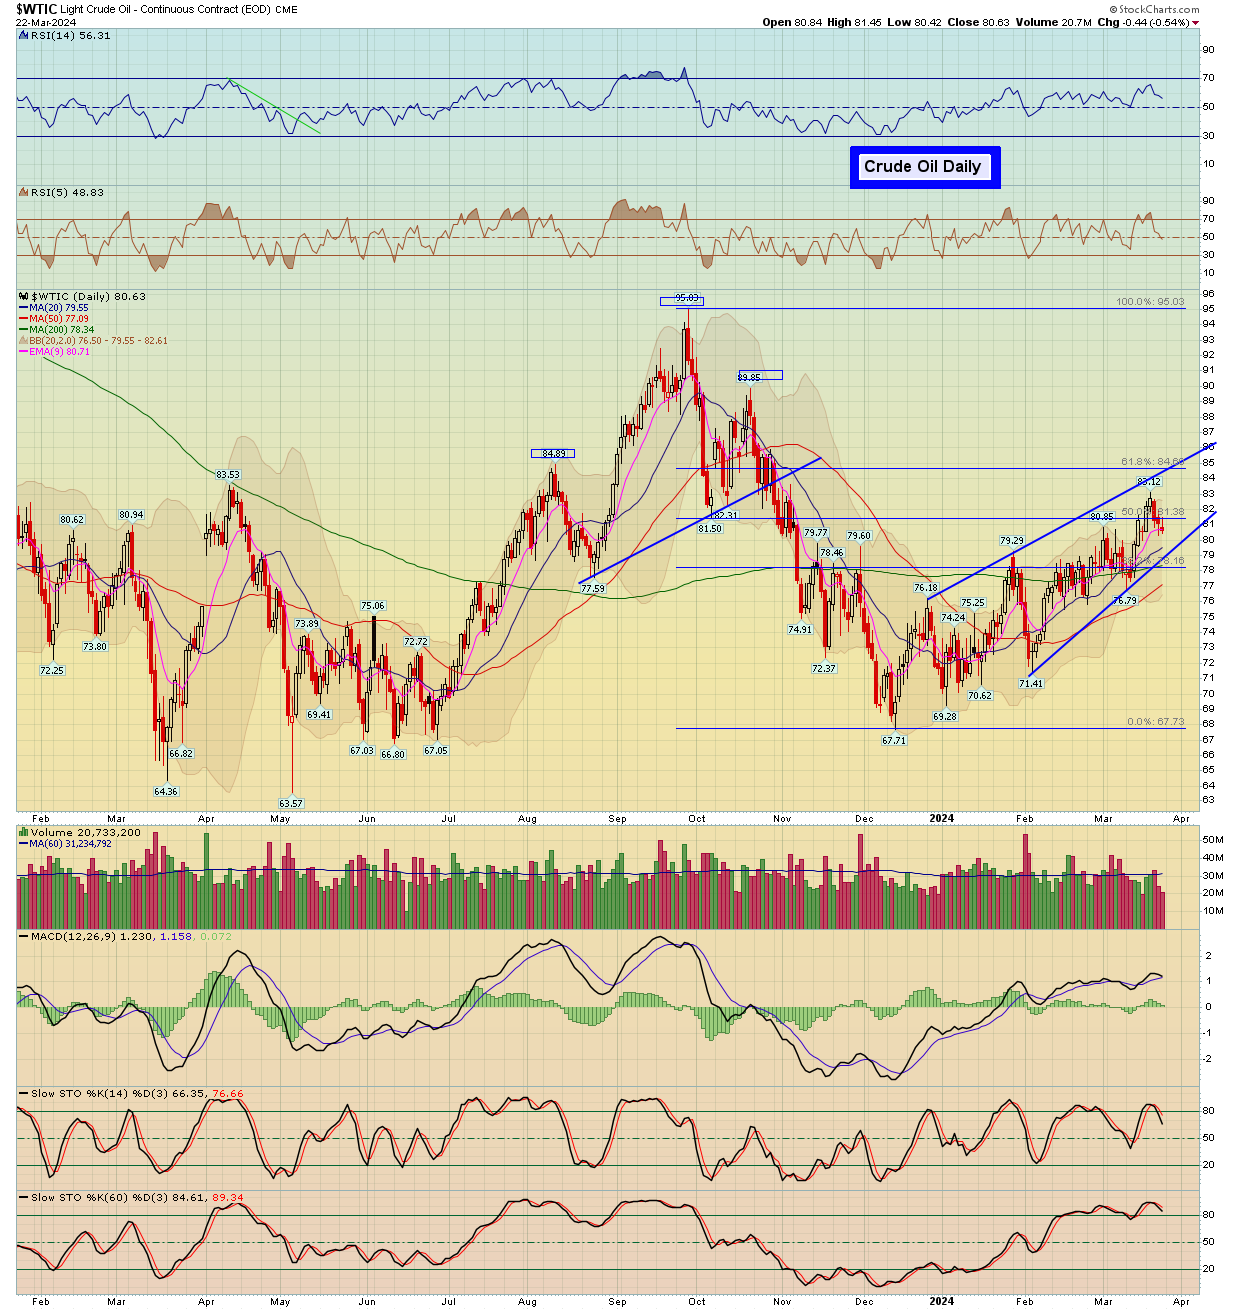
| Crude Oil | WTIC - W | USO - W | -0.54% | 0.06% | 80.63 |
| Gasoline | GASO - W | 0.18% | 0.38% | 2.72 | |
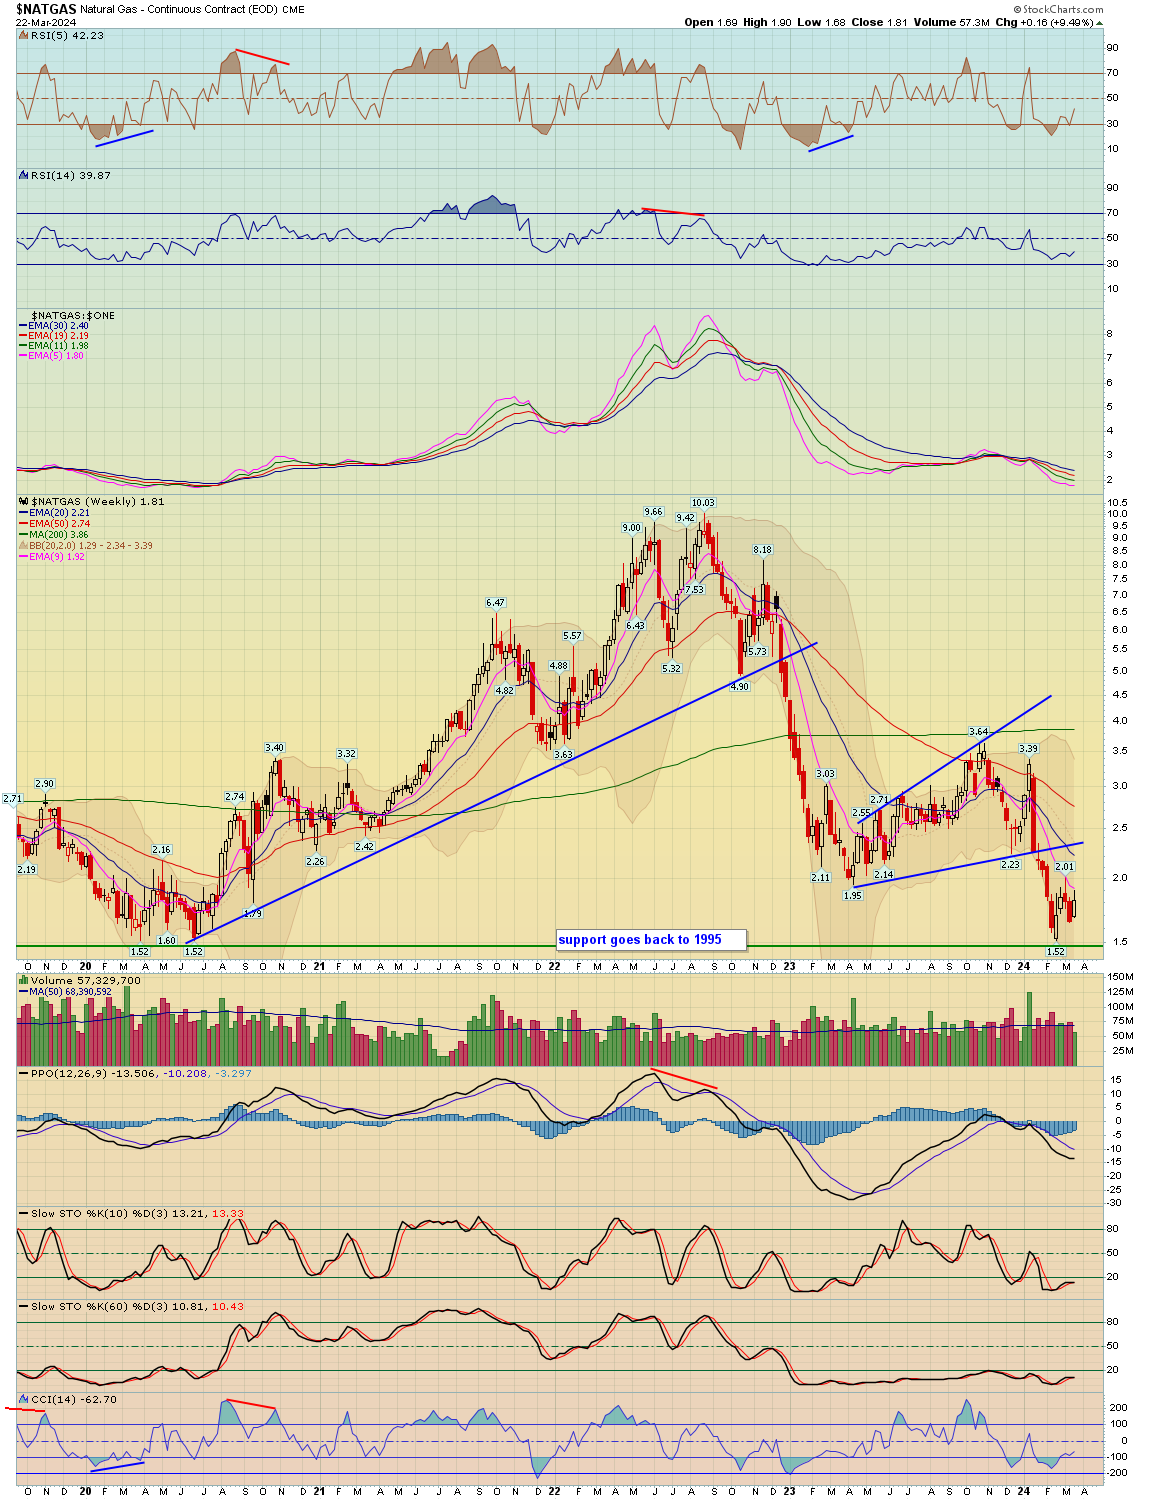
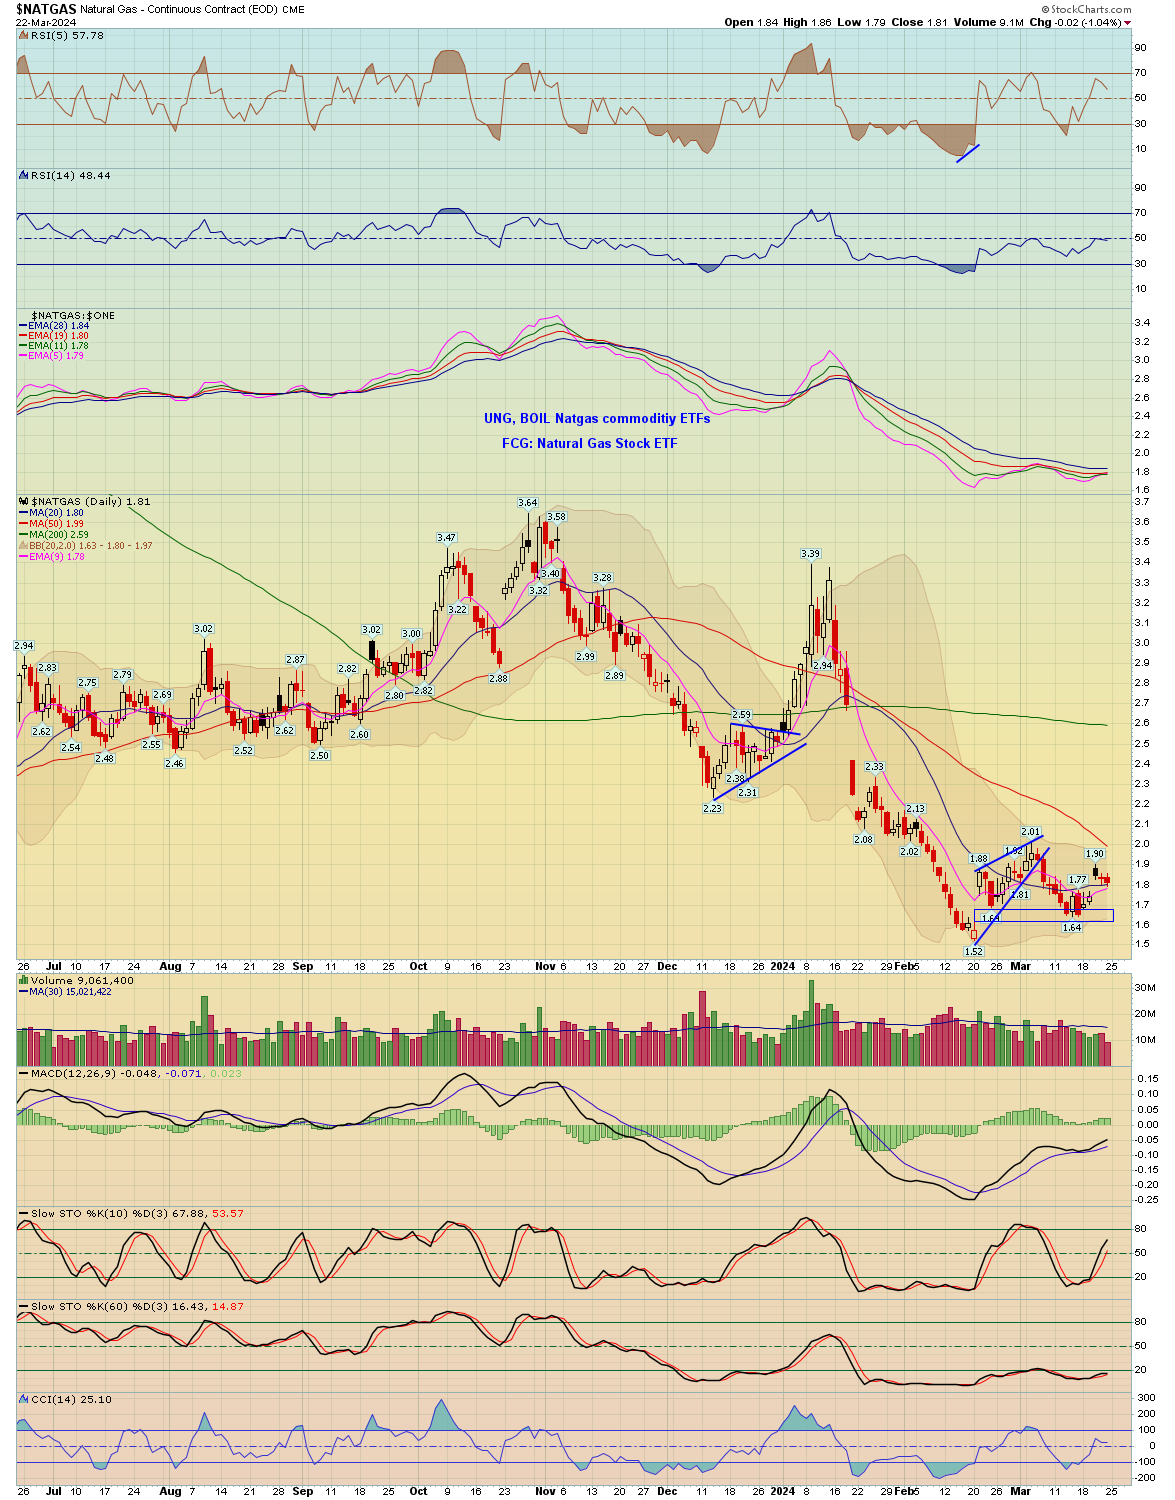
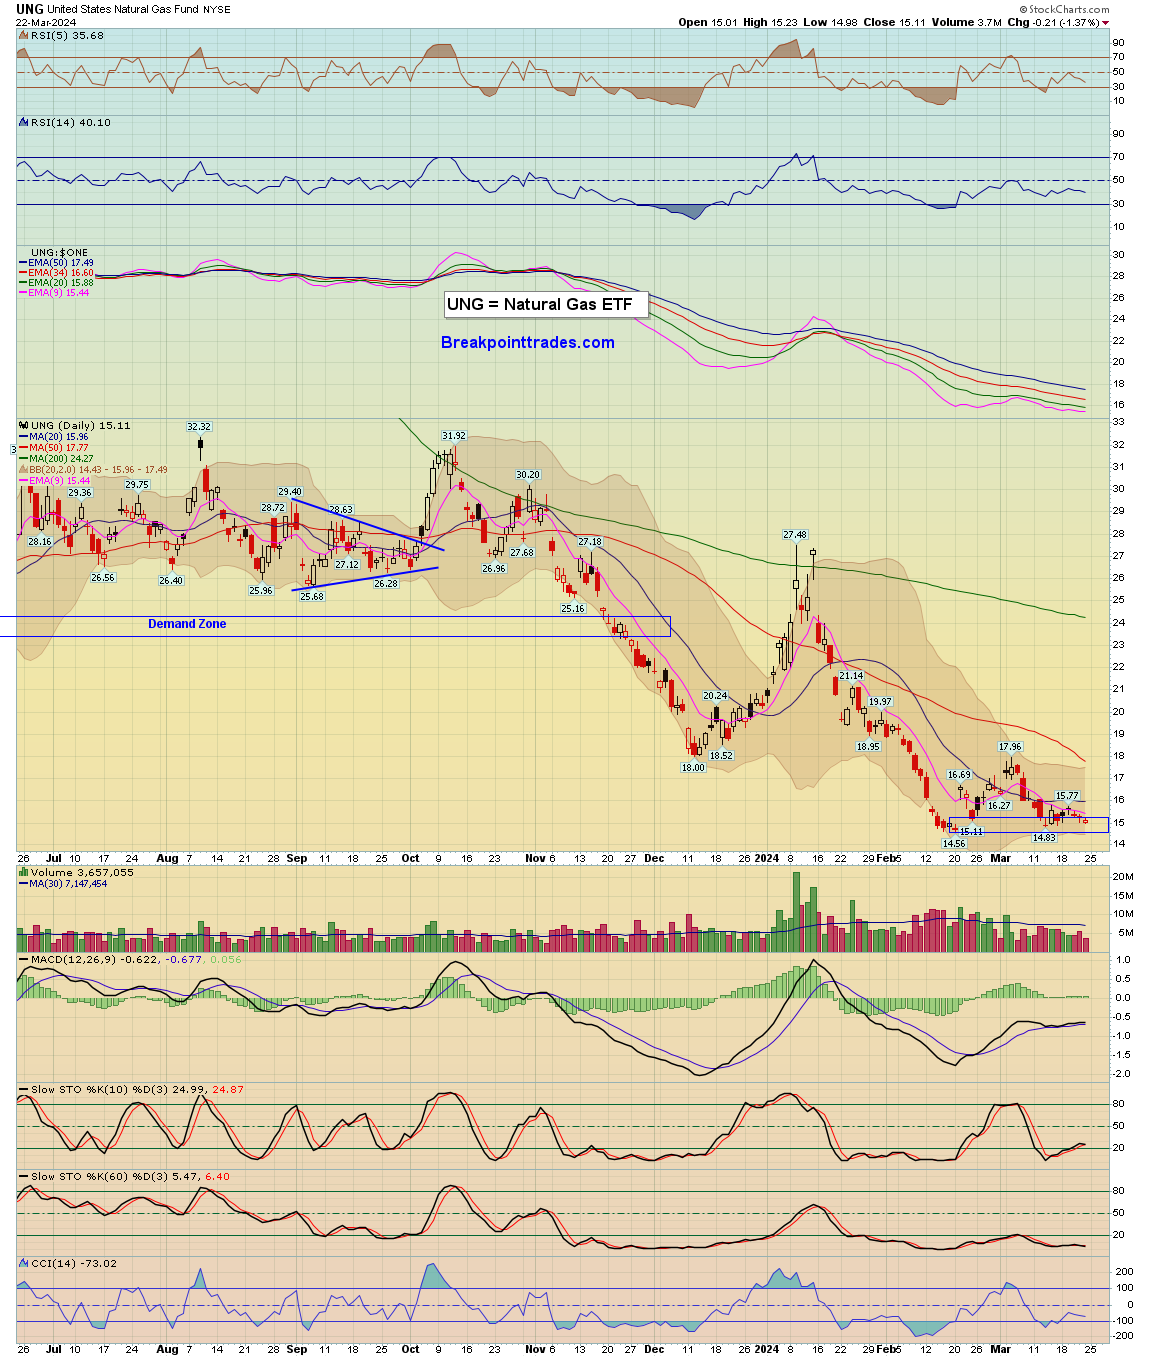
| Natural Gas | NATGAS - W | UNG - W | -1.04% | 9.49% | 1.81 |
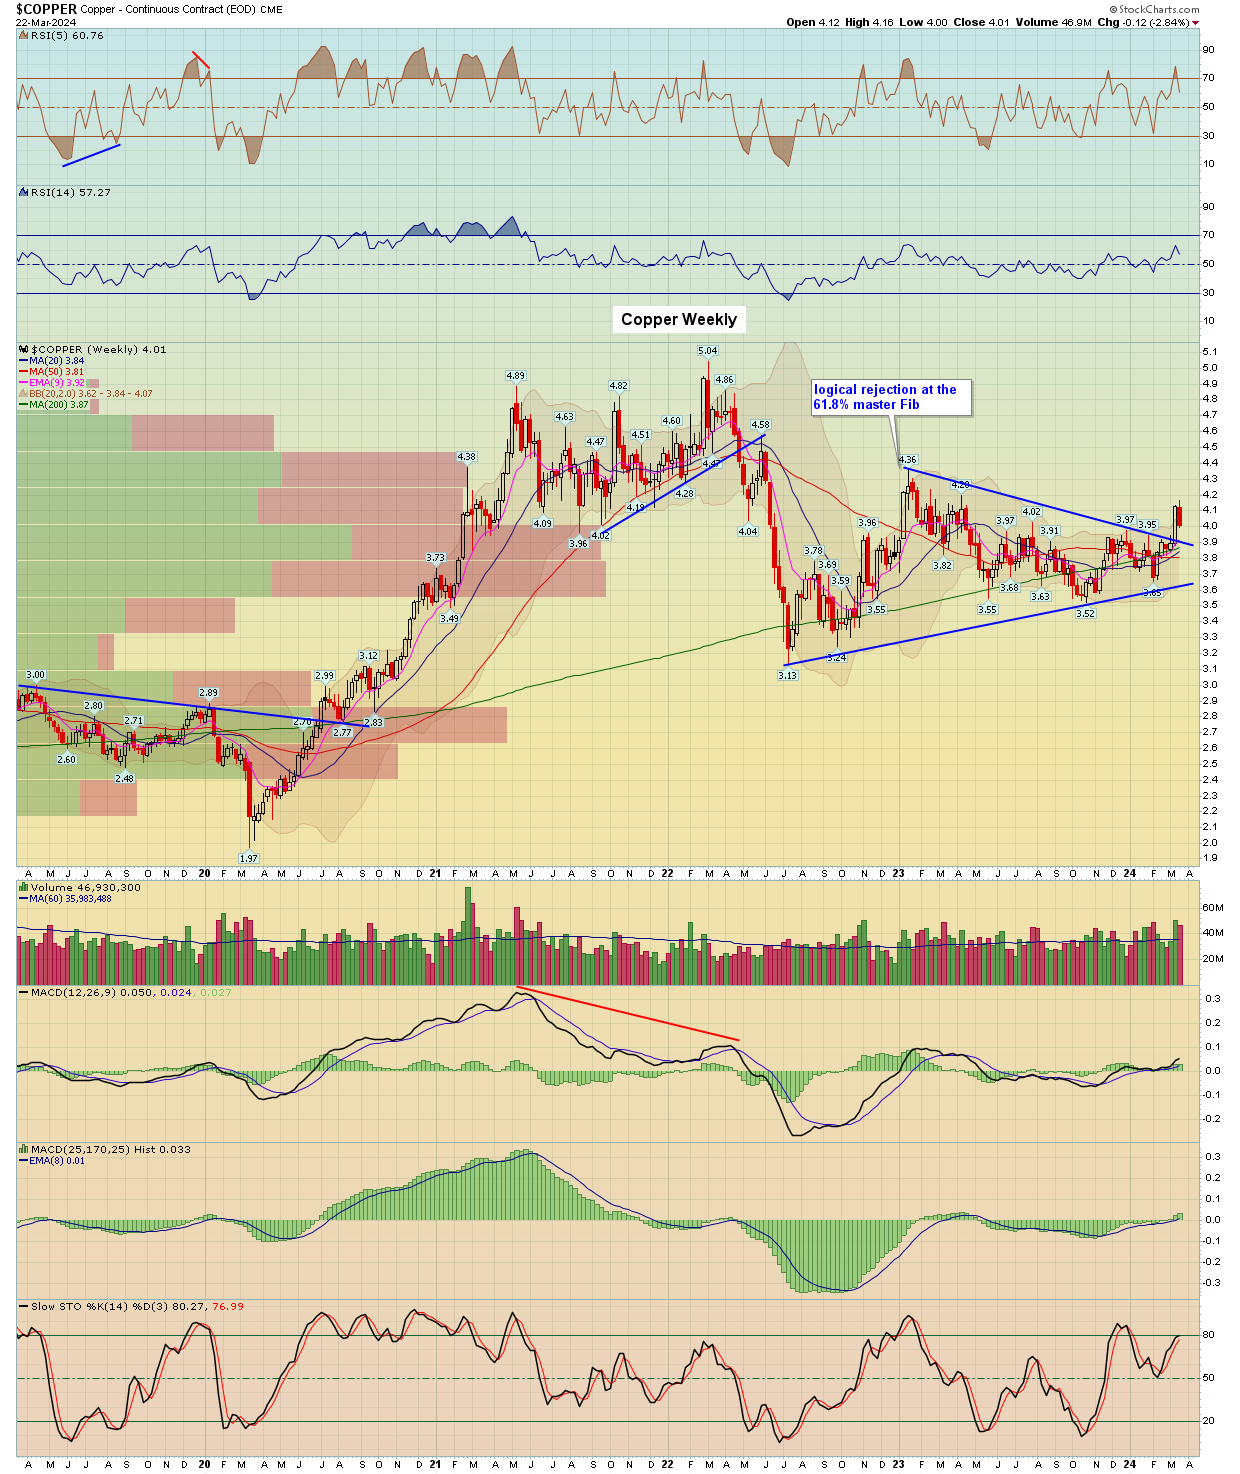
| Copper | COPPER - W | JJCB - W | -1.26% | -2.84% | 4.01 |
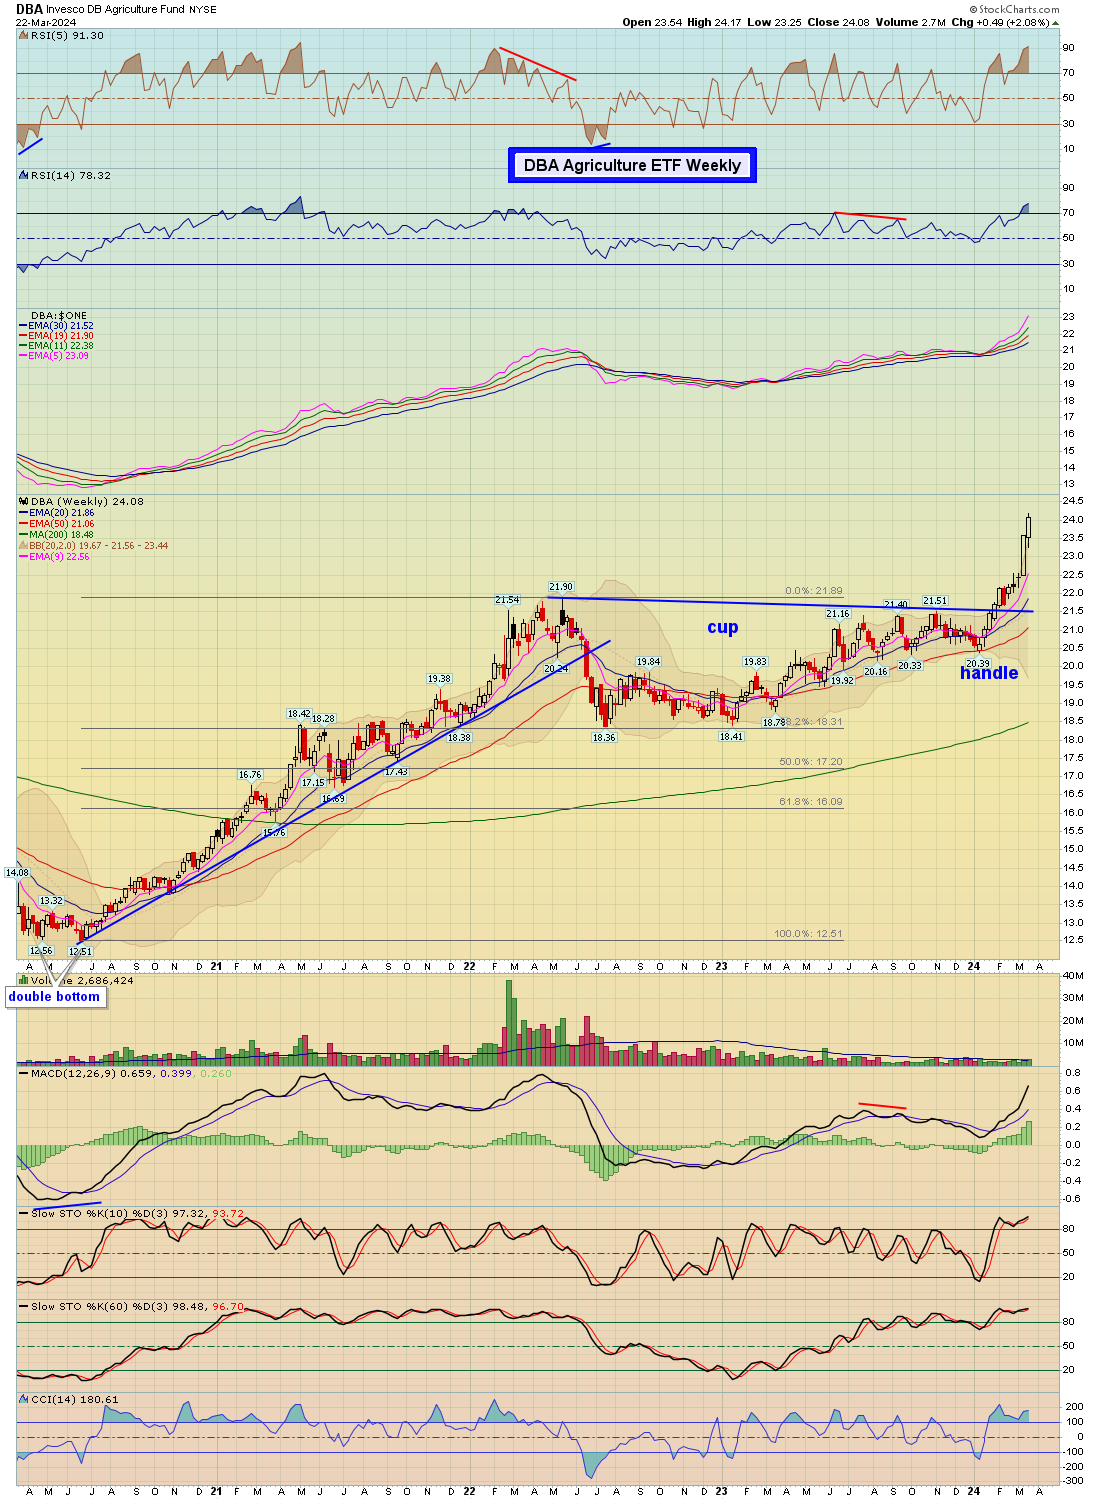
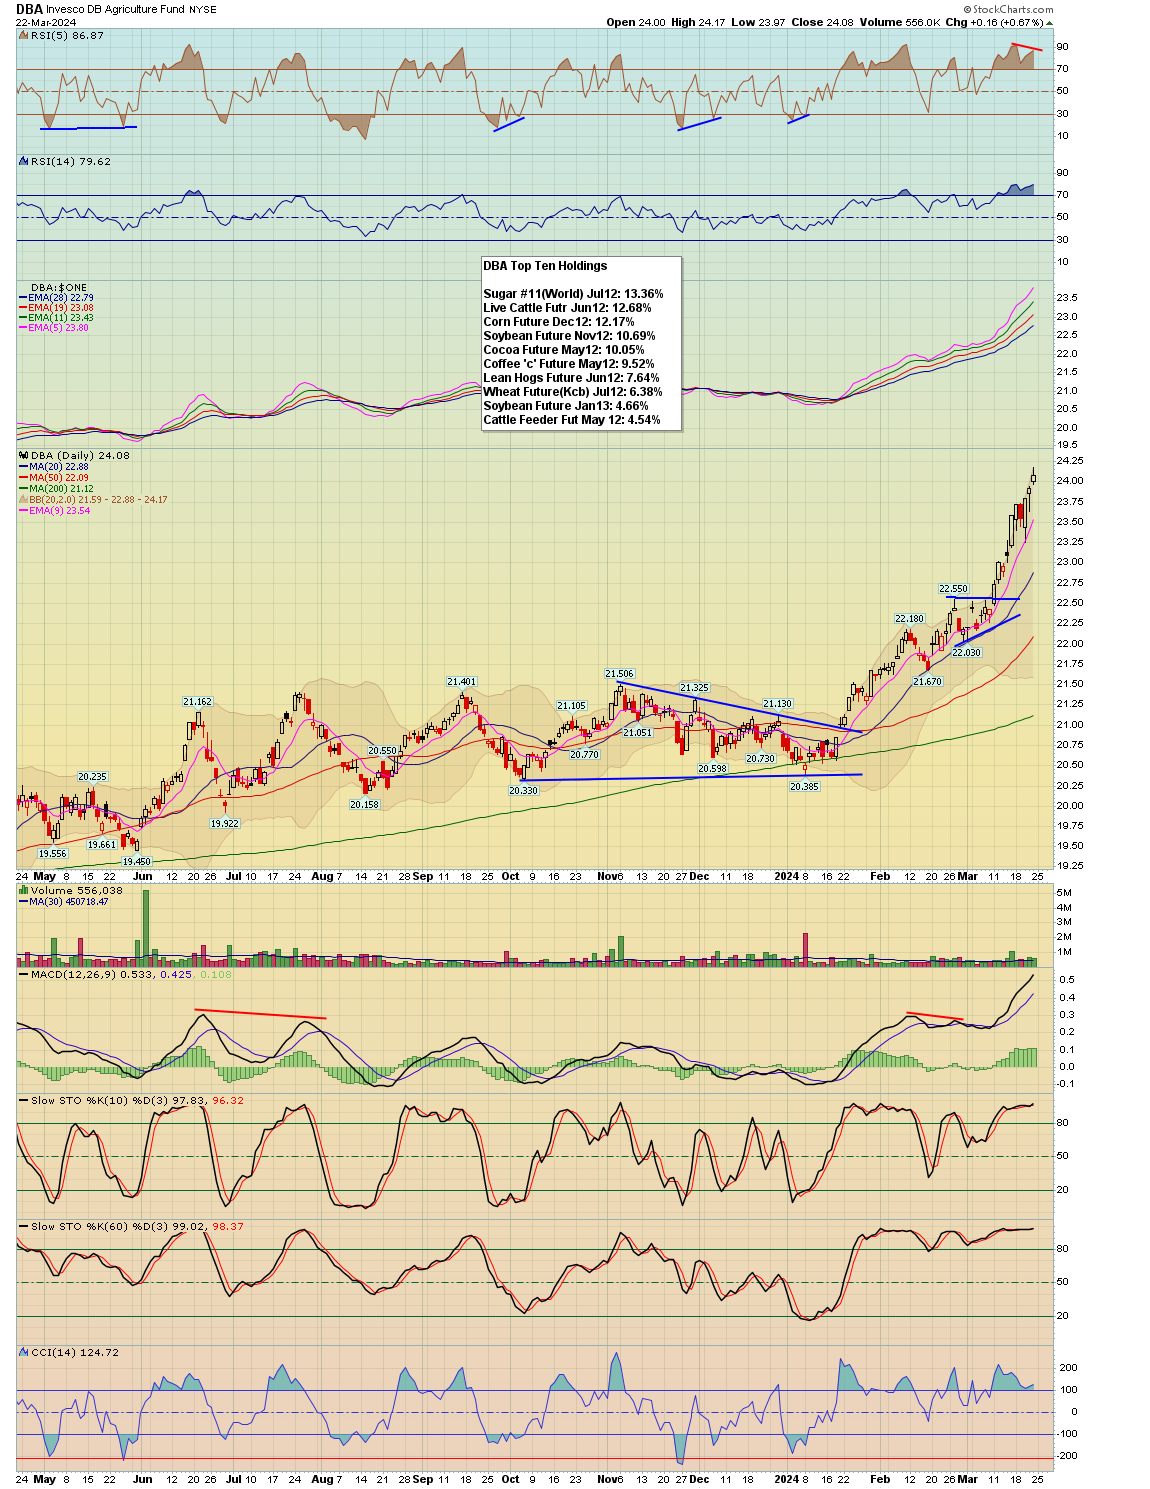
| Agriculture | DBA - W | 0.67% | 2.08% | 24.08 | |
| Corn | CORN - W | CORN - W | -0.34% | 0.57% | 439.25 |
| Wheat | WHEAT - W | WEAT - W | 1.46% | 4.97% | 554.75 |
| Coffee | COFFEE - W | 1.81% | 1.50% | 1.86 | |
| Sugar | CANE - W | -0.60% | -0.15% | 13.24 |
| Precious Metals | Index Symbol | ETF Symbol | % G / L Day | % G / L Week | Close |
|---|---|---|---|---|---|
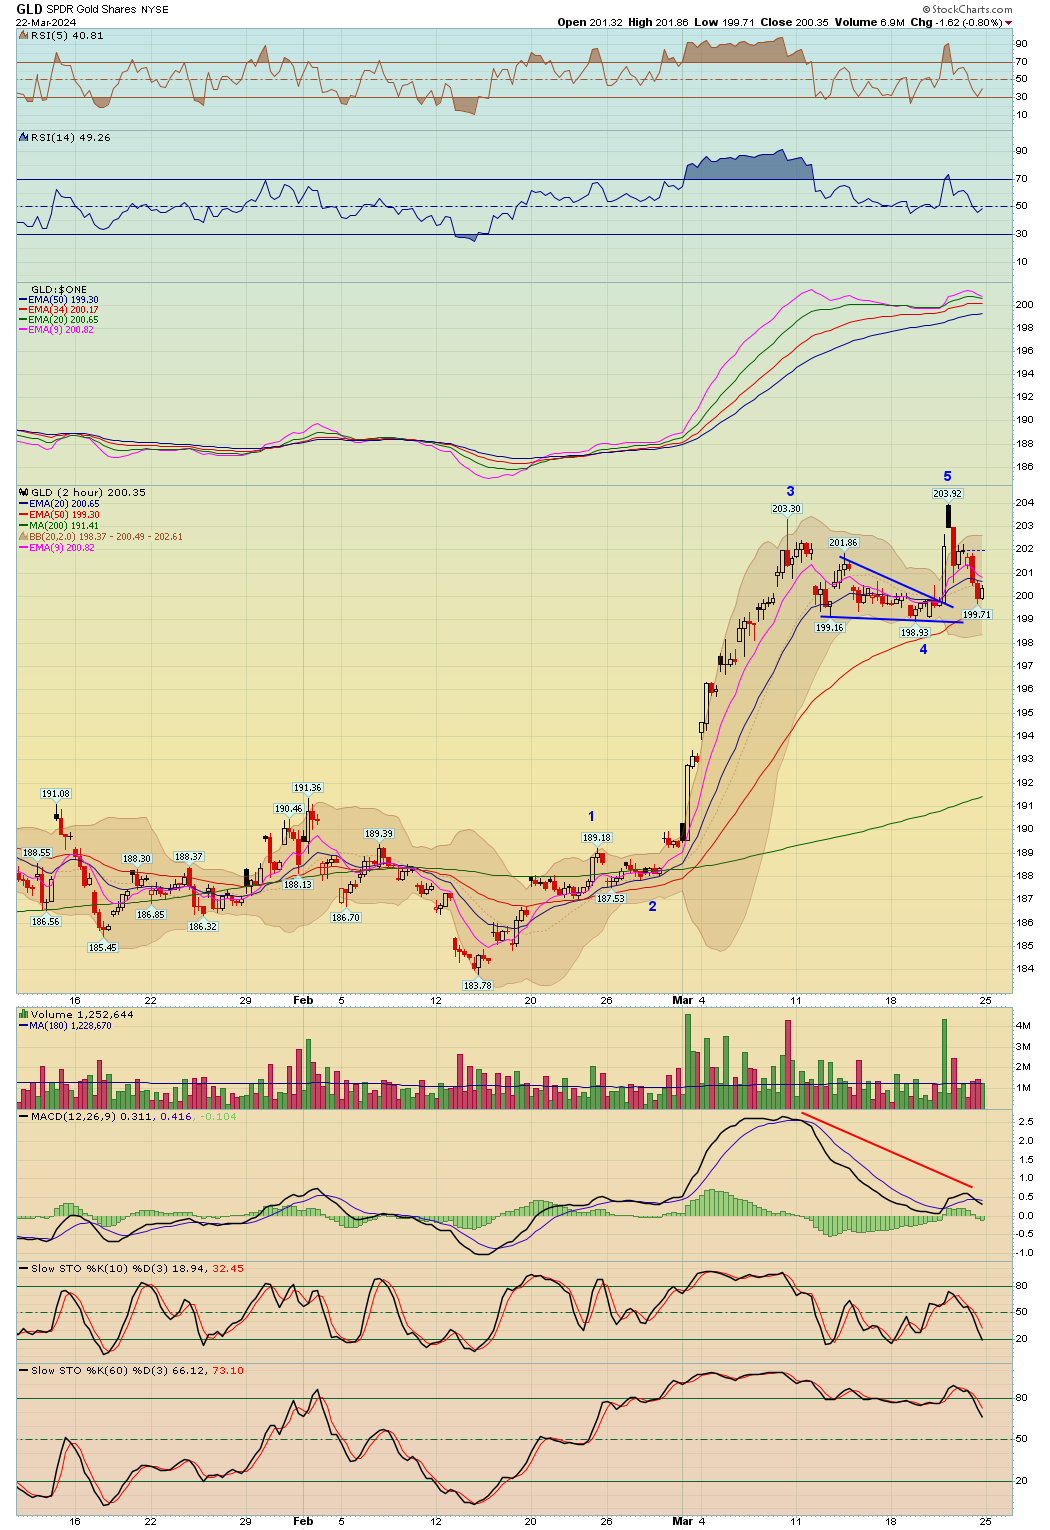
| Gold Metal | GLD - W | -0.80% | 0.32% | 200.35 | |
| Silver | SLV - W | -0.40% | -2.04% | 22.56 | |
| Platinum | PPLT - W | -1.35% | -4.63% | 82.36 | |
| Palladium | PALL - W | -2.86% | -8.40% | 90.87 | |
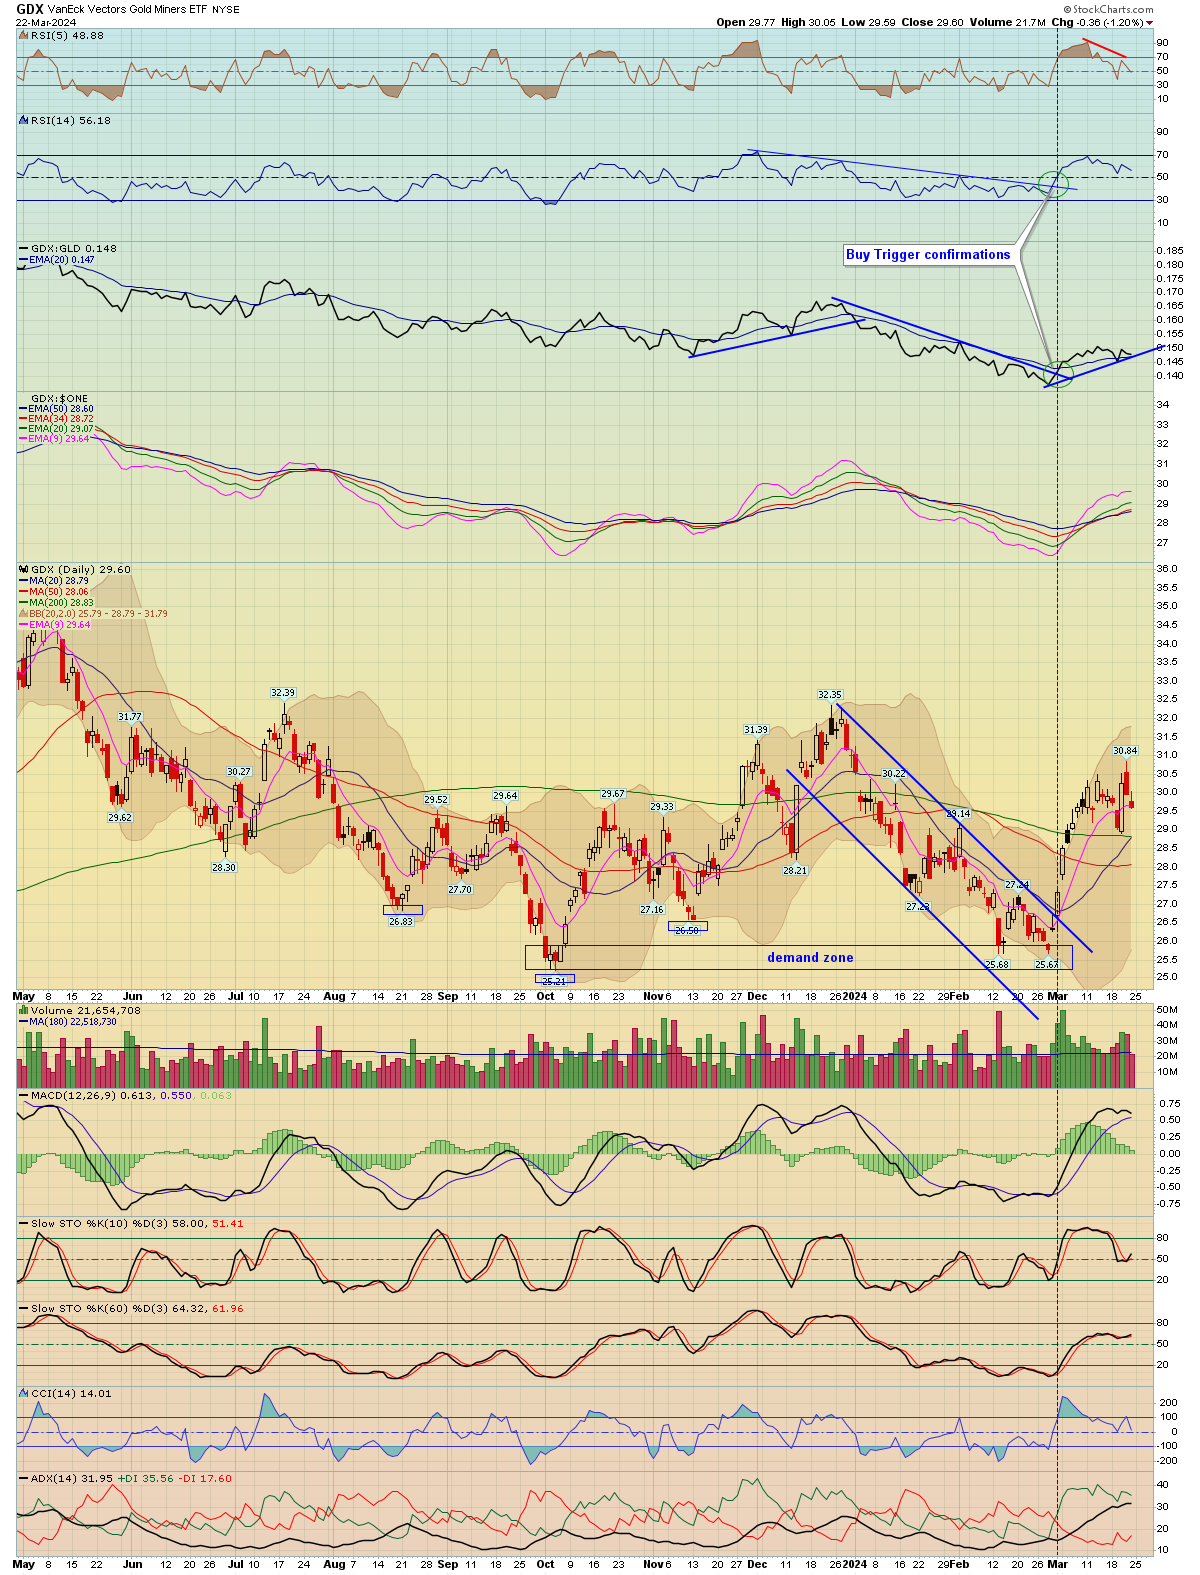
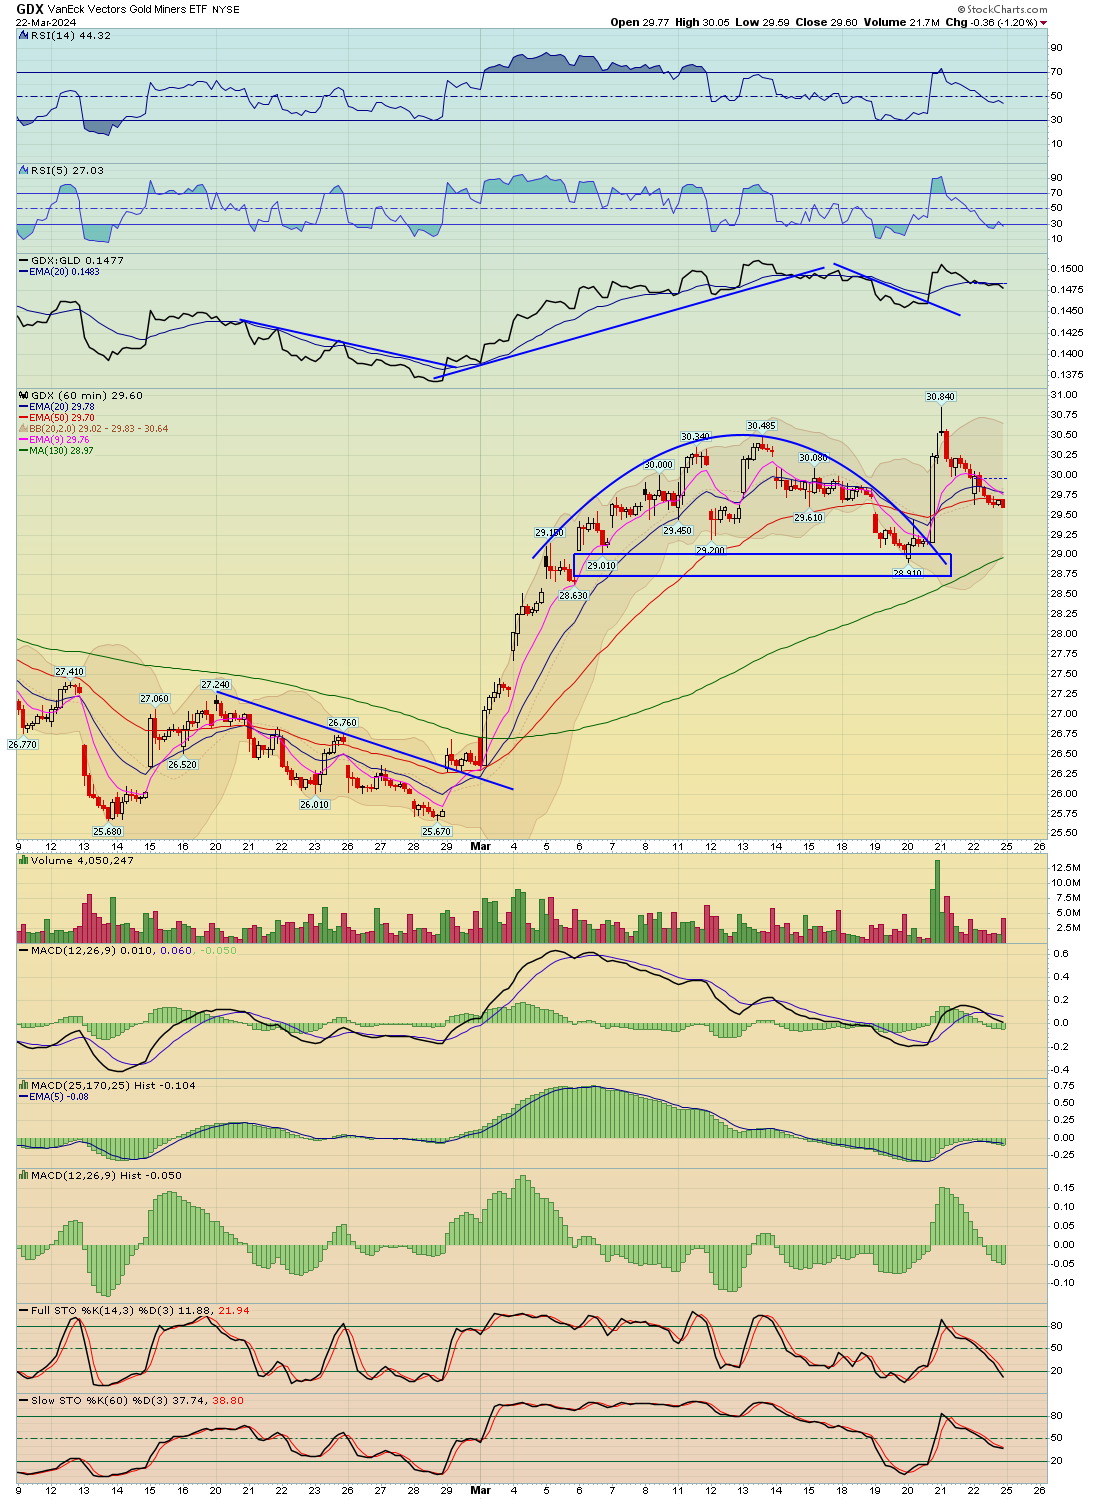
| GDX Gold Miners ETF | GDX - W | -1.20% | -0.97% | 29.60 |
| Bonds | Index Symbol | ETF Symbol | % G / L Day | % G / L Week | Close |
|---|---|---|---|---|---|
| High Yield Corporate Bond | HYG - W | -0.10% | 0.82% | 77.70 | |
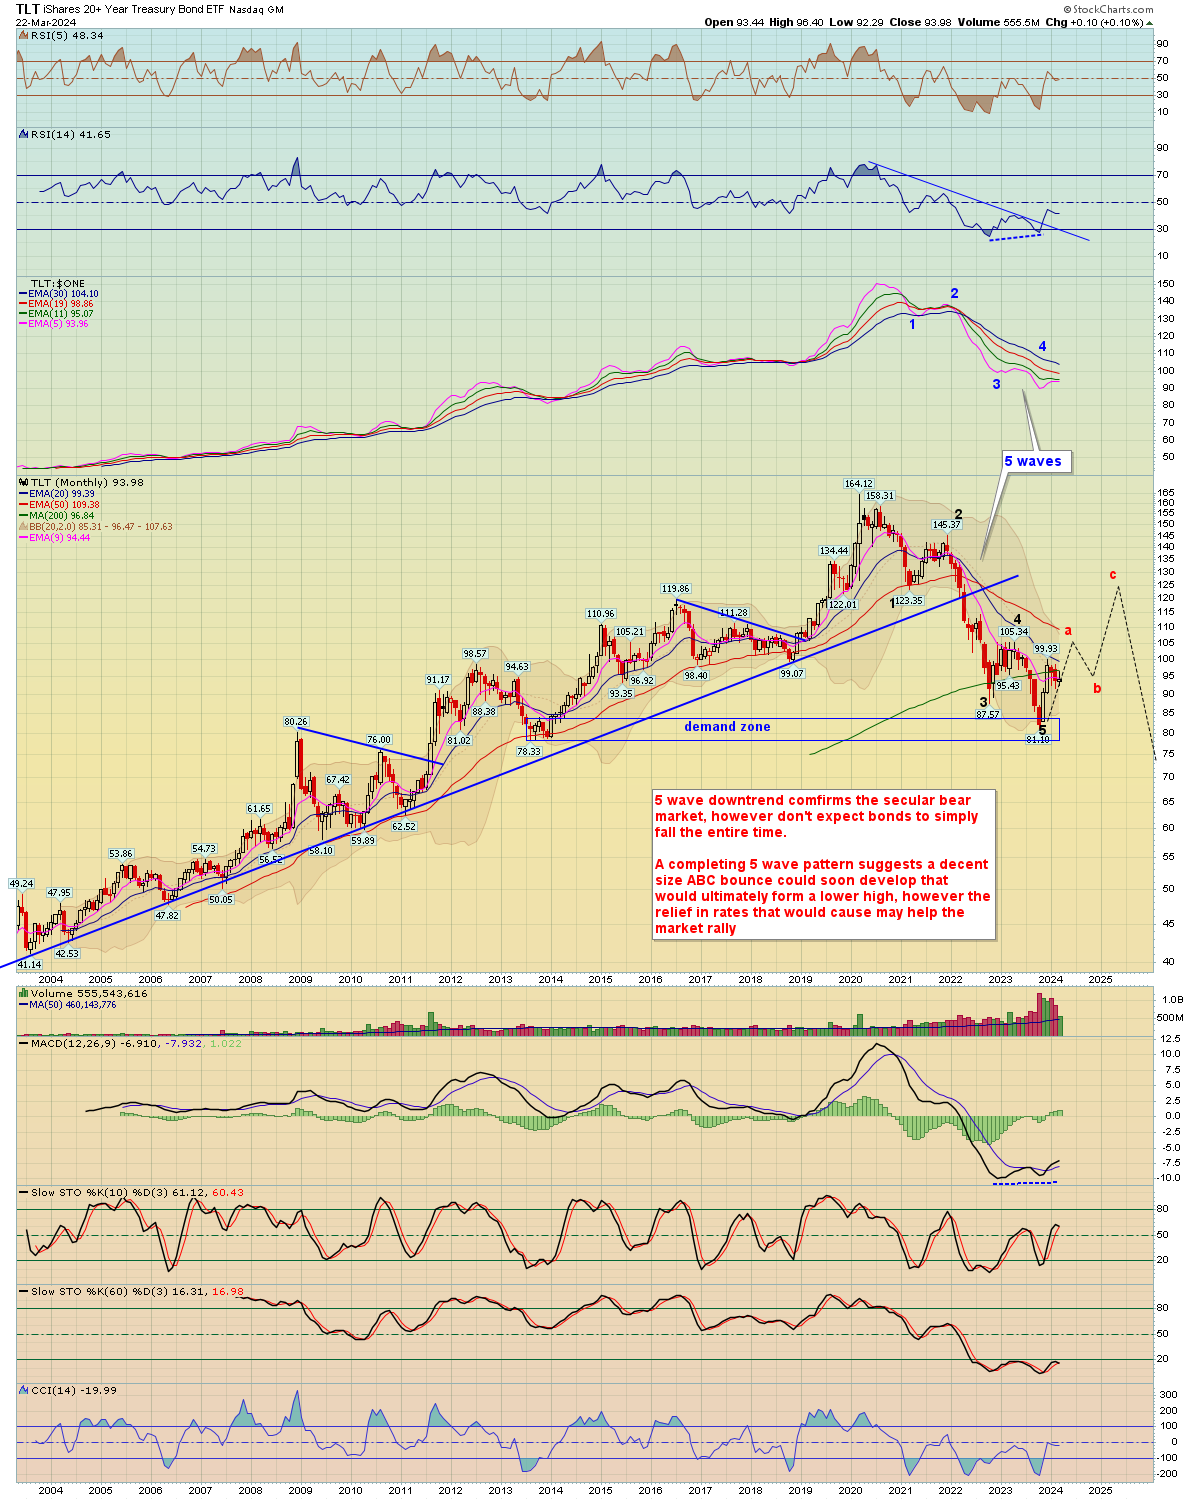
| TLT 20 Year Bond ETF | TLT - W | 0.96% | 1.12% | 93.98 | |
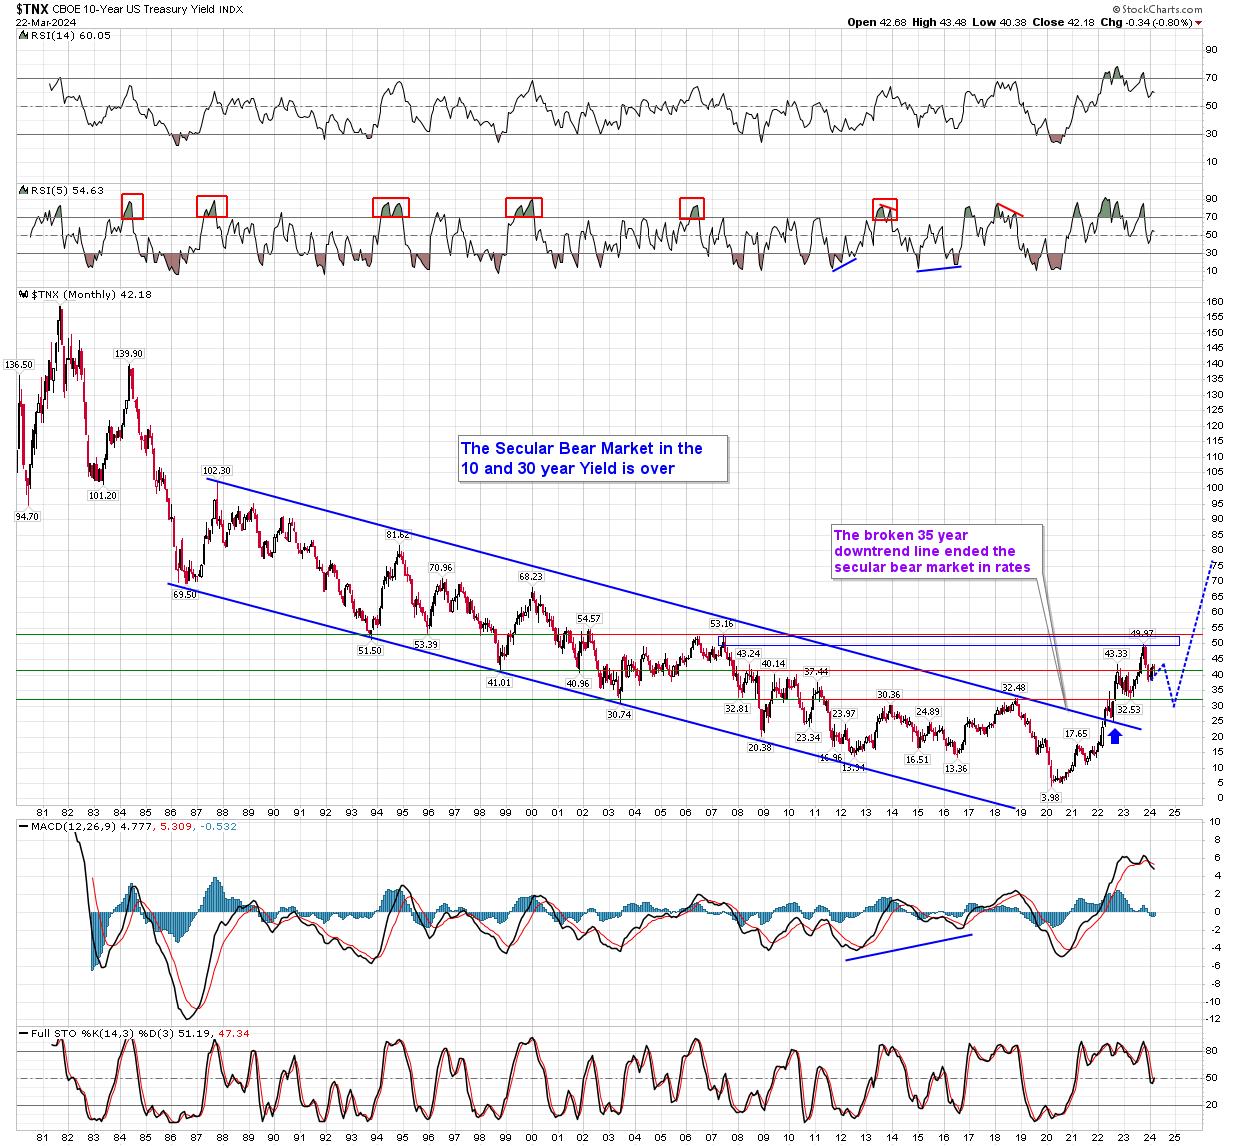
| 10 Year Treasury Yield | TNX - W | -1.24% | -2.00% | 42.18 | |
| 30 Year Treasury Yield | TYX - W | -1.13% | -0.81% | 43.92 |
9
| Release | ET | For | Trading Impact | Forecast | Consensus | Prior |
|---|---|---|---|---|---|---|
| Mar 25 | ||||||
| New Home Sales | 10:00 | Feb | High | 670K | 680K | 661K |
| Mar 26 | ||||||
| Durable Orders | 08:30 | Feb | Medium | 1.7% | 1.3% | -6.1% |
| Durable Goods âex transportation | 08:30 | Feb | Medium | 0.3% | 0.4% | -0.3% |
| FHFA Housing Price Index | 09:00 | Jan | Low | NA | NA | 0.1% |
| S&P Case-Shiller Home Price Index | 09:00 | Jan | Low | 6.6% | 6.7% | 6.1% |
| Consumer Confidence | 10:00 | Mar | High | 106.7 | 106.7 | 106.7 |
| Mar 27 | ||||||
| MBA Mortgage Applications Index | 07:00 | 03/23 | Low | NA | NA | -1.6% |
| EIA Crude Oil Inventories | 10:30 | 03/23 | High | NA | NA | -1.95M |
| Mar 28 | ||||||
| Initial Claims | 08:30 | 03/23 | High | 212K | 213K | 210K |
| Continuing Claims | 08:30 | 03/16 | High | NA | NA | 1807K |
| GDP - Third Estimate | 08:30 | Q4 | Low | 3.3% | 3.2% | 3.2% |
| GDP Deflator - Third Estimate | 08:30 | Q4 | Low | 1.7% | 1.7% | 1.6% |
| Chicago PMI | 09:45 | Mar | Low | 45.2 | 45.4 | 44.0 |
| Univ. of Michigan Consumer Sentiment - Final | 10:00 | Mar | Low | 76.8 | 76.5 | 76.5 |
| Pending Home Sales | 10:00 | Feb | Low | 1.6% | 2.1% | -4.9% |
| EIA Natural Gas Inventories | 10:30 | 03/23 | Low | NA | NA | +7 bcf |
Stock Earnings Calendar:
Click here for a list of Stocks that are reporting Earnings
**Generally we never hold a position into earnings since the risk/reward is too great
10 - View Live Chart
11 - View Live Chart
12
13 - View Live Chart
14 - View Live Chart
15 - View Live Chart
16 - View Live Chart
17 - View Live Chart
18 - View Live Chart
19
20
21 - View Live Chart
22 - View Live Chart
23
24 - View Live Chart
25 - View Live Chart
26 - View Live Chart
27 - View Live Chart
28 - View Live Chart
29
30
31 - View Live Chart
32 - View Live Chart
33 - View Live Chart
34 - View Live Chart
35 - View Live Chart
36 - View Live Chart
37 - View Live Chart
38 - View Live Chart
39 - View Live Chart
40 - View Live Chart
41 - View Live Chart

42 - View Live Chart
43 - View Live Chart
44 - View Live Chart
45 - View Live Chart
46 - View Live Chart
47 - View Live Chart
48 - View Live Chart
49 - View Live Chart
50 - View Live Chart
51 - View Live Chart
52 - View Live Chart
53 - View Live Chart
54 - View Live Chart
55 - View Live Chart
56 - View Live Chart
57 - View Live Chart
58 - View Live Chart
59 - View Live Chart
60 - View Live Chart
61 - View Live Chart
62 - View Live Chart
63 - View Live Chart
64 - View Live Chart
65 - View Live Chart
66 - View Live Chart
67 - View Live Chart
68 - View Live Chart
69 - View Live Chart
70 - View Live Chart
71 - View Live Chart
72 - View Live Chart
73 - View Live Chart
74 - View Live Chart
75 - View Live Chart
76 - View Live Chart
77 - View Live Chart
78 - View Live Chart
79 - View Live Chart
80 - View Live Chart
81 - View Live Chart
82 - View Live Chart
83 - View Live Chart
84 - View Live Chart
85 - View Live Chart
86 - View Live Chart
87 - View Live Chart
88 - View Live Chart
89 - View Live Chart
90 - View Live Chart
91 - View Live Chart
92 - View Live Chart
93 - View Live Chart
94 - View Live Chart
95 - View Live Chart
96 - View Live Chart
97 - View Live Chart
98 - View Live Chart
99 - View Live Chart
100 - View Live Chart
101 - View Live Chart
102 - View Live Chart
103 - View Live Chart
104 - View Live Chart
105 - View Live Chart
106 - View Live Chart
107 - View Live Chart
108 - View Live Chart
109 - View Live Chart
110 - View Live Chart
111 - View Live Chart
112 - View Live Chart
113 - View Live Chart
114 - View Live Chart
115 - View Live Chart
116 - View Live Chart
- Hide Player Link to Newsletter Audio
- Hide Player Link to Newsletter Audio