Wednesday January 10th, 2024 Newsletter - free
Disclaimer: Intraday Chart Links will show up as daily charts unless you have an active stockcharts.com membership and are signed in, you can sign up here.
1
BPT Newsletter technical analysis on the markets and trading systems update Jan 10th, 2024
Table of Contents:
1. Opening Discussion
2. Systems Discussion: Mean Reversion and KISS Trend systems
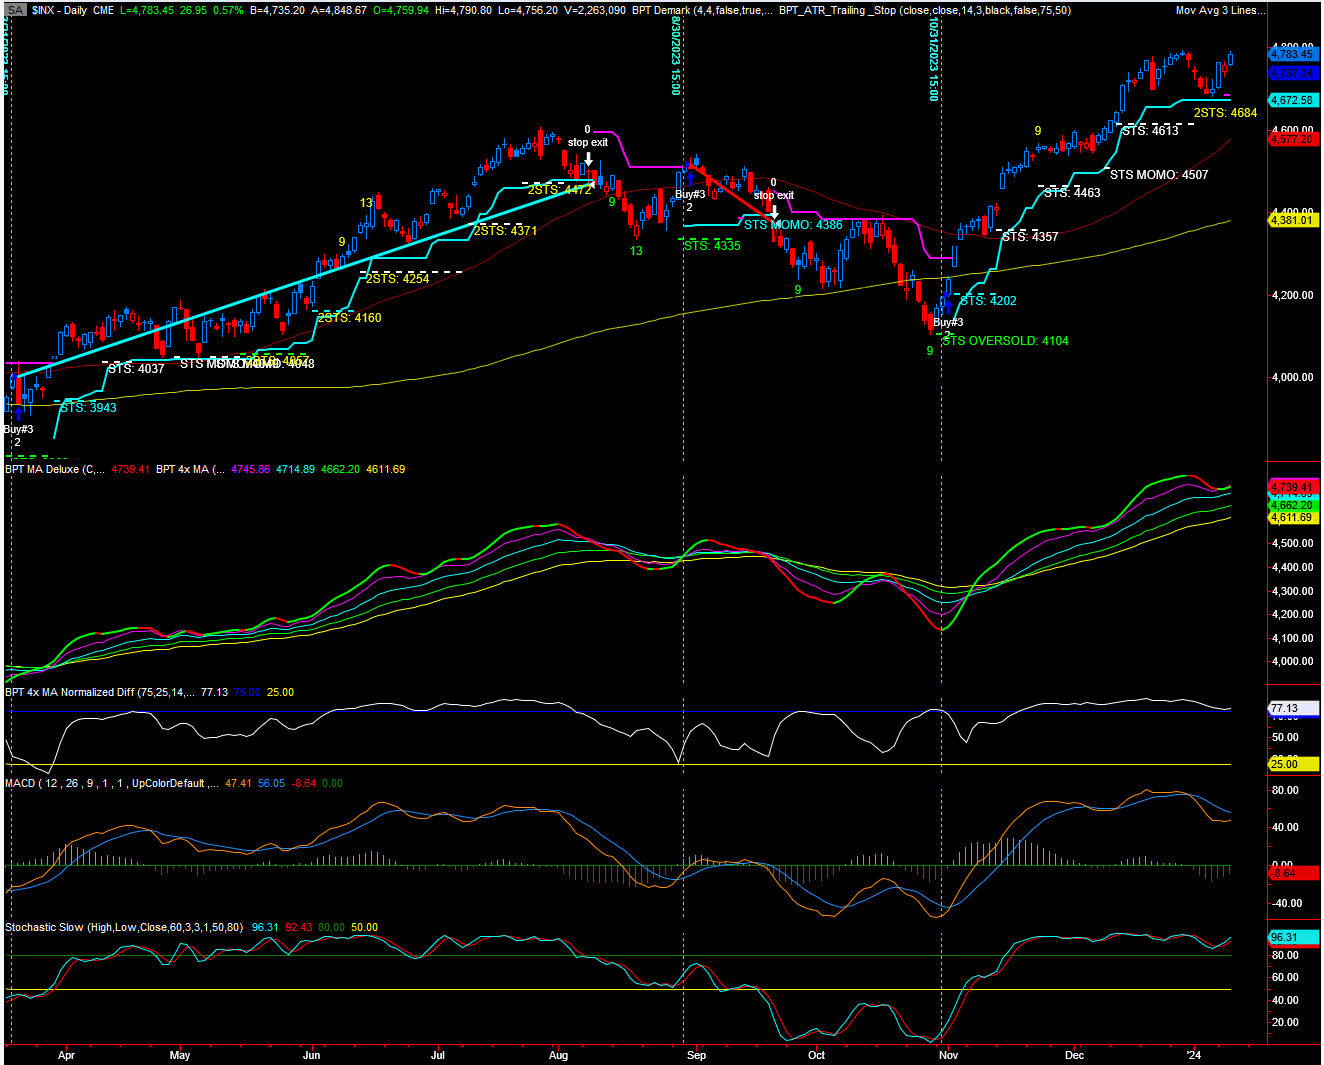
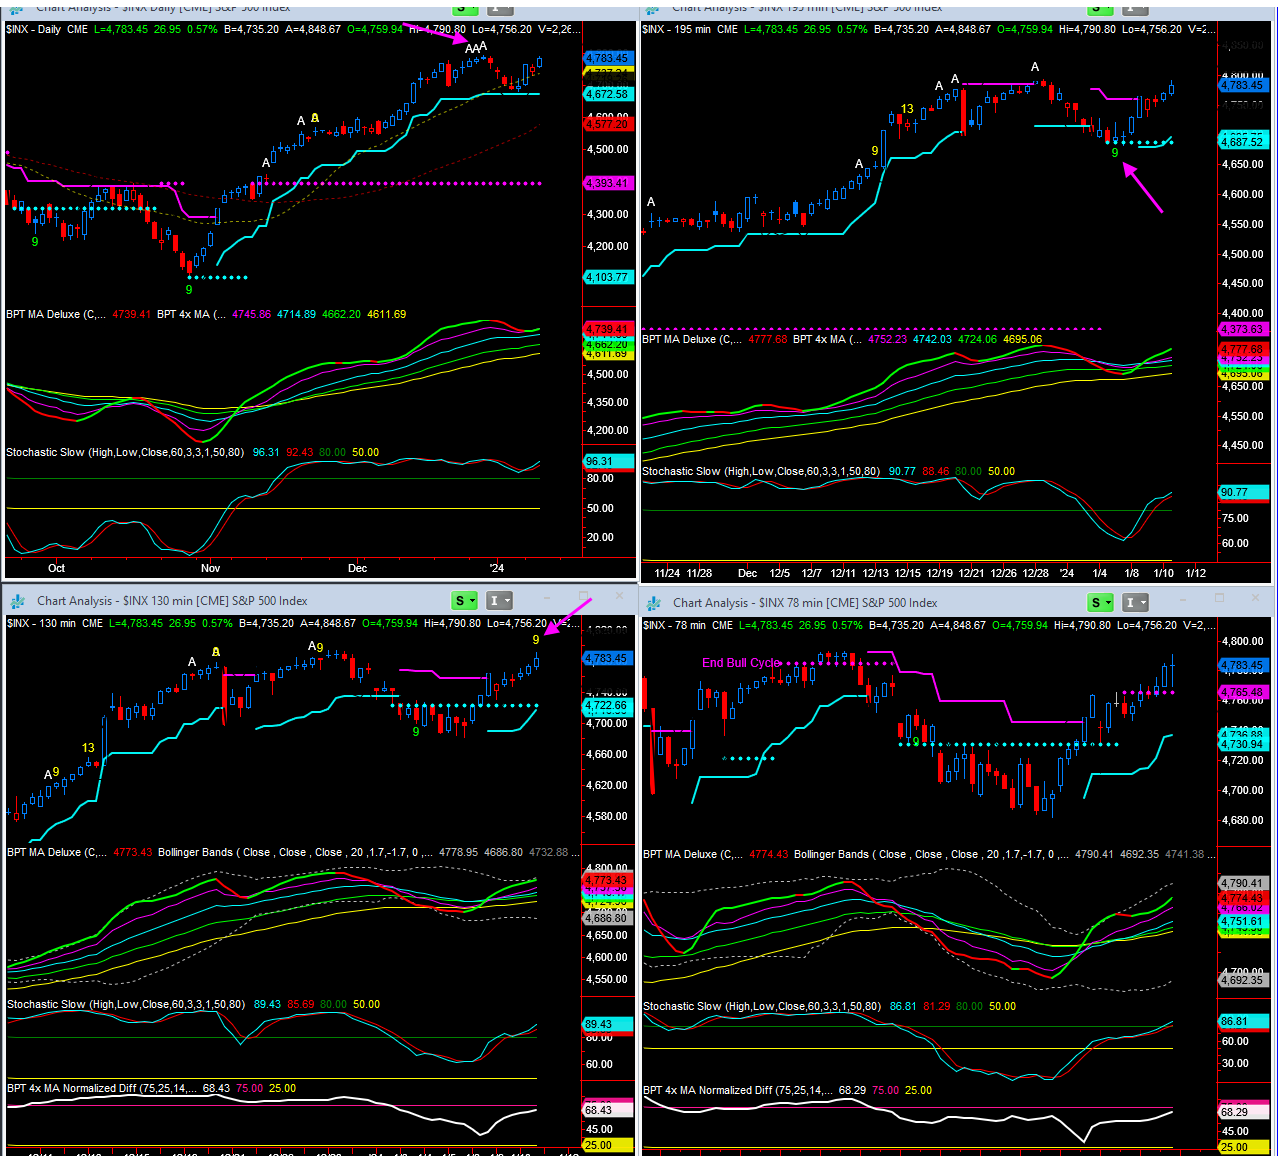
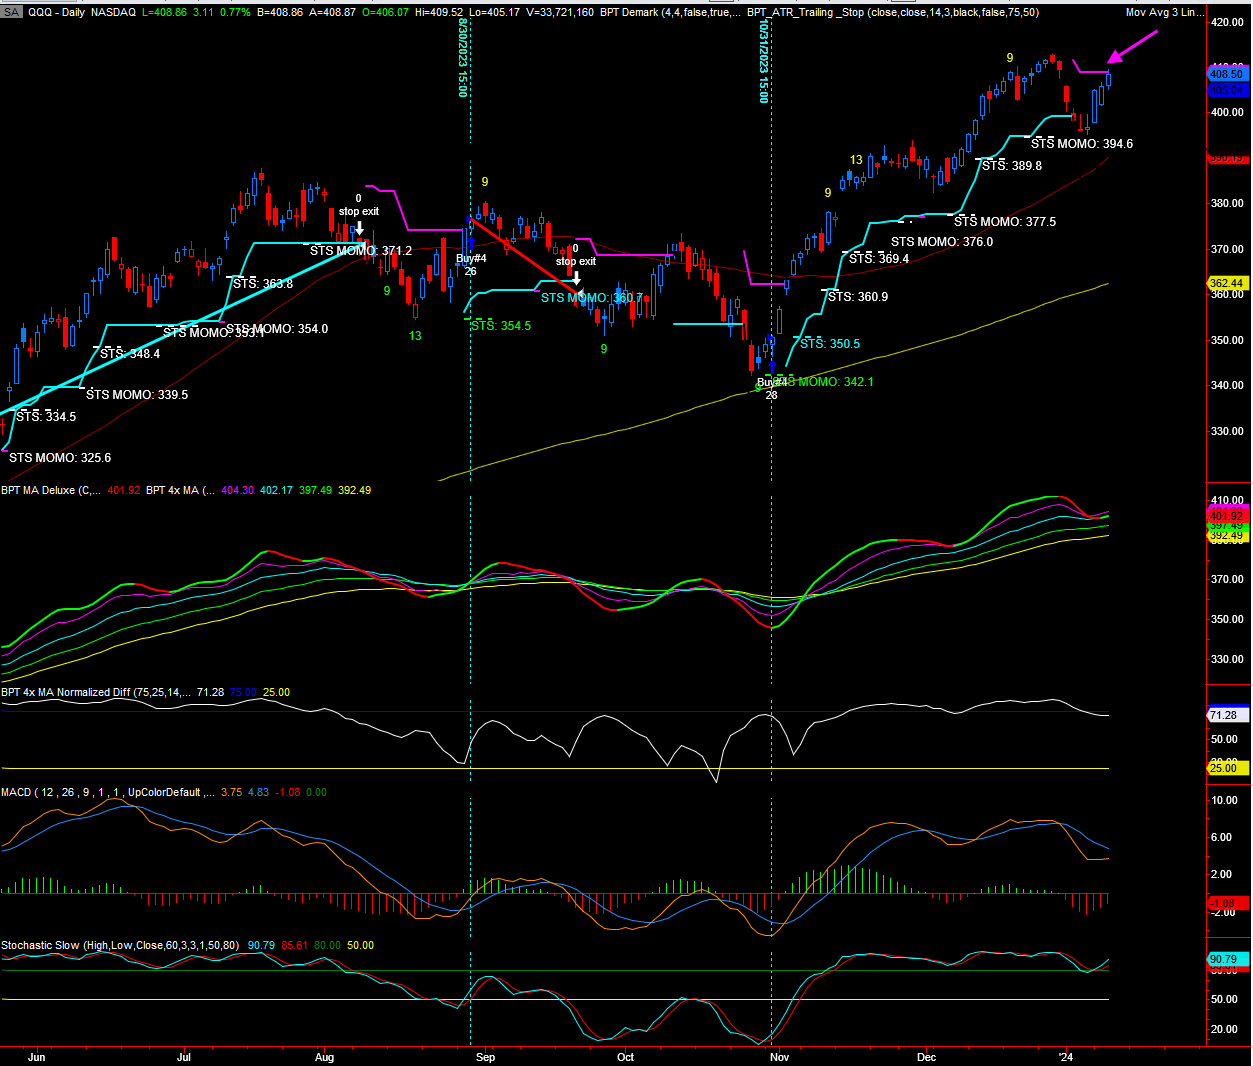
3. General Market Analysis: SPX and Other Major Indices
4. Custom Indicators/Systems (VIX, NYMO, NAMO) and Bonds (TLT/HYG)
5. Major Sectors
6. US Dollar, Commodities, Precious Metals and GDX
7. Trade Ideas: NICE DAY for the trade ideas and I put out a handful of new ones in the morning (MSFT, NVDA, AQN, HCAT, LVS etc)
- SEC approves rule changes that pave the way for bitcoin ETFs
Key Events for This Week:
1. Crude Oil Inventories - Wednesday
2. Auction of 10Y Notes - Wednesday
3. CPI Inflation Data - Thursday
4. Initial Jobless Claims - Thursday
5. PPI Inflation Data - Friday
6. Total of Four Fed Speakers Next Week
# Administrative Note: Steve and I will both be traveling and away on Monday January 15th-Wednesday January 17th. Monday the markets are closed for MLK Holiday so you will be away for two trading sessions.
The nice thing about the KISS systems is that they allow us to follow the trend, but with a protective stop, sort of like life insurance for your portfolio.
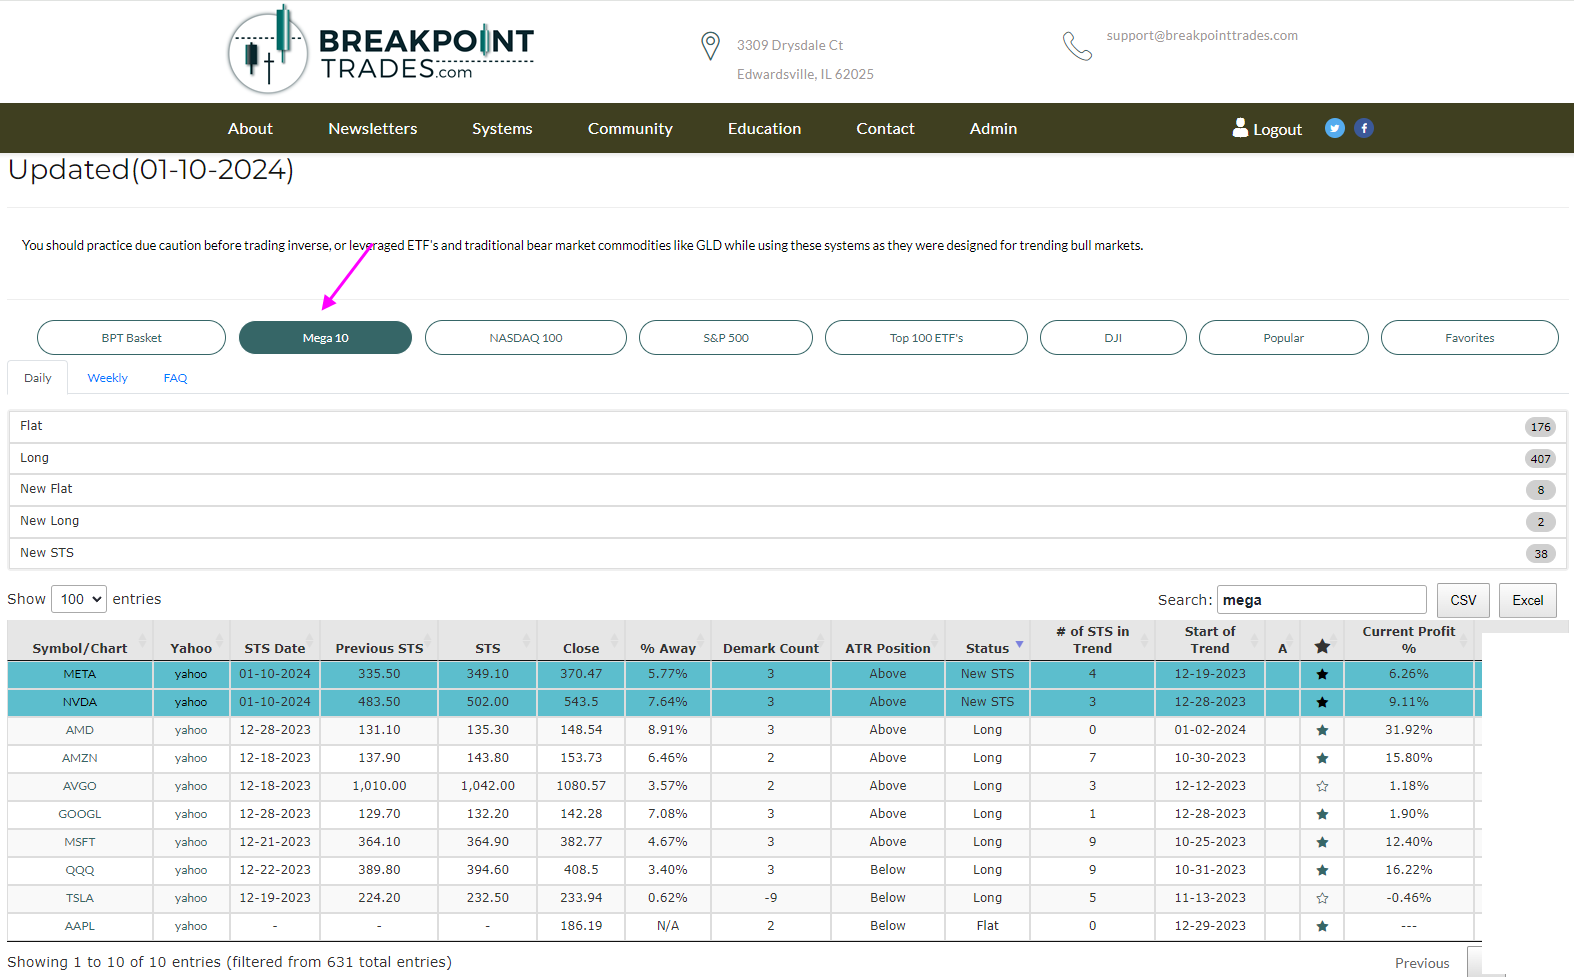
The KISS Systems for the indexes and many large cap stocks have been long since October just off the lows and are doing well. The KISS systems did their job avoiding a lot of the correction and going back long 2 to 3 days off the lows, thus capturing this rally with protection. KISS STS Tables for Indexes, ETF's, Stocks
------
KISS Trend Following Systems - Breakpoint Trades proprietary trend following systems that dynamically follow an uptrend and raise stops along the way giving you an exit, while allowing you to stay in the trend. Check the indexes, as well as your individual stocks, ETF's etc, to see where the system is suggesting a stop.
KISS STS Tables for Indexes, ETF's, Stocks - check your stocks and ETF's to see where they are suggesting smart trailing stops if long.
2

3

4

5

6
7
| Major Indexes | Index Symbol | ETF Symbol | % G / L Day | % G / L Week | Close |
|---|---|---|---|---|---|
| Dow Jones | INDU - W | DIA - W | 0.45% | 0.61% | 37,695.73 |
| S&P 500 | SPX - W | SPY - W | 0.57% | 1.84% | 4,783.45 |
| Nasdaq | COMPQ - W | 0.75% | 3.07% | 14,969.65 | |
| NDX 100 | NDX - W | QQQ - W | 0.69% | 2.99% | 16,793.05 |
| Russel 2000 (Small Caps) | IWM - W | 0.06% | 0.95% | 195.08 |
| Market Sectors | Index Symbol | ETF Symbol | % G / L Day | % G / L Week | Close |
|---|---|---|---|---|---|
| Transports | TRAN - W | IYT - W | 0.58% | 0.61% | 15,602.87 |
| Banks | BKX - W | -0.36% | -1.11% | 96.06 | |
| Financials | XLF - W | 0.16% | 0.16% | 37.81 | |
| Brokers | XBD - W | -0.36% | -1.13% | 543.65 | |
| XLE (Energy Select) | XLE - W | -0.98% | -3.70% | 81.55 | |
| Oil Service Holders | OIH - W | -1.30% | -6.17% | 286.45 | |
| Technology | XLK - W | 0.85% | 3.55% | 190.65 | |
| Semiconductor | SOX - W | SMH - W | -0.39% | 2.93% | 4,048.84 |
| Communication Services | XLC - W | 0.93% | 2.29% | 73.69 | |
| Retail | XRT - W | 0.30% | 1.20% | 70.23 | |
| Consumer Staples | XLP - W | -0.21% | 0.79% | 72.58 | |
| Consumer Discretionary | XLY - W | 0.80% | 2.14% | 176.31 | |
| Industrials | XLI - W | 0.51% | 0.85% | 112.38 | |
| Real Estate | IYR - W | 0.08% | 0.81% | 90.39 | |
| Homebuilders | HGX - W | XHB - W | 1.53% | 3.18% | 661.53 |
| Materials | XLB - W | -0.13% | -0.85% | 83.62 | |
| Metals And Mining | XME - W | -0.88% | -1.75% | 57.15 | |
| Biotechnology | BTK - W | XBI - W | -0.73% | -0.08% | 5,406.51 |
| Healthcare | XLV - W | 0.46% | 1.33% | 140.97 | |
| Drugs | DRG - W | 0.72% | 1.30% | 959.06 | |
| Utilities | UTIL - W | XLU - W | -0.11% | 0.08% | 899.39 |
| Currencies | Index Symbol | ETF Symbol | % G / L Day | % G / L Week | Close |
|---|---|---|---|---|---|
| US Dollar | UUP - W | -0.18% | -0.04% | 27.40 | |
| Euro | XEU - W | FXE - W | 0.37% | 0.25% | 109.69 |
| Yen | XJY - W | FXY - W | -0.85% | -0.76% | 68.63 |
| Australian | XAD - W | FXA - W | 0.23% | -0.24% | 66.98 |
| British Pound | XBP - W | FXB - W | 0.20% | 0.13% | 127.34 |
| Chinese Yuan | CYB - W | 0.00% | 0.00% | 24.27 | |
| Canadian Dollar | CDW - W | FXC - W | 0.08% | -0.13% | 74.73 |
| Swiss Franc | XSF - W | FXF - W | 0.15% | -0.16% | 117.48 |
| Cryptocurrencies | Index Symbol | ETF Symbol | % G / L Day | % G / L Week | Close |
|---|---|---|---|---|---|
| Bitcoin | BTCUSD - W | -0.31% | 4.61% | 45,978.77 | |
| Bitcoin Cash | BCHUSD - W | 2.81% | 8.33% | 251.77 | |
| Etherium | ETHUSD - W | 7.83% | 13.76% | 2,528.66 | |
| Monero | XMRUSD - W | 4.03% | 2.77% | 150.28 | |
| Litecoin | LTCUSD - W | 3.97% | 8.34% | 69.67 | |
| Ripple | XRPUSD - W | 5.49% | 8.38% | 0.60 |
| Commodities | Index Symbol | ETF Symbol | % G / L Day | % G / L Week | Close |
|---|---|---|---|---|---|
| Commodities | DBC - W | -0.68% | -1.40% | 21.82 | |
| Crude Oil | WTIC - W | USO - W | -1.20% | -3.31% | 71.37 |
| Gasoline | GASO - W | -0.45% | -1.76% | 2.09 | |
| Natural Gas | NATGAS - W | UNG - W | -4.73% | 5.05% | 3.04 |
| Copper | COPPER - W | JJCB - W | 0.60% | -0.66% | 3.78 |
| Agriculture | DBA - W | -0.15% | 0.19% | 20.62 | |
| Corn | CORN - W | CORN - W | 0.05% | -0.27% | 459.50 |
| Wheat | WHEAT - W | WEAT - W | 0.12% | -0.85% | 610.75 |
| Coffee | COFFEE - W | 1.49% | 0.71% | 1.84 | |
| Sugar | CANE - W | -0.71% | 0.59% | 12.65 |
| Precious Metals | Index Symbol | ETF Symbol | % G / L Day | % G / L Week | Close |
|---|---|---|---|---|---|
| Gold Metal | GLD - W | -0.23% | -0.98% | 187.50 | |
| Silver | SLV - W | -0.29% | -1.27% | 20.94 | |
| Platinum | PPLT - W | -1.18% | -4.34% | 84.90 | |
| Palladium | PALL - W | 2.27% | -2.76% | 92.20 | |
| GDX Gold Miners ETF | GDX - W | -0.21% | -2.22% | 29.11 |
| Bonds | Index Symbol | ETF Symbol | % G / L Day | % G / L Week | Close |
|---|---|---|---|---|---|
| High Yield Corporate Bond | HYG - W | 0.18% | 0.90% | 77.37 | |
| TLT 20 Year Bond ETF | TLT - W | -0.47% | -0.12% | 96.17 | |
| 10 Year Treasury Yield | TNX - W | 0.27% | -0.30% | 40.30 | |
| 30 Year Treasury Yield | TYX - W | 0.36% | 0.00% | 42.00 |
8
| Release | ET | For | Trading Impact | Forecast | Consensus | Prior |
|---|---|---|---|---|---|---|
| Jan 08 | ||||||
| Consumer Credit | 15:00 | Nov | Low | NA | $9.3B | $5.8B |
| Jan 09 | ||||||
| Trade Balance | 08:30 | Nov | Medium | NA | -$64.7B | -$64.3B |
| Jan 10 | ||||||
| MBA Mortgage Applications Index | 07:00 | 01/06 | Low | NA | NA | -9.4% |
| Wholesale Inventories | 10:00 | Nov | Low | -0.2% | -0.2% | -0.4% |
| EIA Crude Oil Inventories | 10:30 | 01/06 | High | NA | NA | -5.50M |
| Jan 11 | ||||||
| CPI | 08:30 | Dec | High | 0.2% | 0.2% | 0.1% |
| Core CPI | 08:30 | Dec | High | 0.2% | 0.2% | 0.3% |
| Initial Claims | 08:30 | 01/06 | High | 213K | 209K | 202K |
| Continuing Claims | 08:30 | 12/30 | High | NA | NA | 1855K |
| EIA Natural Gas Inventories | 10:30 | 01/06 | Low | NA | NA | -14 bcf |
| Treasury Budget | 14:00 | Dec | Low | NA | NA | -$314.0B |
| Jan 12 | ||||||
| PPI | 08:30 | Dec | High | 0.1% | 0.1% | 0.0% |
| Core PPI | 08:30 | Dec | High | 0.1% | 0.2% | 0.0% |
Stock Earnings Calendar:
Click here for a list of Stocks that are reporting Earnings
**Generally we never hold a position into earnings since the risk/reward is too great
9 - View Live Chart

10 - View Live Chart

11 - View Live Chart

12 - View Live Chart

13 - View Live Chart

14
15
16 - View Live Chart

17 - View Live Chart

18 - View Live Chart

19 - View Live Chart

20 - View Live Chart

21 - View Live Chart

22 - View Live Chart

23
24
25 - View Live Chart

26 - View Live Chart

27 - View Live Chart

28 - View Live Chart

29 - View Live Chart

30 - View Live Chart

31 - View Live Chart

32 - View Live Chart

33 - View Live Chart

34 - View Live Chart

35 - View Live Chart

36 - View Live Chart

37 - View Live Chart

38 - View Live Chart

39 - View Live Chart

40 - View Live Chart

41 - View Live Chart

42 - View Live Chart

43 - View Live Chart

44 - View Live Chart

45 - View Live Chart

46 - View Live Chart

47 - View Live Chart

48 - View Live Chart

49 - View Live Chart

50 - View Live Chart

51 - View Live Chart

52 - View Live Chart

53

54 - View Live Chart

55 - View Live Chart

56 - View Live Chart

57 - View Live Chart

58 - View Live Chart

59 - View Live Chart

60 - View Live Chart

61 - View Live Chart

62 - View Live Chart

63 - View Live Chart

64 - View Live Chart

65 - View Live Chart

66 - View Live Chart

67 - View Live Chart

68 - View Live Chart

69 - View Live Chart

70 - View Live Chart

71 - View Live Chart

72 - View Live Chart

73 - View Live Chart

74 - View Live Chart

75 - View Live Chart

76 - View Live Chart

77 - View Live Chart

78 - View Live Chart

79 - View Live Chart

- Hide Player Link to Newsletter Audio
- Hide Player Link to Newsletter Audio