Wednesday August 17th, 2022 Newsletter - free
Disclaimer: Intraday Chart Links will show up as daily charts unless you have an active stockcharts.com membership and are signed in, you can sign up here.
1
Table of Contents:
Systems Update Reversion to mean and KISS Trend
1. General Market Analysis: SPX and Other Major Indices
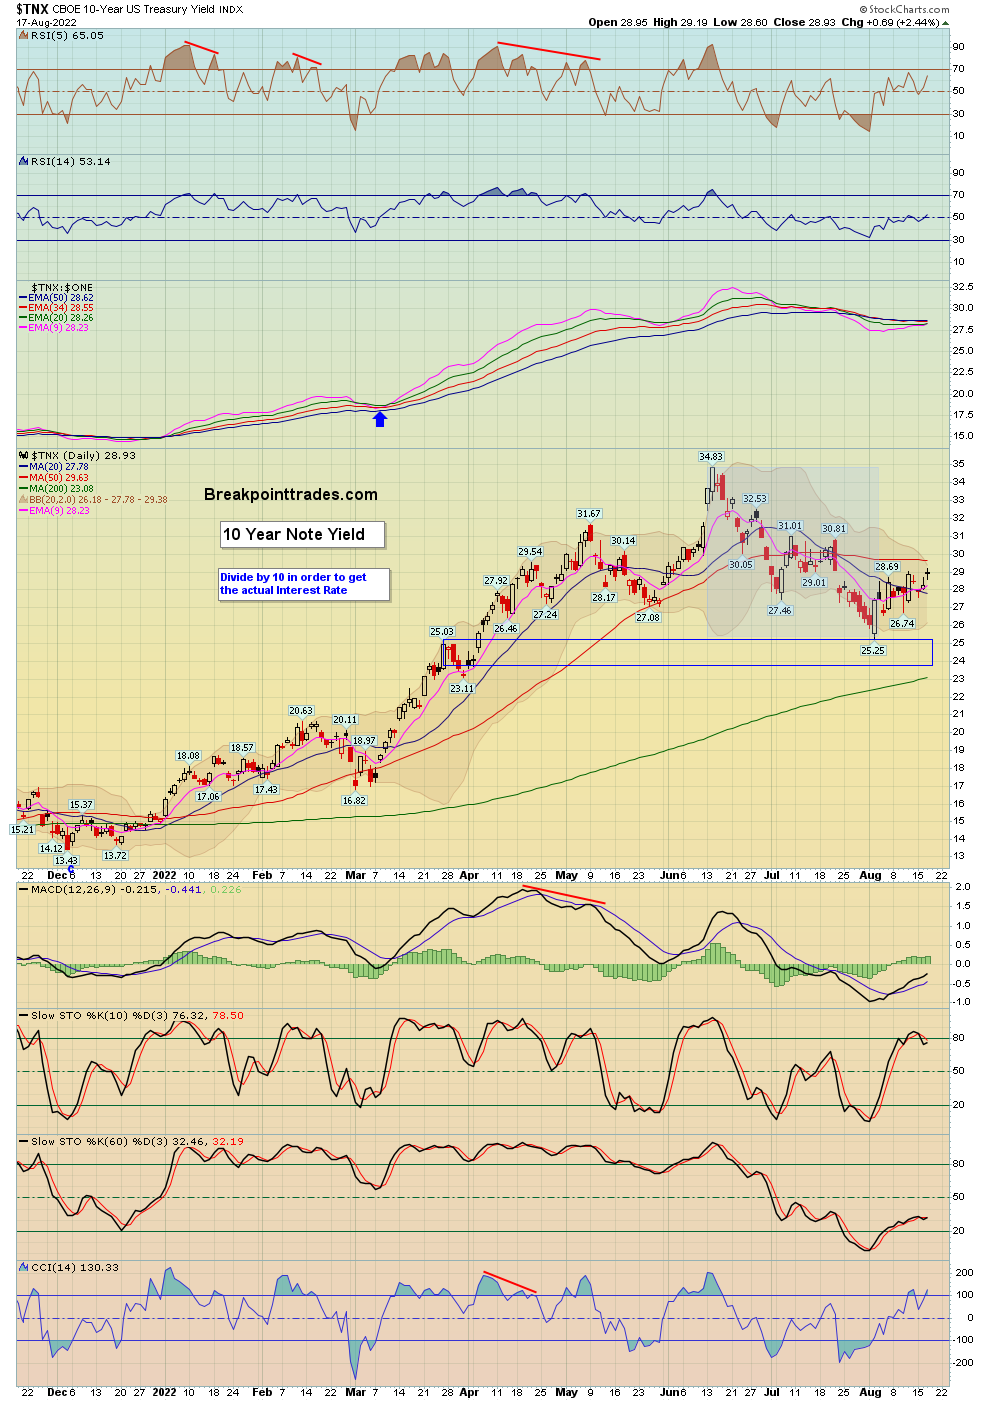
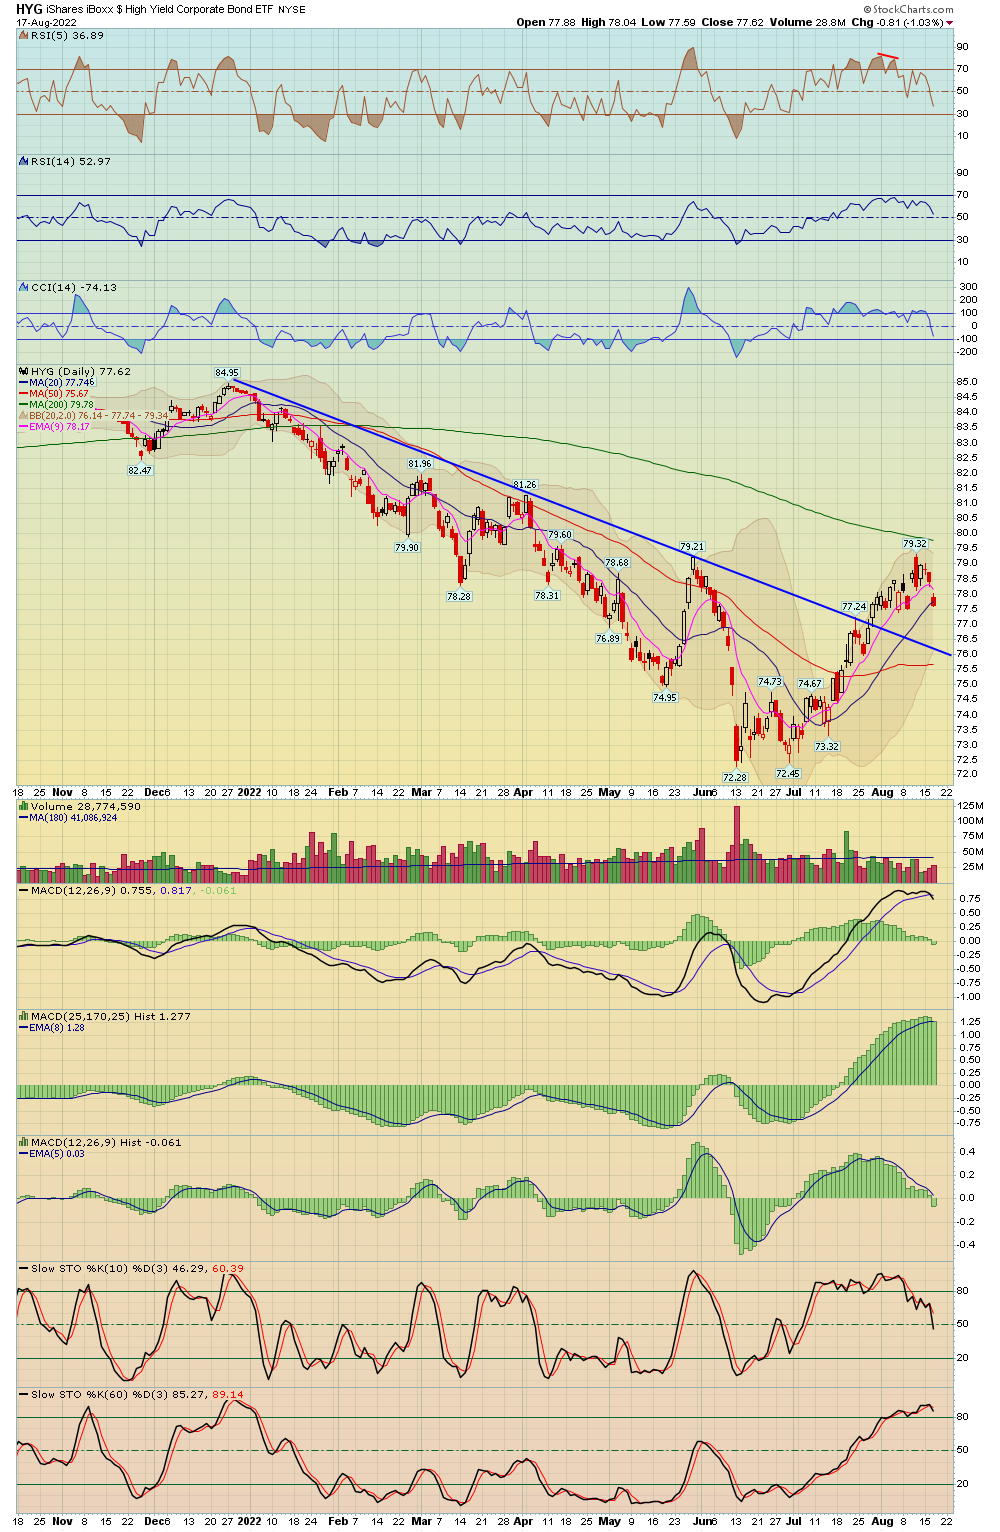
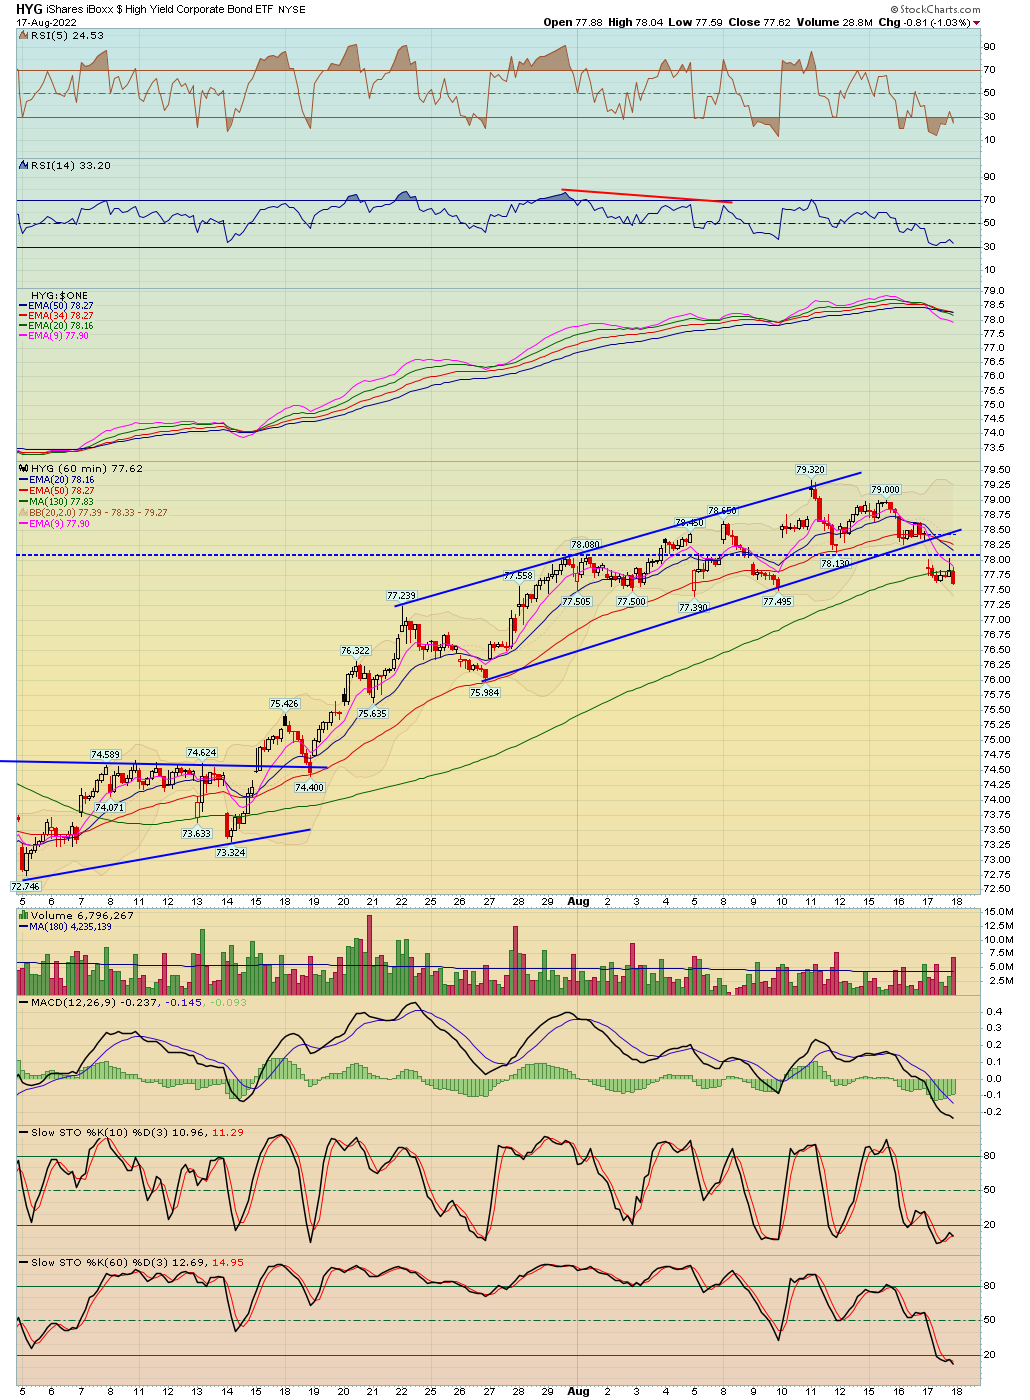
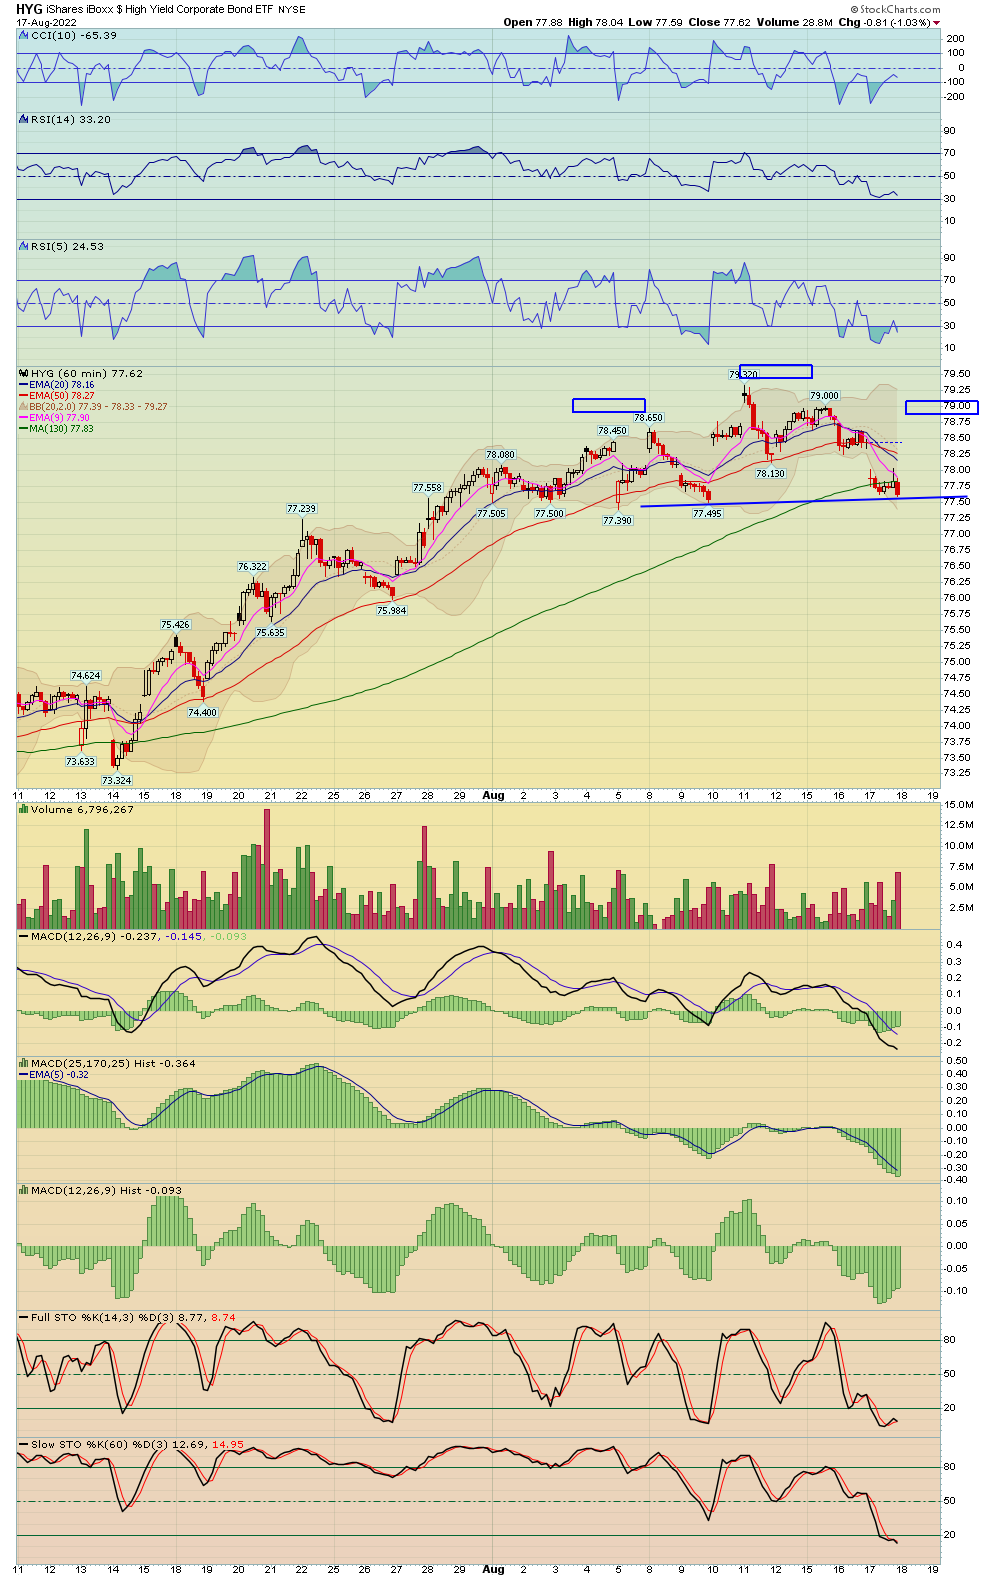
2. Indicators and Bonds (TLT/JNK)
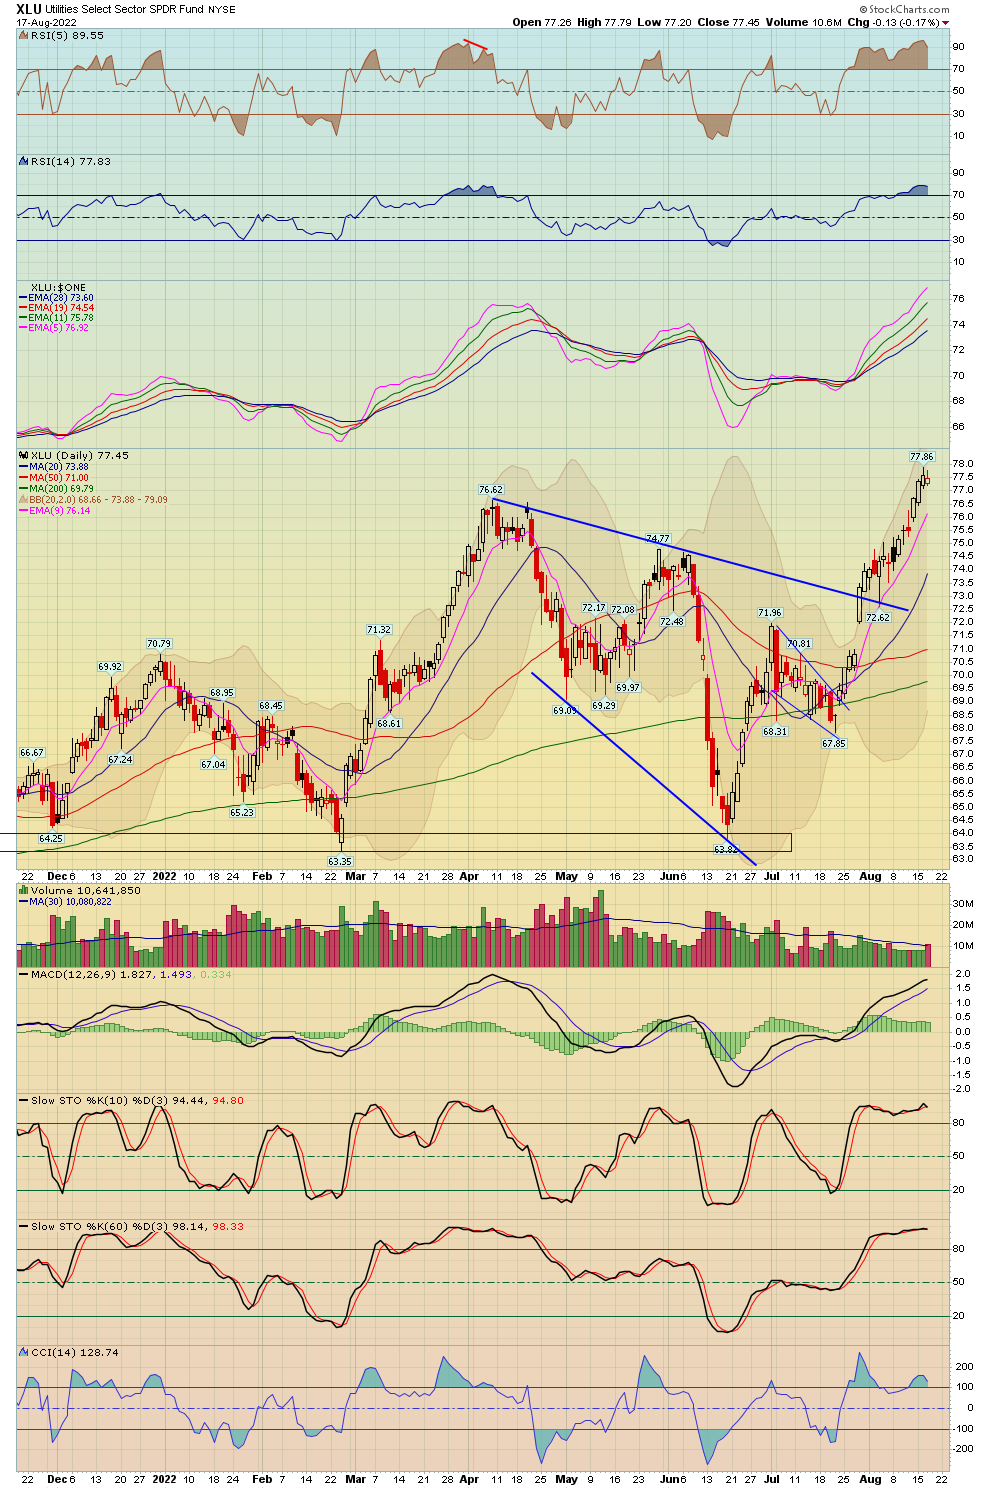
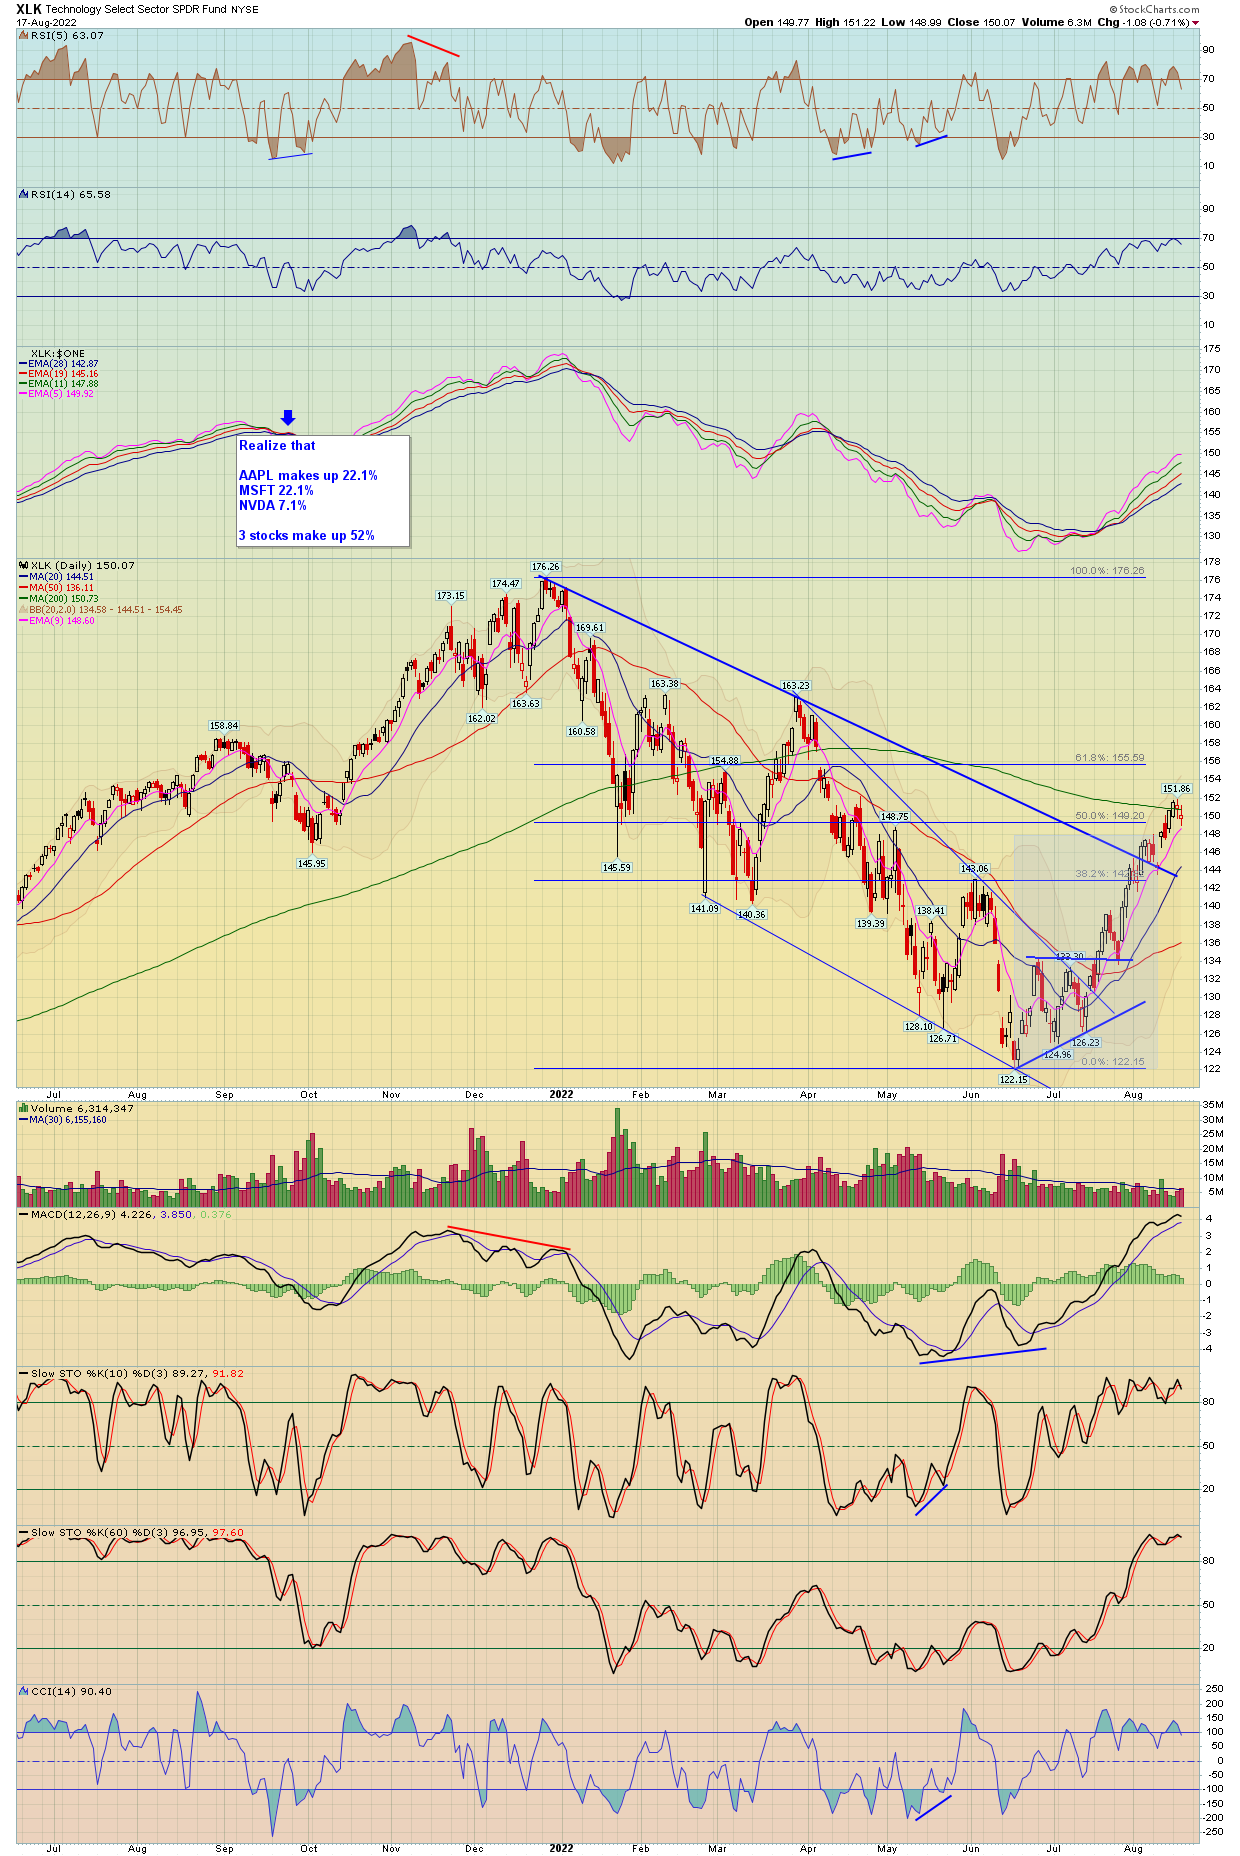
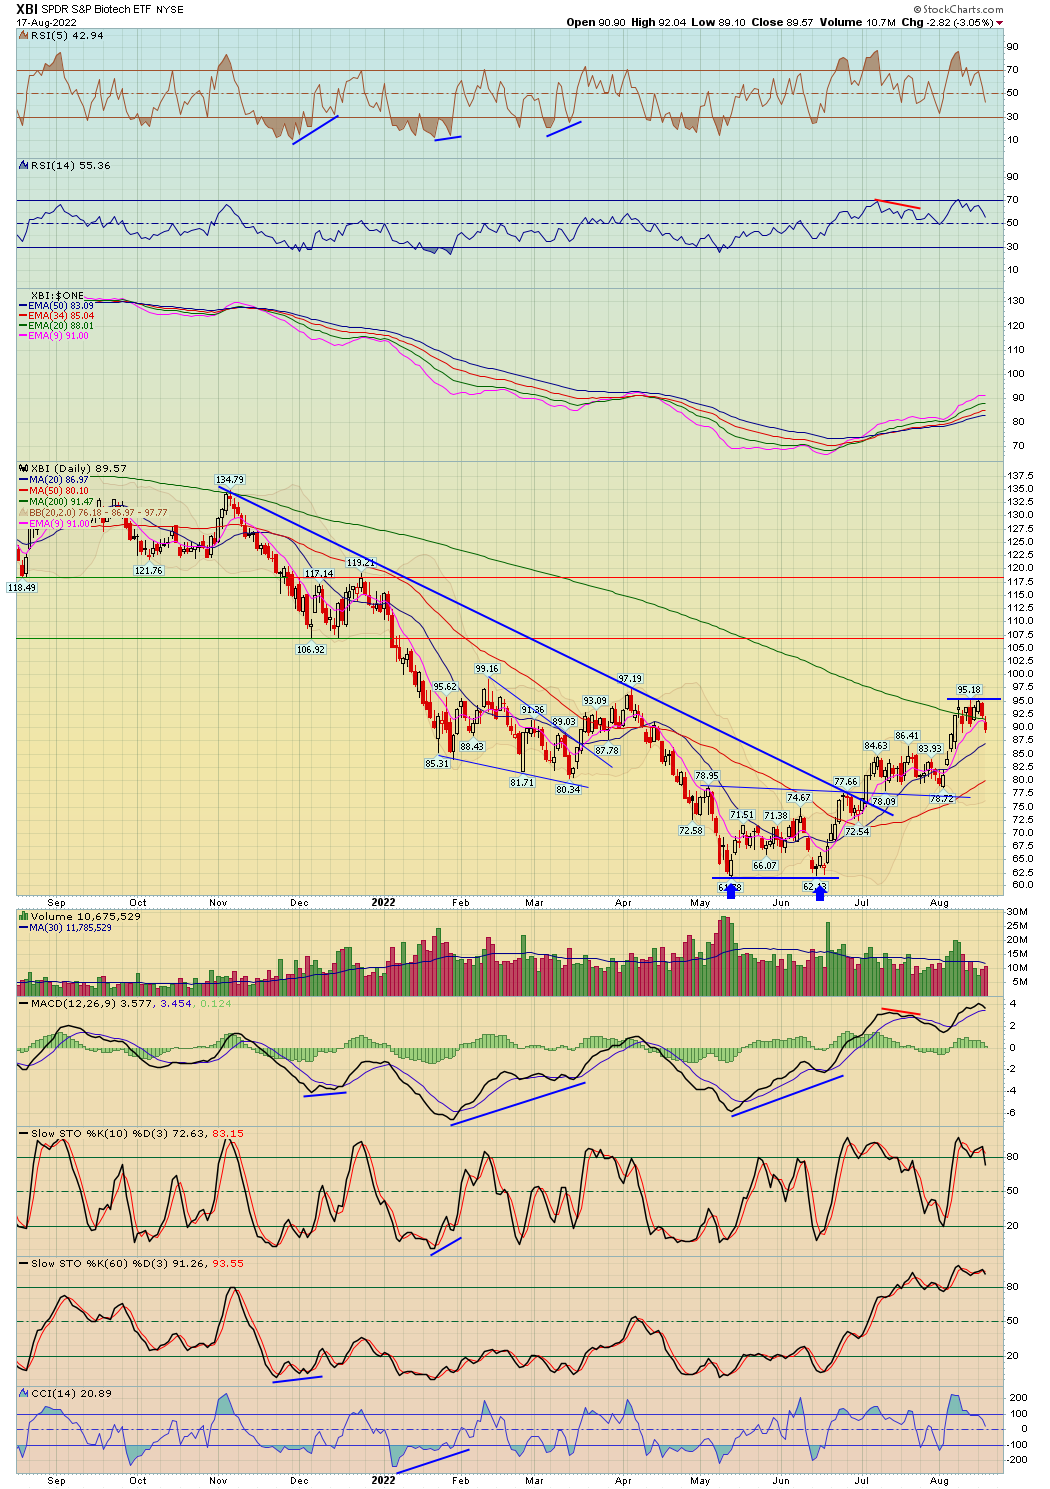
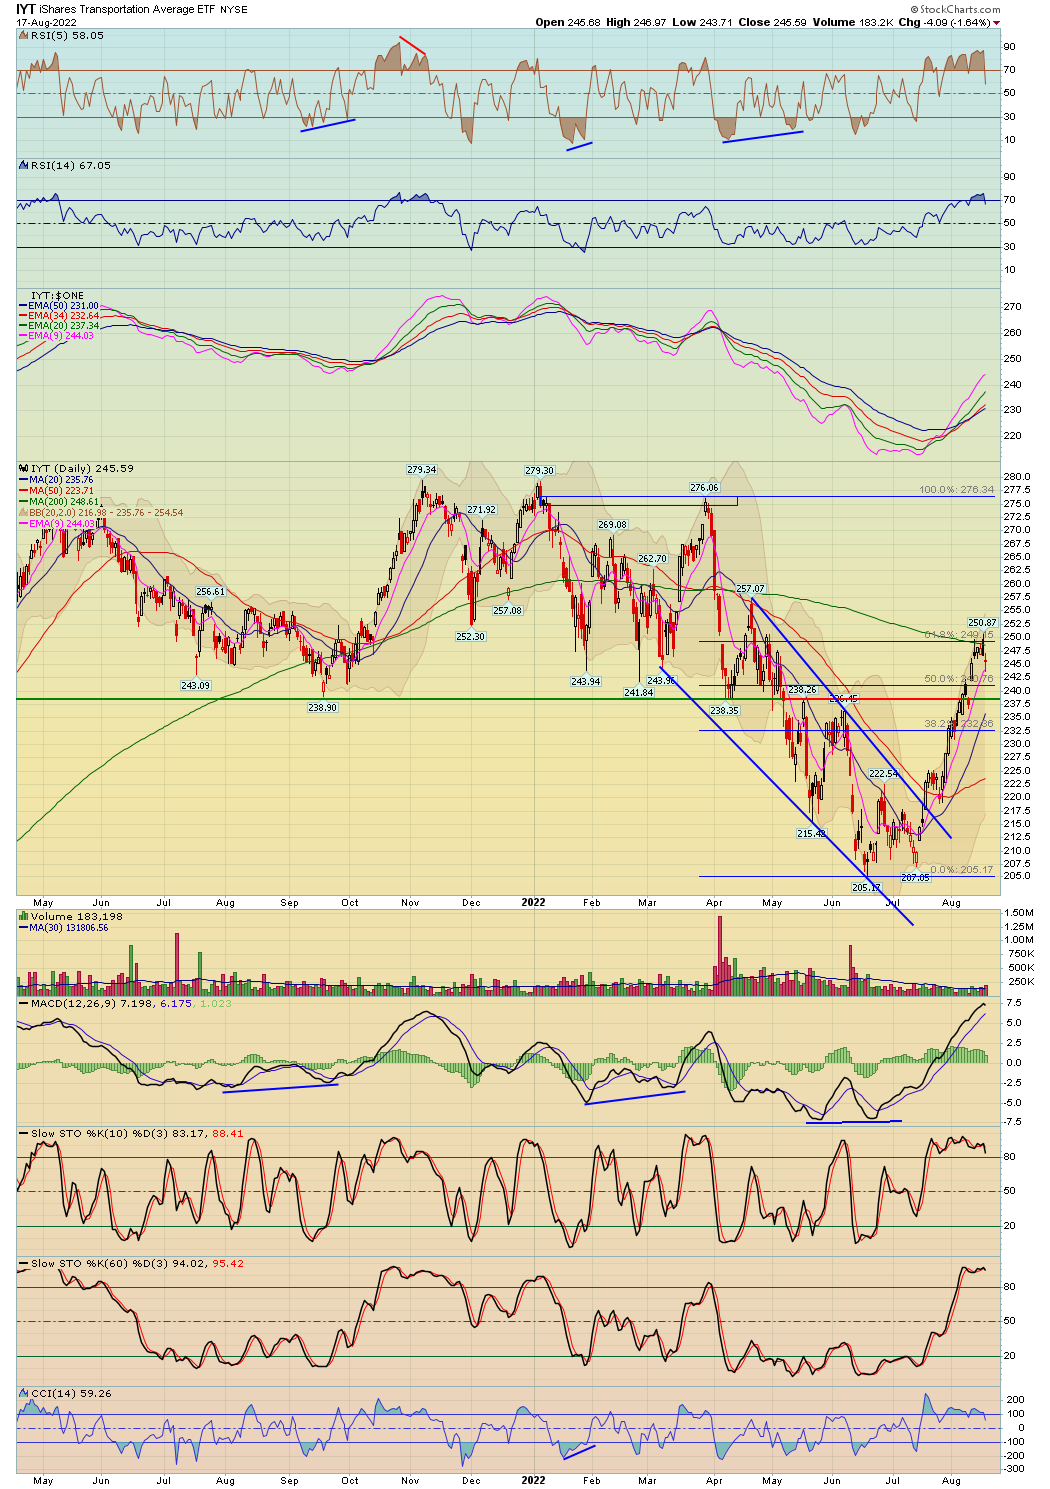
3. Major Sectors
4. US Dollar, Commodities, Precious Metals and GDX
5. Trade Ideas
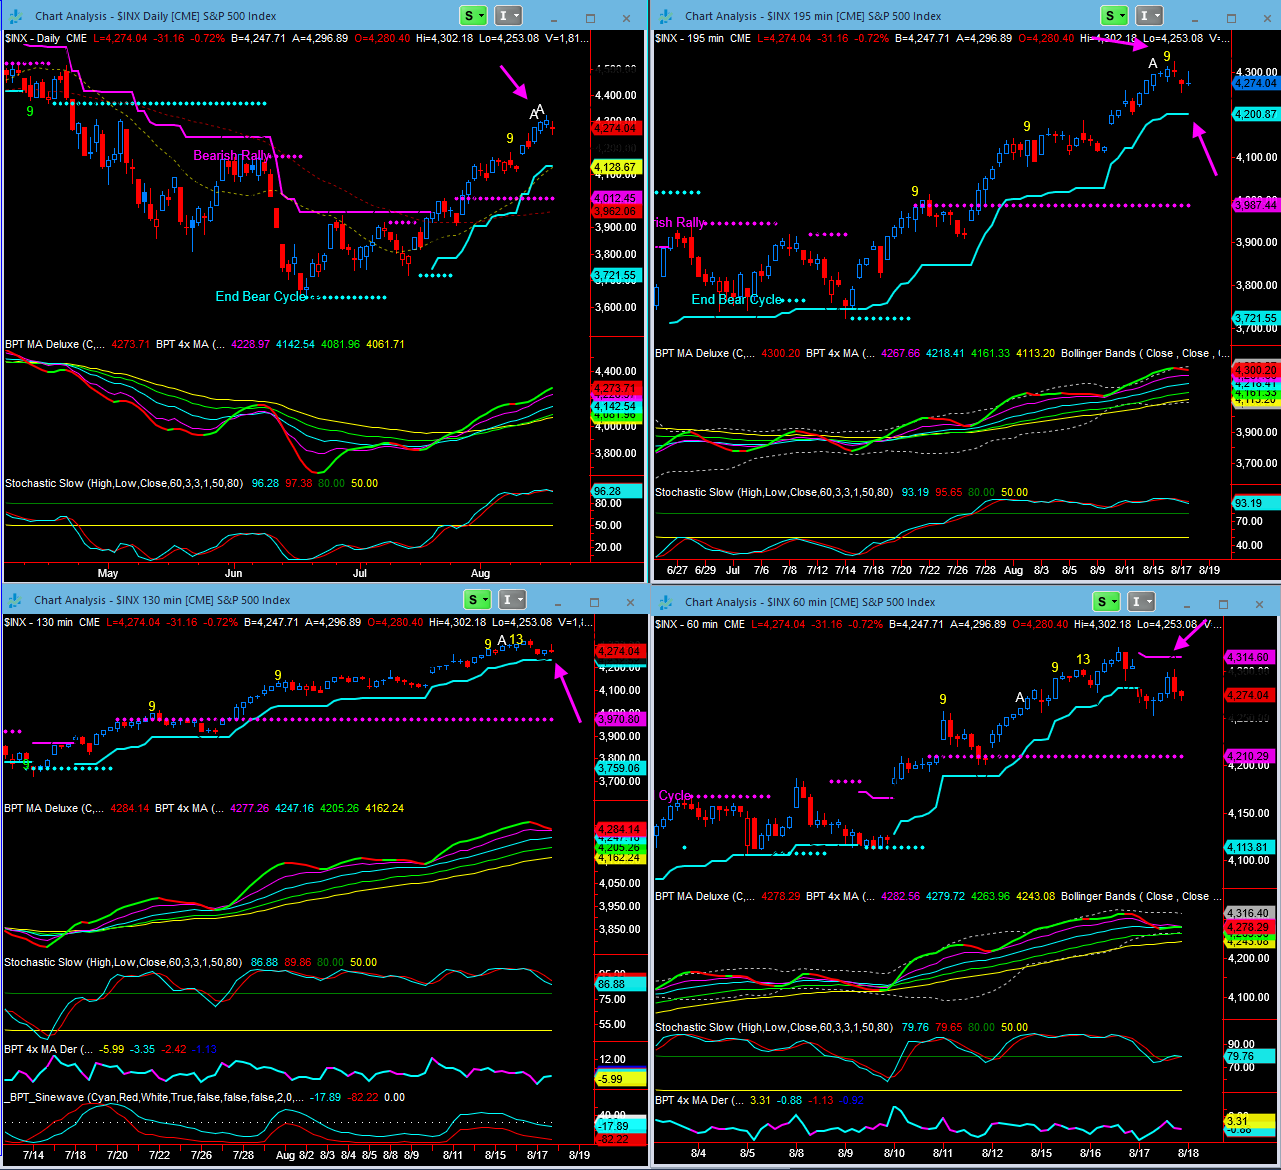
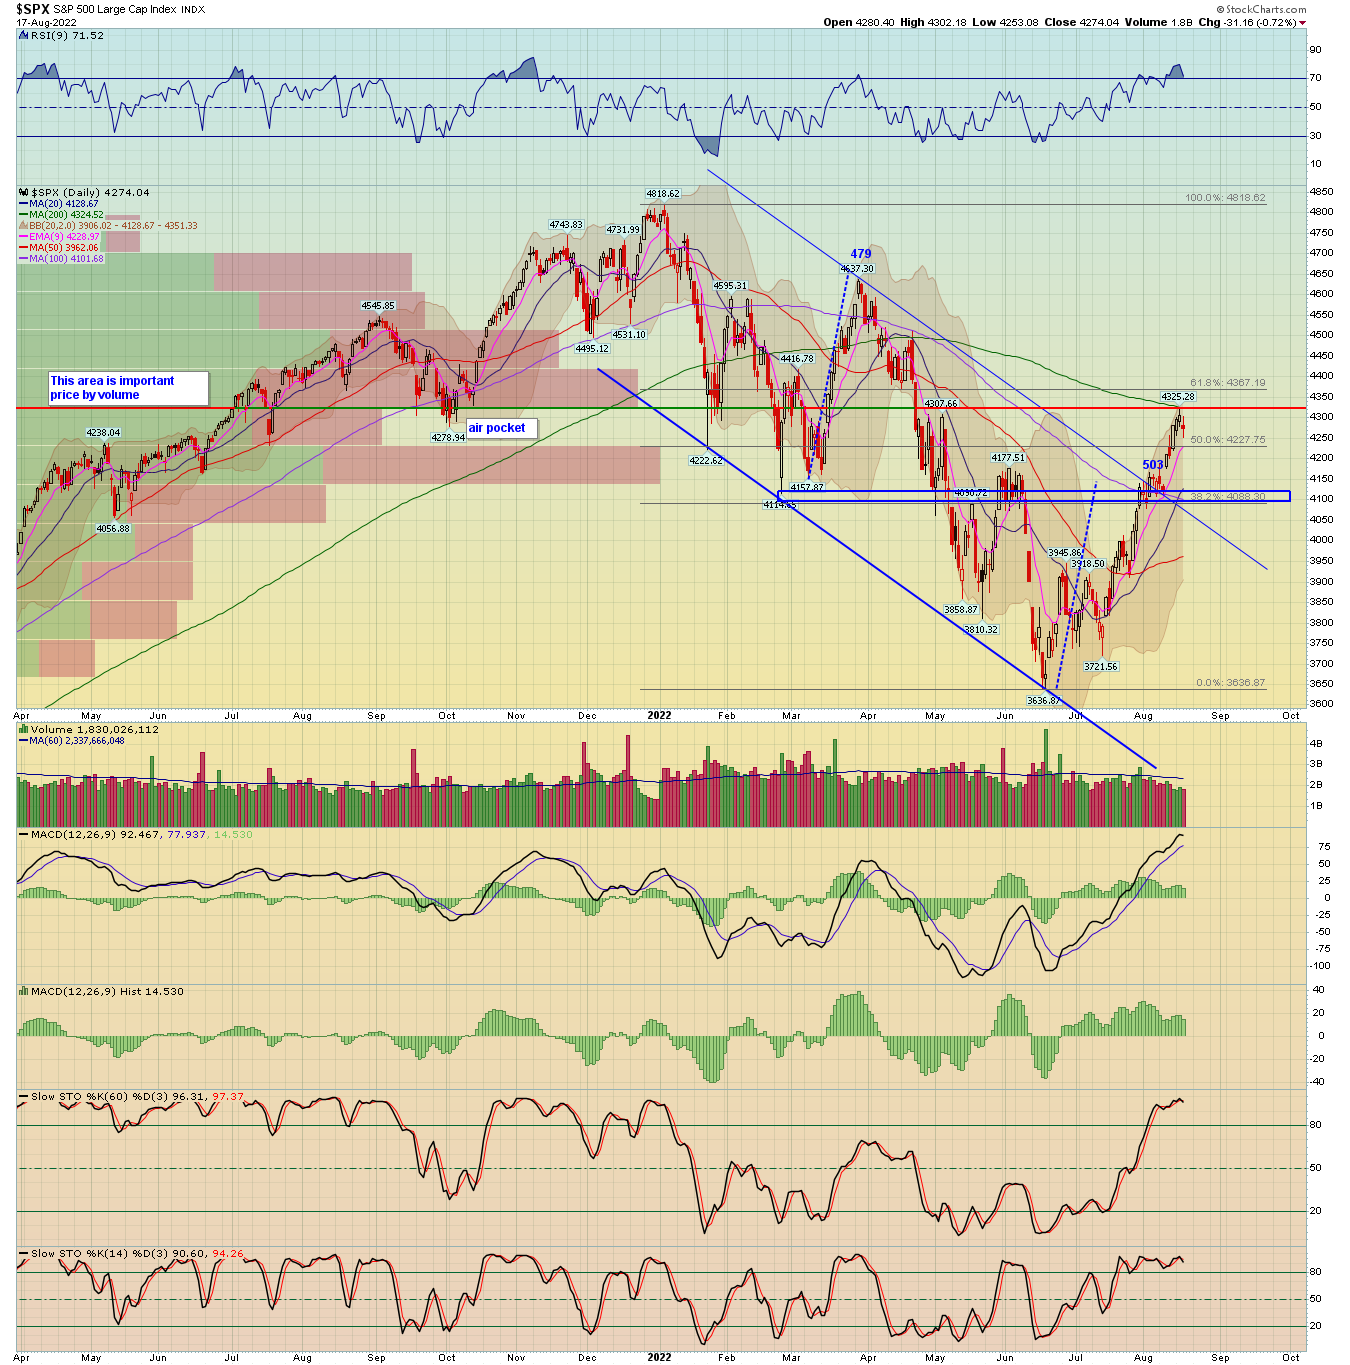
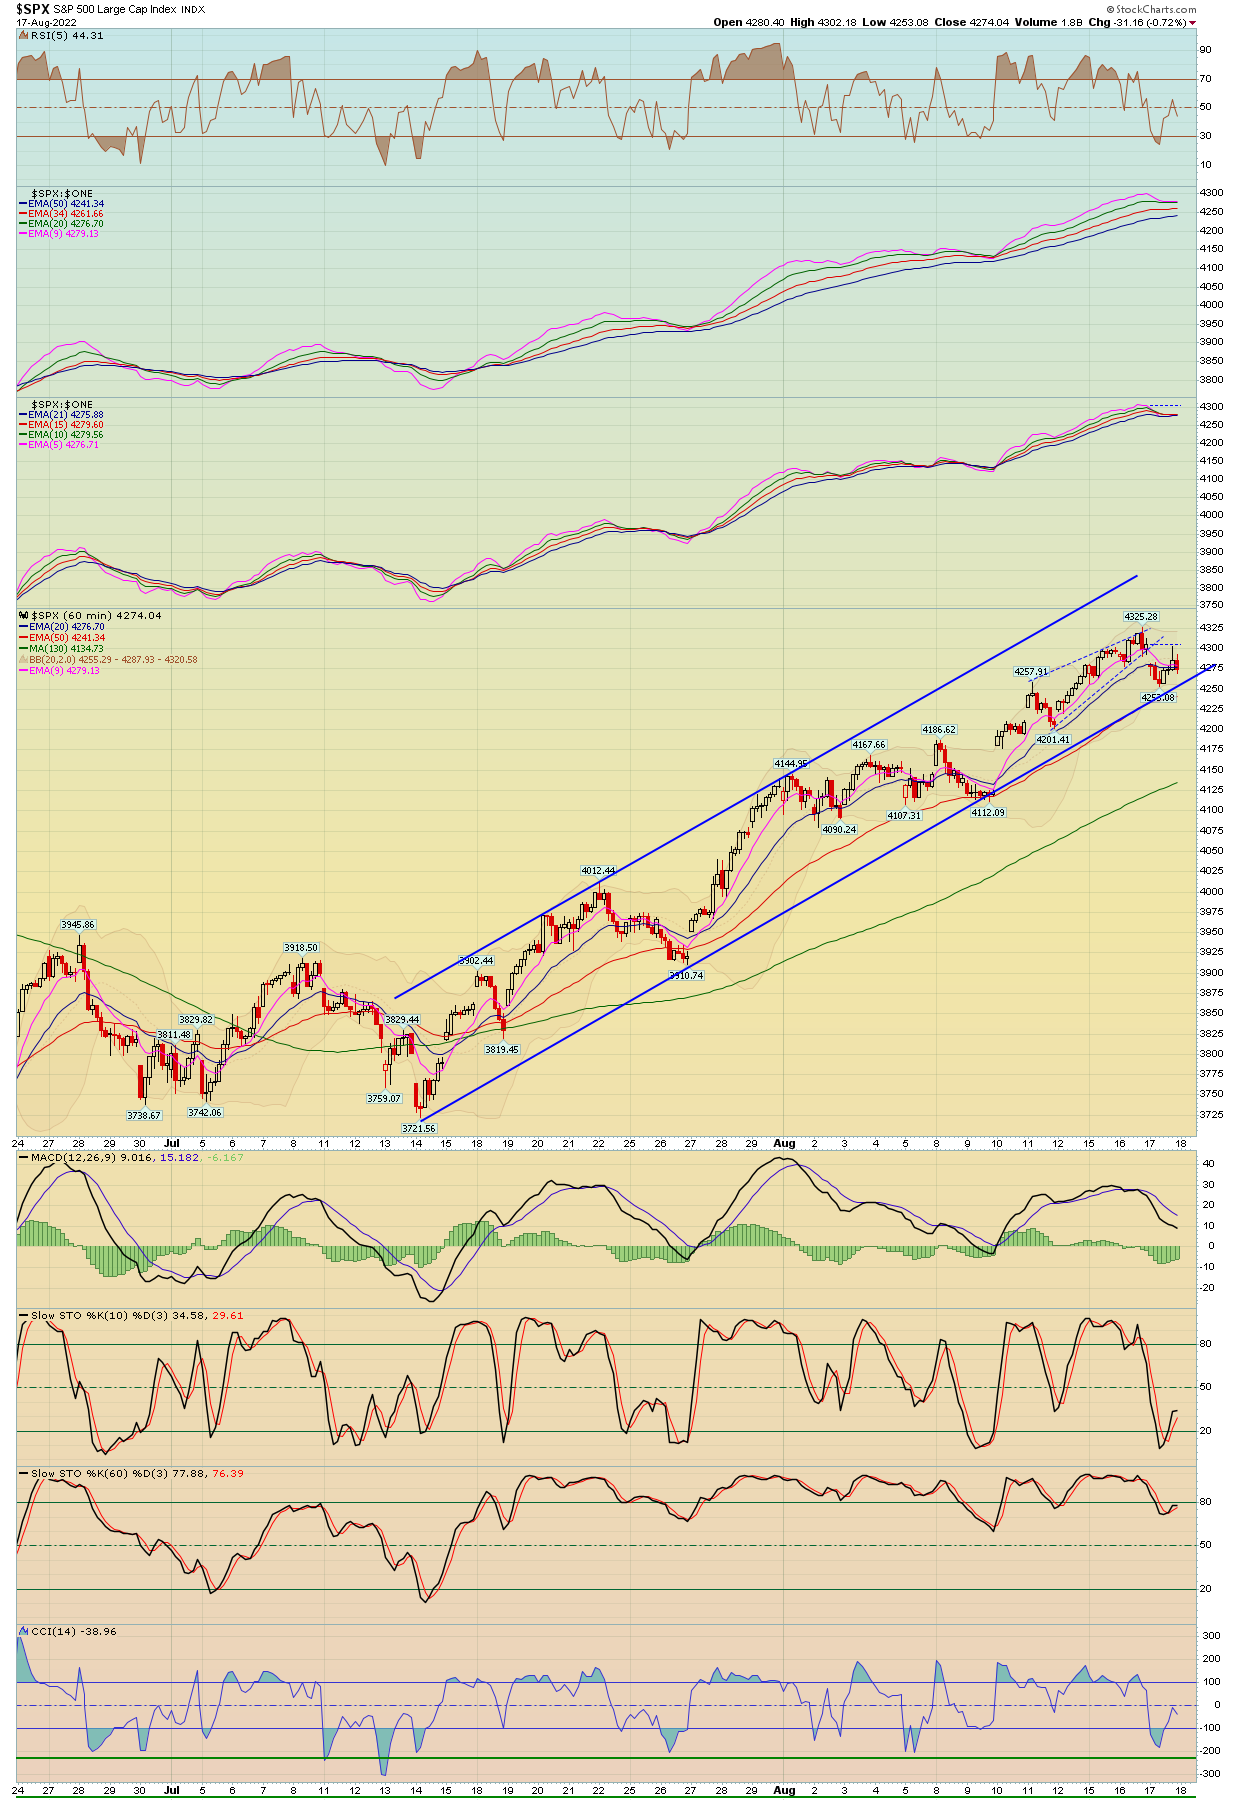
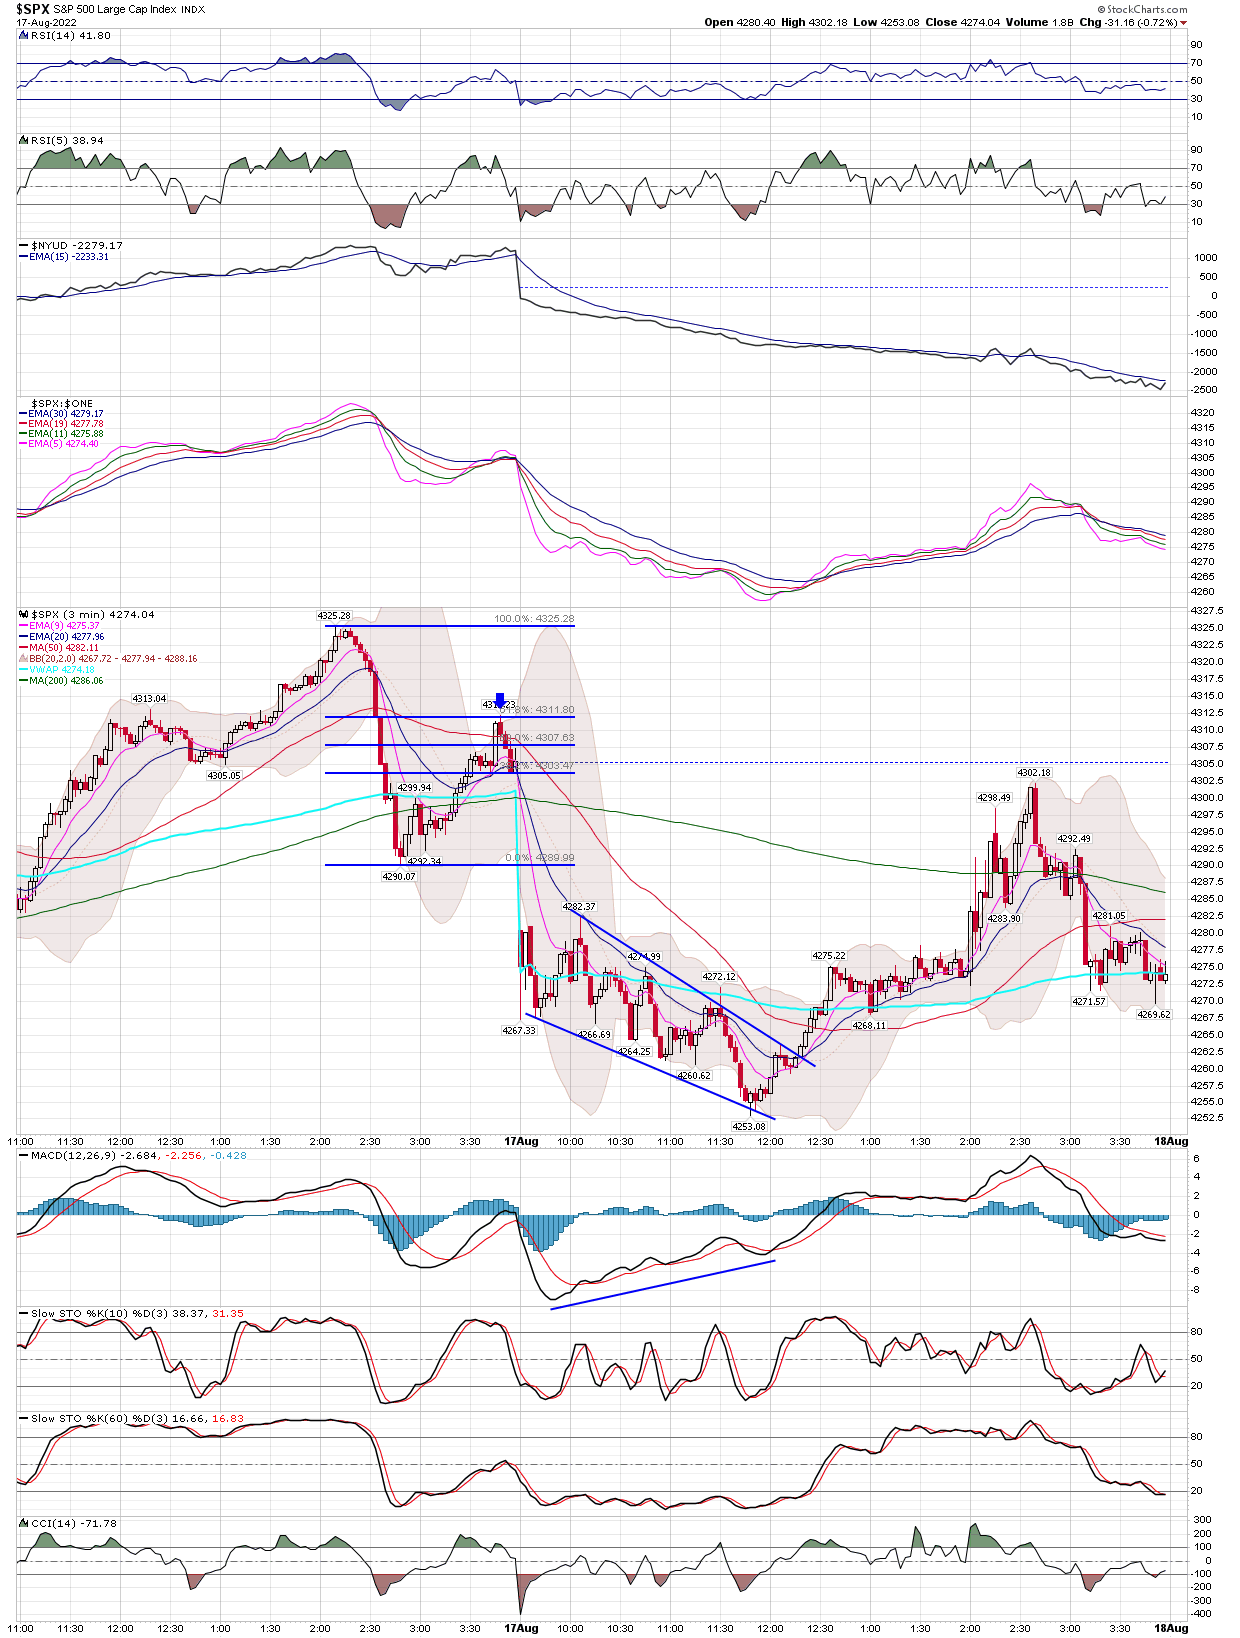
On Tuesday morning the market sold but then quickly recovered and rallied up to a new high, perfectly tagging the 200 day MA on the SPX, and the weekly ATR average true range) and then reversed off these major resistance areas yesterday afternoon. It was to be expected for the market to get rejected at the 200 day MA on the first re-test. This morning the market gapped down strongly on the open and proceeded to sell off for the last couple hrs, however it then found support and put in a decent recovery bounce in the afternoon but sold off the last hr with the SPX closing down 31 points.
Remember guys: topping is a process, where's bottoming tends to be a one event thing.
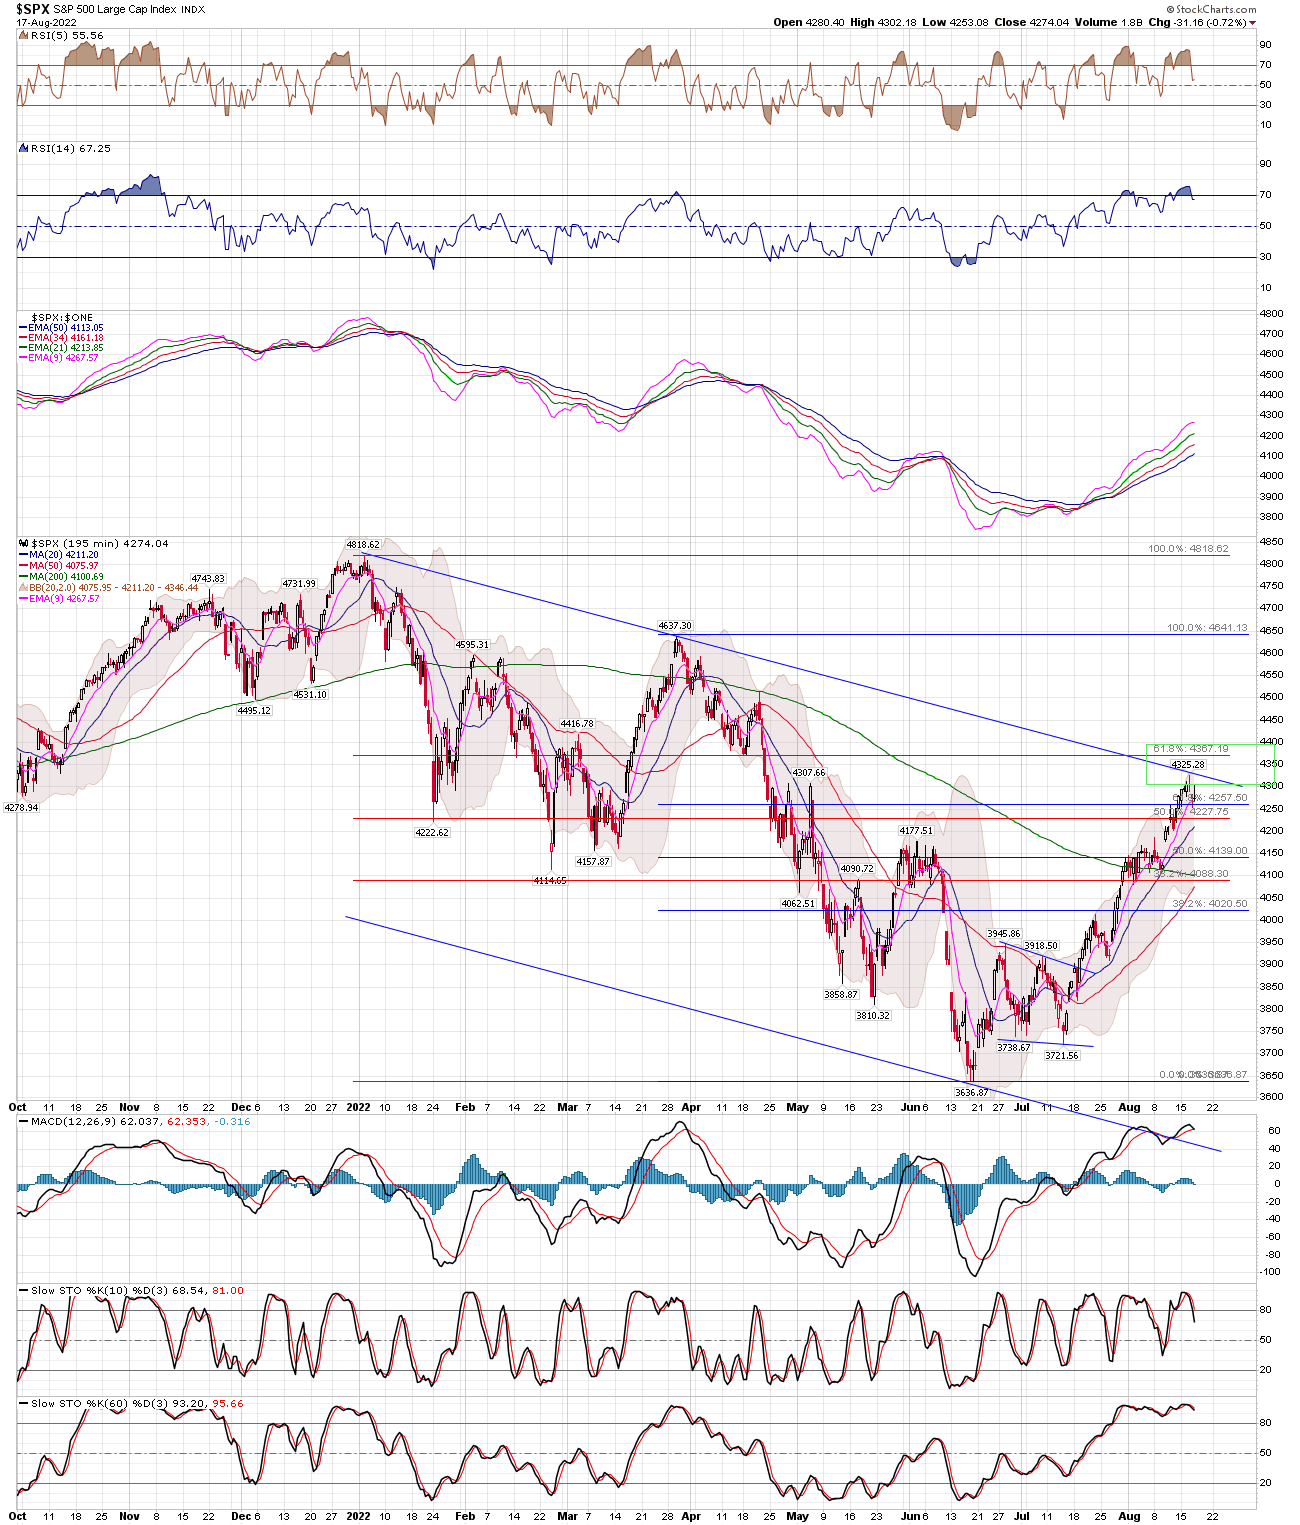
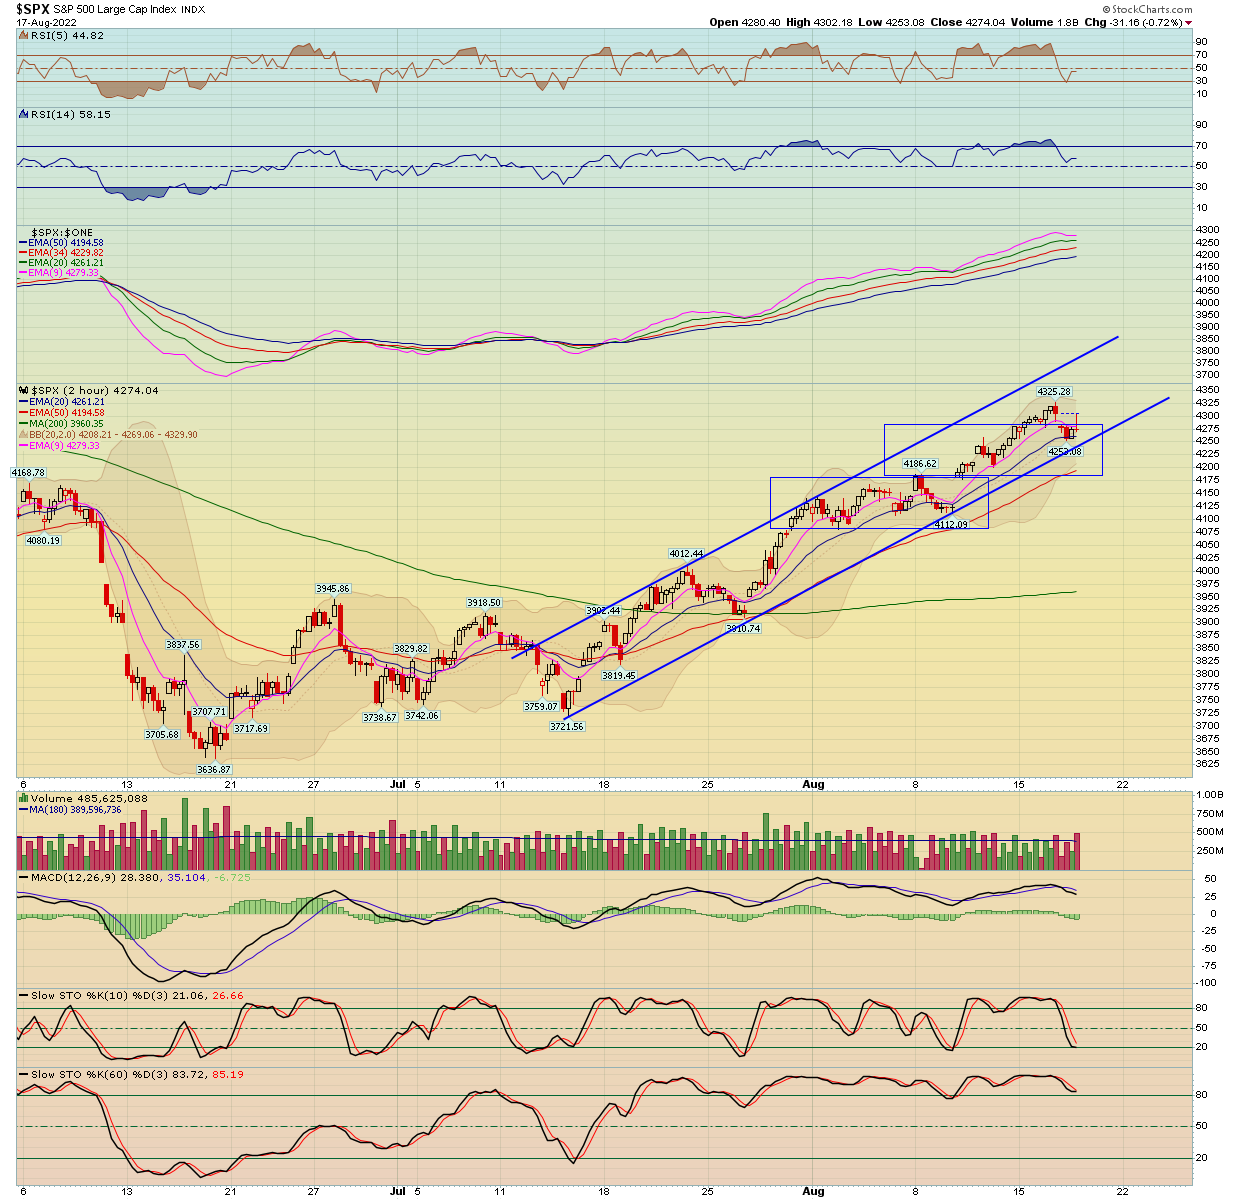
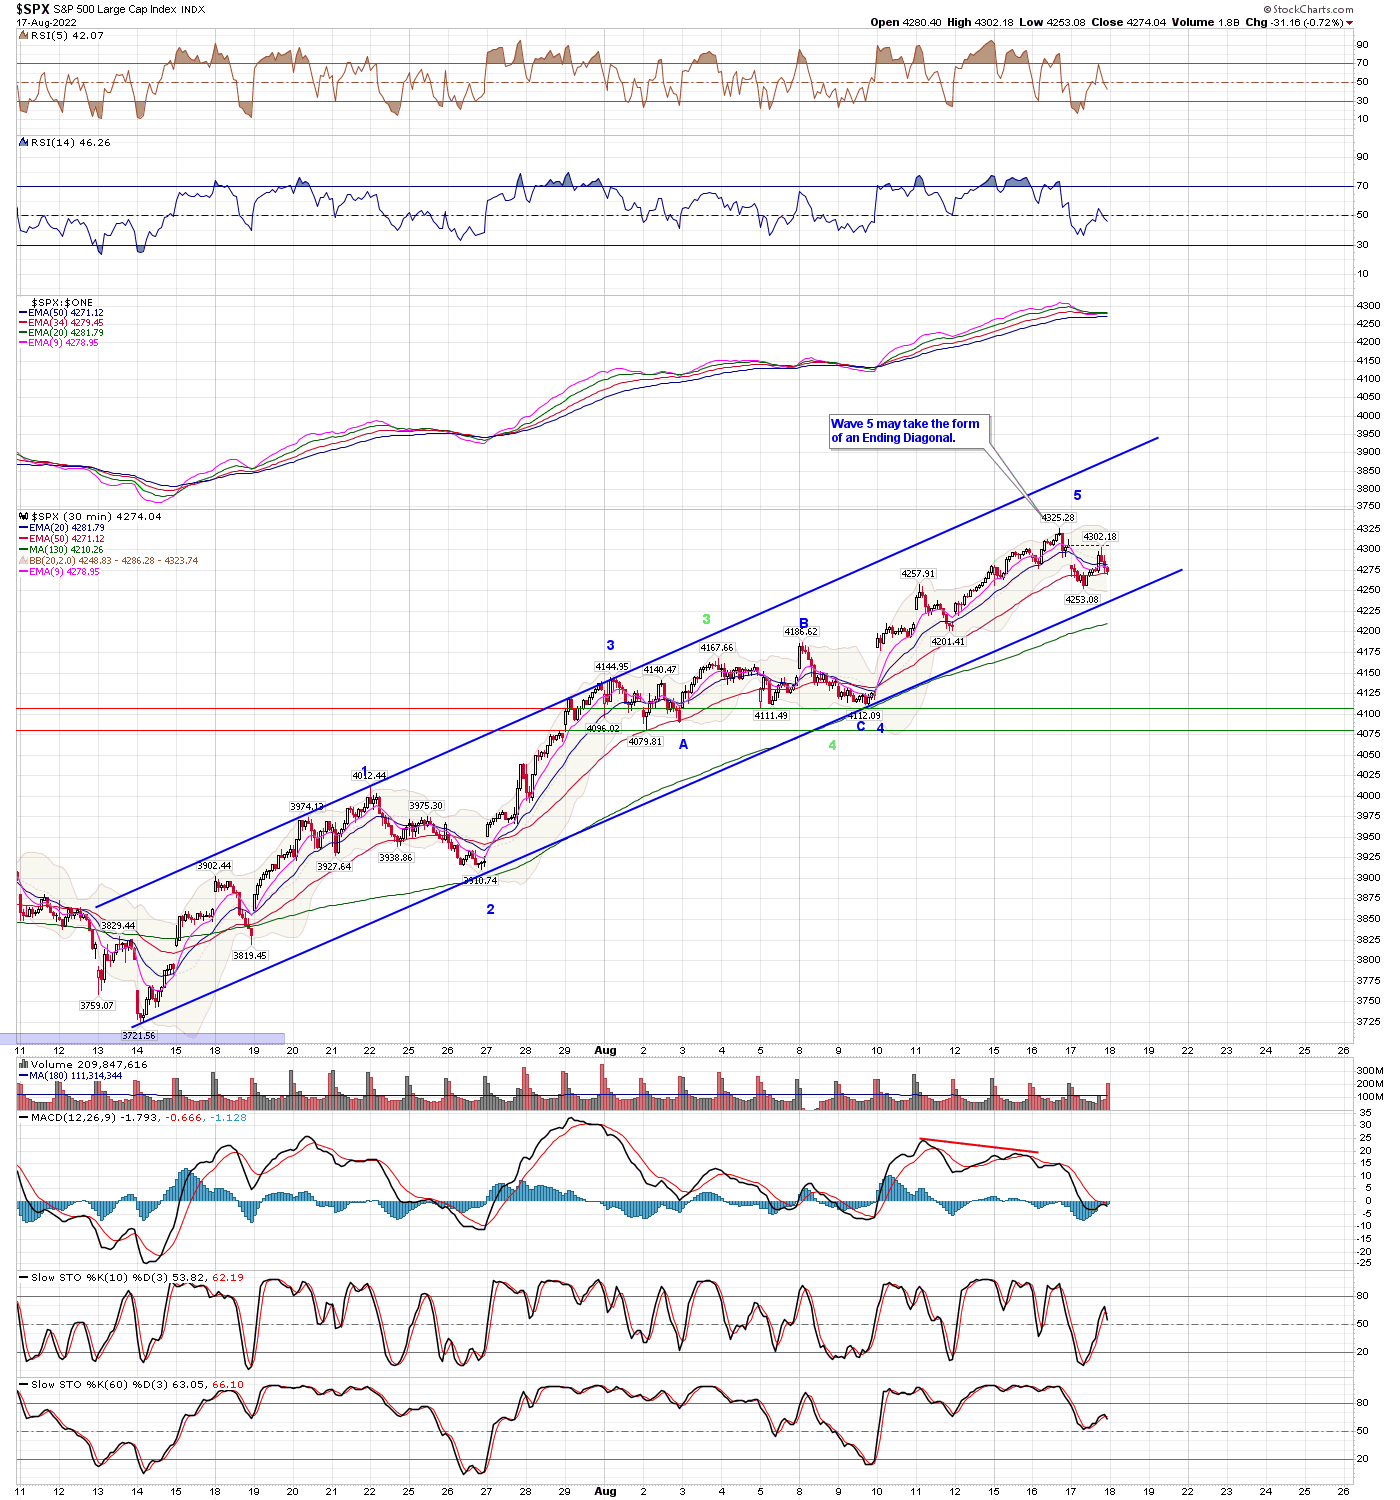
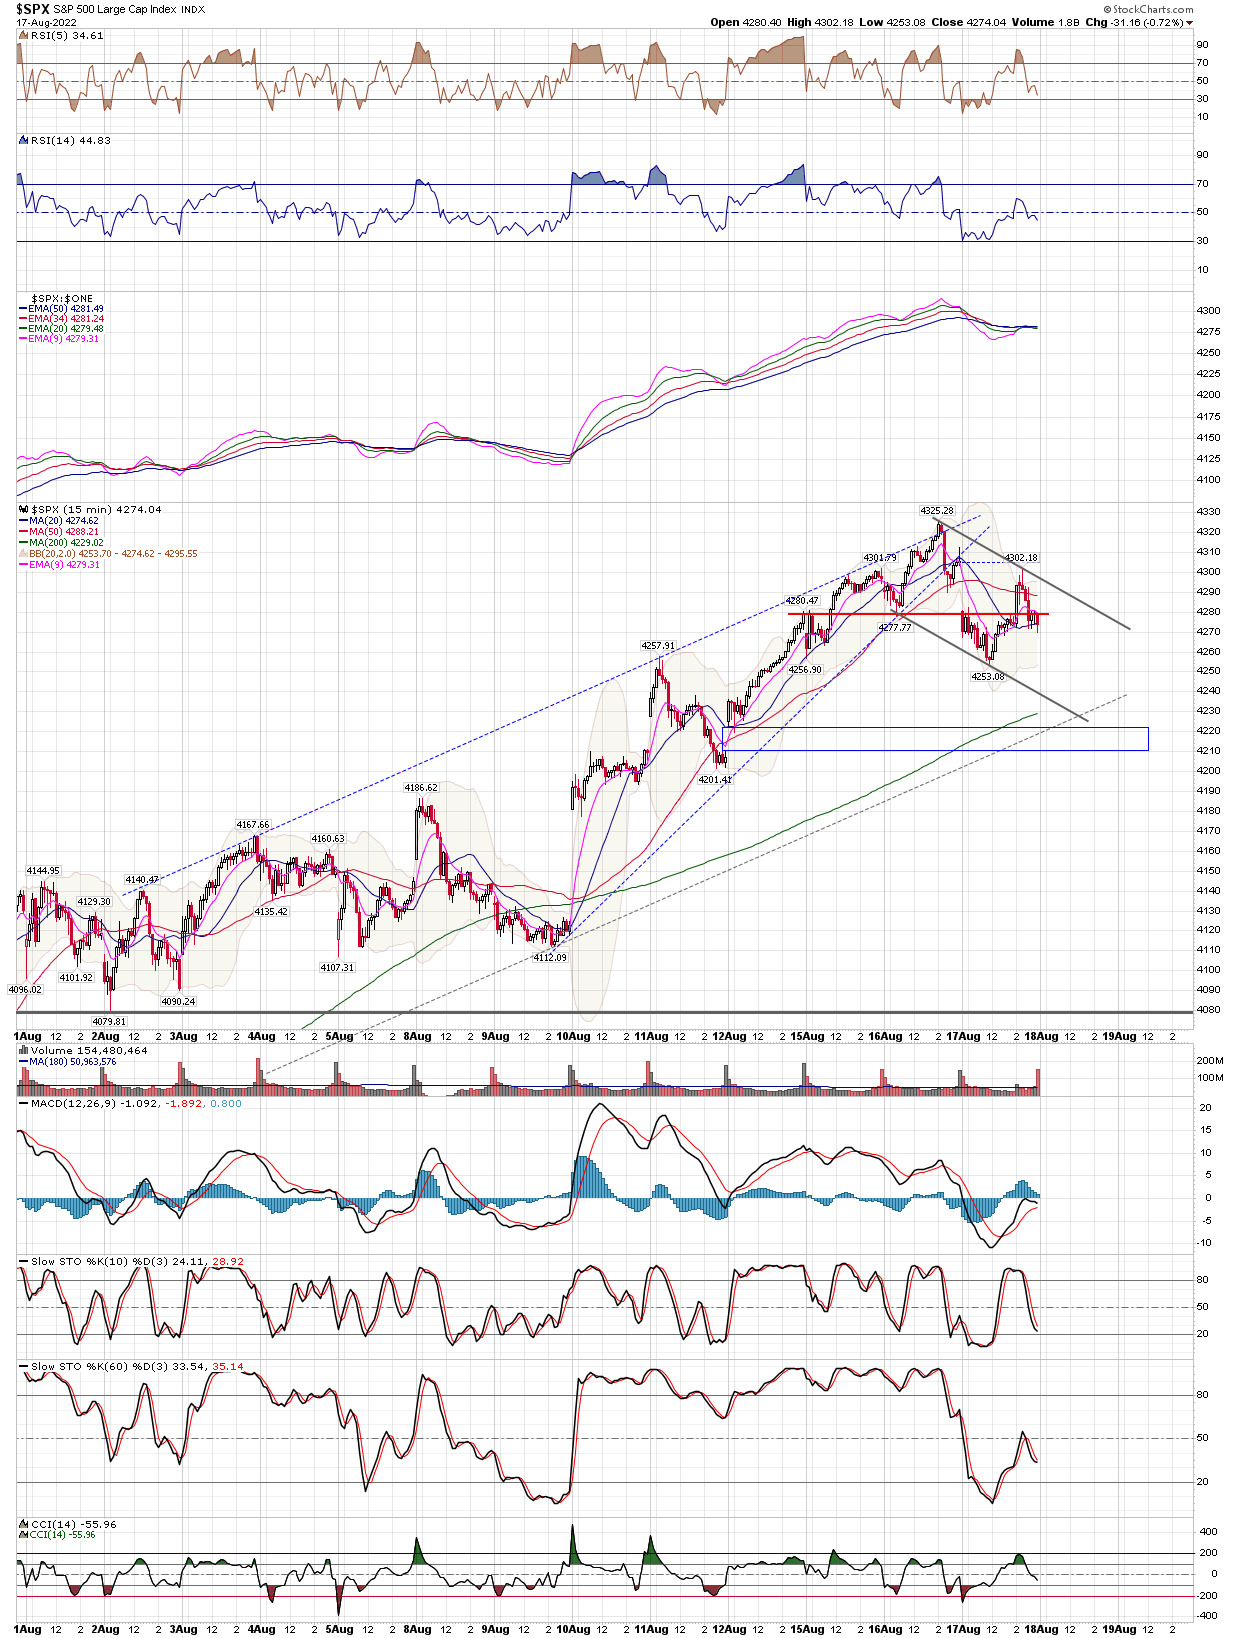
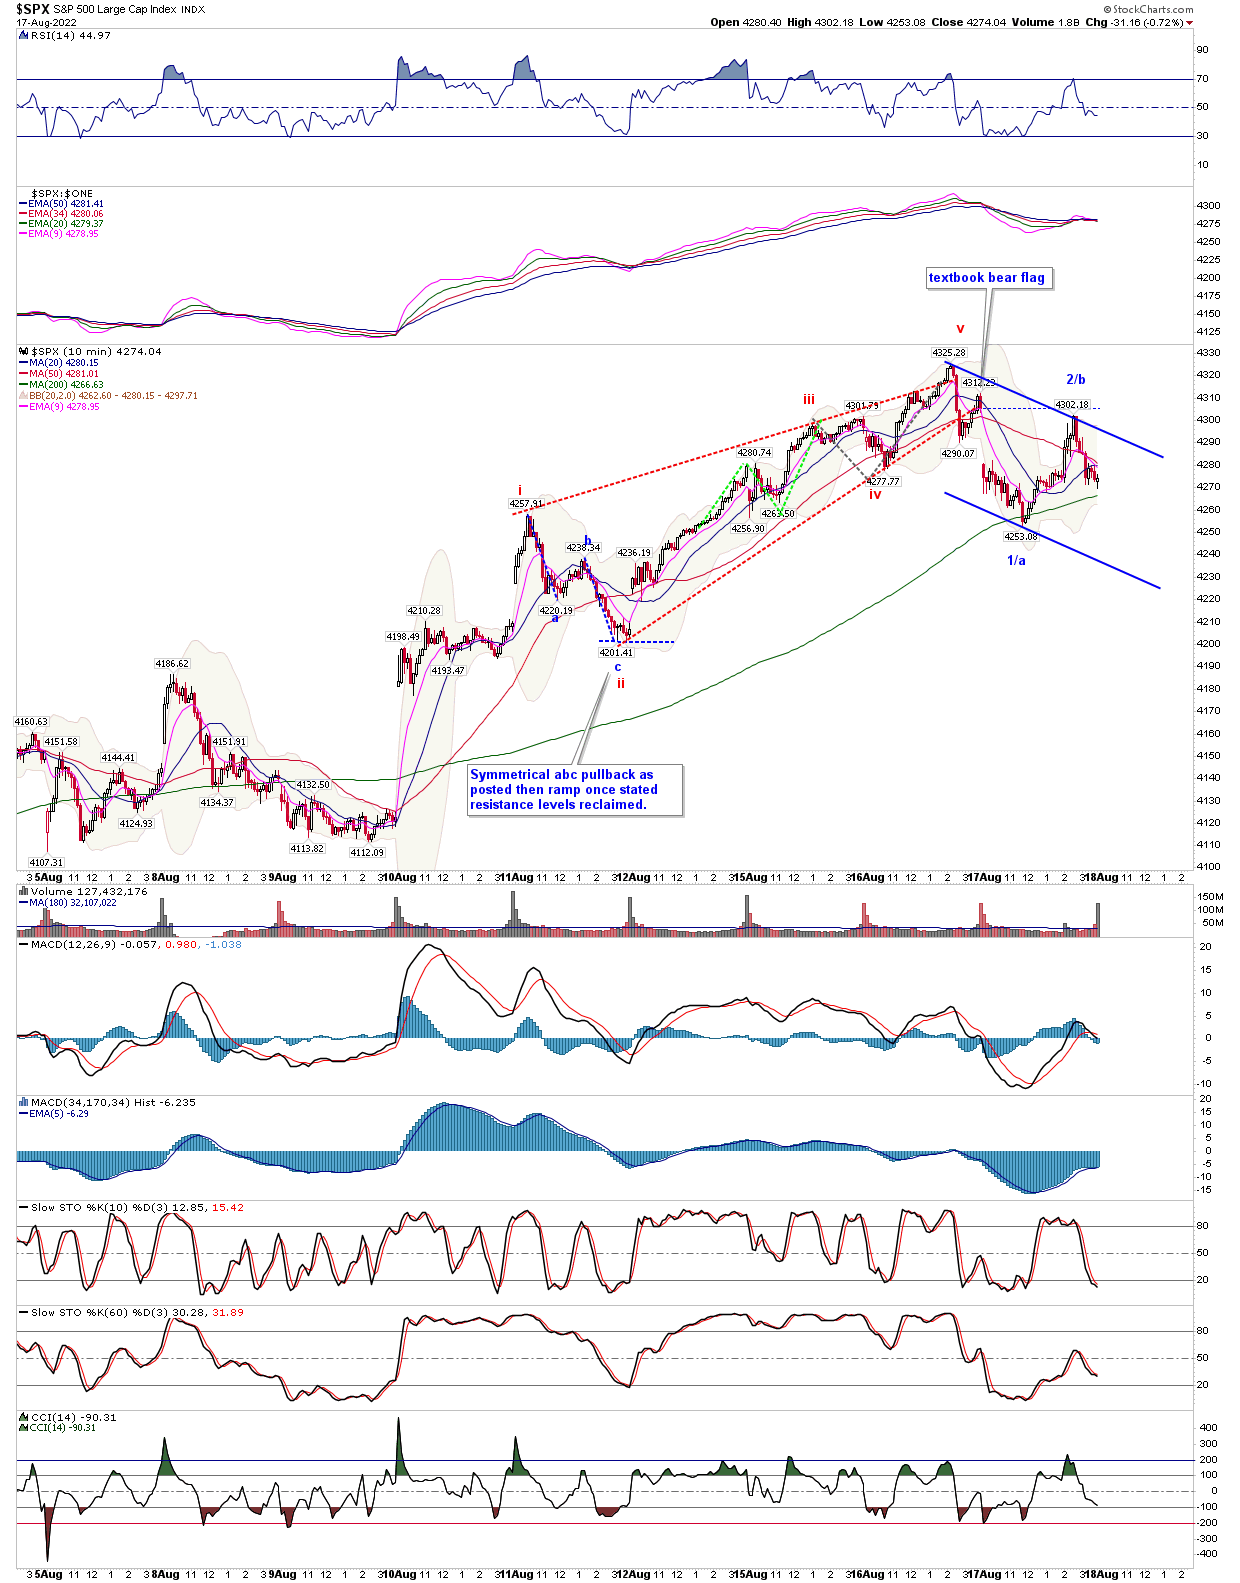
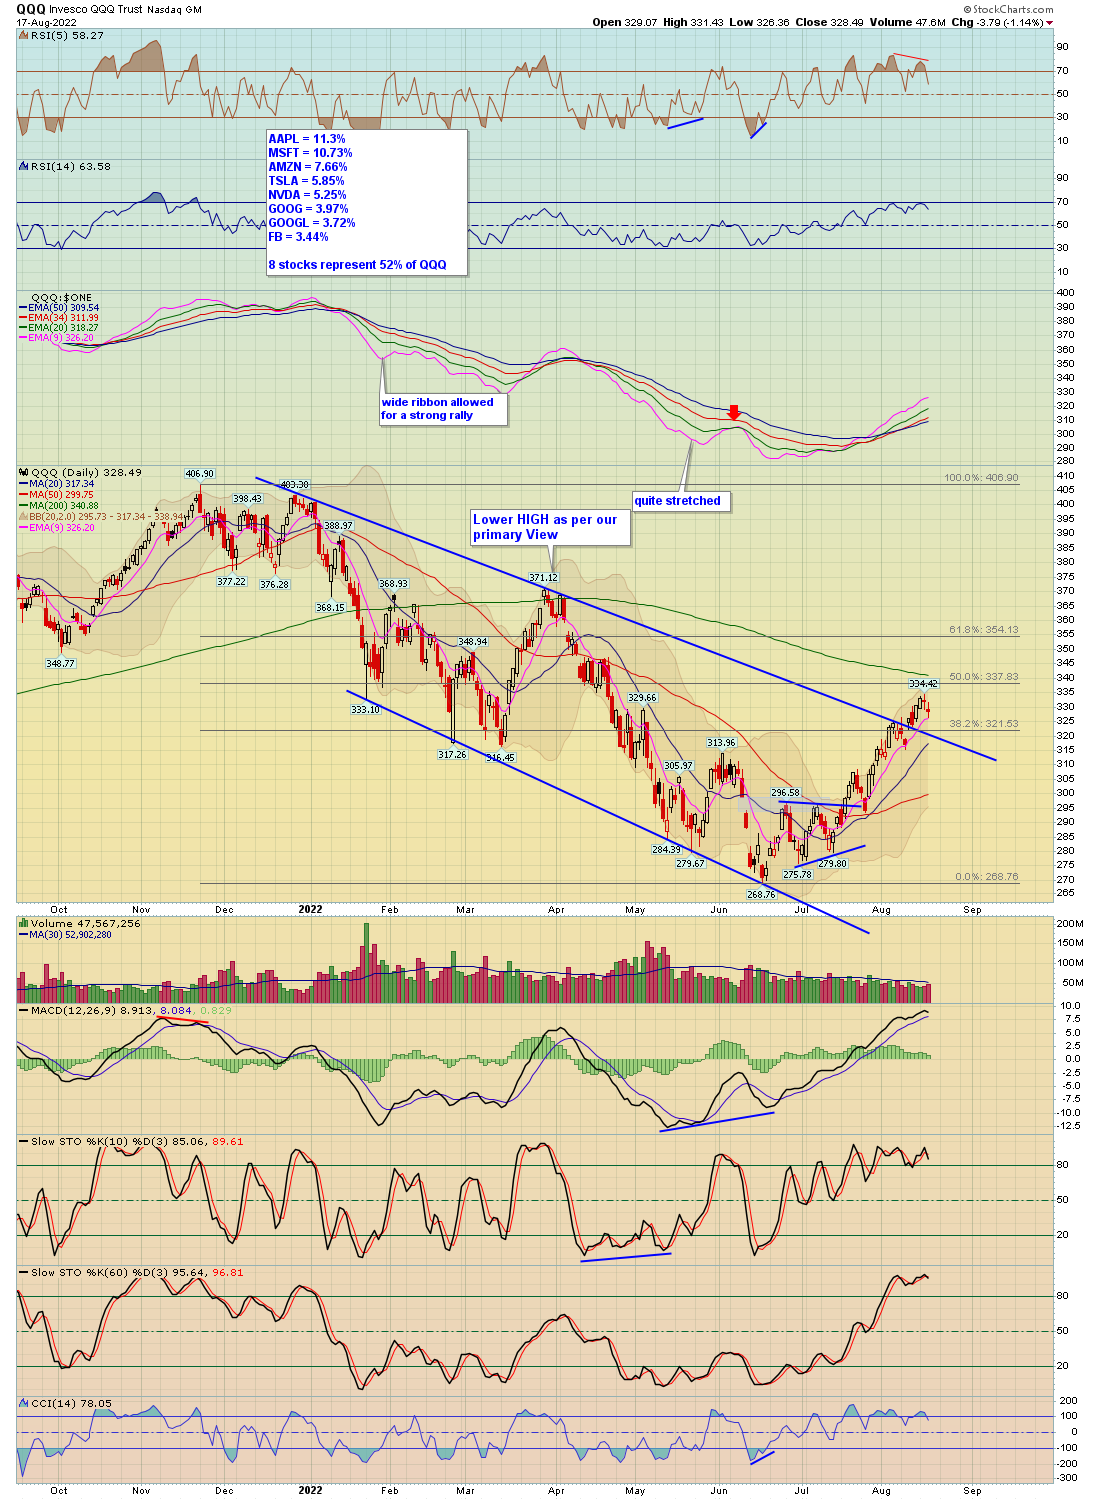
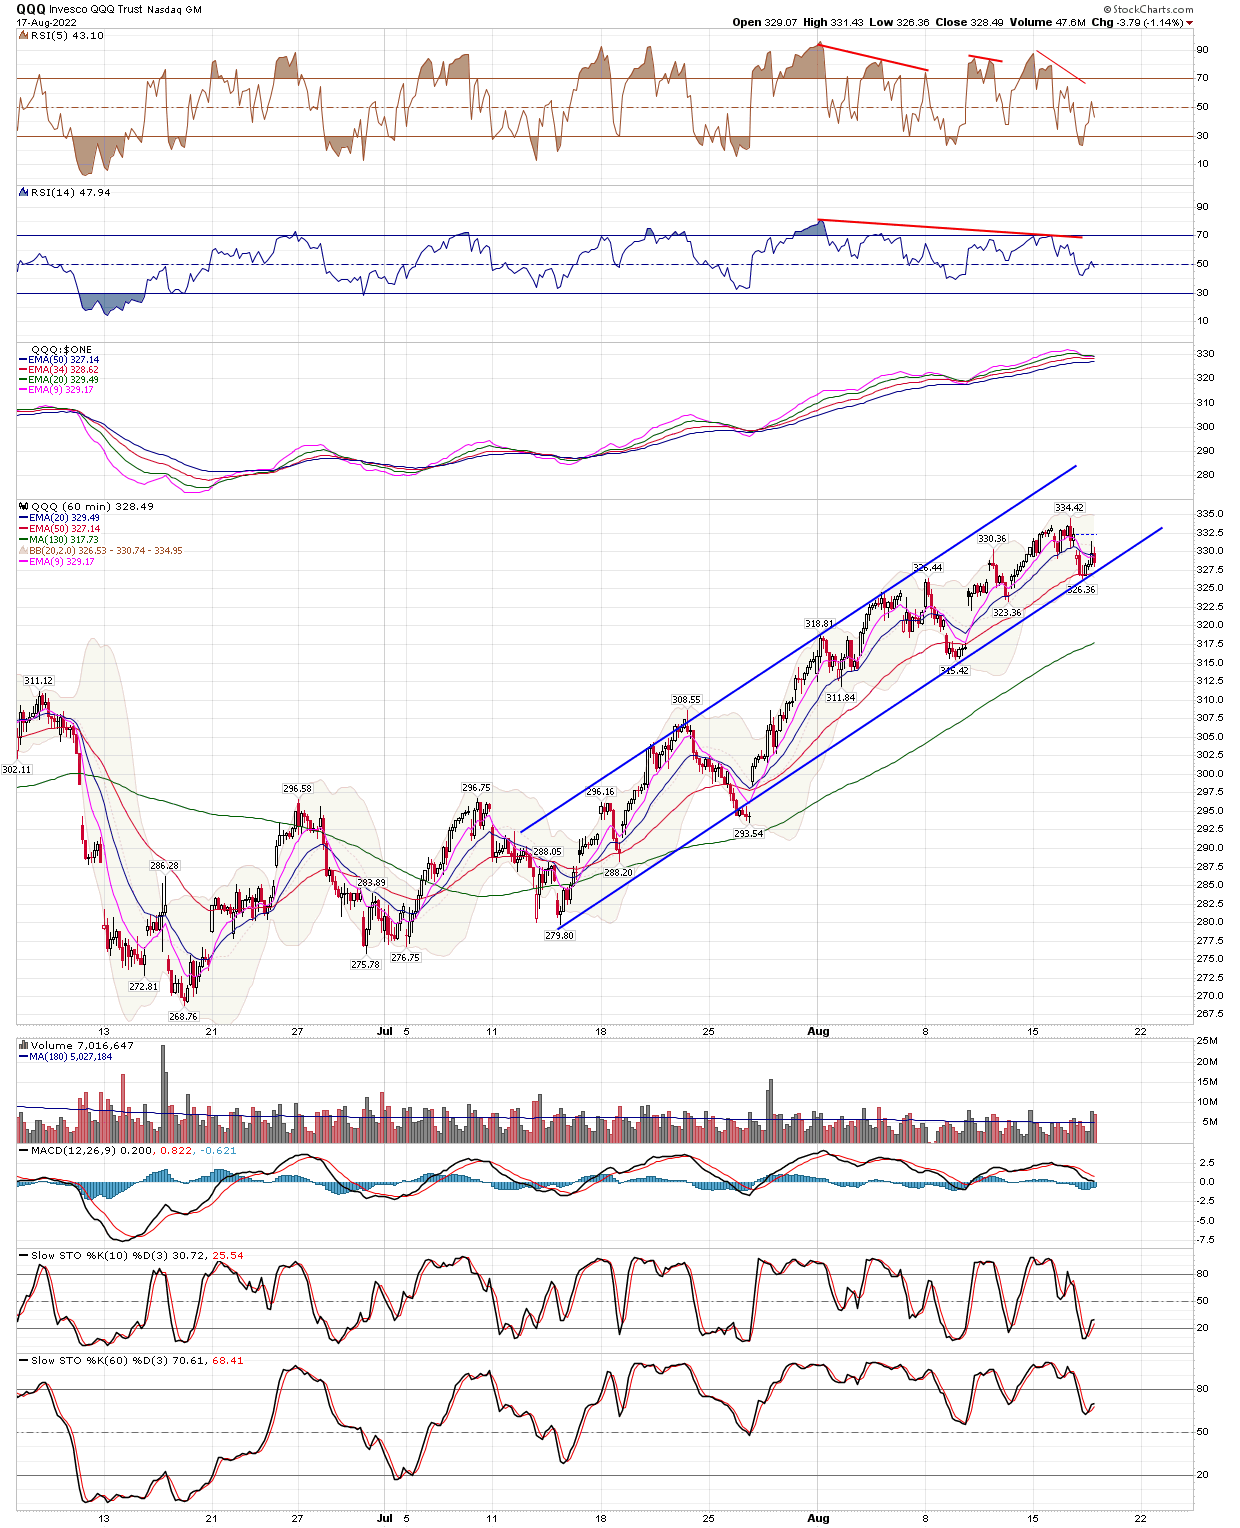
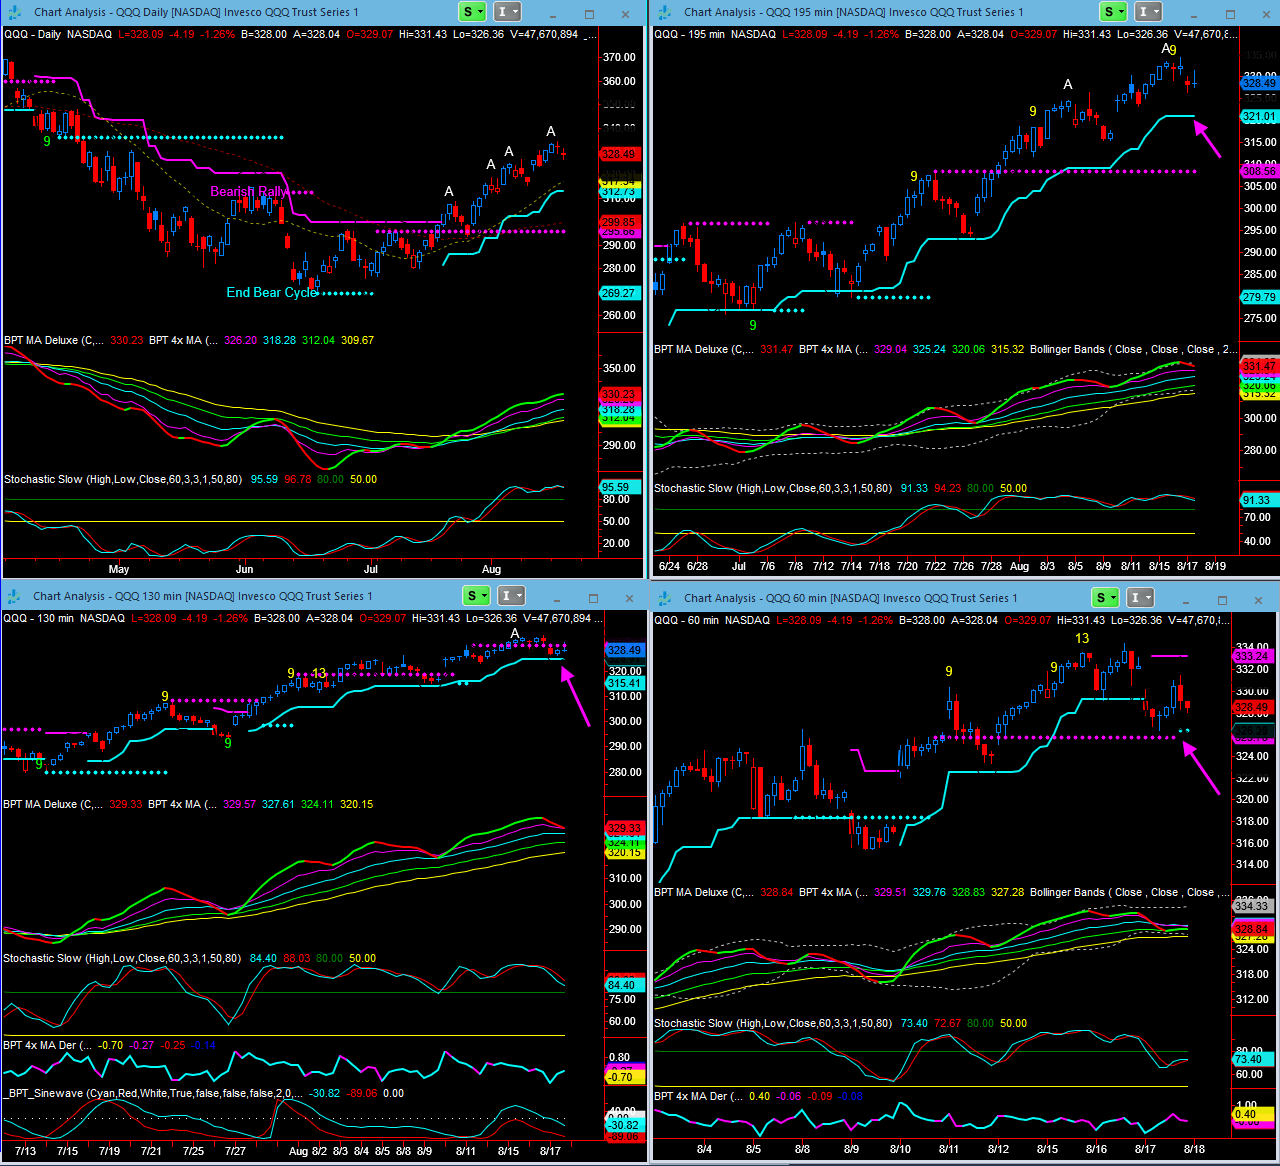
The indexes still remain in these tight uptrend channel patterns (have not broken). However in the short-term we are monitoring today's lower high bounce within the confines of a downtrend channel with the lower high being a wave b or 2 (see the 15 and 10 min SPX views).
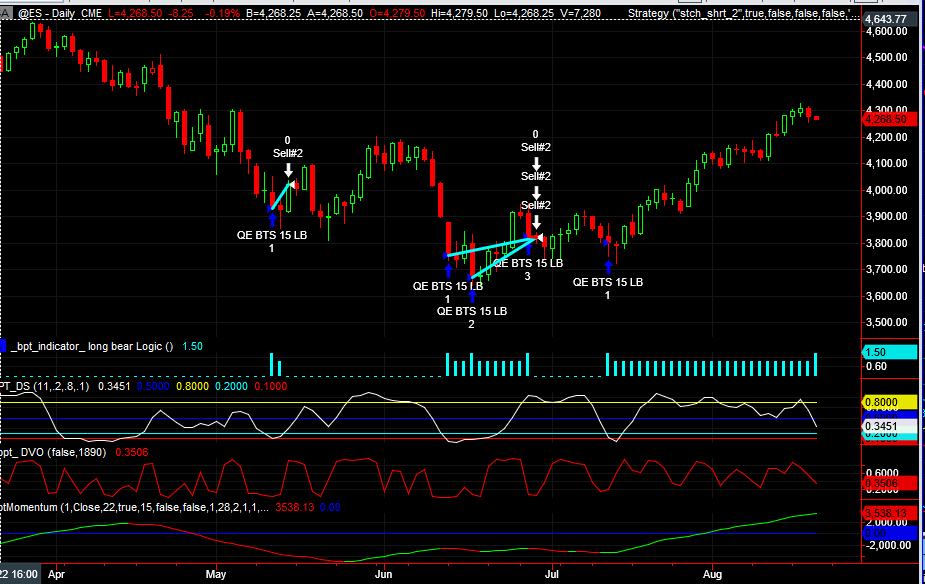
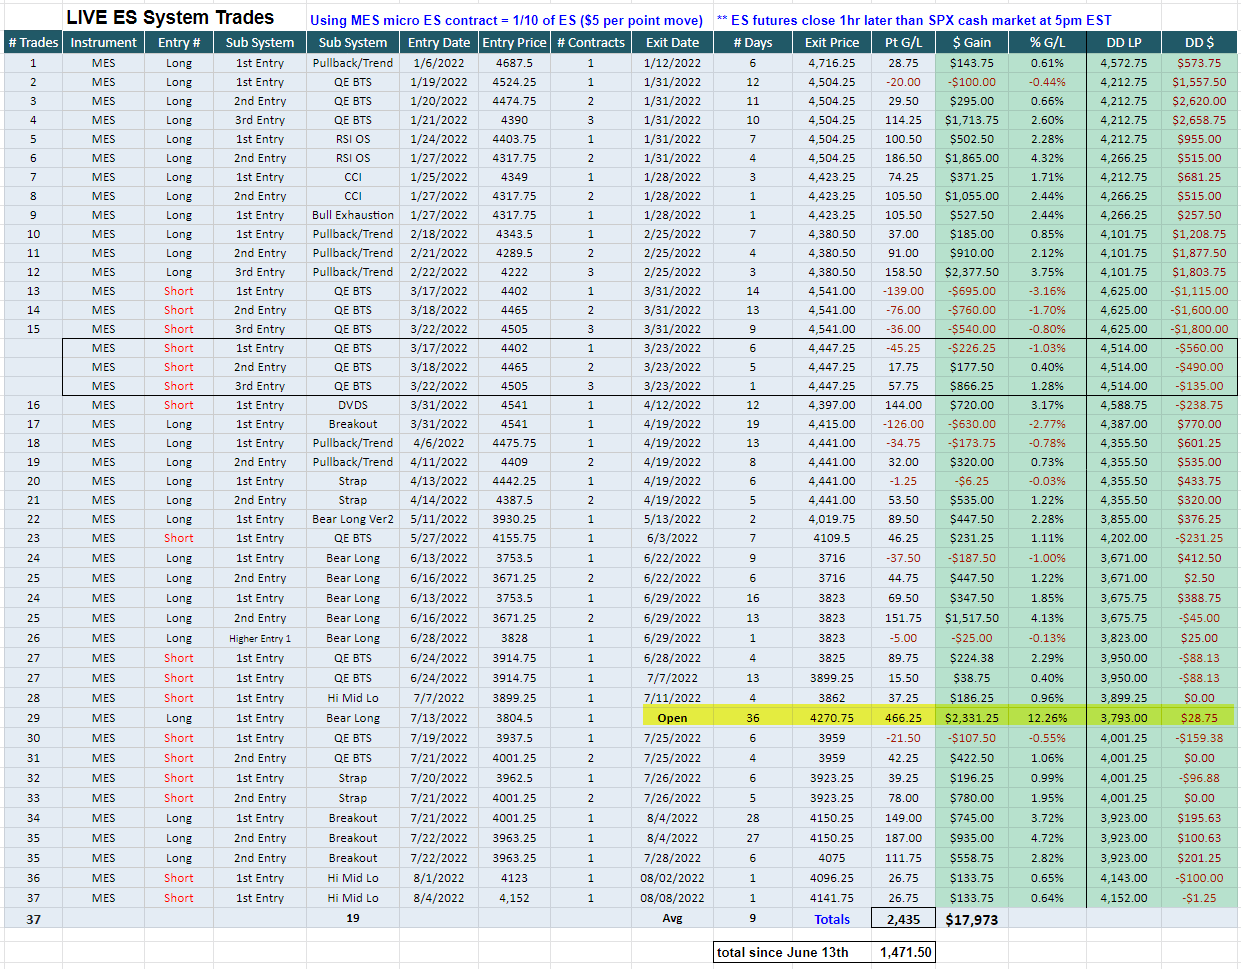
The systems continue to kick ass, what else can I say? The ES Bear Long remains long, no changes and no other systems have taken any trades (we need volatility for that).
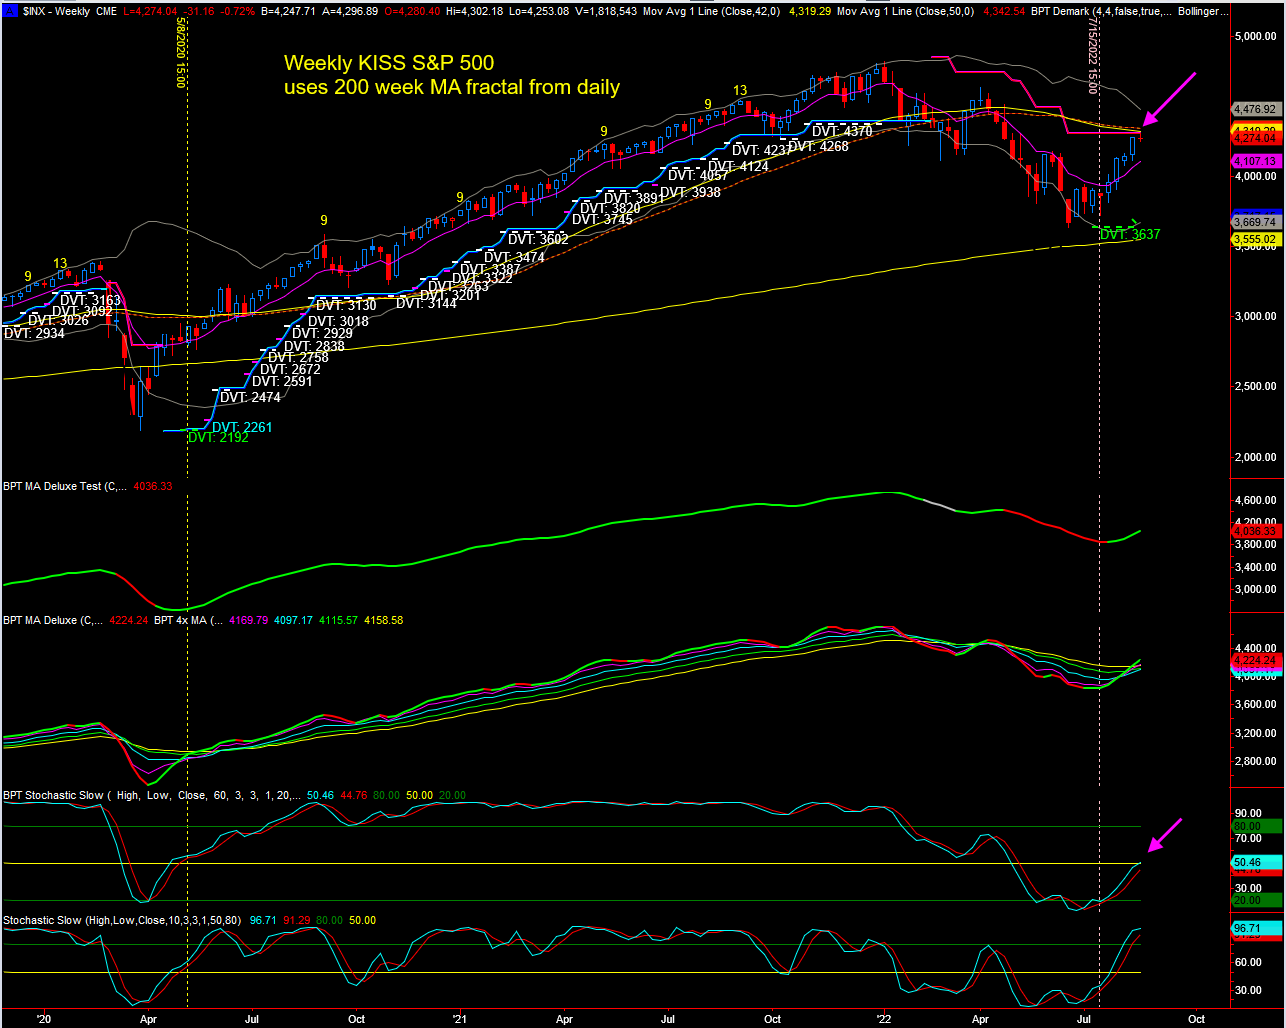
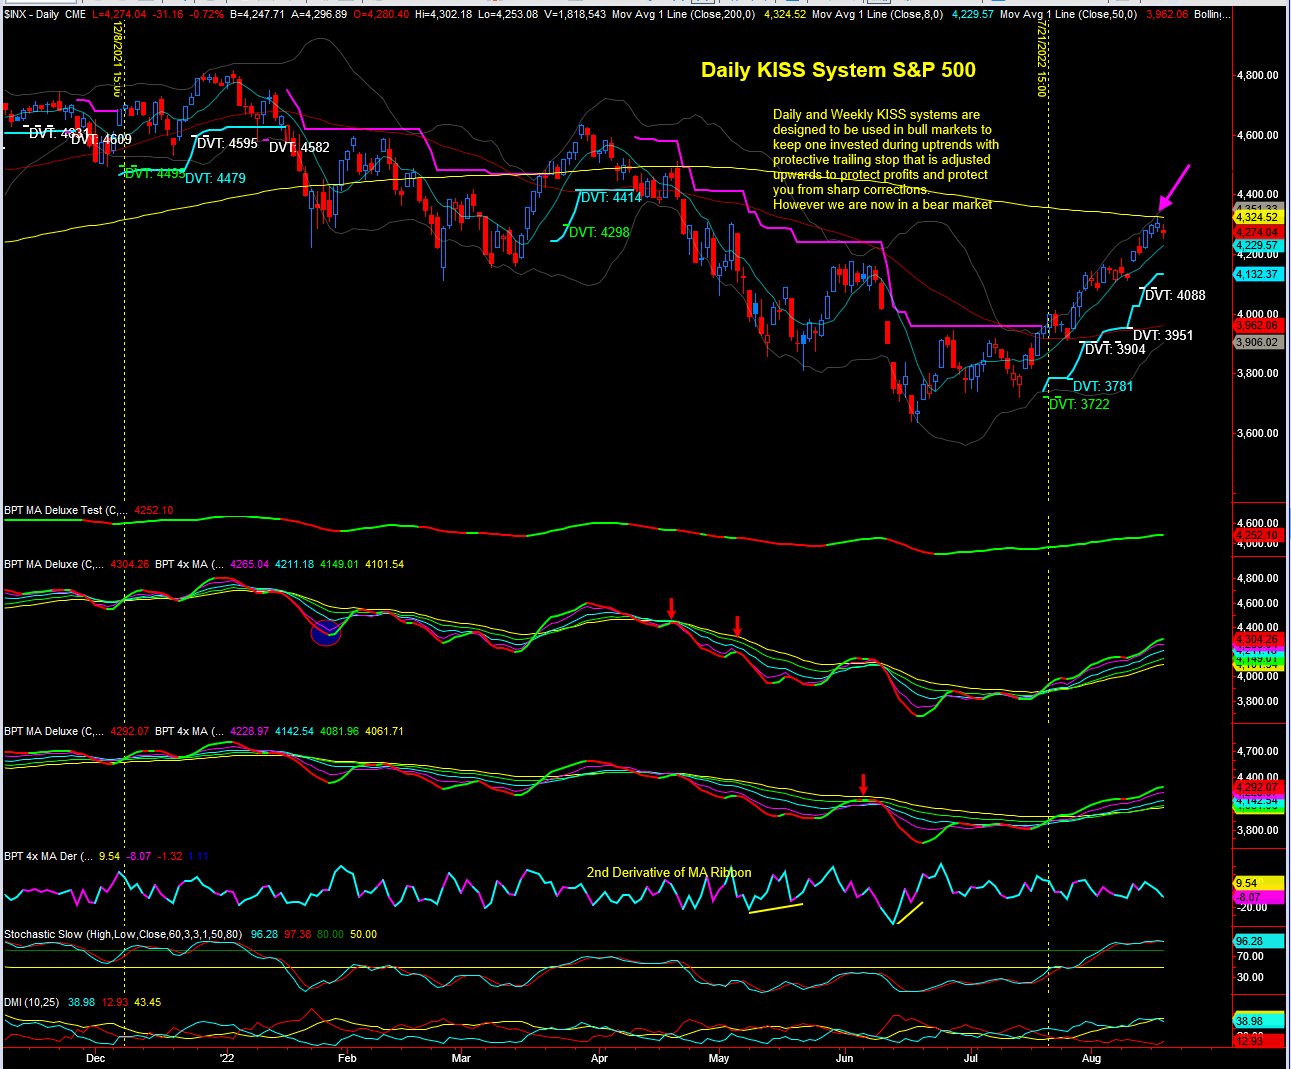
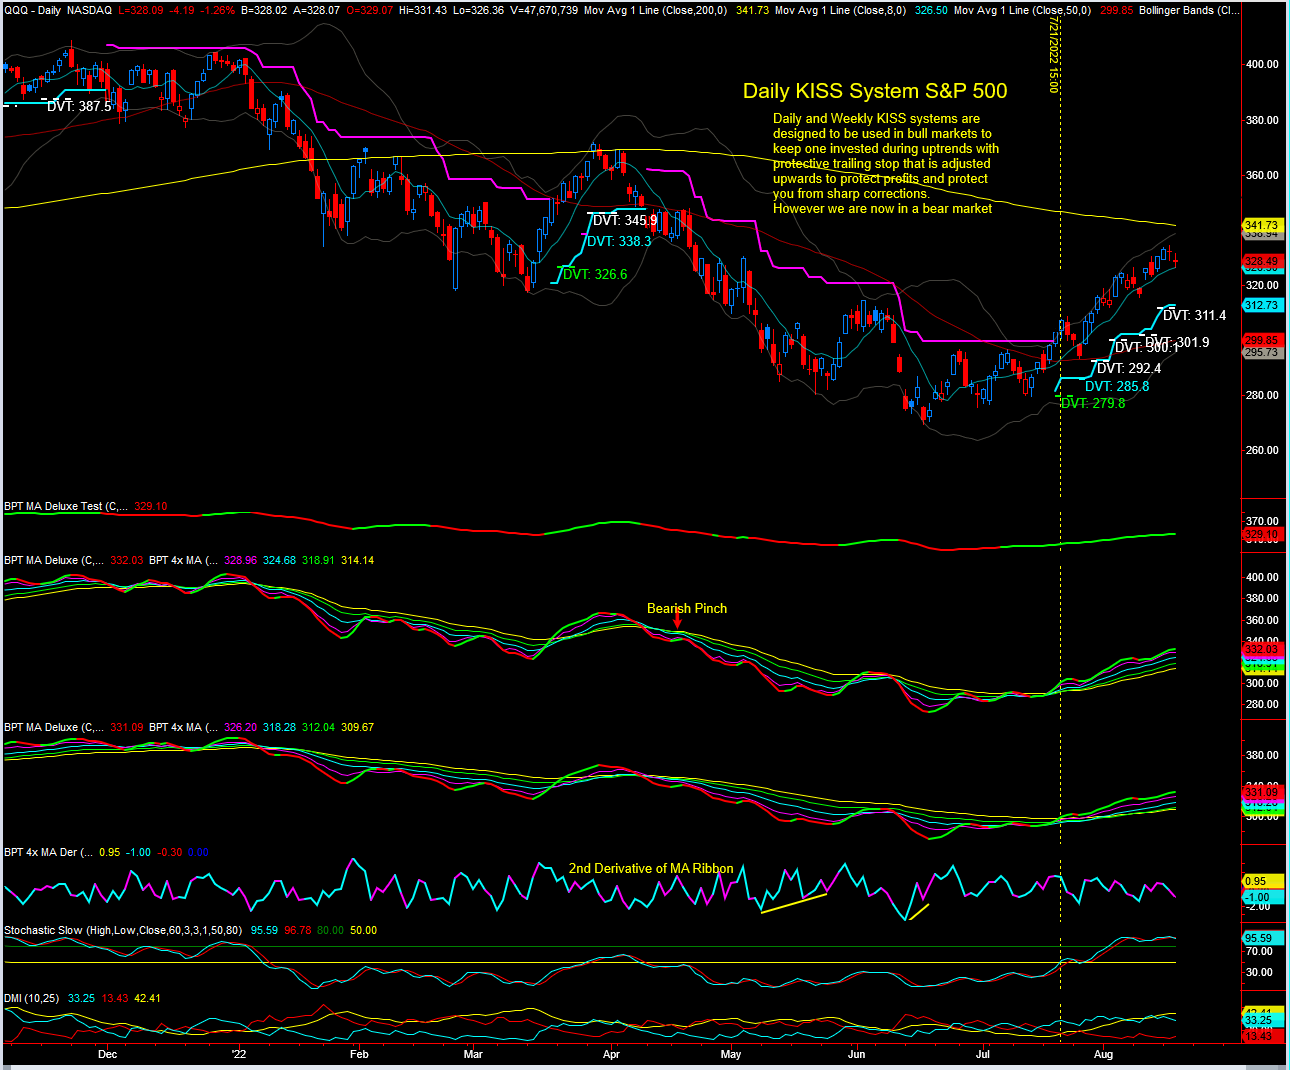
The KISS daily systems have done well this time, from their market re-entry long in mid July with 6 higher low DVT's now in place to protect profits.
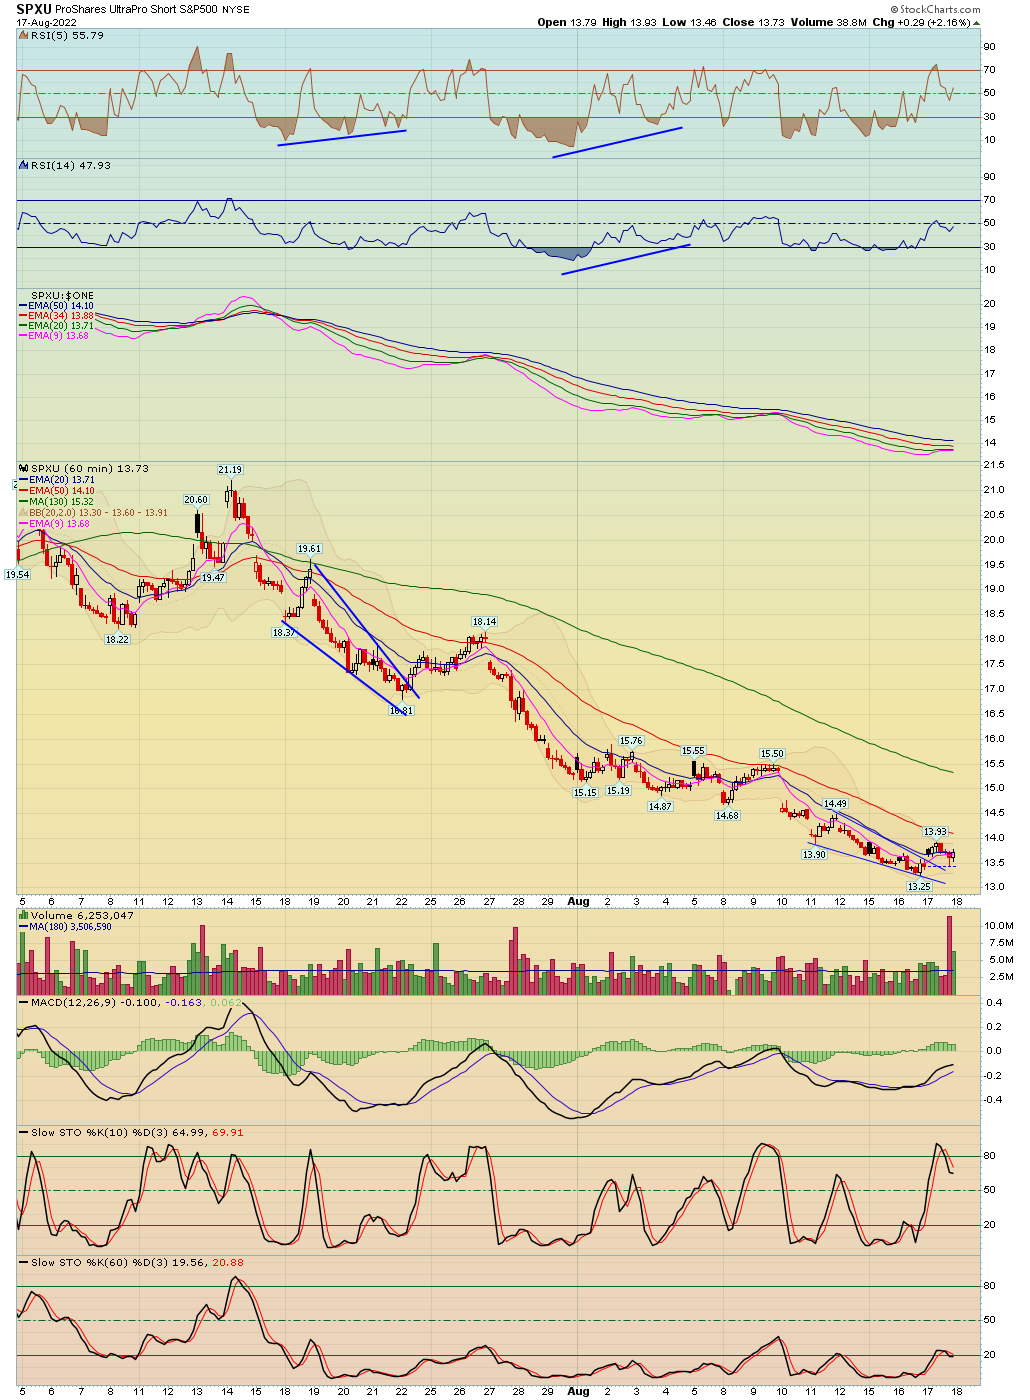
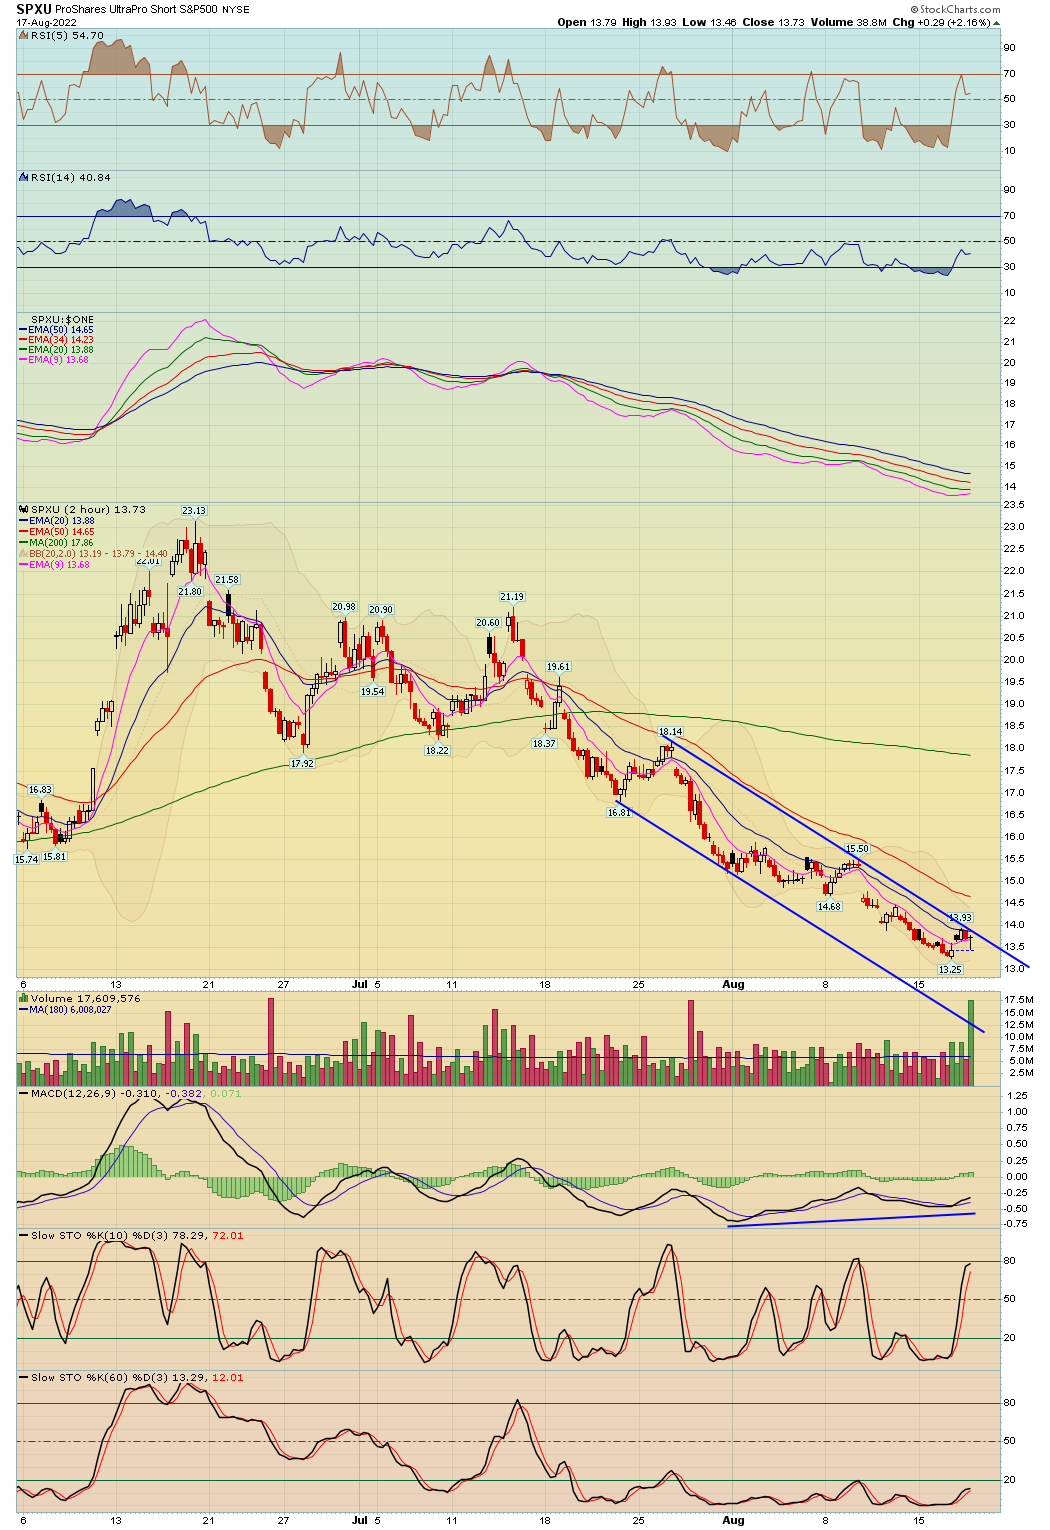
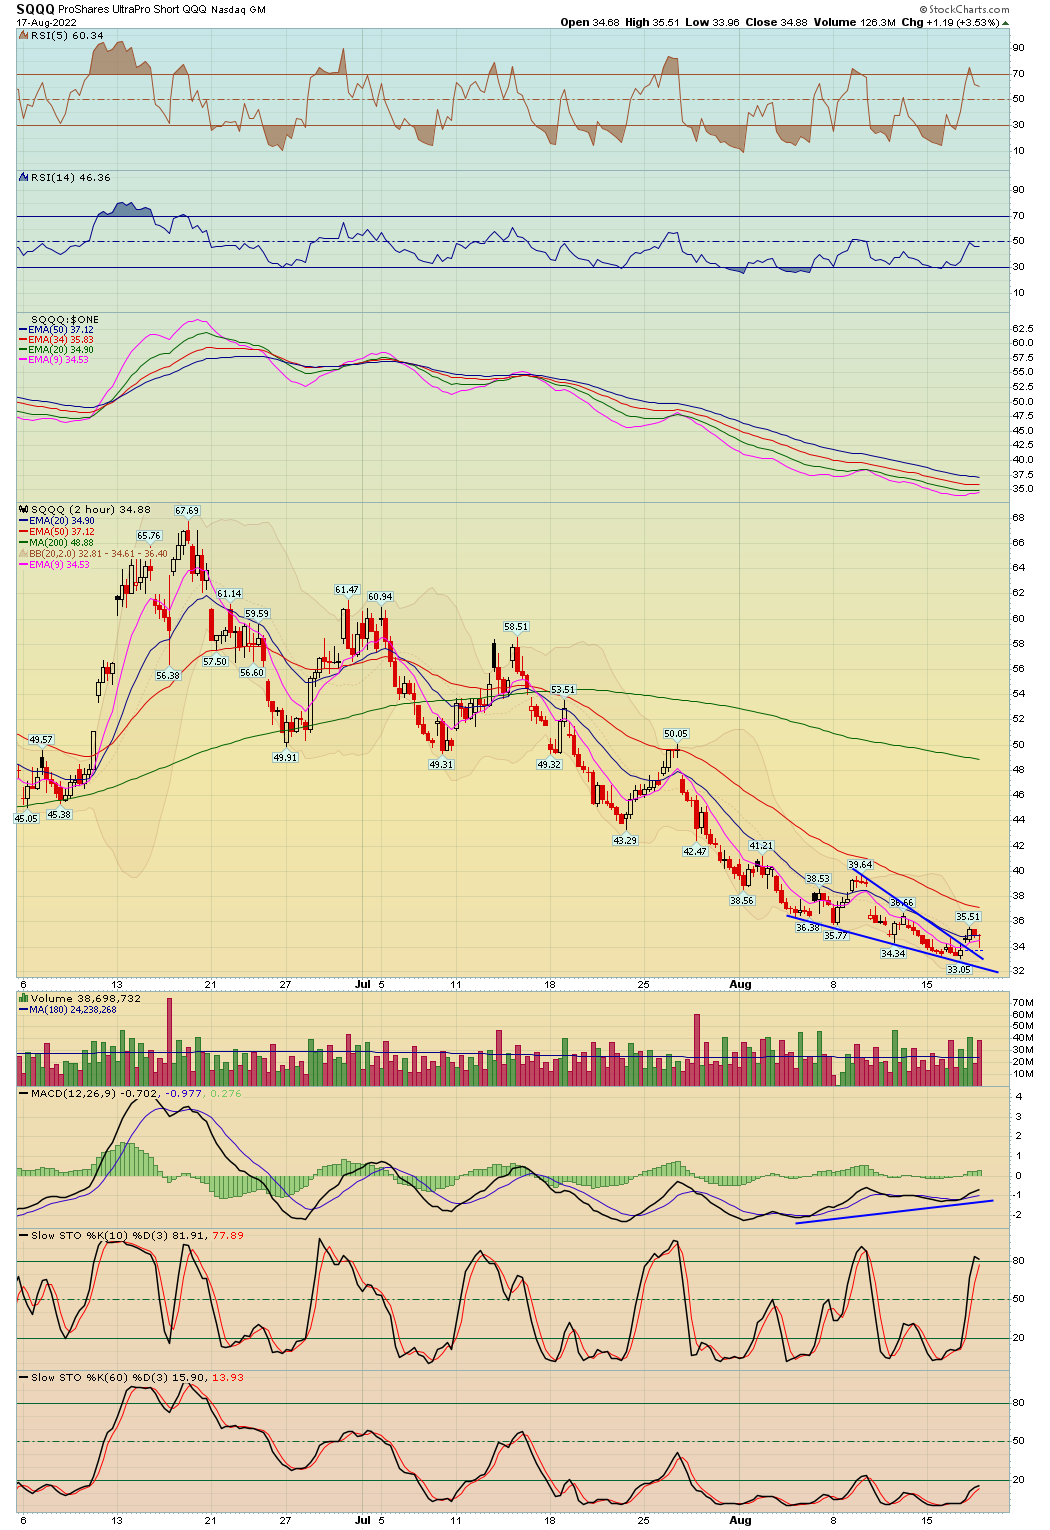
I'm not seeing much in the idea of trade ideas. On Tuesday Steve added the inverse ETF's SPXU and SQQQ as quick shorts on the market and those played out this morning.
Note: Several previous ideas on watchlist remain valid but simply have not yet triggered so continue to re-examine each night. Consider making a fresh top 10-12 setups each night and put on front page along with existing trades. My advice is to keep your total ideas to a manageable number (very few in volatile market). Lastly, it's best to wait at times for valid setups to form - sometimes less is more. Big moves tend to occur first and last hour and overnight sessions.
2
| Major Indexes | Index Symbol | ETF Symbol | % G / L Day | % G / L Week | Close |
|---|---|---|---|---|---|
| Dow Jones | INDU - W | DIA - W | -0.50% | 0.65% | 33,980.32 |
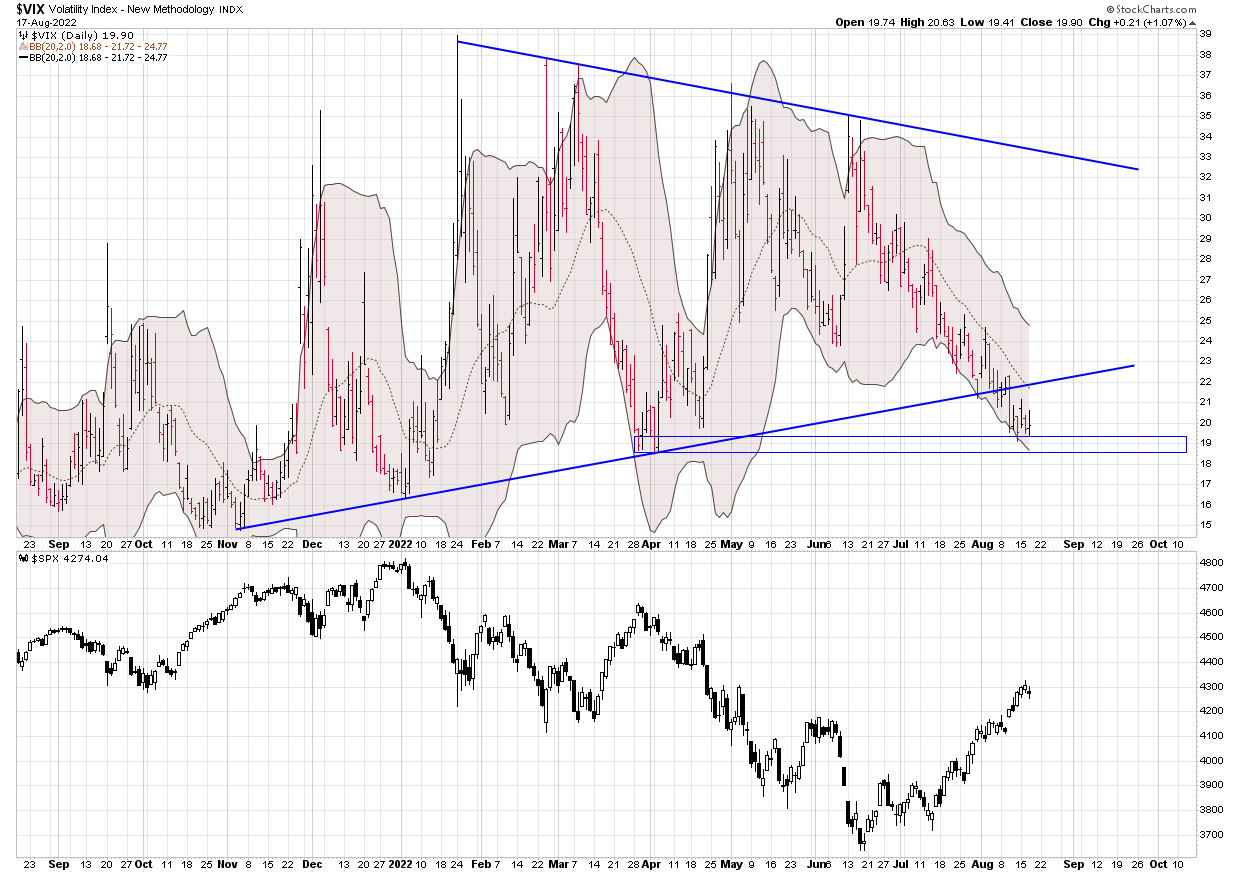
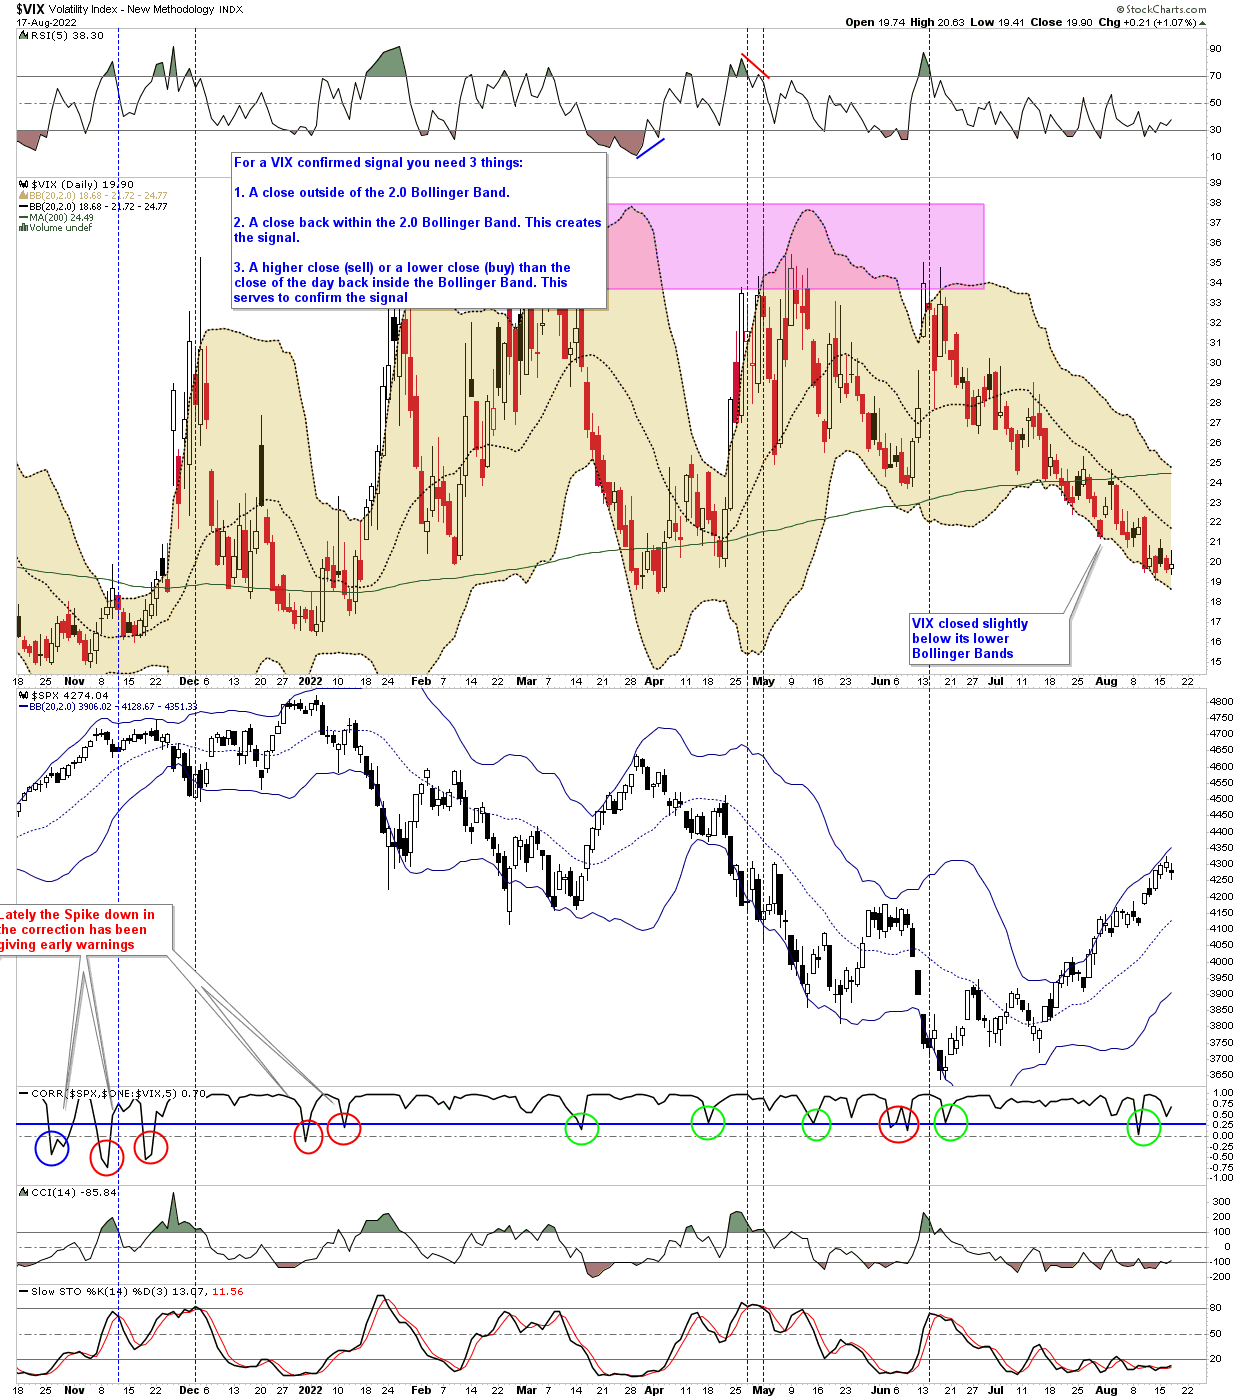
| S&P 500 | SPX - W | SPY - W | -0.72% | -0.14% | 4,274.04 |
| Wilshire 5000 | WLSH - W | -0.94% | -0.38% | 42,704.82 | |
| Nasdaq | COMPQ - W | -1.25% | -0.84% | 12,938.12 | |
| NDX 100 | NDX - W | QQQ - W | -1.21% | -0.70% | 13,470.86 |
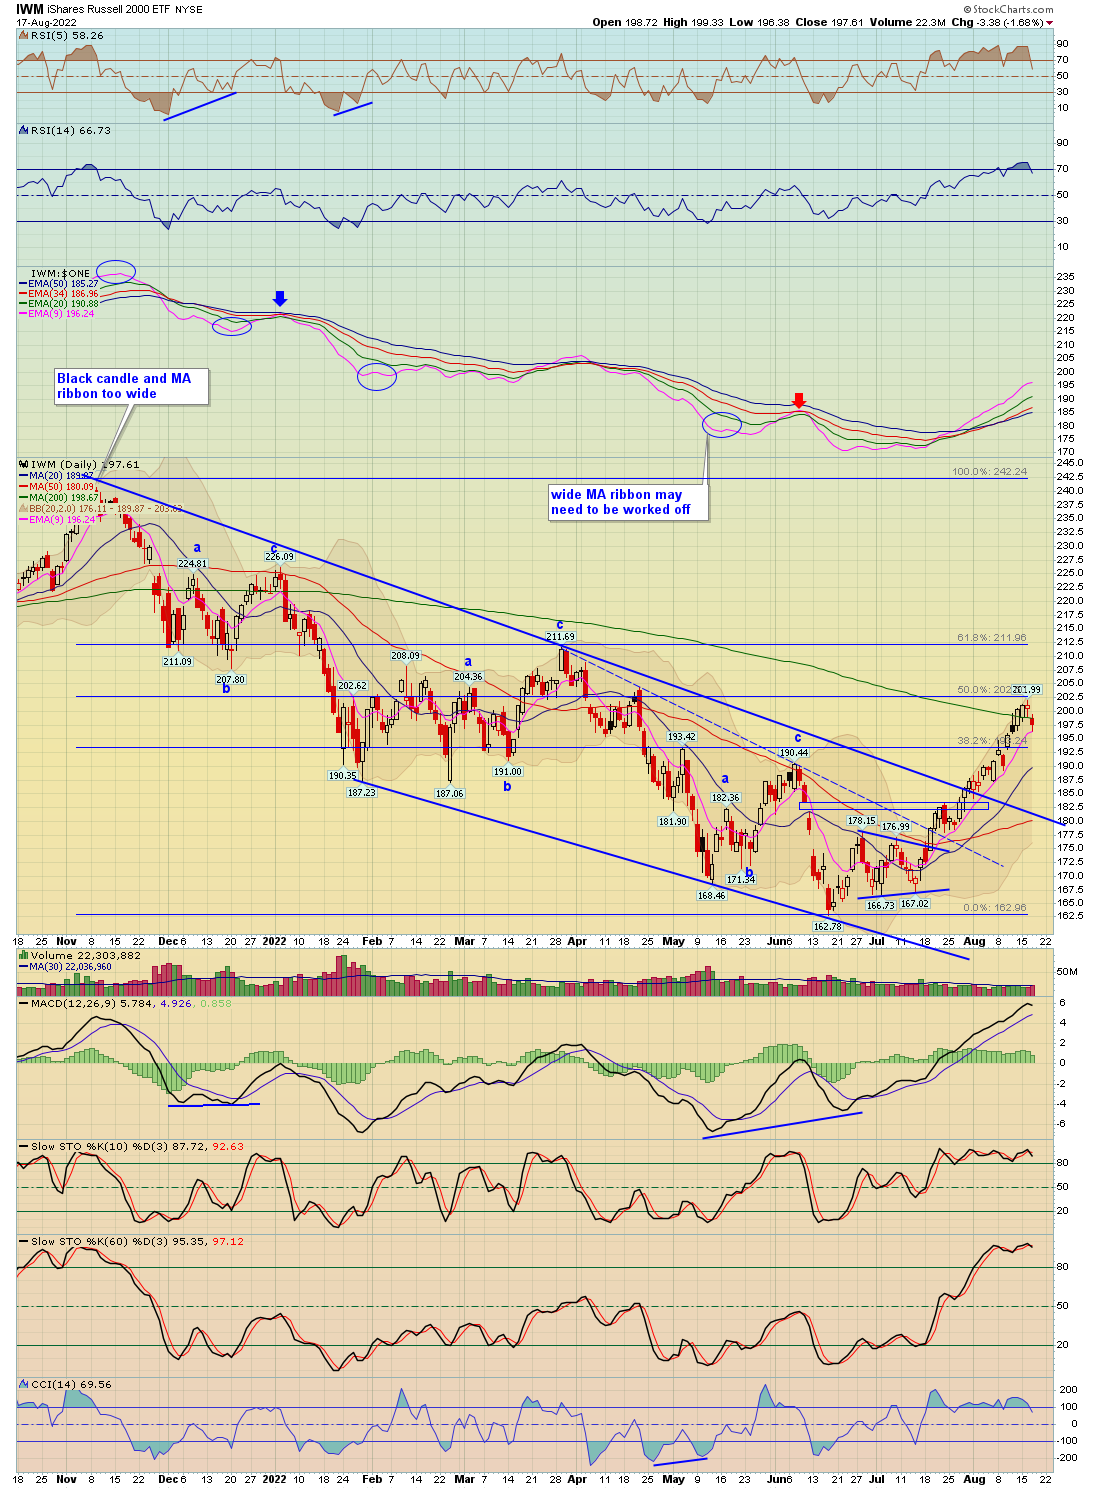
| Russel 2000 (Small Caps) | IWM - W | -1.68% | -1.37% | 197.61 |
| Market Sectors | Index Symbol | ETF Symbol | % G / L Day | % G / L Week | Close |
|---|---|---|---|---|---|
| Transports | TRAN - W | IYT - W | -1.94% | -1.53% | 14,915.48 |
| Banks | BKX - W | -1.00% | -0.41% | 114.39 | |
| Financials | XLF - W | -0.50% | 0.20% | 35.63 | |
| Brokers | XBD - W | -0.43% | 0.40% | 468.45 | |
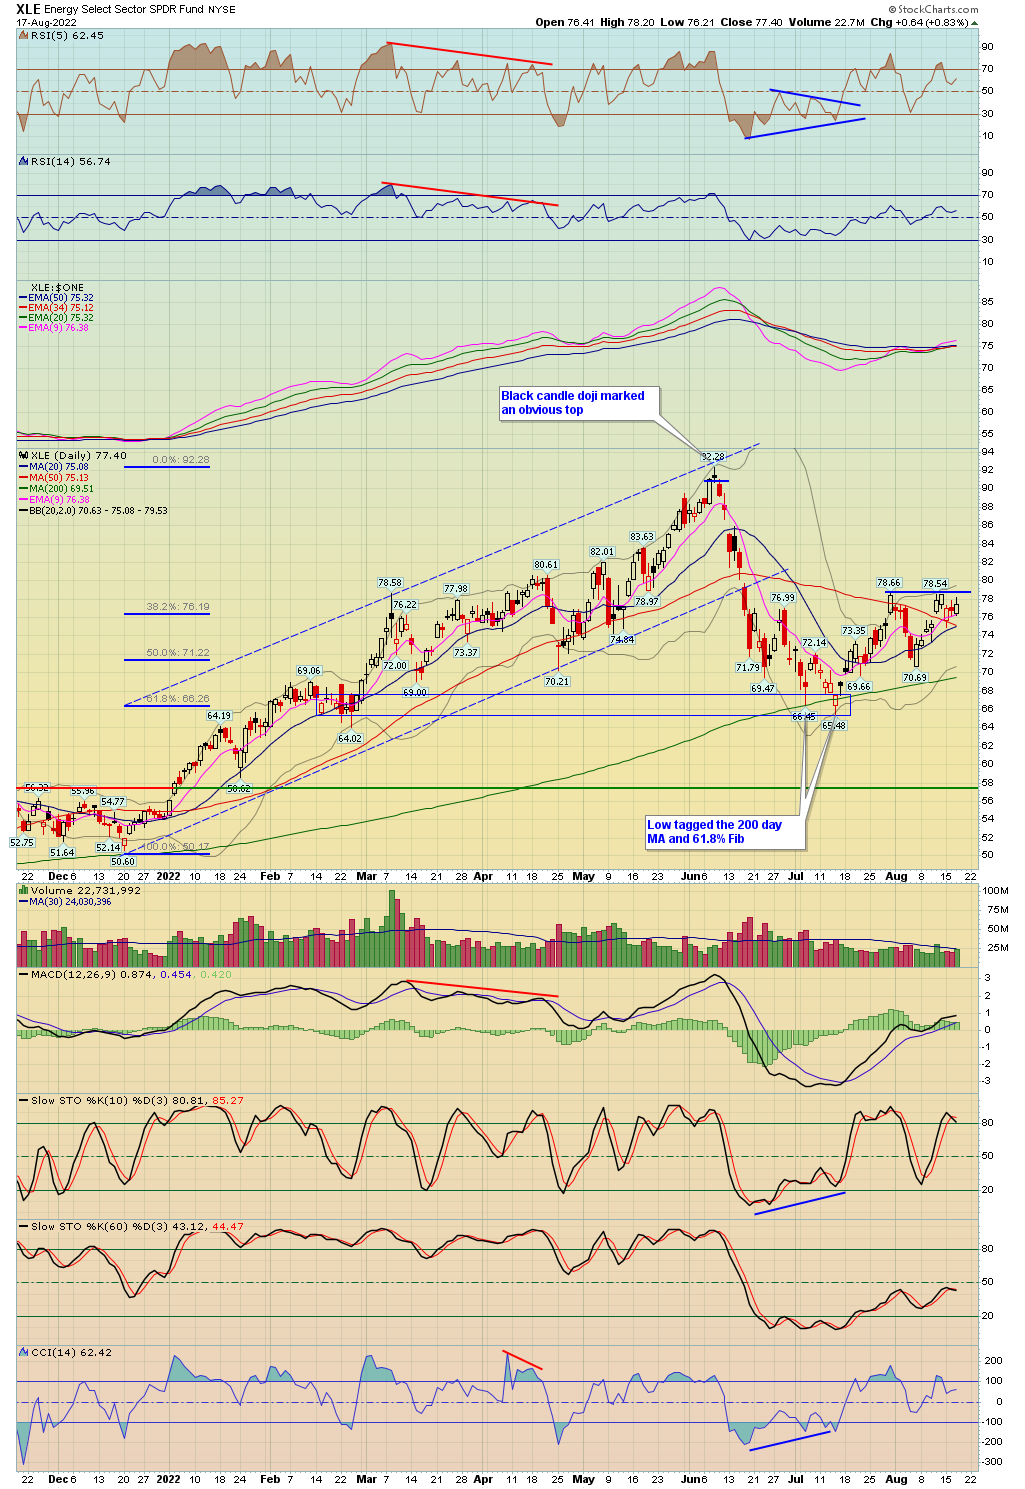
| XLE (Energy Select) | XLE - W | 0.83% | -1.36% | 77.40 | |
| Oil Service Holders | OIH - W | 0.34% | -5.12% | 230.39 | |
| Technology | XLK - W | -0.71% | -0.36% | 150.07 | |
| Semiconductor | SOX - W | SMH - W | -2.48% | -3.19% | 2,970.12 |
| Communication Services | XLC - W | -1.94% | -1.39% | 58.73 | |
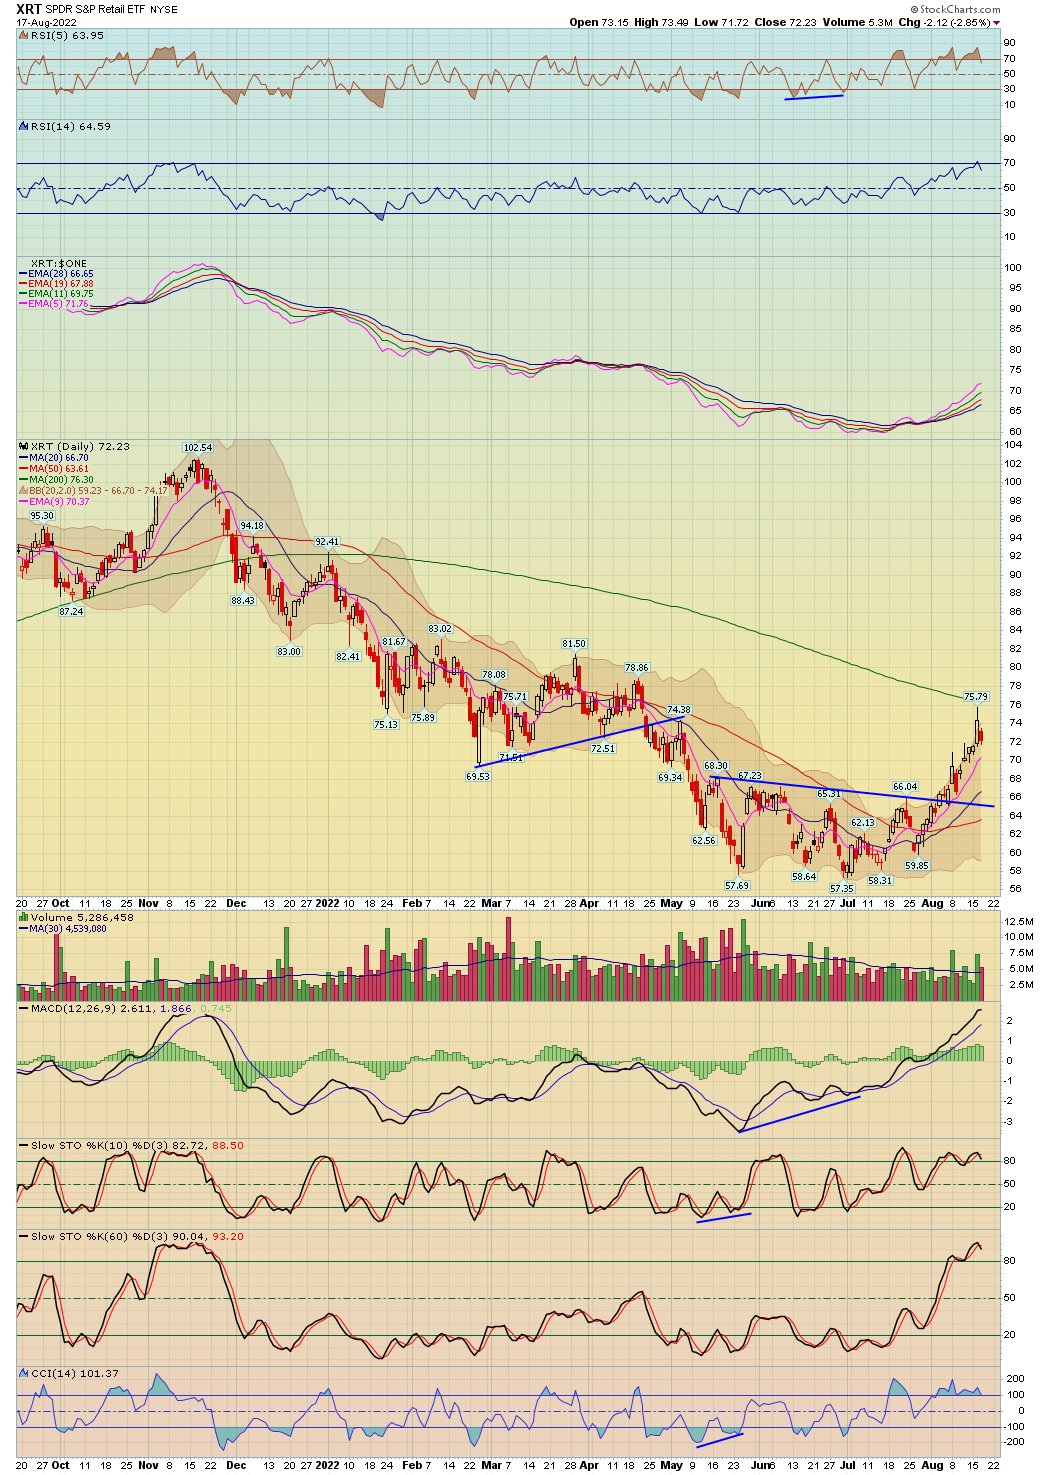
| Retail | XRT - W | -2.85% | 1.13% | 72.23 | |
| Consumer Staples | XLP - W | -0.29% | 1.84% | 76.90 | |
| Consumer Discretionary | XLY - W | -1.08% | 0.71% | 171.11 | |
| Industrials | XLI - W | -0.80% | -0.11% | 99.73 | |
| Real Estate | IYR - W | -0.42% | -0.30% | 102.38 | |
| Homebuilders | HGX - W | XHB - W | -1.36% | -1.36% | 417.97 |
| Materials | XLB - W | -1.37% | -0.89% | 80.40 | |
| Metals And Mining | XME - W | -2.67% | -3.37% | 50.72 | |
| Biotechnology | BTK - W | XBI - W | -1.69% | -1.74% | 4,963.56 |
| Healthcare | XLV - W | -0.58% | -0.35% | 133.15 | |
| Drugs | DRG - W | -0.47% | -0.58% | 800.69 | |
| Utilities | UTIL - W | XLU - W | 0.00% | 1.18% | 1,053.86 |
| Currencies | Index Symbol | ETF Symbol | % G / L Day | % G / L Week | Close |
|---|---|---|---|---|---|
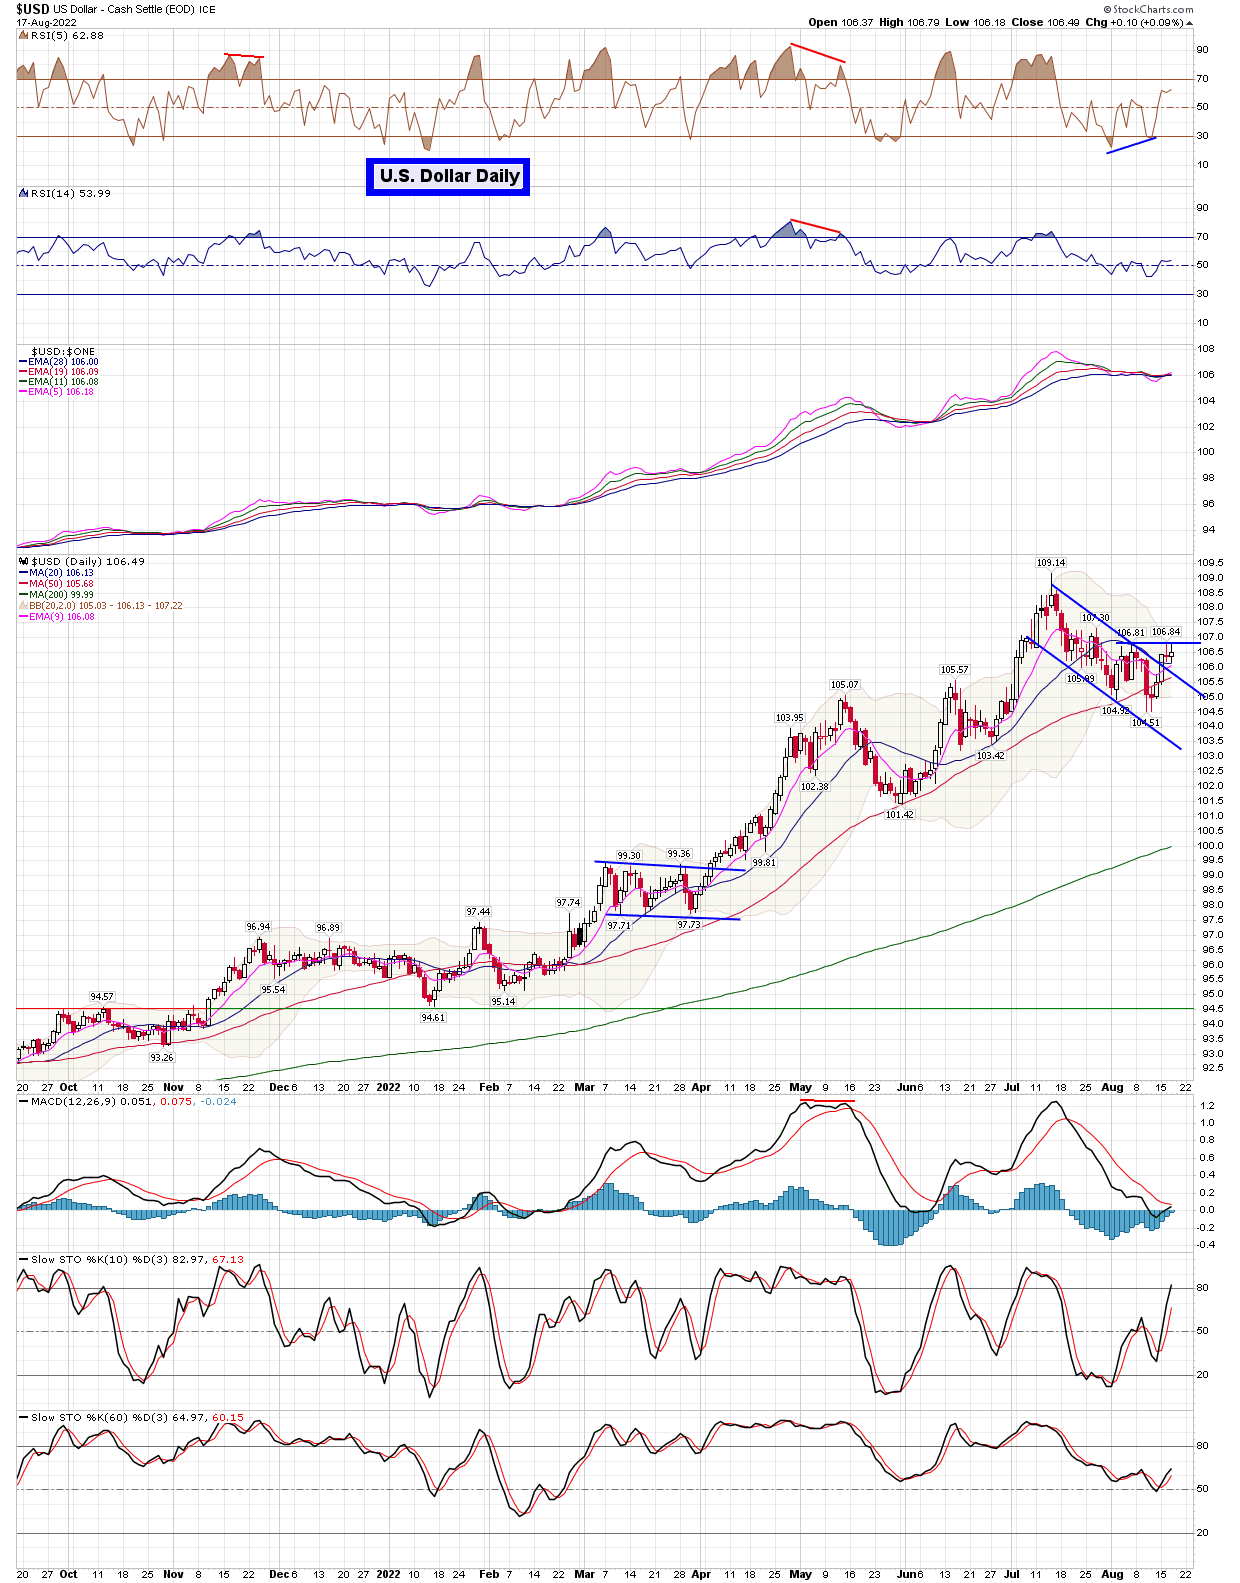
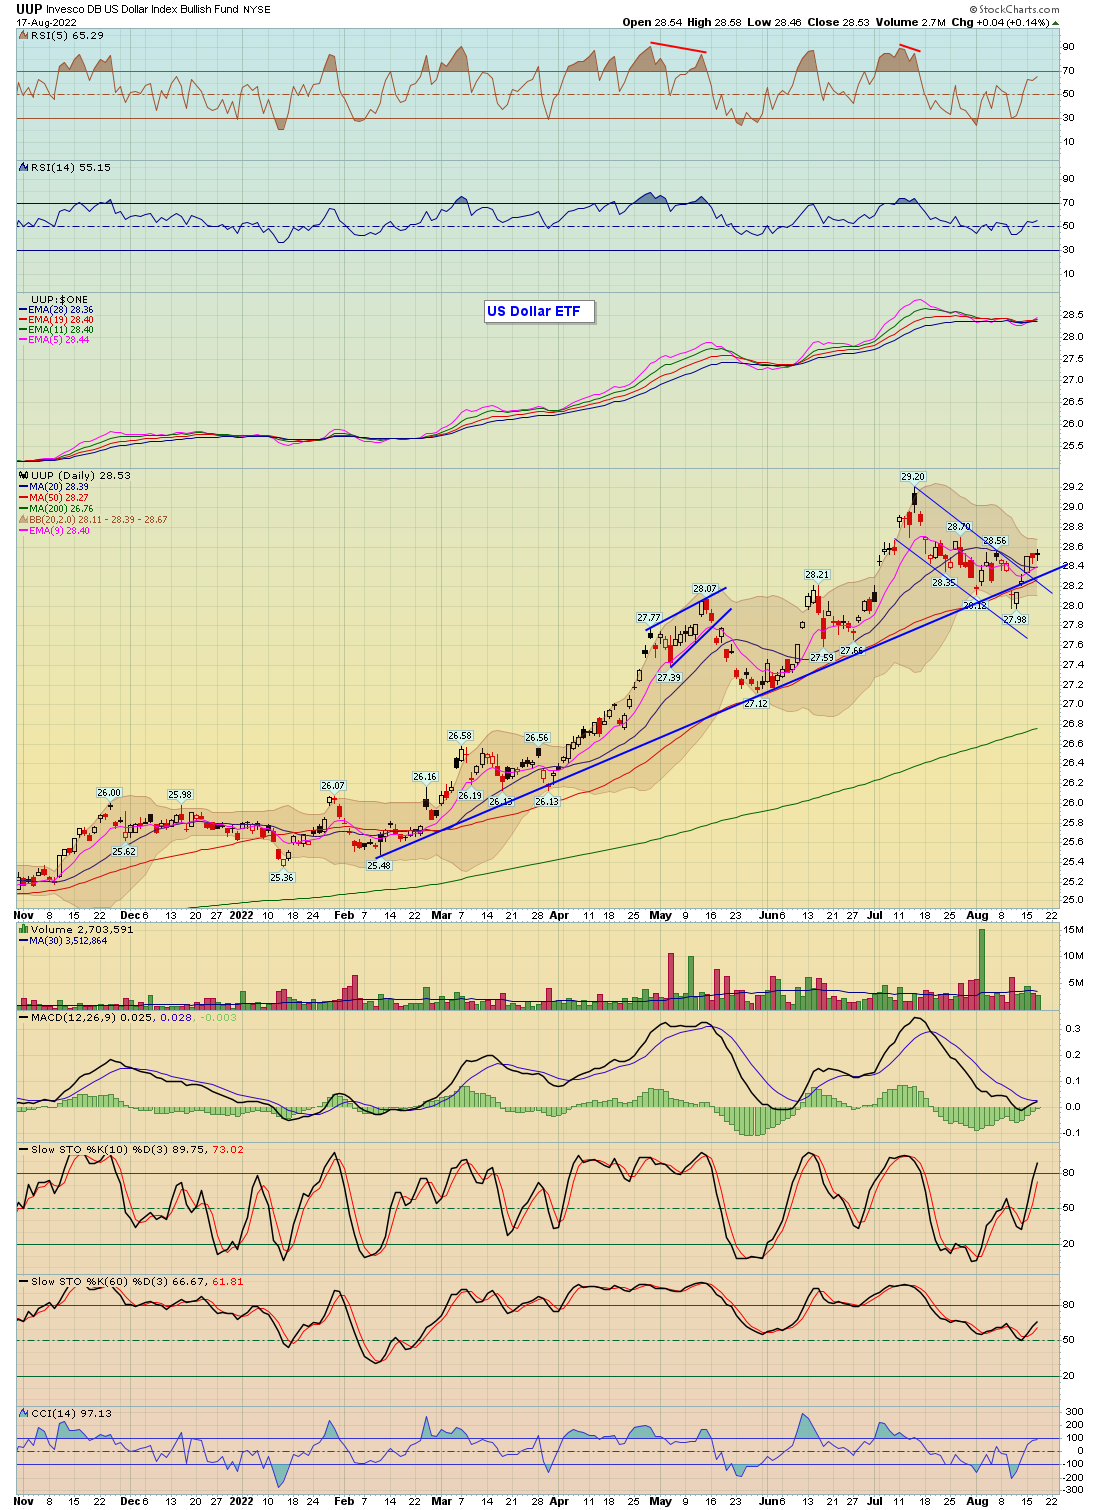
| US Dollar | UUP - W | 0.14% | 0.99% | 28.53 | |
| Euro | XEU - W | FXE - W | 0.09% | -0.81% | 101.82 |
| Yen | XJY - W | FXY - W | -0.64% | -1.20% | 74.04 |
| Australian | XAD - W | FXA - W | -1.28% | -2.72% | 69.34 |
| British Pound | XBP - W | FXB - W | -0.38% | -0.78% | 120.47 |
| Chinese Yuan | CYB - W | 0.11% | -0.80% | 25.49 | |
| Canadian Dollar | CDW - W | FXC - W | -0.50% | -1.04% | 77.45 |
| Swiss Franc | XSF - W | FXF - W | -0.21% | -1.10% | 105.06 |
| Cryptocurrencies | Index Symbol | ETF Symbol | % G / L Day | % G / L Week | Close |
|---|---|---|---|---|---|
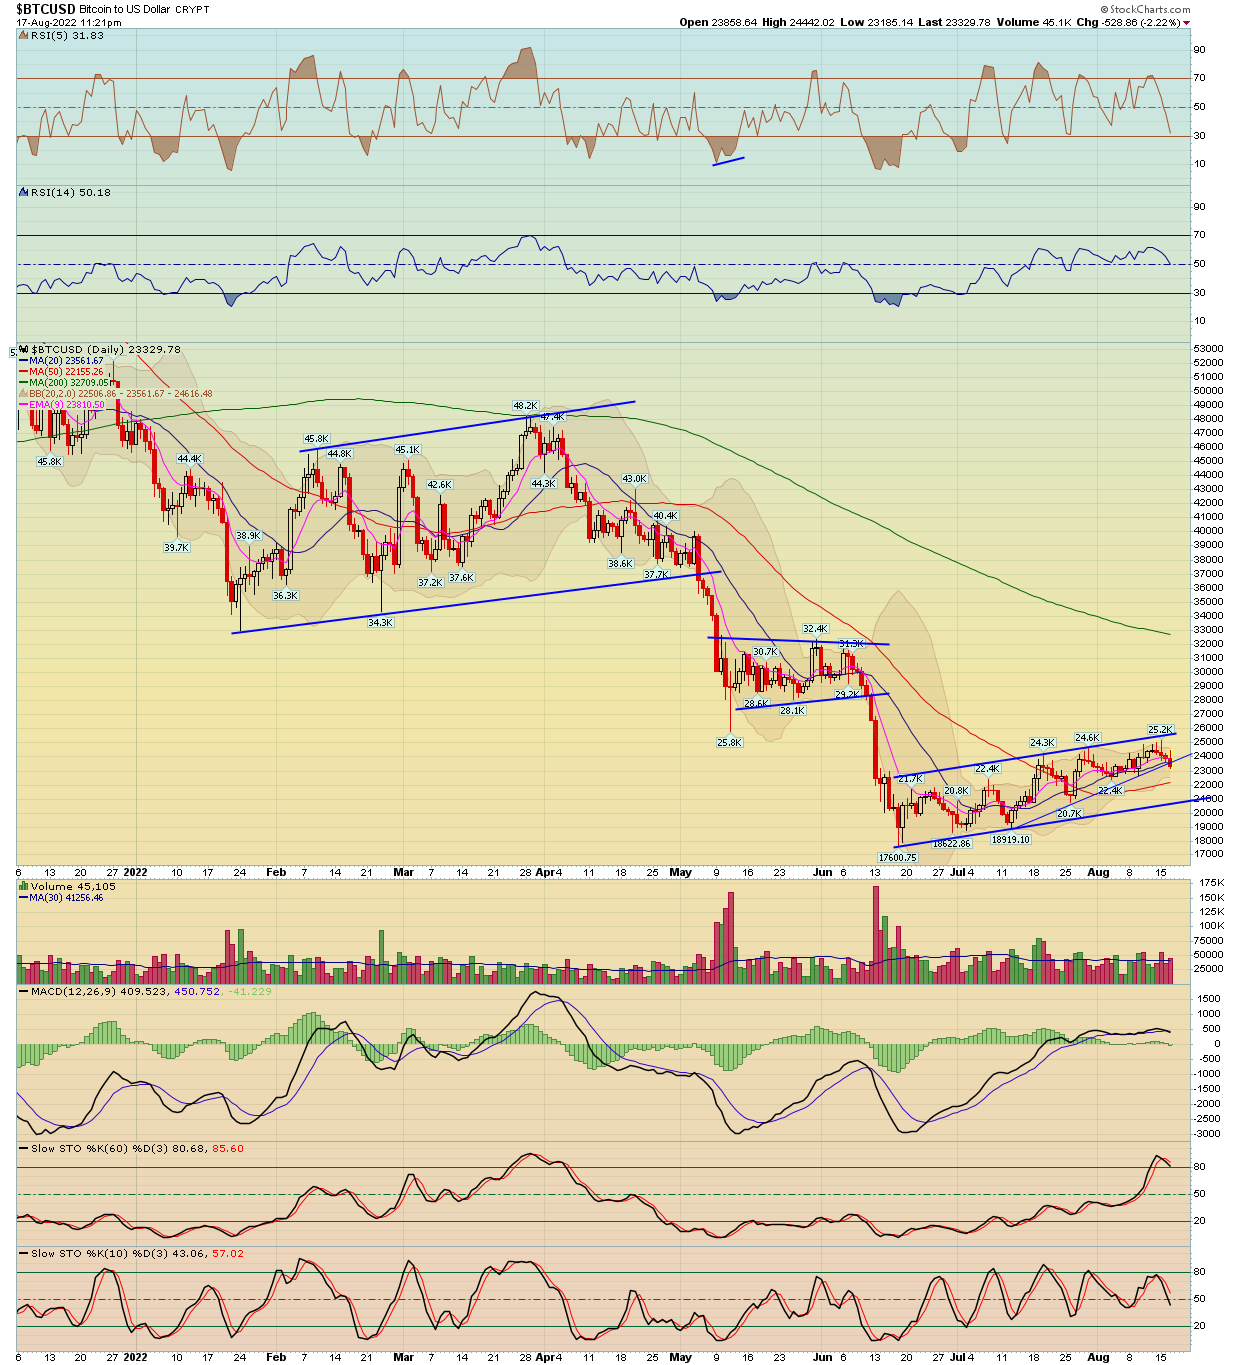
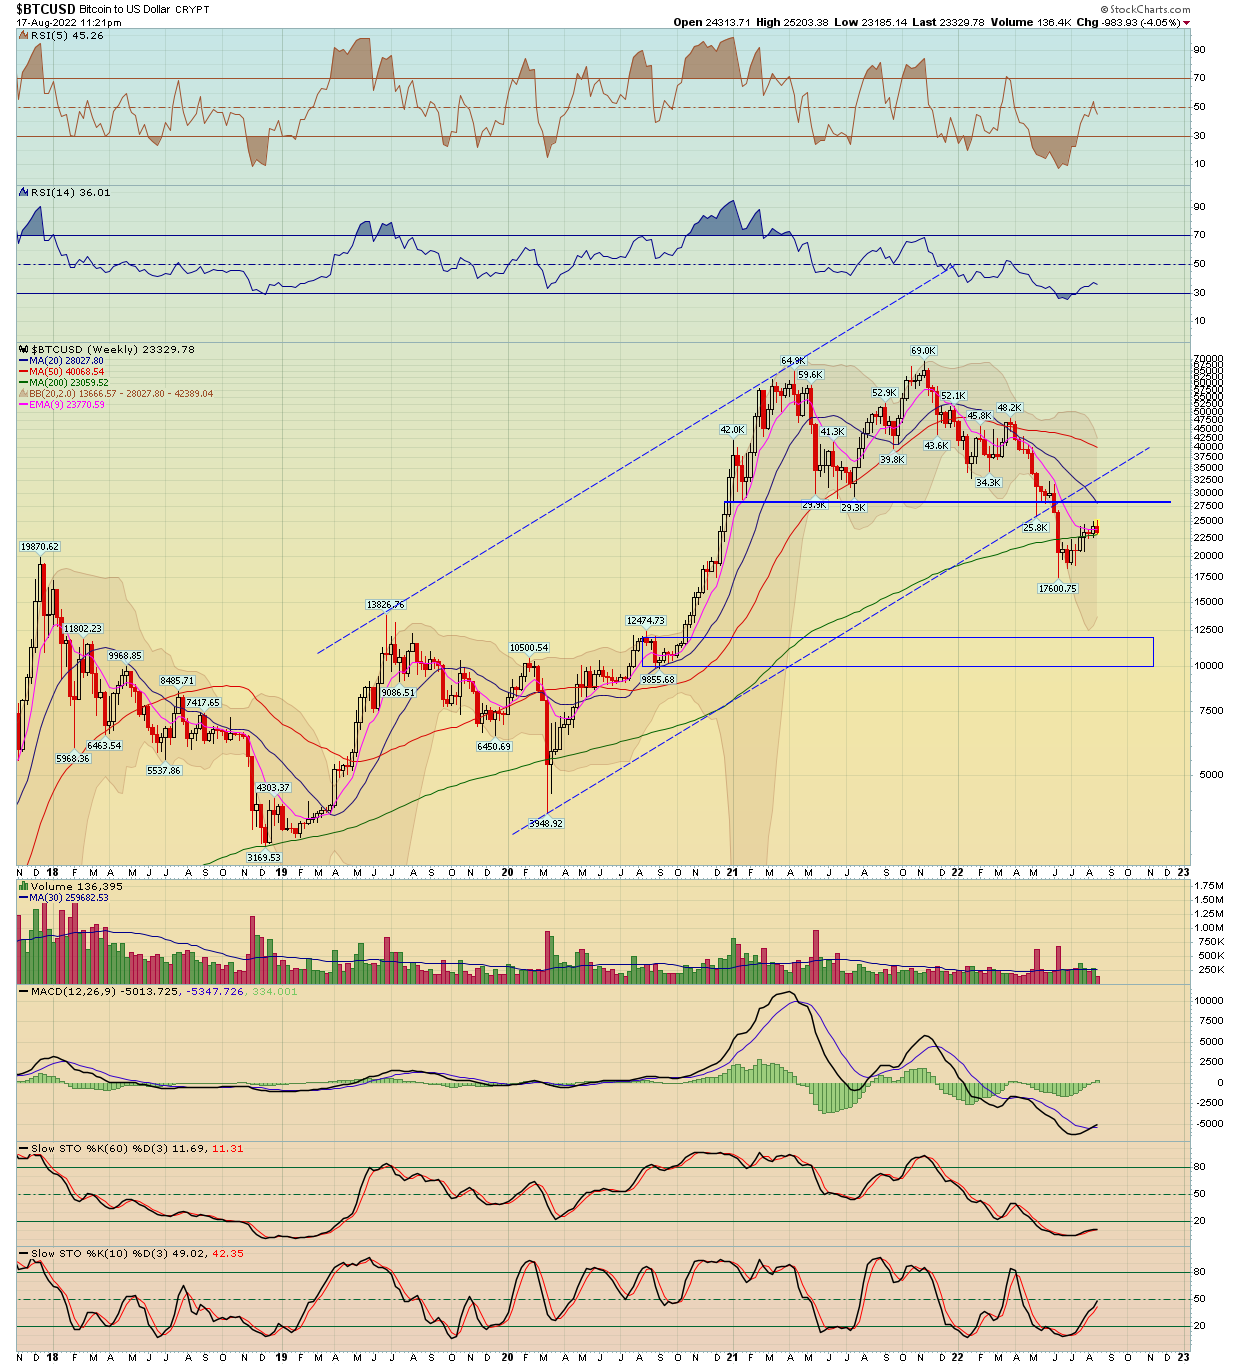
| Bitcoin | BTCUSD - W | -1.95% | -3.78% | 23,394.00 | |
| Bitcoin Cash | BCHUSD - W | -1.08% | -3.23% | 134.96 | |
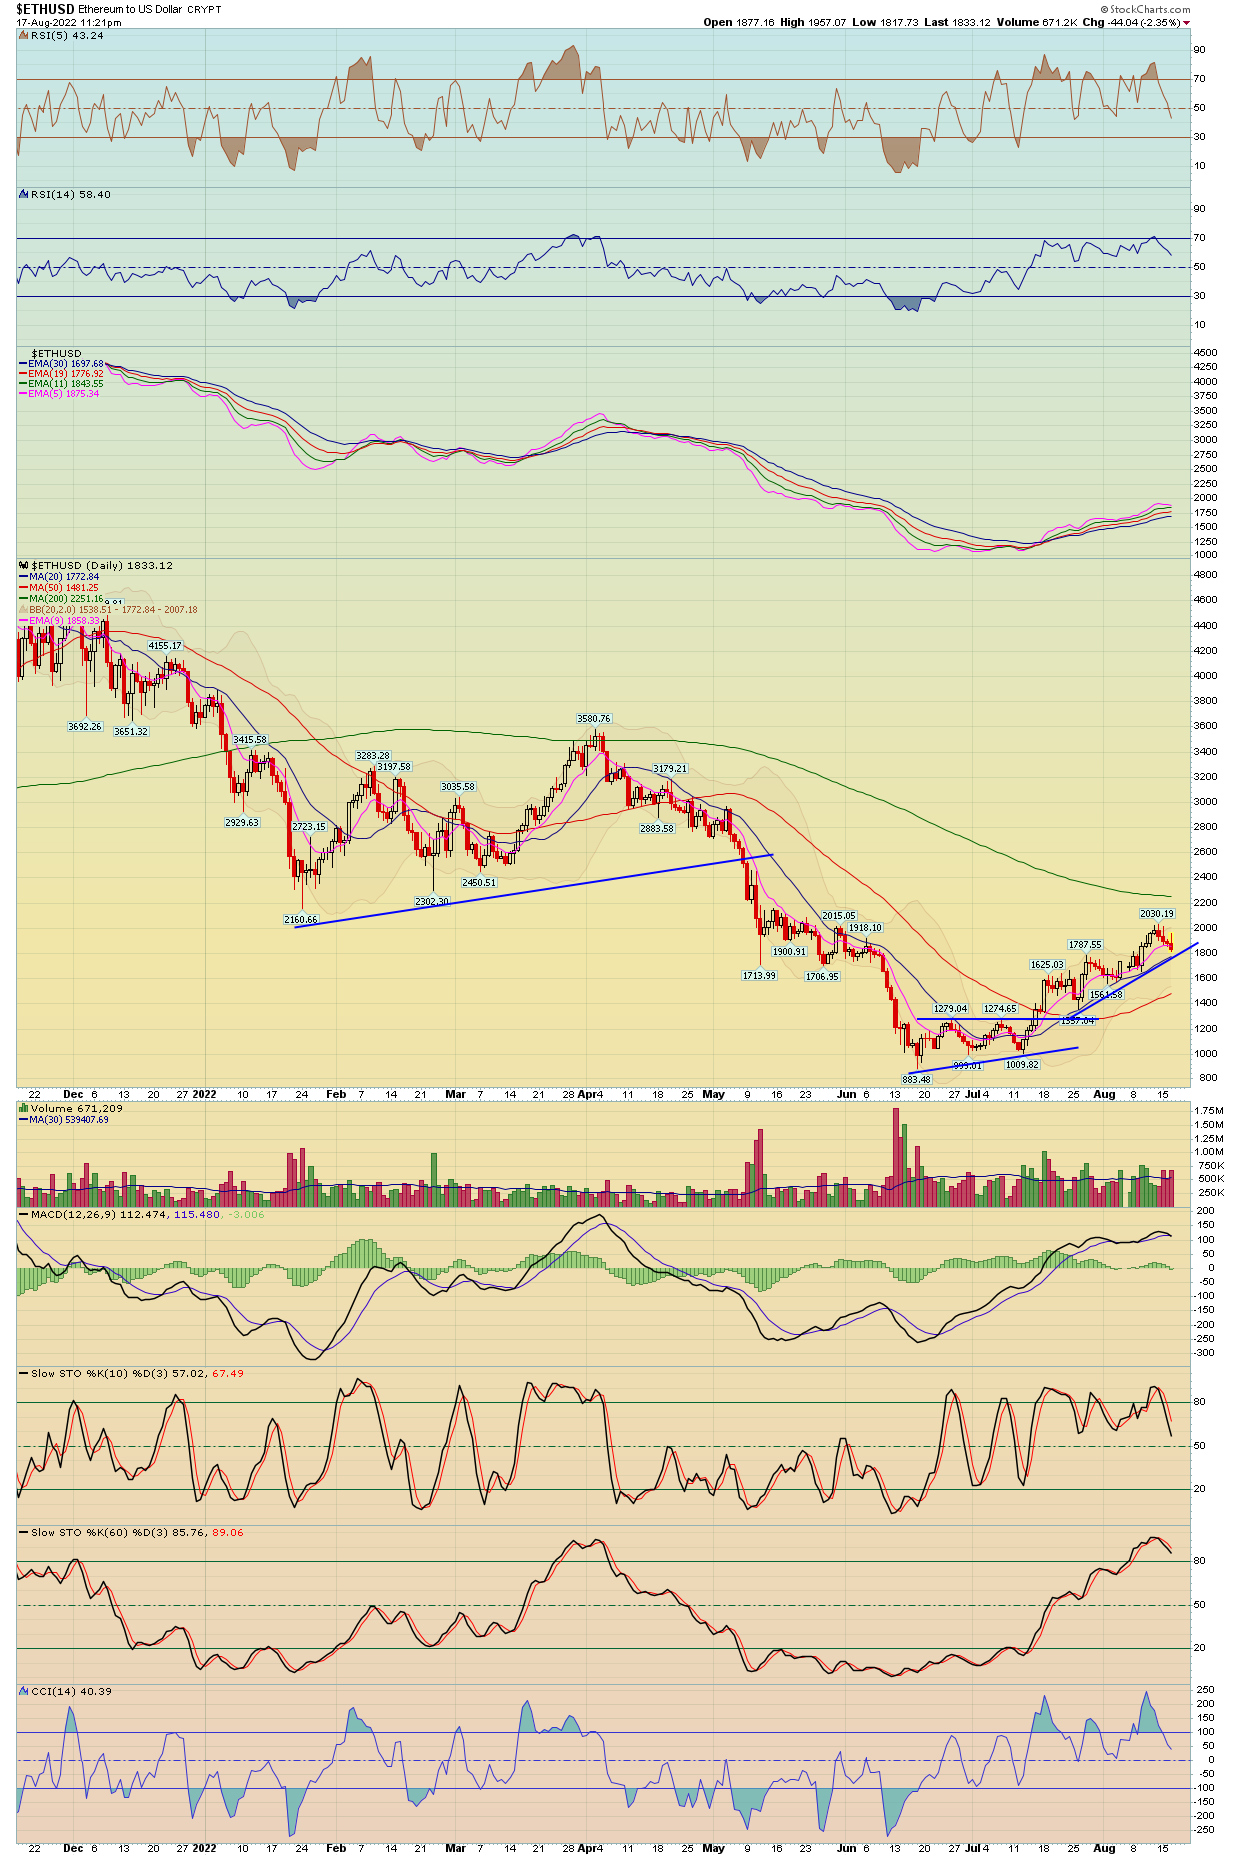
| Etherium | ETHUSD - W | -1.43% | -4.43% | 1,850.30 | |
| Monero | XMRUSD - W | 0.07% | 2.56% | 169.38 | |
| Litecoin | LTCUSD - W | -0.72% | -3.59% | 60.89 | |
| Ripple | XRPUSD - W | 1.43% | 1.81% | 0.38 |
| Commodities | Index Symbol | ETF Symbol | % G / L Day | % G / L Week | Close |
|---|---|---|---|---|---|
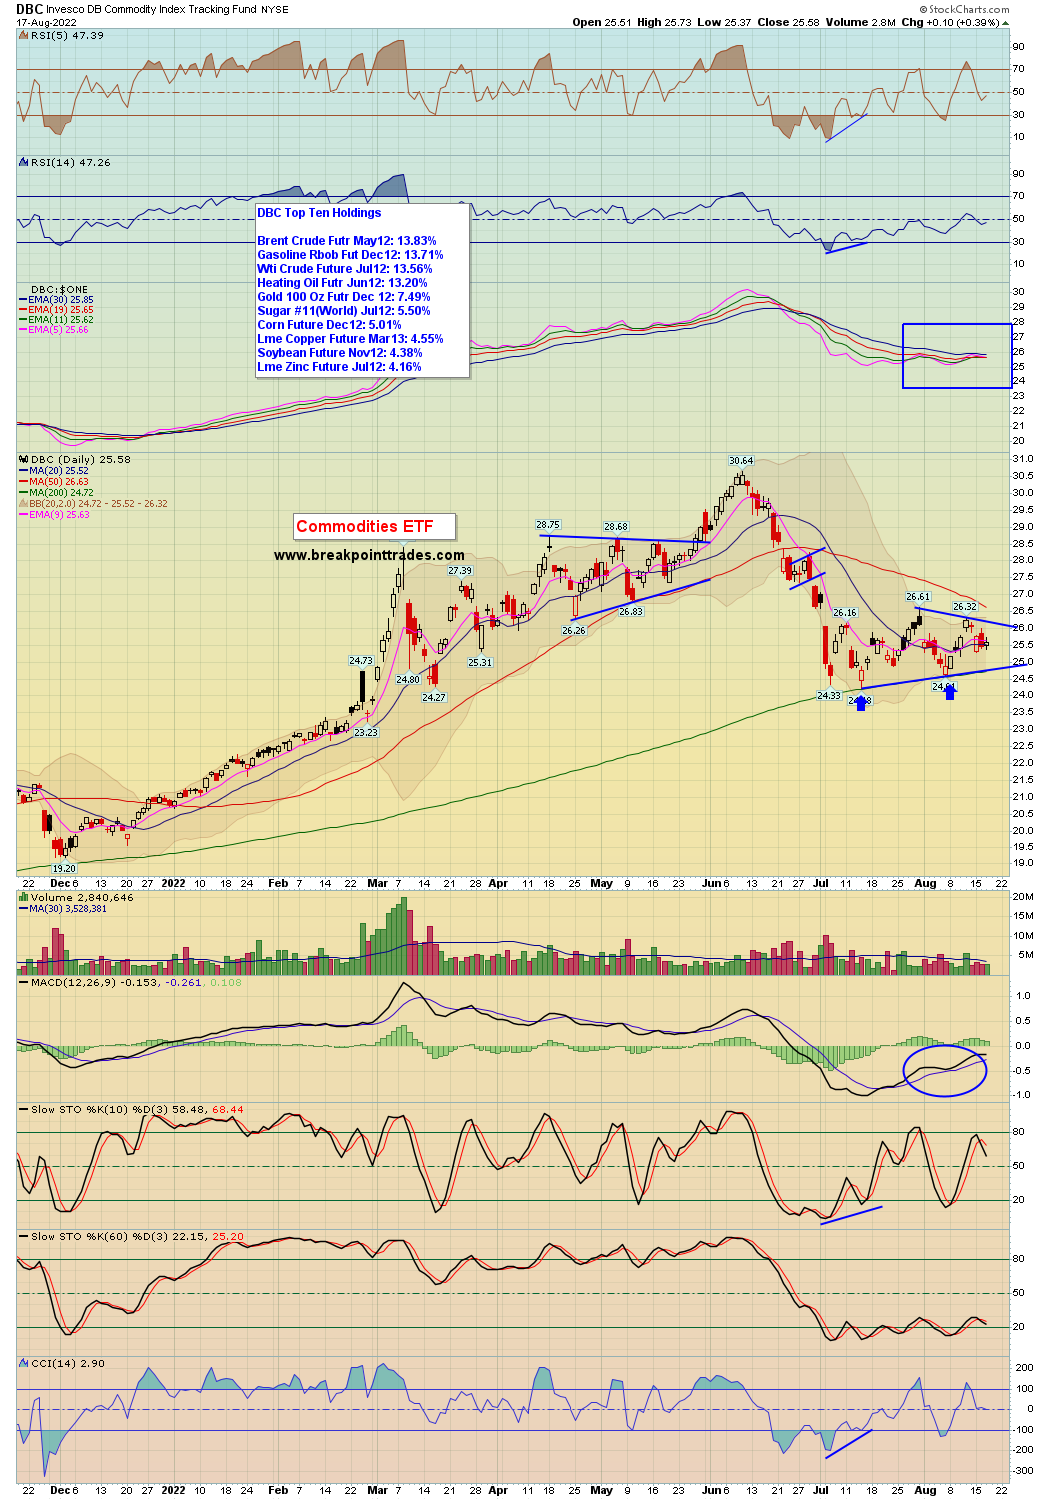
| Commodities | DBC - W | 0.39% | -1.95% | 25.58 | |
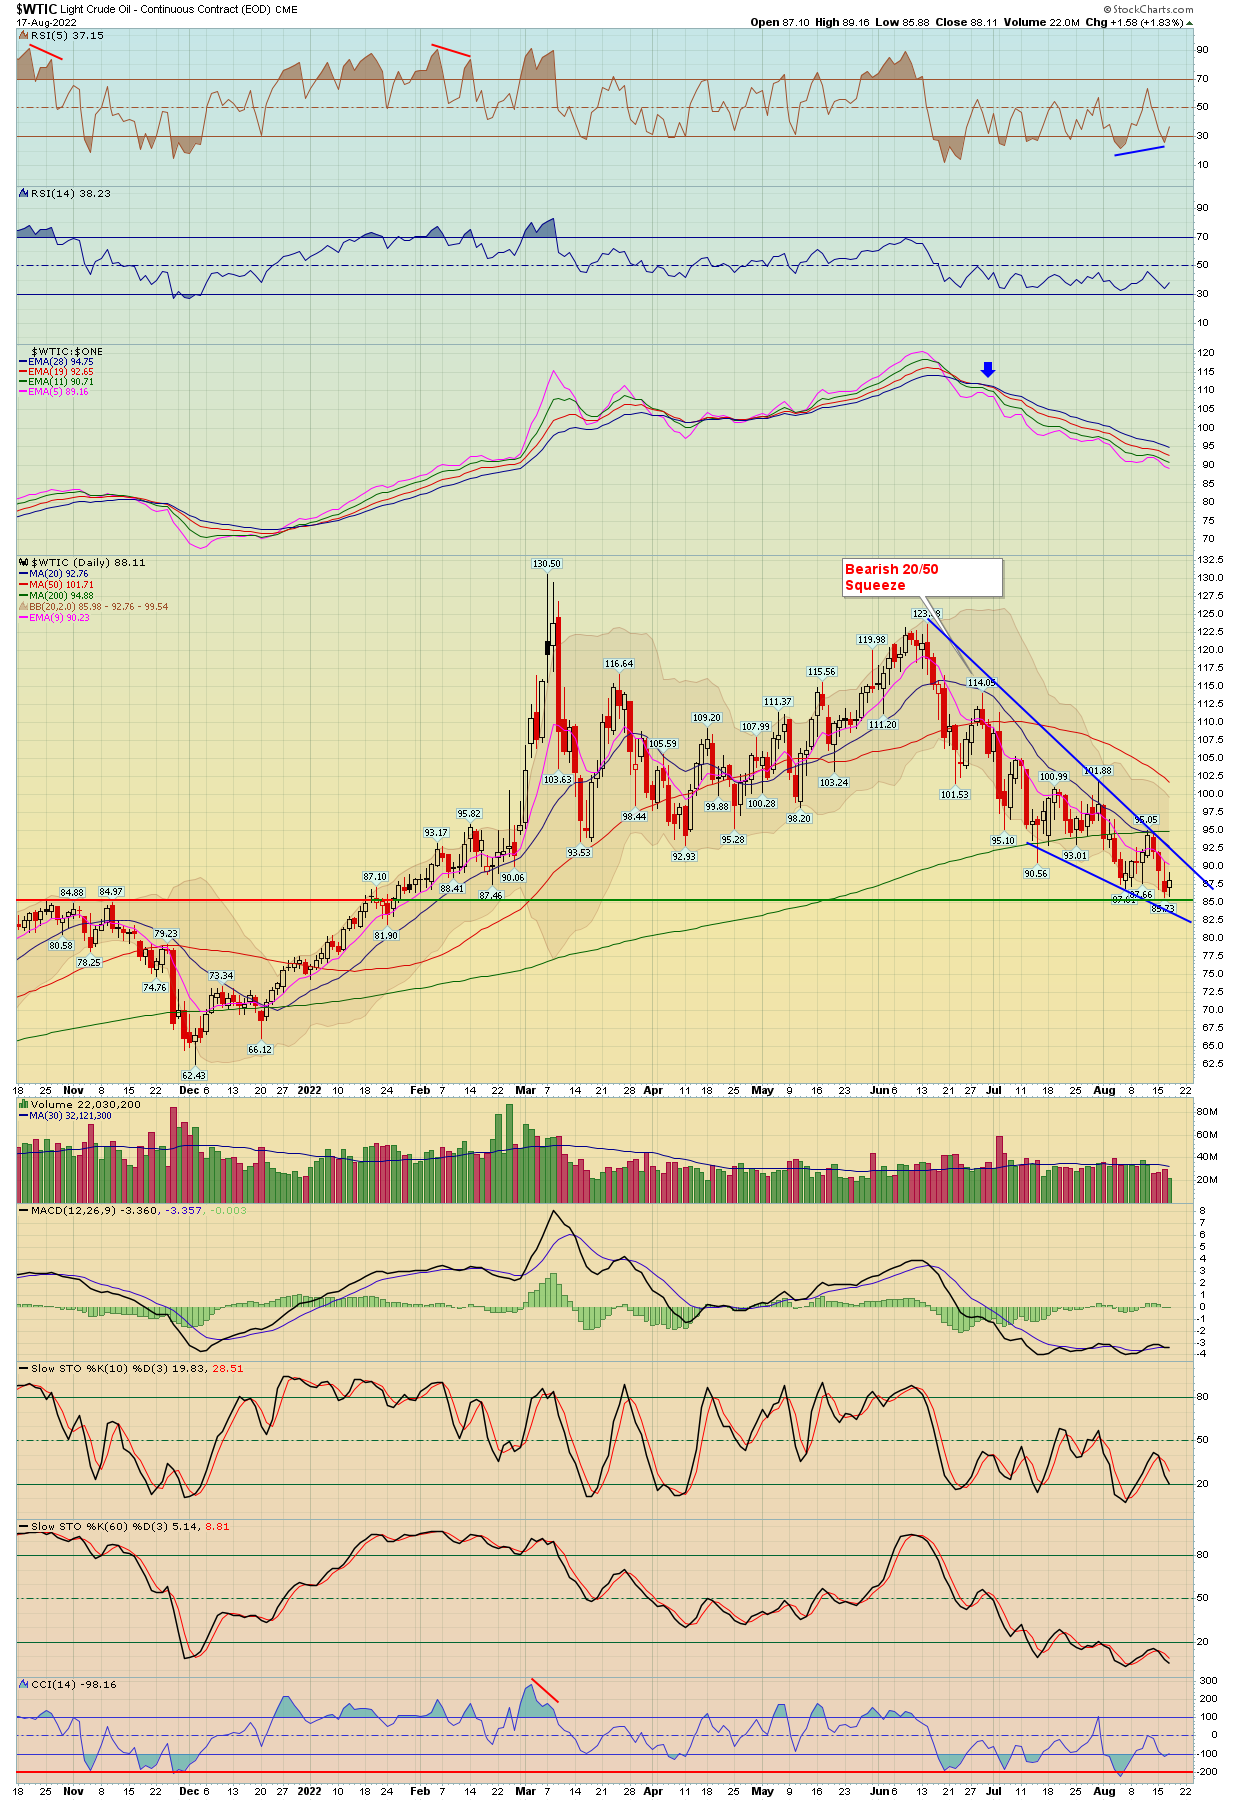
| Crude Oil | WTIC - W | USO - W | 1.83% | -4.32% | 88.11 |
| Gasoline | GASO - W | 1.93% | -2.52% | 2.71 | |
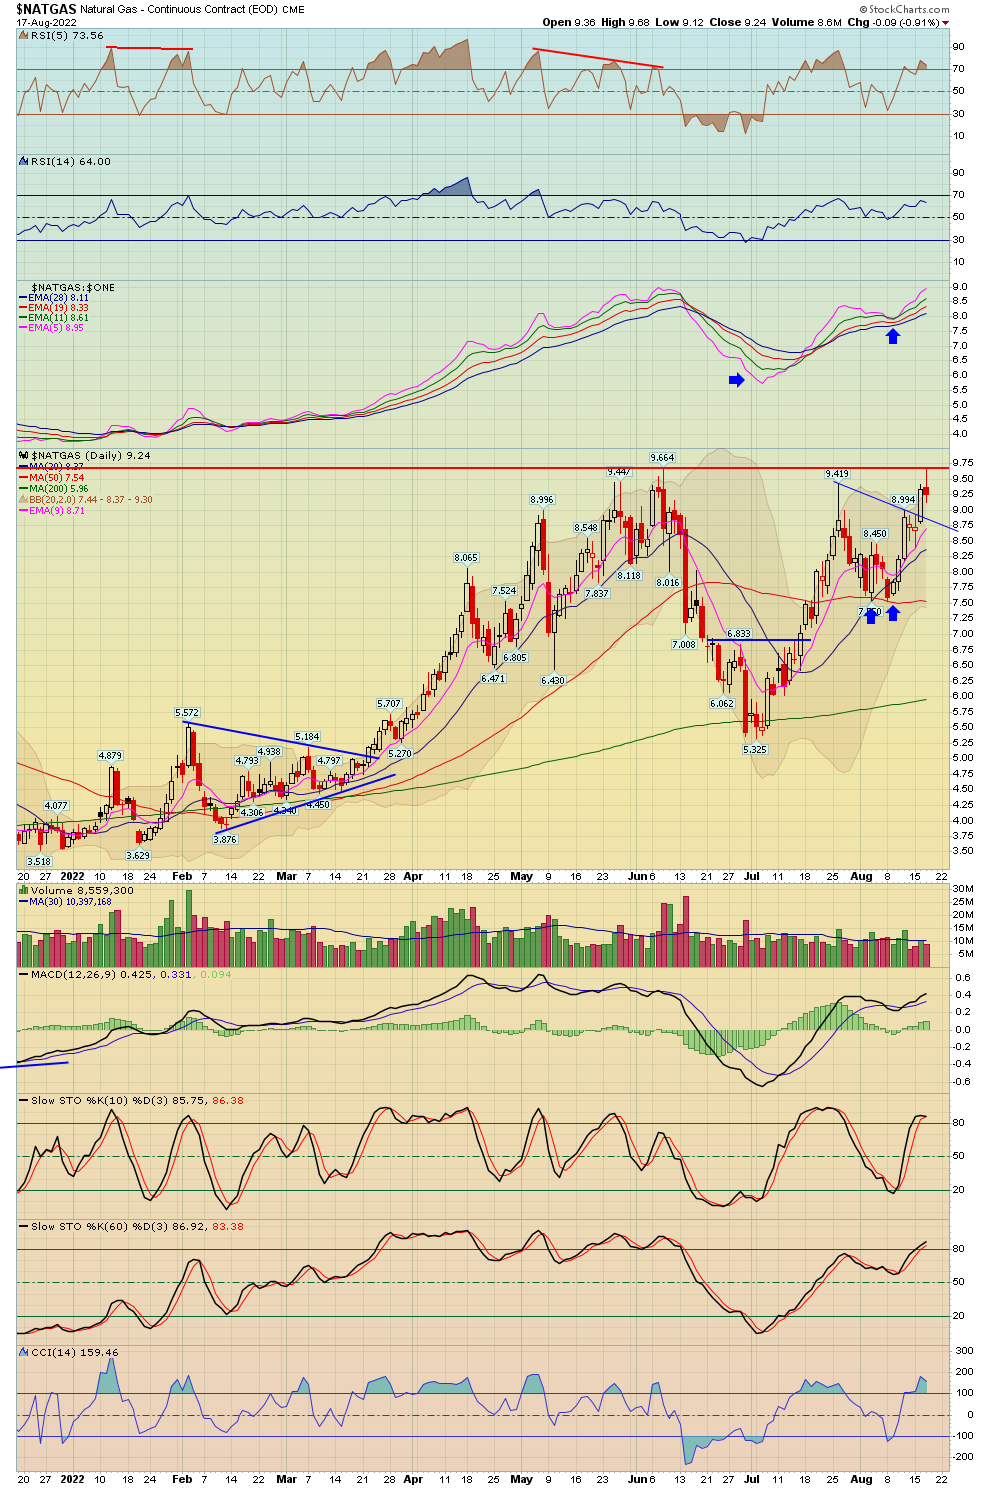
| Natural Gas | NATGAS - W | UNG - W | -0.91% | 5.43% | 9.24 |
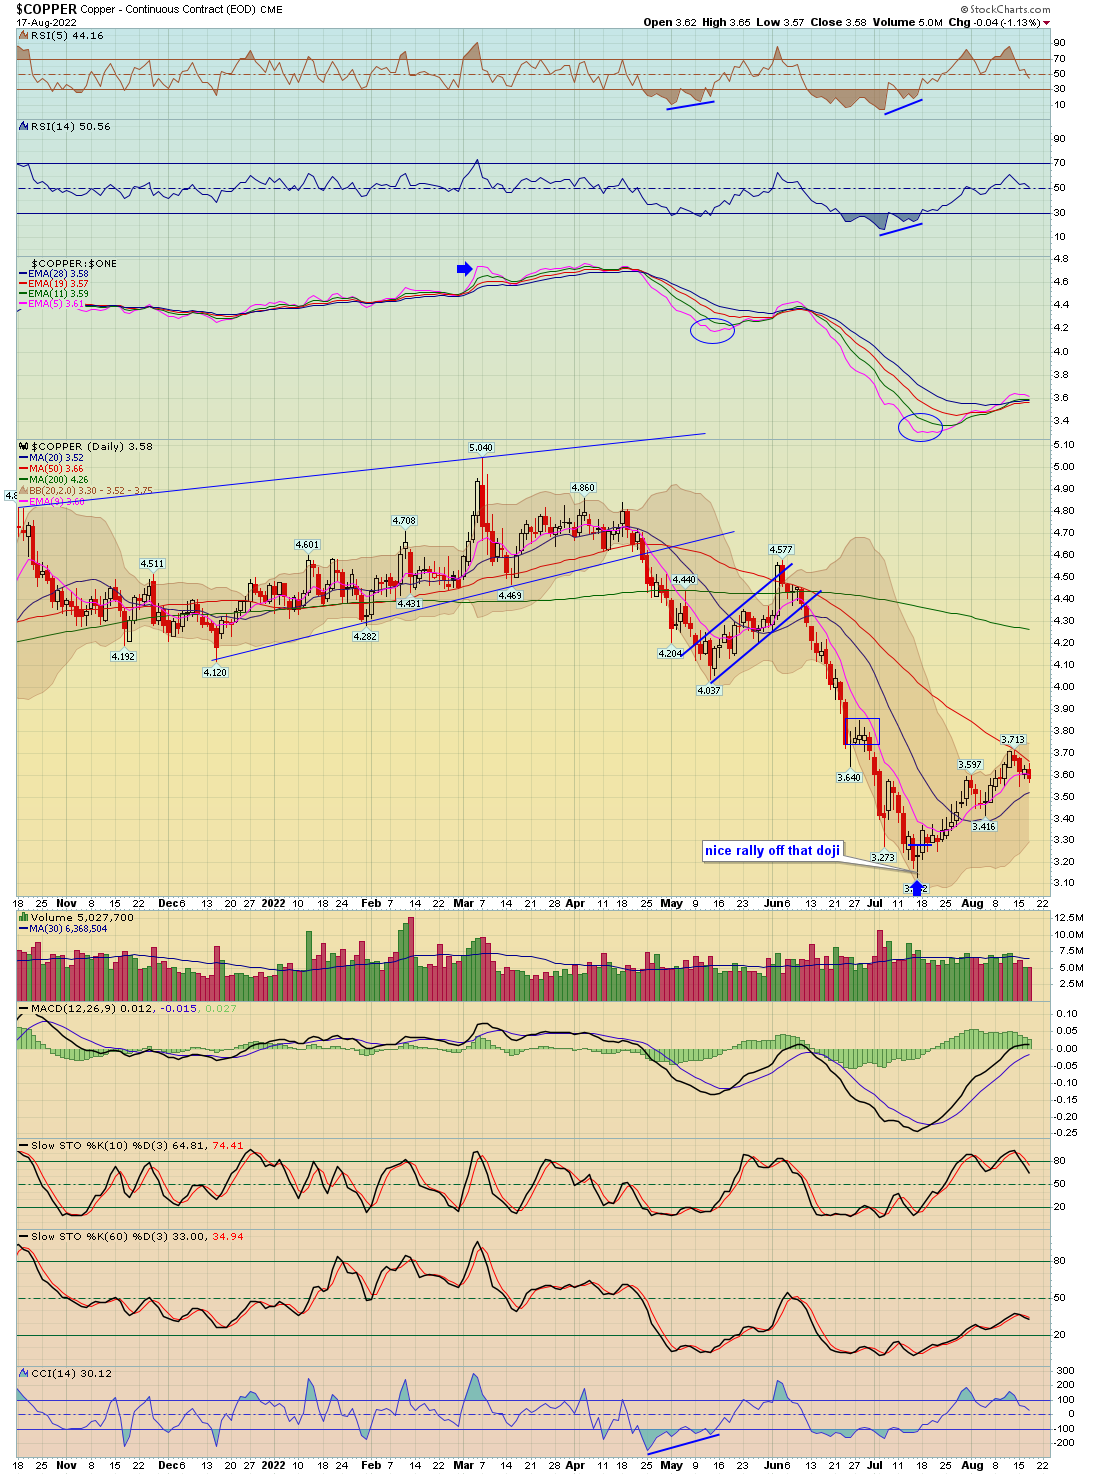
| Copper | COPPER - W | JJCB - W | -1.13% | -2.32% | 3.58 |
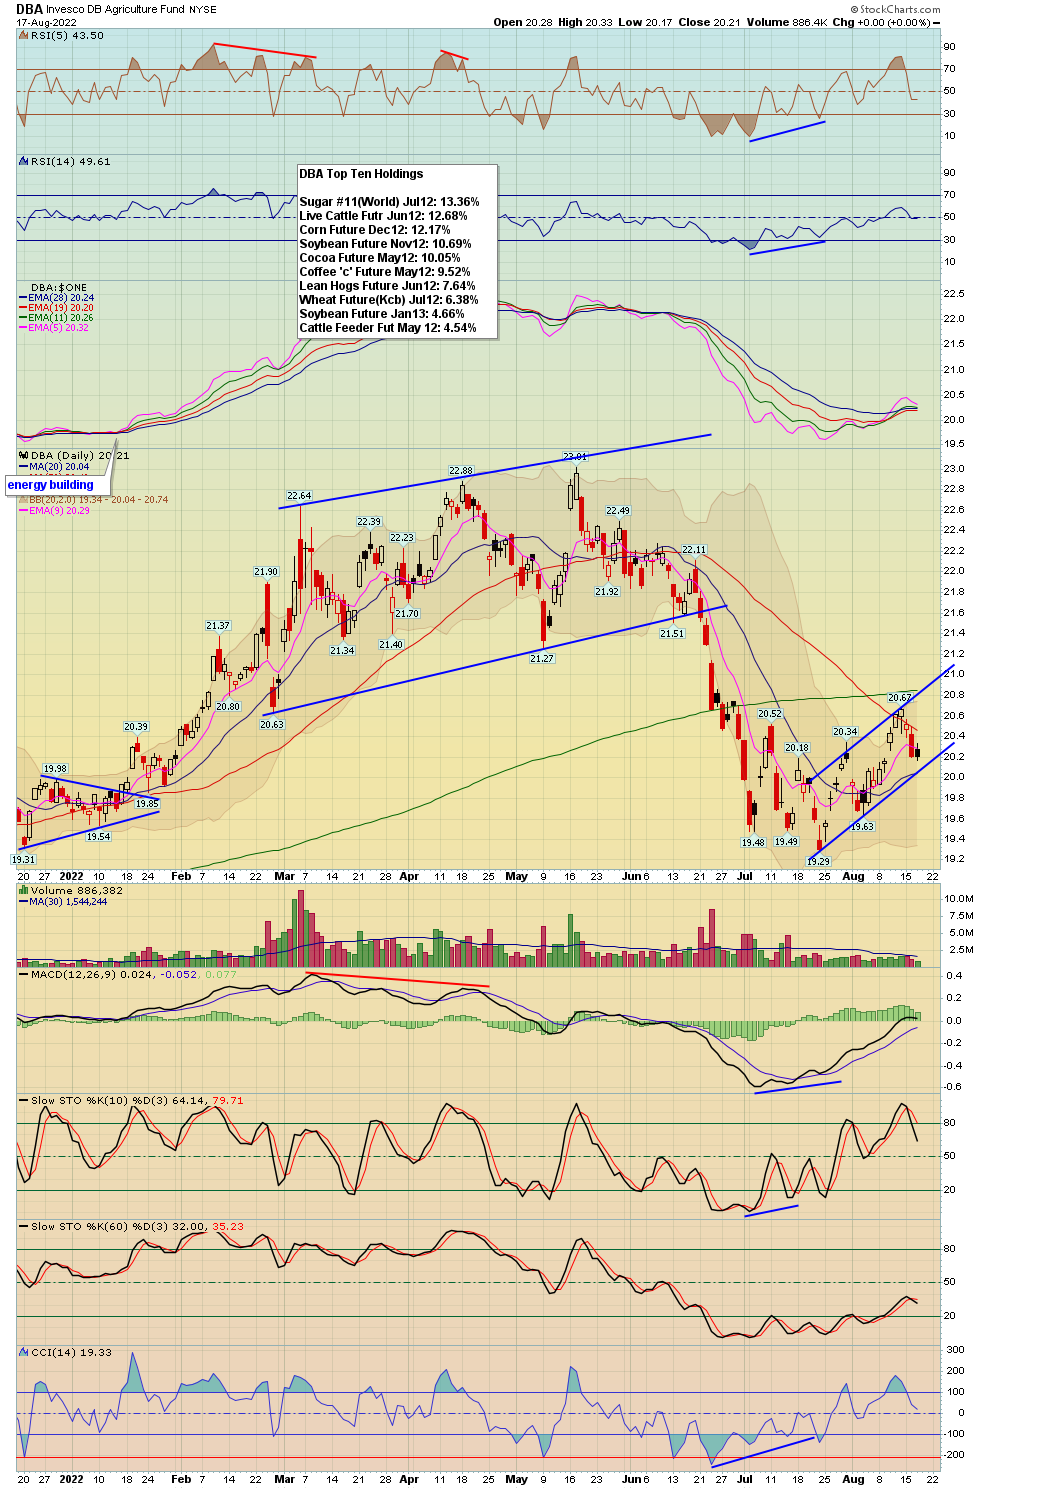
| Agriculture | DBA - W | 0.00% | -2.18% | 20.21 | |
| Corn | CORN - W | CORN - W | 0.29% | -4.71% | 612.00 |
| Wheat | WHEAT - W | WEAT - W | -2.77% | -3.16% | 780.50 |
| Coffee | JO - W | 0.12% | -3.54% | 59.70 | |
| Sugar | CANE - W | 0.00% | -2.40% | 8.95 |
| Precious Metals | Index Symbol | ETF Symbol | % G / L Day | % G / L Week | Close |
|---|---|---|---|---|---|
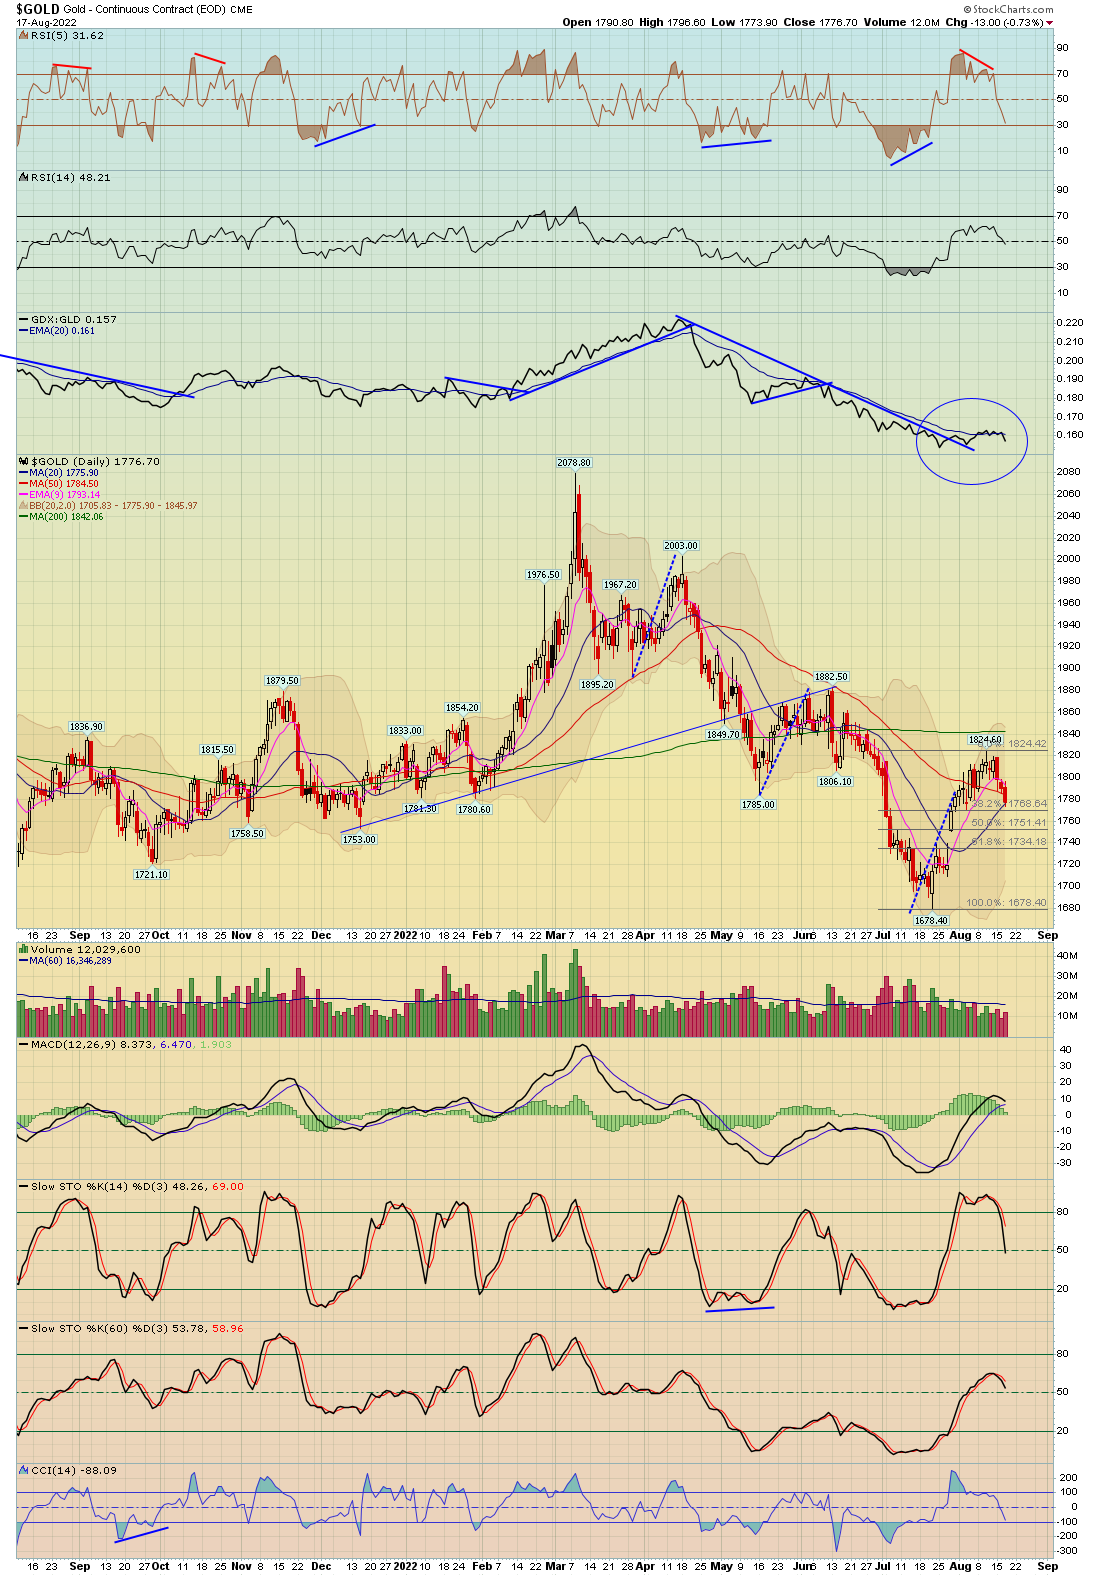
| Gold Metal | GLD - W | -0.65% | -2.10% | 164.35 | |
| Silver | SLV - W | -1.72% | -4.80% | 18.25 | |
| Platinum | PPLT - W | -1.26% | -3.84% | 85.86 | |
| Palladium | PALL - W | -0.37% | -3.16% | 198.76 | |
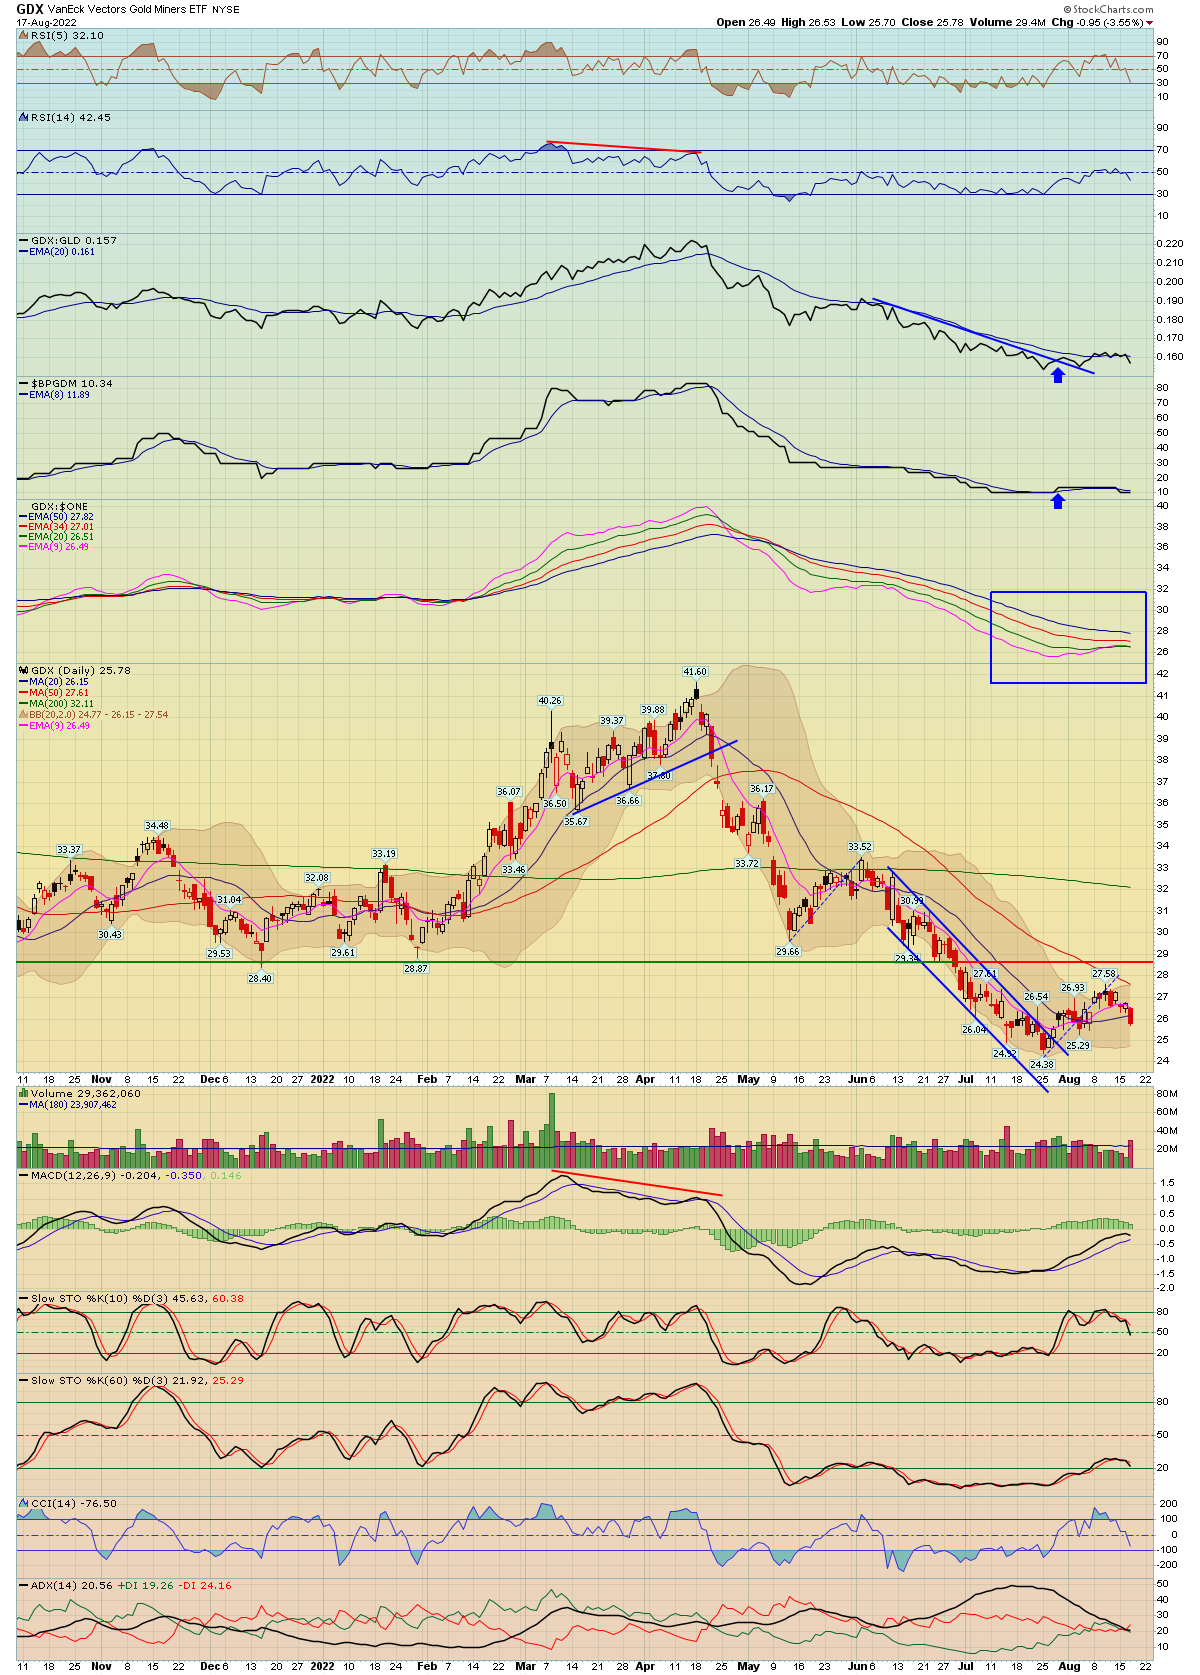
| GDX Gold Miners ETF | GDX - W | -3.55% | -5.29% | 25.78 |
| Bonds | Index Symbol | ETF Symbol | % G / L Day | % G / L Week | Close |
|---|---|---|---|---|---|
| High Yield Corporate Bond | HYG - W | -1.03% | -1.67% | 77.62 | |
| TLT 20 Year Bond ETF | TLT - W | -1.04% | -0.72% | 114.72 | |
| 10 Year Treasury Yield | TNX - W | 2.44% | 1.54% | 28.93 | |
| 30 Year Treasury Yield | TYX - W | 1.06% | 0.90% | 31.46 |
3
| Release | ET | For | Trading Impact | Forecast | Consensus | Prior |
|---|---|---|---|---|---|---|
| Aug 15 | ||||||
| Empire State Manufacturing | 08:30 | Aug | Low | 8.5 | 5.0 | 11.1 |
| NAHB Housing Market Index | 10:00 | Aug | Medium | 56 | 55 | 55 |
| TIC Net Long-Term Transactions | 16:00 | Jun | Low | NA | NA | $155.3B |
| Aug 16 | ||||||
| Housing Starts | 08:30 | Jul | High | 1550K | 1543K | 1599K |
| Building Permits | 08:30 | Jul | High | 1630K | 1647K | 1696K |
| Industrial Production | 09:15 | Jul | Medium | 0.5% | 0.3% | 0.0% |
| Capacity Utilization | 09:15 | Jul | Medium | 80.4% | 80.2% | 79.9% |
| Aug 17 | ||||||
| MBA Mortgage Applications Index | 07:00 | 08/13 | Low | NA | NA | 0.2% |
| Retail Sales | 08:30 | Jul | High | 0.1% | 0.2% | 0.8% |
| Retail Sales ex-auto | 08:30 | Jul | High | 0.2% | 0.1% | 0.9% |
| Business Inventories | 10:00 | Jun | Low | 1.5% | 1.5% | 1.4% |
| EIA Crude Oil Inventories | 10:30 | 08/13 | High | NA | NA | +5.45M |
| FOMC Minutes | 14:00 | July 26-27 | High | NA | NA | NA |
| Aug 18 | ||||||
| Initial Claims | 08:30 | 08/13 | High | 265K | 266K | 262K |
| Continuing Claims | 08:30 | 08/06 | High | NA | NA | 1428K |
| Philadelphia Fed Index | 08:30 | Aug | Low | -6.0 | -4.0 | -12.3 |
| Existing Home Sales | 10:00 | Jul | High | 4.91M | 4.85M | 5.12M |
| Leading Economic Index | 10:00 | Jul | Low | NA | NA | -0.8% |
| EIA Natural Gas Inventories | 10:30 | 08/13 | Low | NA | NA | +44 bcf |
Stock Earnings Calender:
Click here for a list of Stocks that are reporting Earnings
**Generally we never hold a position into earnings since the risk/reward is too great
4
5
6
7
8
9 - View Live Chart
10 - View Live Chart
11 - View Live Chart
12 - View Live Chart
13 - View Live Chart
14 - View Live Chart
15 - View Live Chart
16 - View Live Chart
17 - View Live Chart
18 - View Live Chart
19 - View Live Chart
20 - View Live Chart
21 - View Live Chart
22 - View Live Chart
23
24
25 - View Live Chart
26 - View Live Chart
27 - View Live Chart
28 - View Live Chart
29 - View Live Chart
30 - View Live Chart
31 - View Live Chart
32 - View Live Chart
33 - View Live Chart
34 - View Live Chart
35 - View Live Chart
36 - View Live Chart
37 - View Live Chart
38 - View Live Chart
39 - View Live Chart
40 - View Live Chart
41 - View Live Chart
42 - View Live Chart
43 - View Live Chart
44 - View Live Chart
45 - View Live Chart
46 - View Live Chart
47 - View Live Chart
48 - View Live Chart
49 - View Live Chart
50 - View Live Chart
51 - View Live Chart
52 - View Live Chart
53 - View Live Chart
54 - View Live Chart
55 - View Live Chart
56 - View Live Chart
57 - View Live Chart
58 - View Live Chart
59 - View Live Chart
- Hide Player Link to Newsletter Audio
- Hide Player Link to Newsletter Audio