BPT Weekend Newsletter for Sunday February 6th, 2022 - free
Disclaimer: Intraday Chart Links will show up as daily charts unless you have an active stockcharts.com membership and are signed in, you can sign up here.
1
Table of Contents:
1. Glance at last Week Stats, Upcoming Economic Table, Earnings Release Dates
2. Review of the Major Indexes/Indicators
3. Examine All Sector Charts
4. Commodities (Crude Oil, Natural Gas, Copper, DBA)
5. Overview of Bonds via TLT/JNK
6. Currencies (US Dollar, Euro) and Bitcoin
7. Precious Metals (Gold/Silver) and GDX/GDXJ
2
| Major Indexes | Index Symbol | ETF Symbol | % G / L Day | % G / L Week | Close |
|---|---|---|---|---|---|
| Dow Jones | INDU - W | DIA - W | -0.06% | 1.05% | 35,089.74 |
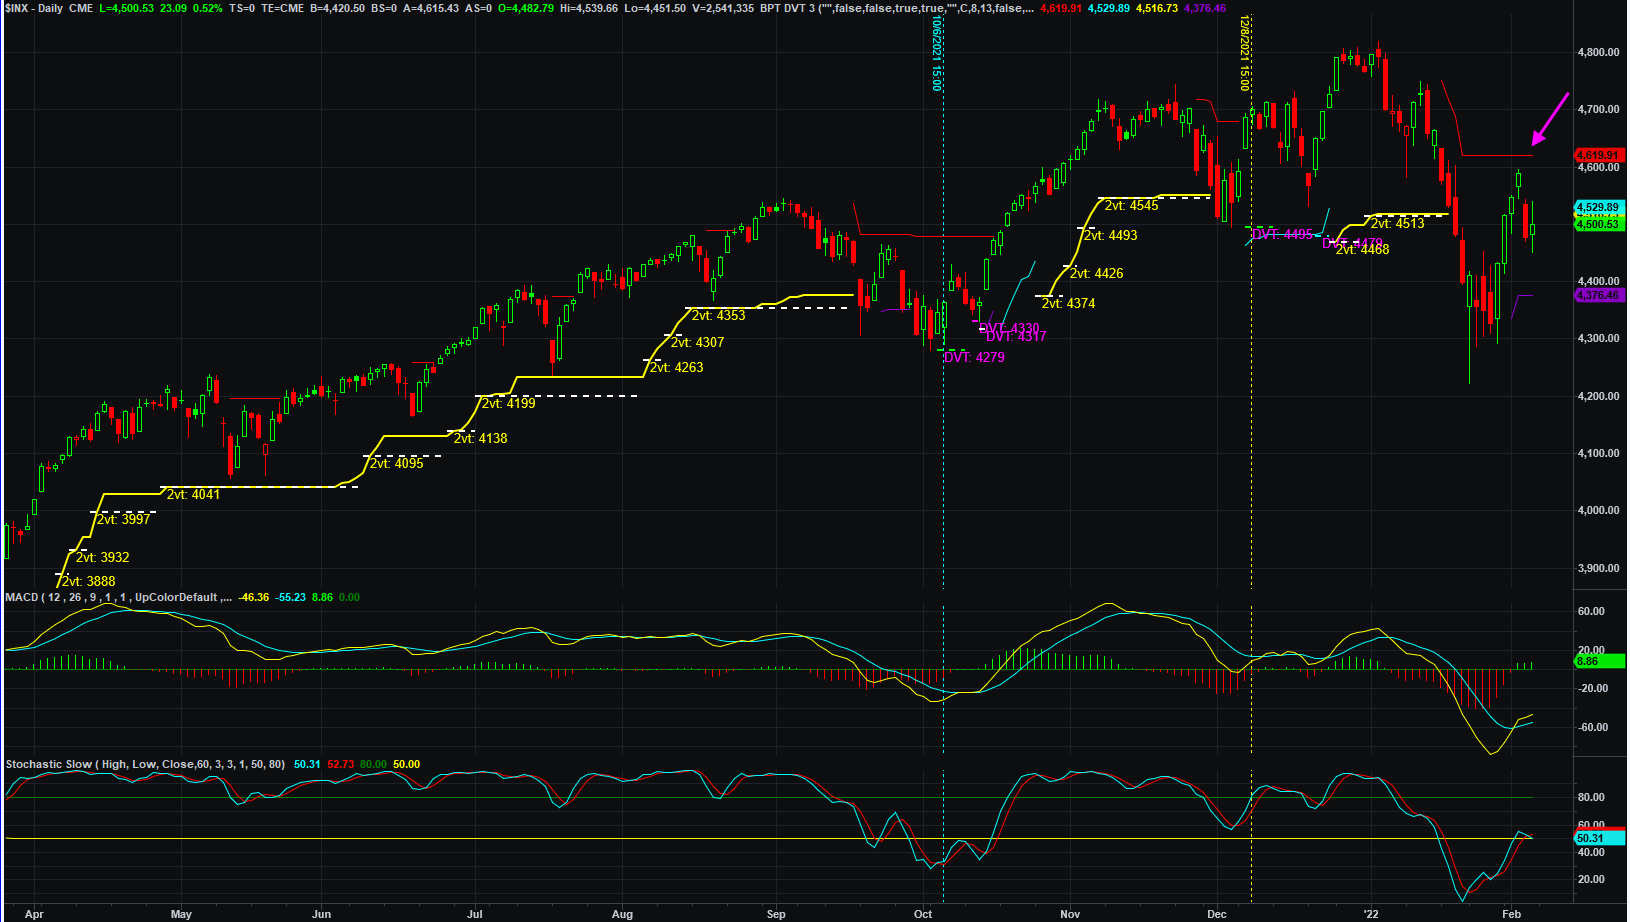
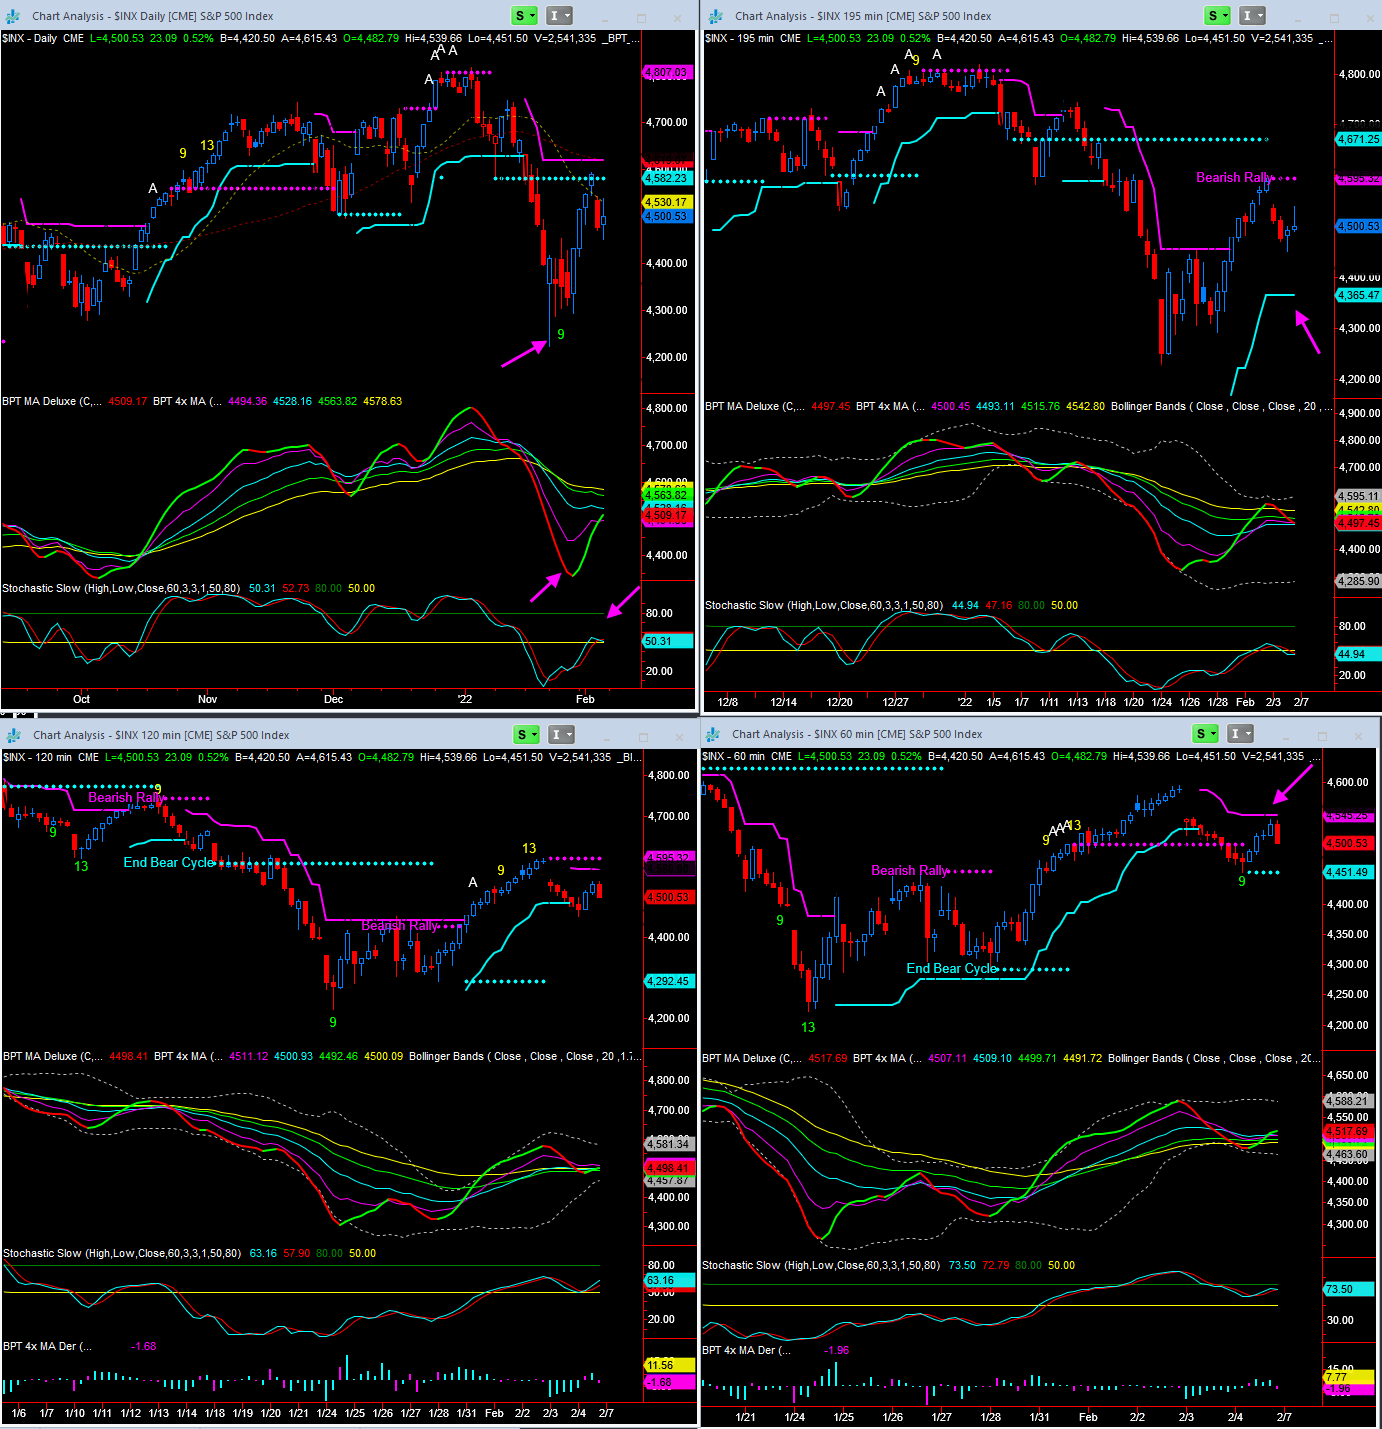
| S&P 500 | SPX - W | SPY - W | 0.52% | 1.55% | 4,500.53 |
| Wilshire 5000 | WLSH - W | 0.80% | 1.90% | 45,244.28 | |
| Nasdaq | COMPQ - W | 1.58% | 2.38% | 14,098.01 | |
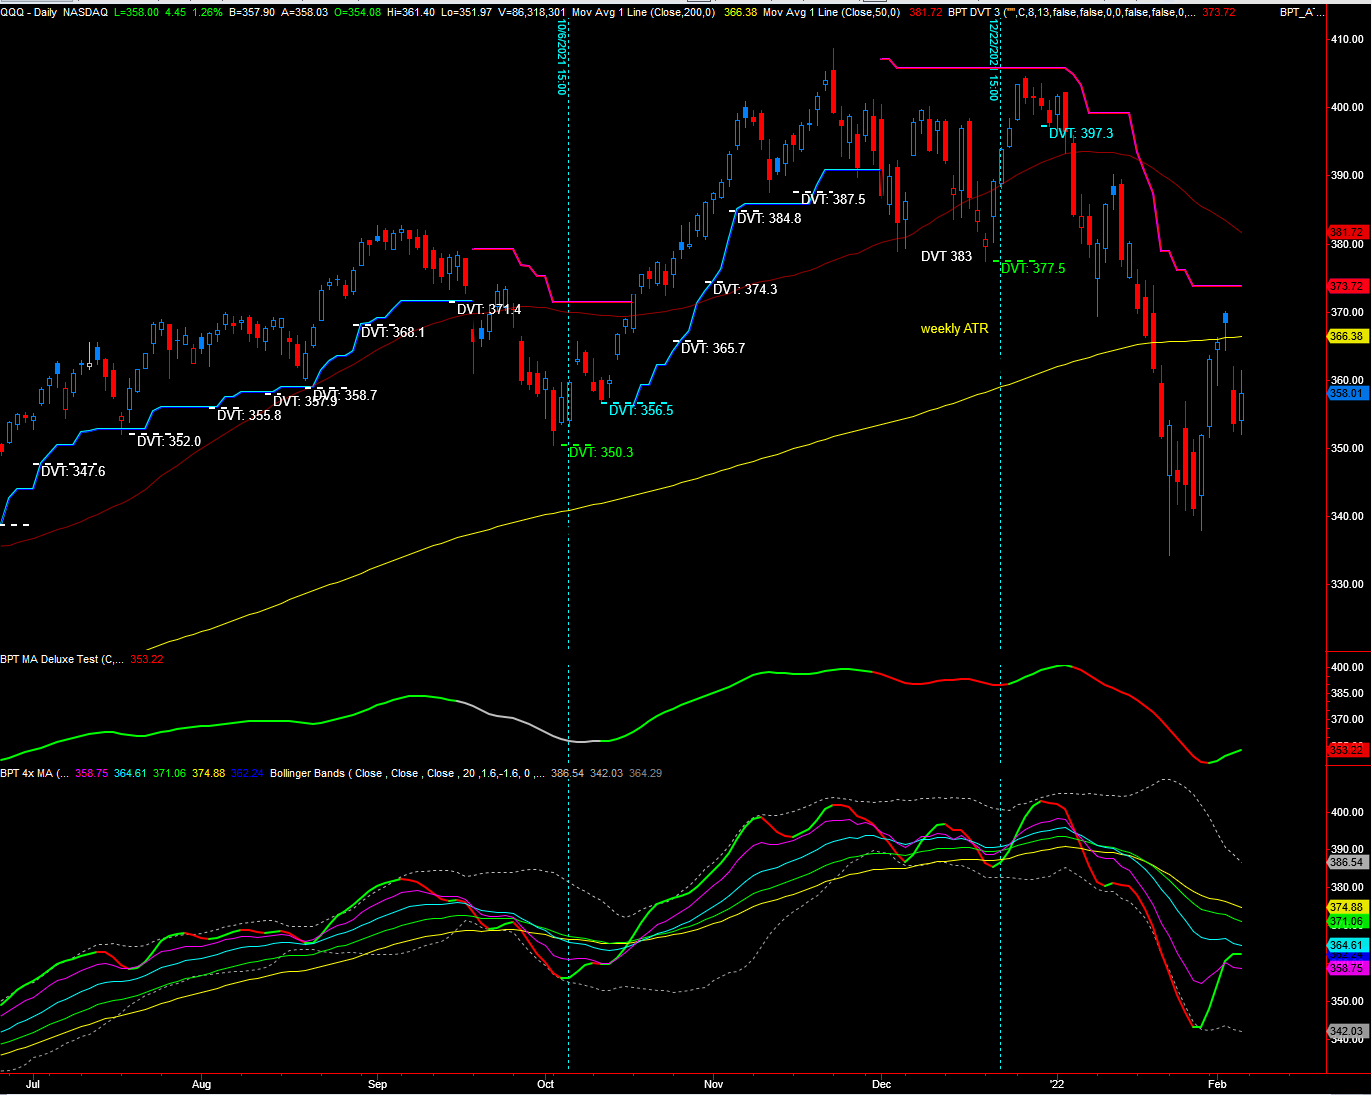
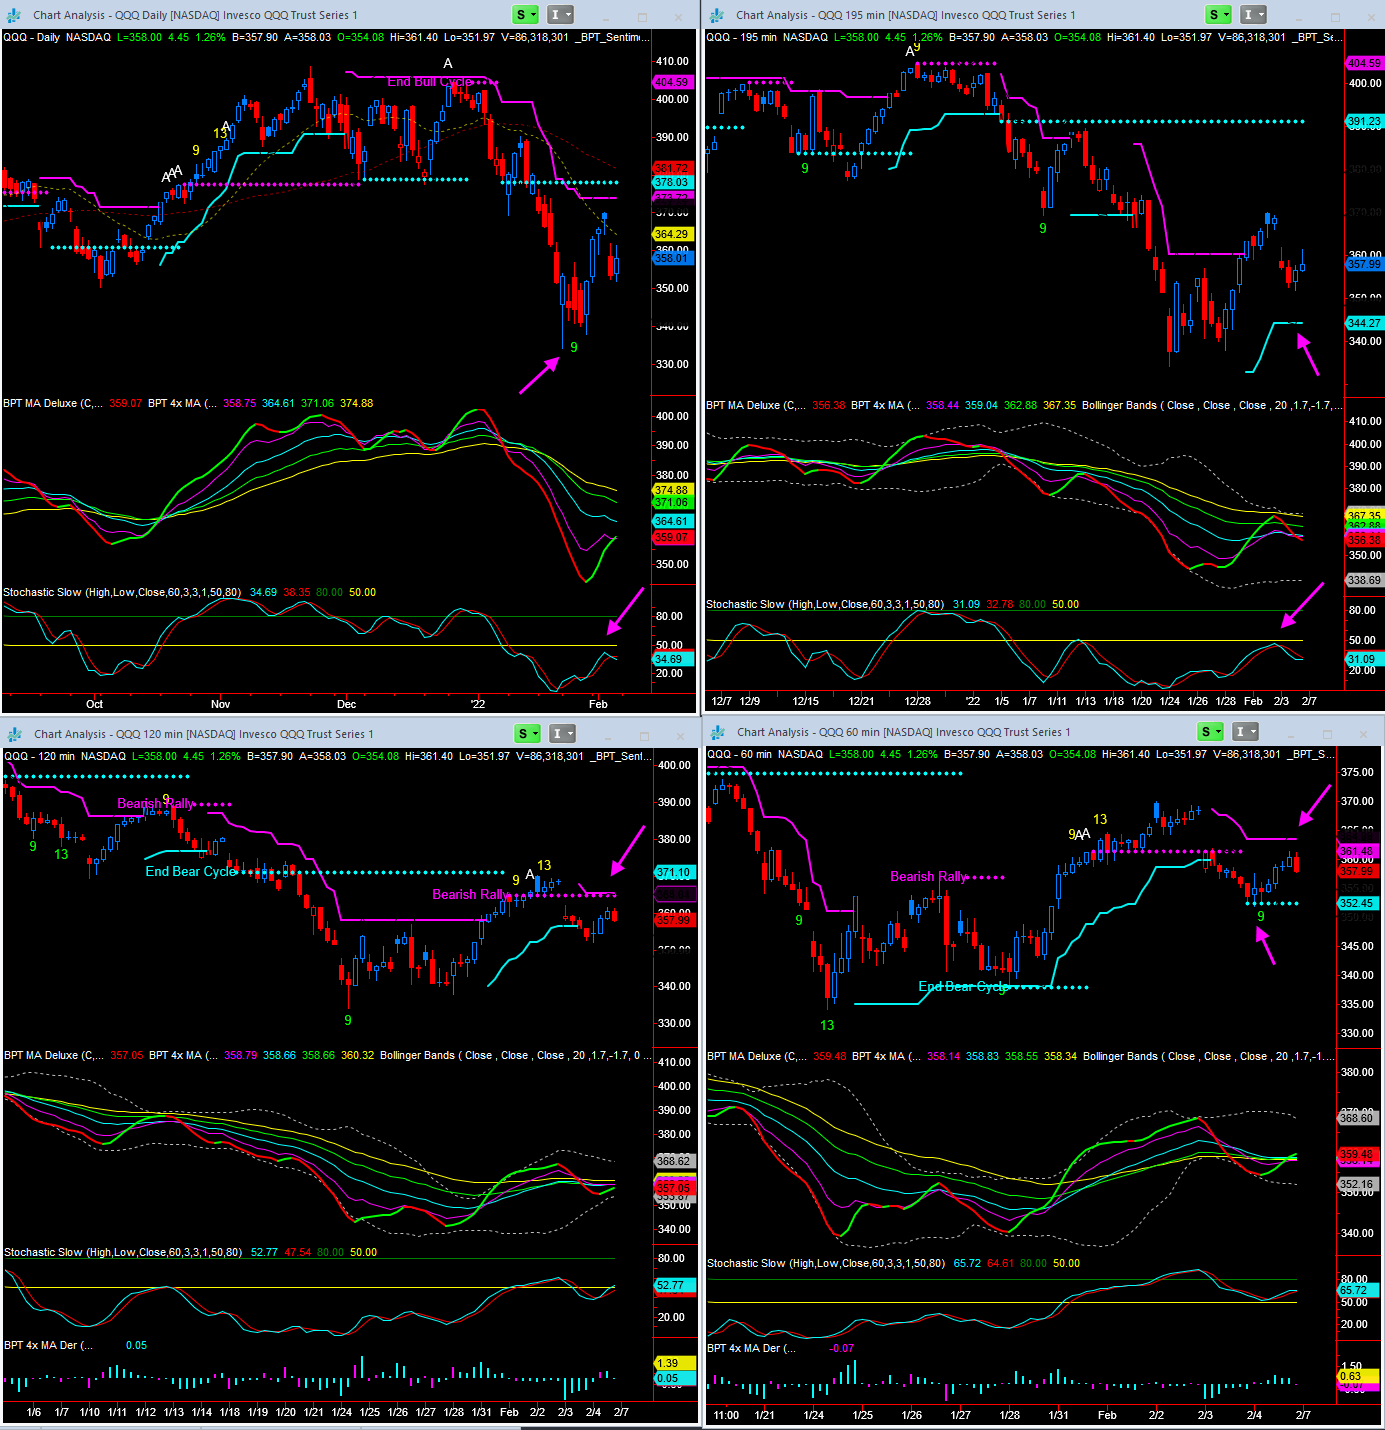
| NDX 100 | NDX - W | QQQ - W | 1.33% | 1.66% | 14,694.35 |
| Russel 2000 (Small Caps) | IWM - W | 0.43% | 1.60% | 198.38 |
| Market Sectors | Index Symbol | ETF Symbol | % G / L Day | % G / L Week | Close |
|---|---|---|---|---|---|
| Transports | TRAN - W | IYT - W | -1.65% | 1.10% | 15,214.31 |
| Banks | BKX - W | 2.00% | 4.19% | 140.05 | |
| Financials | XLF - W | 1.70% | 3.56% | 40.10 | |
| Brokers | XBD - W | 2.41% | 5.68% | 494.63 | |
| XLE (Energy Select) | XLE - W | 1.56% | 4.98% | 68.90 | |
| Oil Service Holders | OIH - W | 2.04% | 3.10% | 234.40 | |
| Technology | XLK - W | 0.40% | 1.01% | 159.60 | |
| Semiconductor | SOX - W | SMH - W | 0.60% | 4.53% | 3,453.07 |
| Communication Services | XLC - W | 0.25% | -1.58% | 71.17 | |
| Retail | XRT - W | 0.22% | -0.11% | 78.49 | |
| Consumer Staples | XLP - W | -1.22% | 0.28% | 75.89 | |
| Consumer Discretionary | XLY - W | 2.84% | 3.54% | 184.40 | |
| Industrials | XLI - W | -1.08% | 0.41% | 100.11 | |
| Real Estate | IYR - W | -0.92% | 0.14% | 105.13 | |
| Homebuilders | HGX - W | XHB - W | -3.44% | -2.57% | 445.23 |
| Materials | XLB - W | -1.66% | -0.12% | 83.12 | |
| Metals And Mining | XME - W | 1.00% | 6.99% | 44.26 | |
| Biotechnology | BTK - W | XBI - W | 1.02% | 2.69% | 5,083.63 |
| Healthcare | XLV - W | -0.36% | 1.39% | 132.30 | |
| Drugs | DRG - W | -0.79% | -0.24% | 795.10 | |
| Utilities | UTIL - W | XLU - W | -0.88% | 0.12% | 942.19 |
| Currencies | Index Symbol | ETF Symbol | % G / L Day | % G / L Week | Close |
|---|---|---|---|---|---|
| US Dollar | UUP - W | -0.08% | -1.92% | 25.55 | |
| Euro | XEU - W | FXE - W | 0.09% | 2.69% | 114.49 |
| Yen | XJY - W | FXY - W | -0.24% | -0.02% | 86.77 |
| Australian | XAD - W | FXA - W | -0.92% | 1.19% | 70.74 |
| British Pound | XBP - W | FXB - W | -0.49% | 0.99% | 135.32 |
| Chinese Yuan | CYB - W | -0.36% | -0.11% | 26.81 | |
| Canadian Dollar | CDW - W | FXC - W | -0.58% | 0.13% | 78.40 |
| Swiss Franc | XSF - W | FXF - W | -0.59% | 0.76% | 108.04 |
| Cryptocurrencies | Index Symbol | ETF Symbol | % G / L Day | % G / L Week | Close |
|---|---|---|---|---|---|
| Bitcoin | BTCUSD - W | 0.18% | 9.91% | 41,665.93 | |
| Bitcoin Cash | BCHUSD - W | 4.95% | 10.81% | 321.43 | |
| Etherium | ETHUSD - W | 0.88% | 16.15% | 3,023.66 | |
| Monero | XMRUSD - W | 2.72% | 14.89% | 169.86 | |
| Litecoin | LTCUSD - W | 0.83% | 12.64% | 122.37 | |
| Ripple | XRPUSD - W | 1.89% | 11.02% | 0.67 |
| Commodities | Index Symbol | ETF Symbol | % G / L Day | % G / L Week | Close |
|---|---|---|---|---|---|
| Commodities | DBC - W | 0.79% | 2.19% | 22.83 | |
| Crude Oil | WTIC - W | USO - W | 2.26% | 6.32% | 92.31 |
| Gasoline | GASO - W | 1.35% | 5.54% | 2.68 | |
| Natural Gas | NATGAS - W | UNG - W | -6.46% | -1.44% | 4.57 |
| Copper | COPPER - W | JJCB - W | 0.37% | 4.12% | 4.49 |
| Agriculture | DBA - W | 0.68% | 2.03% | 20.59 | |
| Corn | CORN - W | CORN - W | 0.61% | -2.44% | 620.50 |
| Wheat | WHEAT - W | WEAT - W | 1.53% | -2.93% | 763.25 |
| Coffee | JO - W | -0.18% | 2.42% | 65.99 | |
| Sugar | CANE - W | 0.57% | -1.22% | 8.87 |
| Precious Metals | Index Symbol | ETF Symbol | % G / L Day | % G / L Week | Close |
|---|---|---|---|---|---|
| Gold Metal | GLD - W | 0.15% | 1.05% | 168.86 | |
| Silver | SLV - W | 0.39% | 0.39% | 20.79 | |
| Platinum | PPLT - W | -0.71% | 1.72% | 95.59 | |
| Palladium | PALL - W | -1.24% | -3.48% | 213.02 | |
| GDX Gold Miners ETF | GDX - W | 0.50% | 3.75% | 30.40 |
| Bonds | Index Symbol | ETF Symbol | % G / L Day | % G / L Week | Close |
|---|---|---|---|---|---|
| High Yield Corporate Bond | HYG - W | -0.39% | -0.72% | 83.77 | |
| TLT 20 Year Bond ETF | TLT - W | -1.47% | -2.74% | 139.01 | |
| 10 Year Treasury Yield | TNX - W | 5.64% | 8.31% | 19.30 | |
| 30 Year Treasury Yield | TYX - W | 4.10% | 7.20% | 22.33 |
3
| Release | ET | For | Trading Impact | Forecast | Consensus | Prior |
|---|---|---|---|---|---|---|
| Feb 07 | ||||||
| Consumer Credit | 15:00 | Dec | Low | $22.0B | $25.0B | $39.9B |
| Feb 08 | ||||||
| Trade Balance | 08:30 | Dec | Low | -$82.5B | -$79.6B | -$80.2B |
| Feb 09 | ||||||
| MBA Mortgage Applications Index | 07:00 | 02/05 | Low | NA | NA | 12.0% |
| Wholesale Inventories | 10:00 | Dec | Low | 2.0% | 2.0% | 1.4% |
| EIA Crude Oil Inventories | 10:30 | 02/05 | High | NA | NA | -1.05M |
| Feb 10 | ||||||
| Initial Claims | 08:30 | 02/05 | High | 228K | 234K | 238K |
| Continuing Claims | 08:30 | 01/29 | High | NA | NA | 1.628M |
| CPI | 08:30 | Jan | High | 0.5% | 0.5% | 0.5% |
| Core CPI | 08:30 | Jan | High | 0.5% | 0.5% | 0.6% |
| EIA Natural Gas Inventories | 10:30 | 02/05 | Low | NA | NA | -268 bcf |
| Treasury Budget | 14:00 | Jan | Low | NA | NA | -$21.3B |
| Feb 11 | ||||||
| Univ. of Michigan Consumer Sentiment - Prelim | 10:00 | Feb | High | 67.0 | 67.5 | 67.2 |
Stock Earnings Calender:
Click here for a list of Stocks that are reporting Earnings
**Generally we never hold a position into earnings since the risk/reward is too great
4 - View Live Chart

5 - View Live Chart

6 - View Live Chart

7 - View Live Chart

8 - View Live Chart

9 - View Live Chart

10 - View Live Chart

11 - View Live Chart

12 - View Live Chart

13
14
15 - View Live Chart

16 - View Live Chart

17 - View Live Chart

18 - View Live Chart

19 - View Live Chart

20 - View Live Chart

21 - View Live Chart

22 - View Live Chart

23 - View Live Chart

24
25
26 - View Live Chart

27 - View Live Chart

28 - View Live Chart

29 - View Live Chart

30 - View Live Chart

31 - View Live Chart

32 - View Live Chart

33 - View Live Chart

34 - View Live Chart

35 - View Live Chart

36 - View Live Chart

37 - View Live Chart

38 - View Live Chart

39 - View Live Chart

40 - View Live Chart

41 - View Live Chart

42 - View Live Chart

43 - View Live Chart

44 - View Live Chart

45 - View Live Chart

46 - View Live Chart

47 - View Live Chart

48 - View Live Chart

49 - View Live Chart

50 - View Live Chart

51 - View Live Chart

52 - View Live Chart

53 - View Live Chart

54 - View Live Chart

55 - View Live Chart

56 - View Live Chart

57 - View Live Chart

58 - View Live Chart

59 - View Live Chart

60 - View Live Chart

61 - View Live Chart

62 - View Live Chart

63 - View Live Chart

64 - View Live Chart

65 - View Live Chart

66 - View Live Chart

67 - View Live Chart

68 - View Live Chart

69 - View Live Chart

70 - View Live Chart

71 - View Live Chart

72 - View Live Chart

73 - View Live Chart

74 - View Live Chart

75 - View Live Chart

76 - View Live Chart

77 - View Live Chart

78 - View Live Chart

79 - View Live Chart

80 - View Live Chart

81 - View Live Chart

82 - View Live Chart

83 - View Live Chart

84 - View Live Chart

- Hide Player Link to Newsletter Audio
Update Required
To play the media you will need to either update your browser to a recent version or update your Flash plugin.
- Hide Player Link to Newsletter Audio
Update Required
To play the media you will need to either update your browser to a recent version or update your Flash plugin.