Monday January 10th, 2022 Newsletter - free
Disclaimer: Intraday Chart Links will show up as daily charts unless you have an active stockcharts.com membership and are signed in, you can sign up here.
1
Table of Contents:
SPY systems update
1. General Market Analysis: SPX and Other Major Indices
2. Indicators and Bonds (TLT/JNK)
3. Major Sectors
4. US Dollar, Commodities, Precious Metals and GDX
5. Trade Ideas
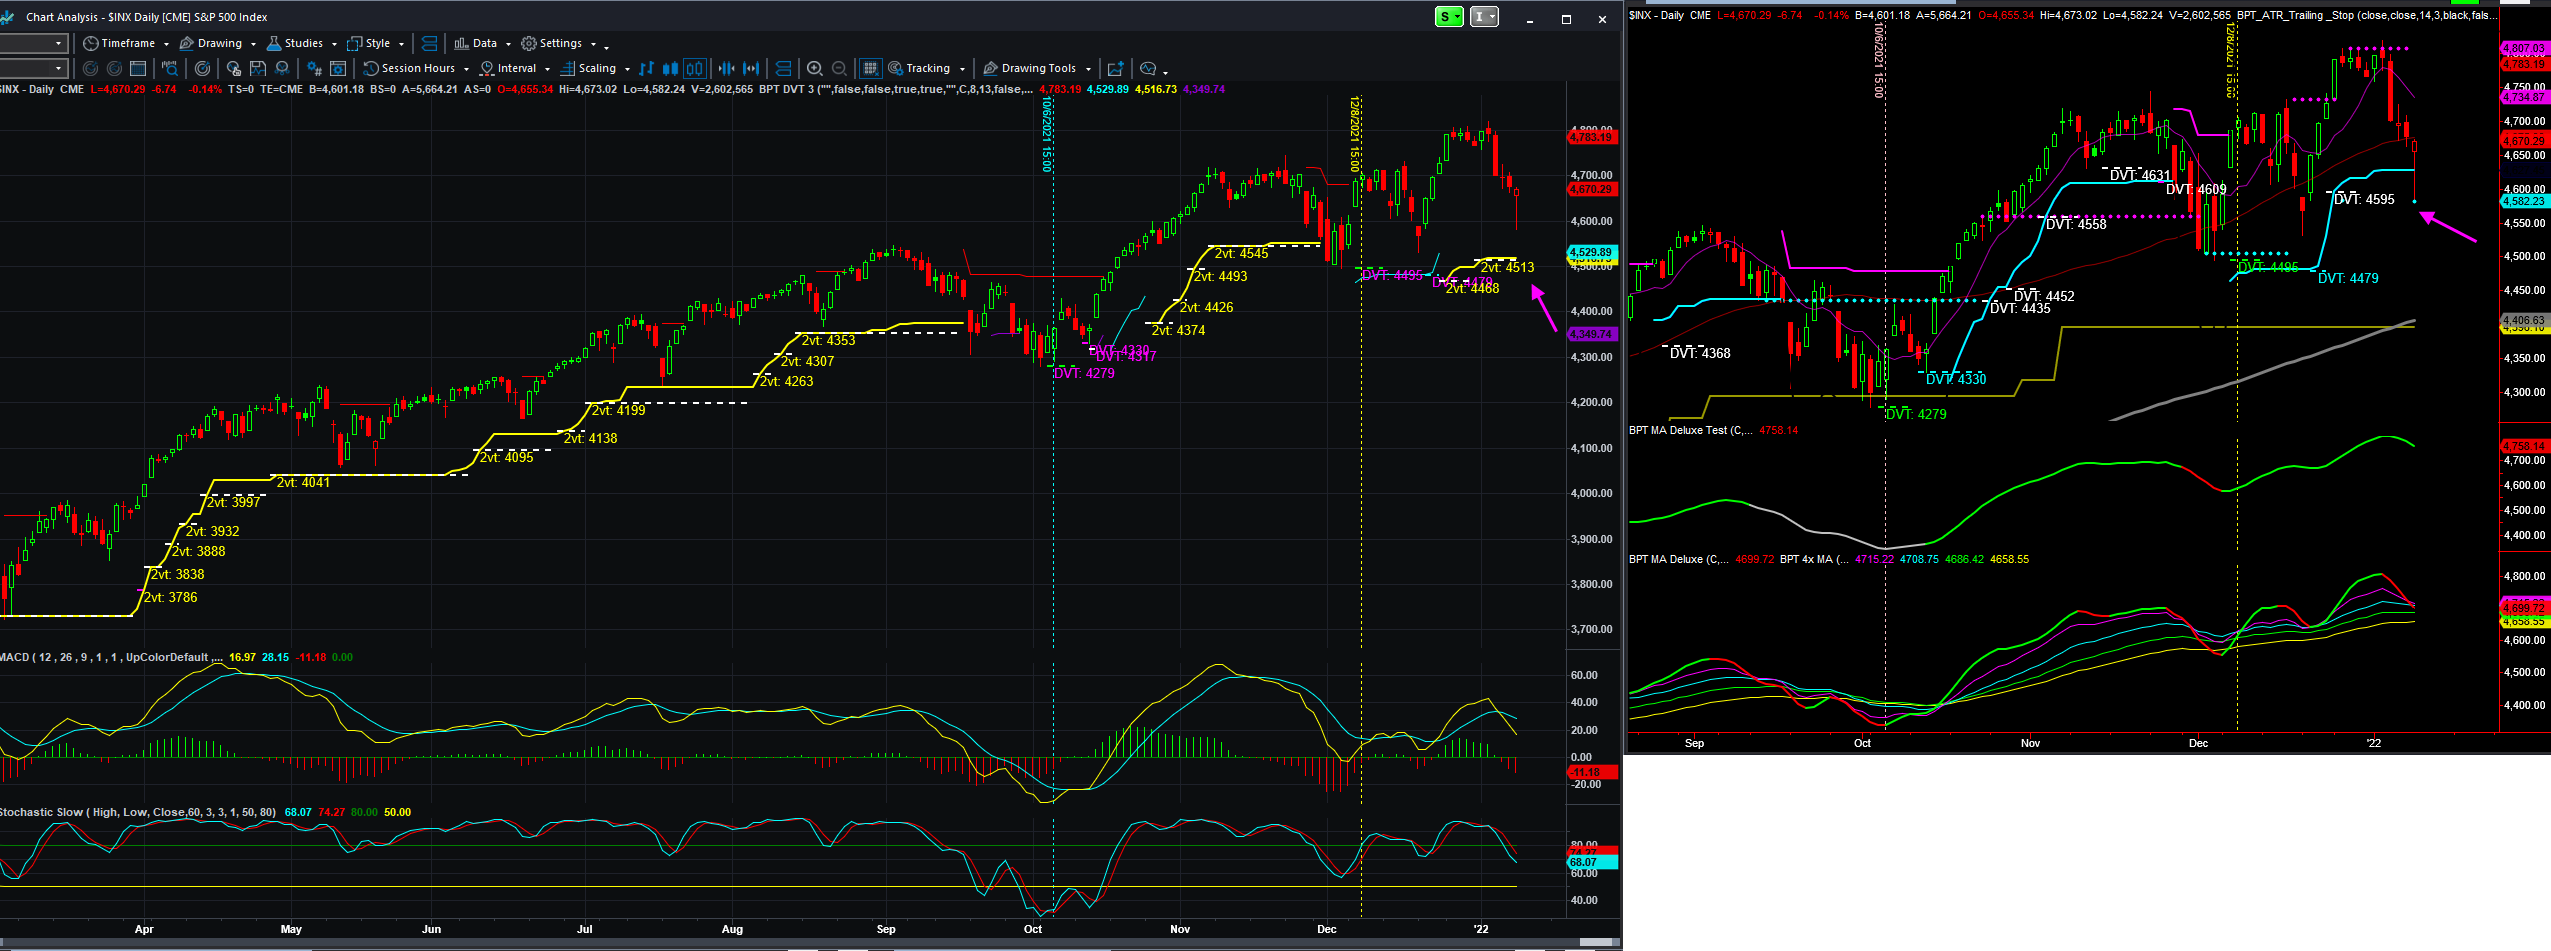
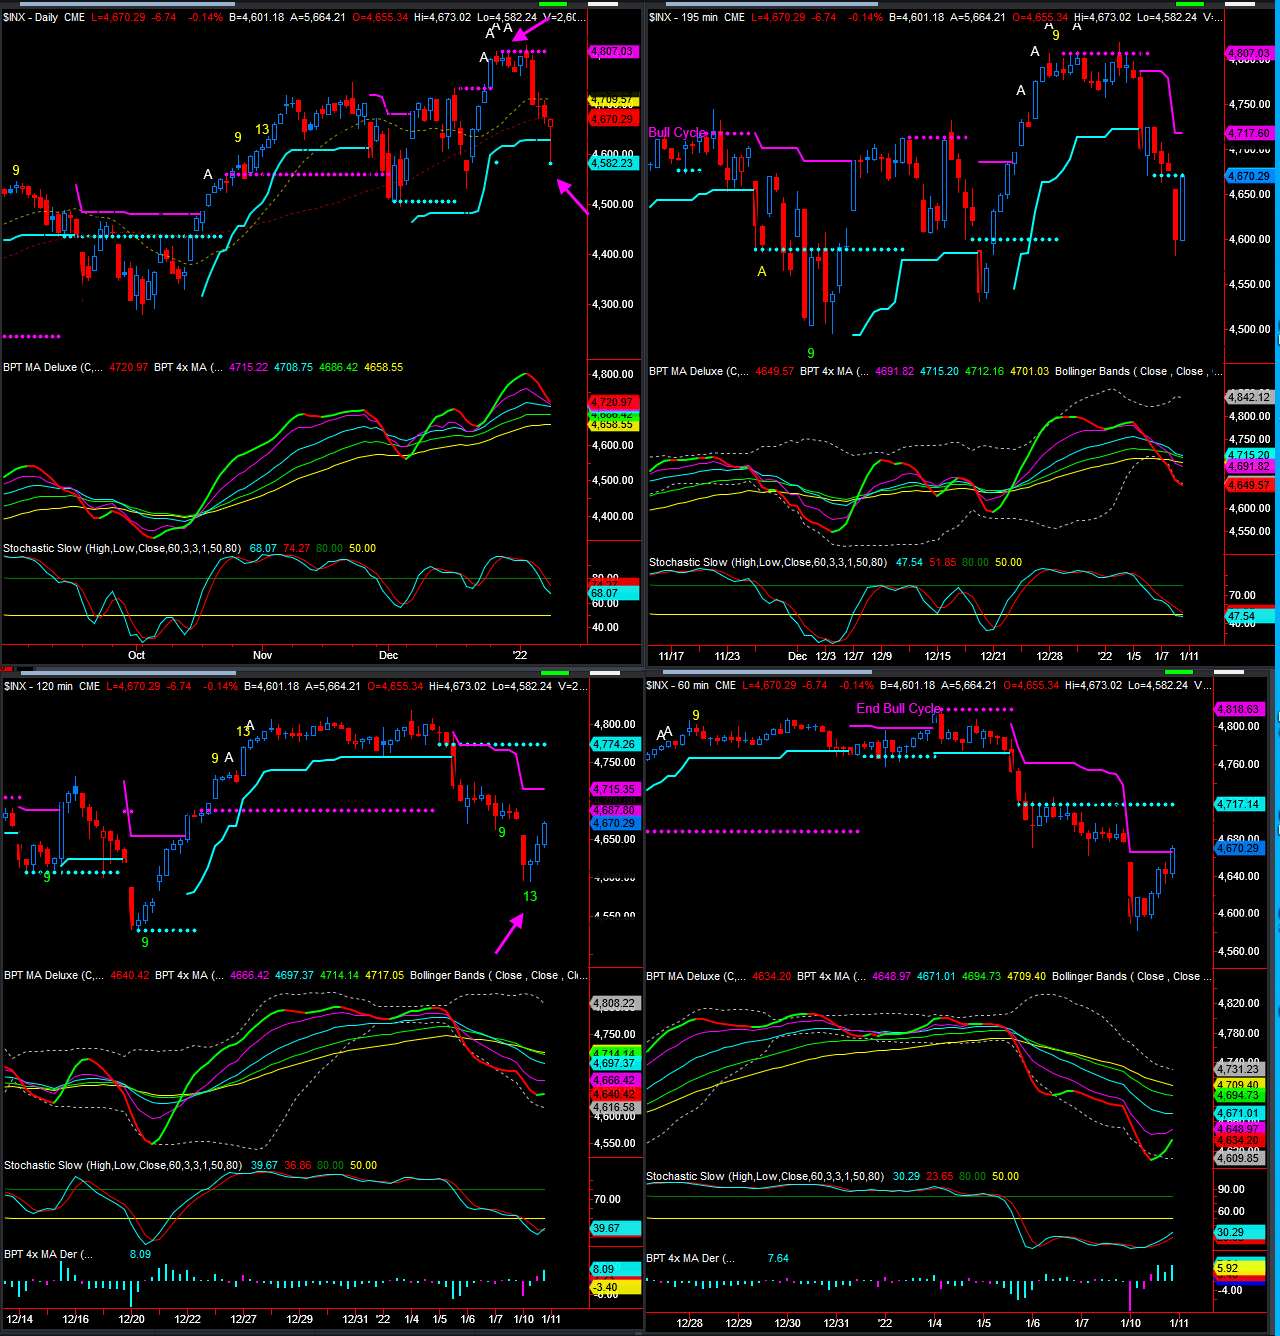
Note: gut wrenching sell off the first 1hr of the day with the SPX over 90 points from Friday's close, and then a very nice recovery into the close with the indexes gaining back most of their losses.
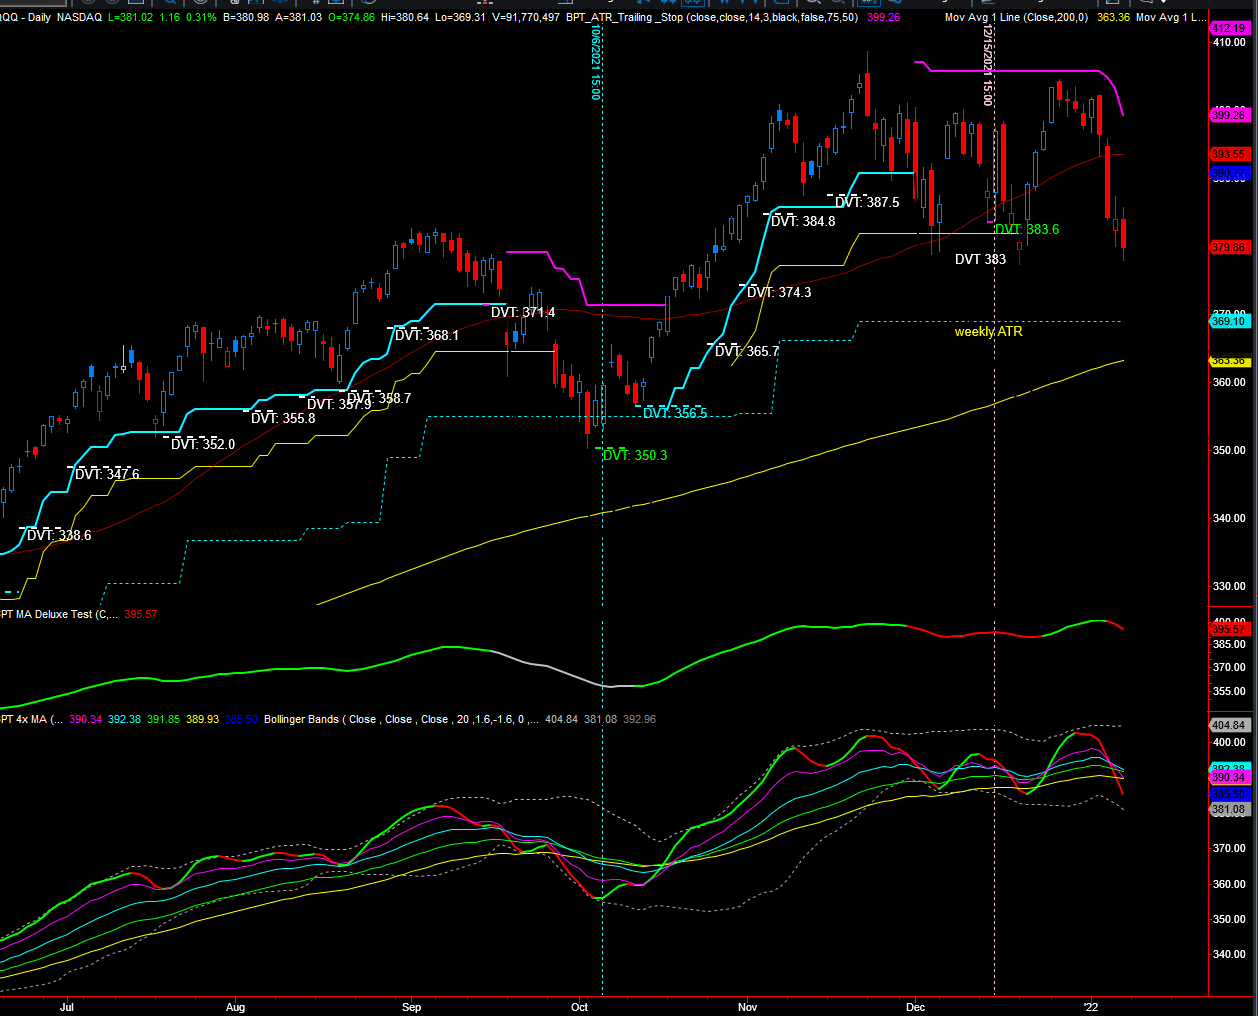
Short term we can count 5 waves up on the SPX and QQQ. This implies either a wave A, which means a higher low wave B will likely form then another move higher in a C. A more bullish view is this is the start of a new uptrend.
2

3 - View Live Chart

4 - View Live Chart

5
| Major Indexes | Index Symbol | ETF Symbol | % G / L Day | % G / L Week | Close |
|---|---|---|---|---|---|
| Dow Jones | INDU - W | DIA - W | -0.45% | -0.45% | 36,068.87 |
| S&P 500 | SPX - W | SPY - W | -0.14% | -0.14% | 4,670.29 |
| Wilshire 5000 | WLSH - W | -0.16% | -0.16% | 47,243.80 | |
| Nasdaq | COMPQ - W | 0.05% | 0.05% | 14,942.83 | |
| NDX 100 | NDX - W | QQQ - W | 0.14% | 0.14% | 15,614.43 |
| Russel 2000 (Small Caps) | IWM - W | -0.35% | -0.35% | 215.32 |
| Market Sectors | Index Symbol | ETF Symbol | % G / L Day | % G / L Week | Close |
|---|---|---|---|---|---|
| Transports | TRAN - W | IYT - W | -1.54% | -1.54% | 16,018.58 |
| Banks | BKX - W | -0.22% | -0.22% | 145.25 | |
| Financials | XLF - W | -0.34% | -0.34% | 41.03 | |
| Brokers | XBD - W | -0.07% | -0.07% | 499.23 | |
| XLE (Energy Select) | XLE - W | -0.31% | -0.31% | 61.15 | |
| Oil Service Holders | OIH - W | 0.01% | 0.01% | 211.90 | |
| Technology | XLK - W | 0.02% | 0.02% | 165.96 | |
| Semiconductor | SOX - W | SMH - W | 0.24% | 0.24% | 3,805.39 |
| Communication Services | XLC - W | -0.63% | -0.63% | 75.96 | |
| Retail | XRT - W | -1.65% | -1.65% | 85.74 | |
| Consumer Staples | XLP - W | -0.79% | -0.79% | 76.81 | |
| Consumer Discretionary | XLY - W | -0.61% | -0.61% | 198.26 | |
| Industrials | XLI - W | -1.13% | -1.13% | 105.29 | |
| Real Estate | IYR - W | -0.51% | -0.51% | 110.30 | |
| Homebuilders | HGX - W | XHB - W | 0.32% | 0.32% | 493.21 |
| Materials | XLB - W | -1.02% | -1.02% | 88.39 | |
| Metals And Mining | XME - W | -0.82% | -0.82% | 45.69 | |
| Biotechnology | BTK - W | XBI - W | 0.77% | 0.77% | 5,243.22 |
| Healthcare | XLV - W | 1.03% | 1.03% | 135.73 | |
| Drugs | DRG - W | 0.89% | 0.89% | 817.70 | |
| Utilities | UTIL - W | XLU - W | -0.56% | -0.56% | 962.66 |
| Currencies | Index Symbol | ETF Symbol | % G / L Day | % G / L Week | Close |
|---|---|---|---|---|---|
| US Dollar | UUP - W | 0.23% | 0.23% | 25.72 | |
| Euro | XEU - W | FXE - W | -0.30% | -0.30% | 113.26 |
| Yen | XJY - W | FXY - W | 0.30% | 0.30% | 86.81 |
| Australian | XAD - W | FXA - W | -0.07% | -0.07% | 71.74 |
| British Pound | XBP - W | FXB - W | -0.11% | -0.11% | 135.74 |
| Chinese Yuan | CYB - W | 0.06% | 0.06% | 26.70 | |
| Canadian Dollar | CDW - W | FXC - W | -0.30% | -0.30% | 78.87 |
| Swiss Franc | XSF - W | FXF - W | -0.96% | -0.96% | 107.82 |
| Cryptocurrencies | Index Symbol | ETF Symbol | % G / L Day | % G / L Week | Close |
|---|---|---|---|---|---|
| Bitcoin | BTCUSD - W | -0.30% | -0.30% | 41,743.41 | |
| Bitcoin Cash | BCHUSD - W | -3.51% | -3.51% | 363.61 | |
| Etherium | ETHUSD - W | -2.36% | -2.36% | 3,076.41 | |
| Monero | XMRUSD - W | -4.23% | -4.23% | 182.76 | |
| Litecoin | LTCUSD - W | -3.12% | -3.12% | 126.81 | |
| Ripple | XRPUSD - W | -2.34% | -2.34% | 0.74 |
| Commodities | Index Symbol | ETF Symbol | % G / L Day | % G / L Week | Close |
|---|---|---|---|---|---|
| Commodities | DBC - W | -0.52% | -0.52% | 21.13 | |
| Crude Oil | WTIC - W | USO - W | -0.85% | -0.85% | 78.23 |
| Gasoline | GASO - W | -1.02% | -1.02% | 2.28 | |
| Natural Gas | NATGAS - W | UNG - W | 4.16% | 4.16% | 4.08 |
| Copper | COPPER - W | JJCB - W | -1.32% | -1.32% | 4.35 |
| Agriculture | DBA - W | -0.81% | -0.81% | 19.68 | |
| Corn | CORN - W | CORN - W | -1.15% | -1.15% | 599.75 |
| Wheat | WHEAT - W | WEAT - W | 0.46% | 0.46% | 762.00 |
| Coffee | JO - W | -1.50% | -1.50% | 63.89 | |
| Sugar | CANE - W | -0.79% | -0.79% | 8.81 |
| Precious Metals | Index Symbol | ETF Symbol | % G / L Day | % G / L Week | Close |
|---|---|---|---|---|---|
| Gold Metal | GLD - W | 0.30% | 0.30% | 168.26 | |
| Silver | SLV - W | 0.68% | 0.68% | 20.76 | |
| Platinum | PPLT - W | -1.39% | -1.39% | 87.98 | |
| Palladium | PALL - W | -1.09% | -1.09% | 177.64 | |
| GDX Gold Miners ETF | GDX - W | 1.67% | 1.67% | 30.51 |
| Bonds | Index Symbol | ETF Symbol | % G / L Day | % G / L Week | Close |
|---|---|---|---|---|---|
| High Yield Corporate Bond | HYG - W | 0.08% | 0.08% | 85.94 | |
| TLT 20 Year Bond ETF | TLT - W | 0.25% | 0.25% | 142.61 | |
| 10 Year Treasury Yield | TNX - W | 0.51% | 0.51% | 17.80 | |
| 30 Year Treasury Yield | TYX - W | -0.38% | -0.38% | 21.10 |
6
| Release | ET | For | Trading Impact | Forecast | Consensus | Prior |
|---|---|---|---|---|---|---|
| Jan 10 | ||||||
| Wholesale Inventories | 10:00 | Nov | Low | 1.2% | 1.2% | 2.5% |
| Jan 11 | ||||||
| NFIB Small Business Optimism | 06:00 | Dec | Low | NA | NA | 98.4 |
| Jan 12 | ||||||
| MBA Mortgage Applications Index | 07:00 | 01/08 | Low | NA | NA | -5.6% |
| CPI | 08:30 | Dec | High | 0.5% | 0.4% | 0.8% |
| Core CPI | 08:30 | Dec | High | 0.5% | 0.5% | 0.5% |
| EIA Crude Oil Inventories | 10:30 | 01/08 | High | NA | NA | -2.14M |
| Fed Beige Book | 14:00 | -- | Low | NA | NA | NA |
| Treasury Budget | 14:00 | Dec | Low | NA | NA | -$143.6B |
| Jan 13 | ||||||
| Initial Claims | 08:30 | 01/08 | High | 198K | 202K | 207K |
| Continuing Claims | 08:30 | 01/01 | High | NA | NA | 1.754M |
| PPI | 08:30 | Dec | High | 0.4% | 0.4% | 0.8% |
| Core PPI | 08:30 | Dec | High | 0.5% | 0.4% | 0.7% |
| EIA Natural Gas Inventories | 10:30 | 01/08 | Low | NA | NA | -31 bcf |
| Jan 14 | ||||||
| Retail Sales | 08:30 | Dec | High | 0.2% | 0.0% | 0.3% |
| Retail Sales ex-auto | 08:30 | Dec | High | 0.4% | 0.2% | 0.3% |
| Import Price Index | 08:30 | Dec | Low | NA | NA | 0.7% |
| Import Prices ex-oil | 08:30 | Dec | Low | NA | NA | 0.5% |
| Export Price Index | 08:30 | Dec | Low | NA | NA | 1.0% |
| Export Prices ex-ag. | 08:30 | Dec | Low | NA | NA | 1.0% |
| Industrial Production | 09:15 | Dec | Medium | 0.4% | 0.3% | 0.5% |
| Capacity Utilization | 09:15 | Dec | Medium | 77.1% | 77.1% | 76.8% |
| Business Inventories | 10:00 | Nov | Low | 1.3% | 1.0% | 1.2% |
| Univ. of Michigan Consumer Sentiment - Prelim | 10:00 | Jan | High | 68.0 | 68.5 | 70.6 |
Stock Earnings Calender:
Click here for a list of Stocks that are reporting Earnings
**Generally we never hold a position into earnings since the risk/reward is too great
7 - View Live Chart

8 - View Live Chart

9 - View Live Chart

10 - View Live Chart

11 - View Live Chart

12 - View Live Chart

13 - View Live Chart

14 - View Live Chart

15
16
17 - View Live Chart

18 - View Live Chart

19 - View Live Chart

20 - View Live Chart

21 - View Live Chart

22
23 - View Live Chart

24 - View Live Chart

25 - View Live Chart

26 - View Live Chart

27 - View Live Chart

28 - View Live Chart

29 - View Live Chart

30 - View Live Chart

31 - View Live Chart

32 - View Live Chart

33 - View Live Chart

34 - View Live Chart

35 - View Live Chart

36 - View Live Chart

37 - View Live Chart

38 - View Live Chart

39 - View Live Chart

40 - View Live Chart

41 - View Live Chart

42 - View Live Chart

43 - View Live Chart

44 - View Live Chart

45 - View Live Chart

46 - View Live Chart

47 - View Live Chart

48 - View Live Chart

49 - View Live Chart

50 - View Live Chart

51 - View Live Chart

52 - View Live Chart

53 - View Live Chart

54 - View Live Chart

55 - View Live Chart

56 - View Live Chart

57 - View Live Chart

58 - View Live Chart

59 - View Live Chart

60 - View Live Chart

61 - View Live Chart

62 - View Live Chart

63 - View Live Chart

64 - View Live Chart

65 - View Live Chart

66 - View Live Chart

67 - View Live Chart

68 - View Live Chart

69 - View Live Chart

70 - View Live Chart

71 - View Live Chart

72 - View Live Chart

73 - View Live Chart

74 - View Live Chart

75 - View Live Chart

76 - View Live Chart

77 - View Live Chart

78 - View Live Chart

79 - View Live Chart

80 - View Live Chart

- Hide Player Link to Newsletter Audio
- Hide Player Link to Newsletter Audio