Wednesday October 13th, 2021 Newsletter - free
Disclaimer: Intraday Chart Links will show up as daily charts unless you have an active stockcharts.com membership and are signed in, you can sign up here.
1
Table Of Contents:
1. General Market Analysis: SPX and Other Major Indices
2. Indicators and Bonds (TLT/JNK)
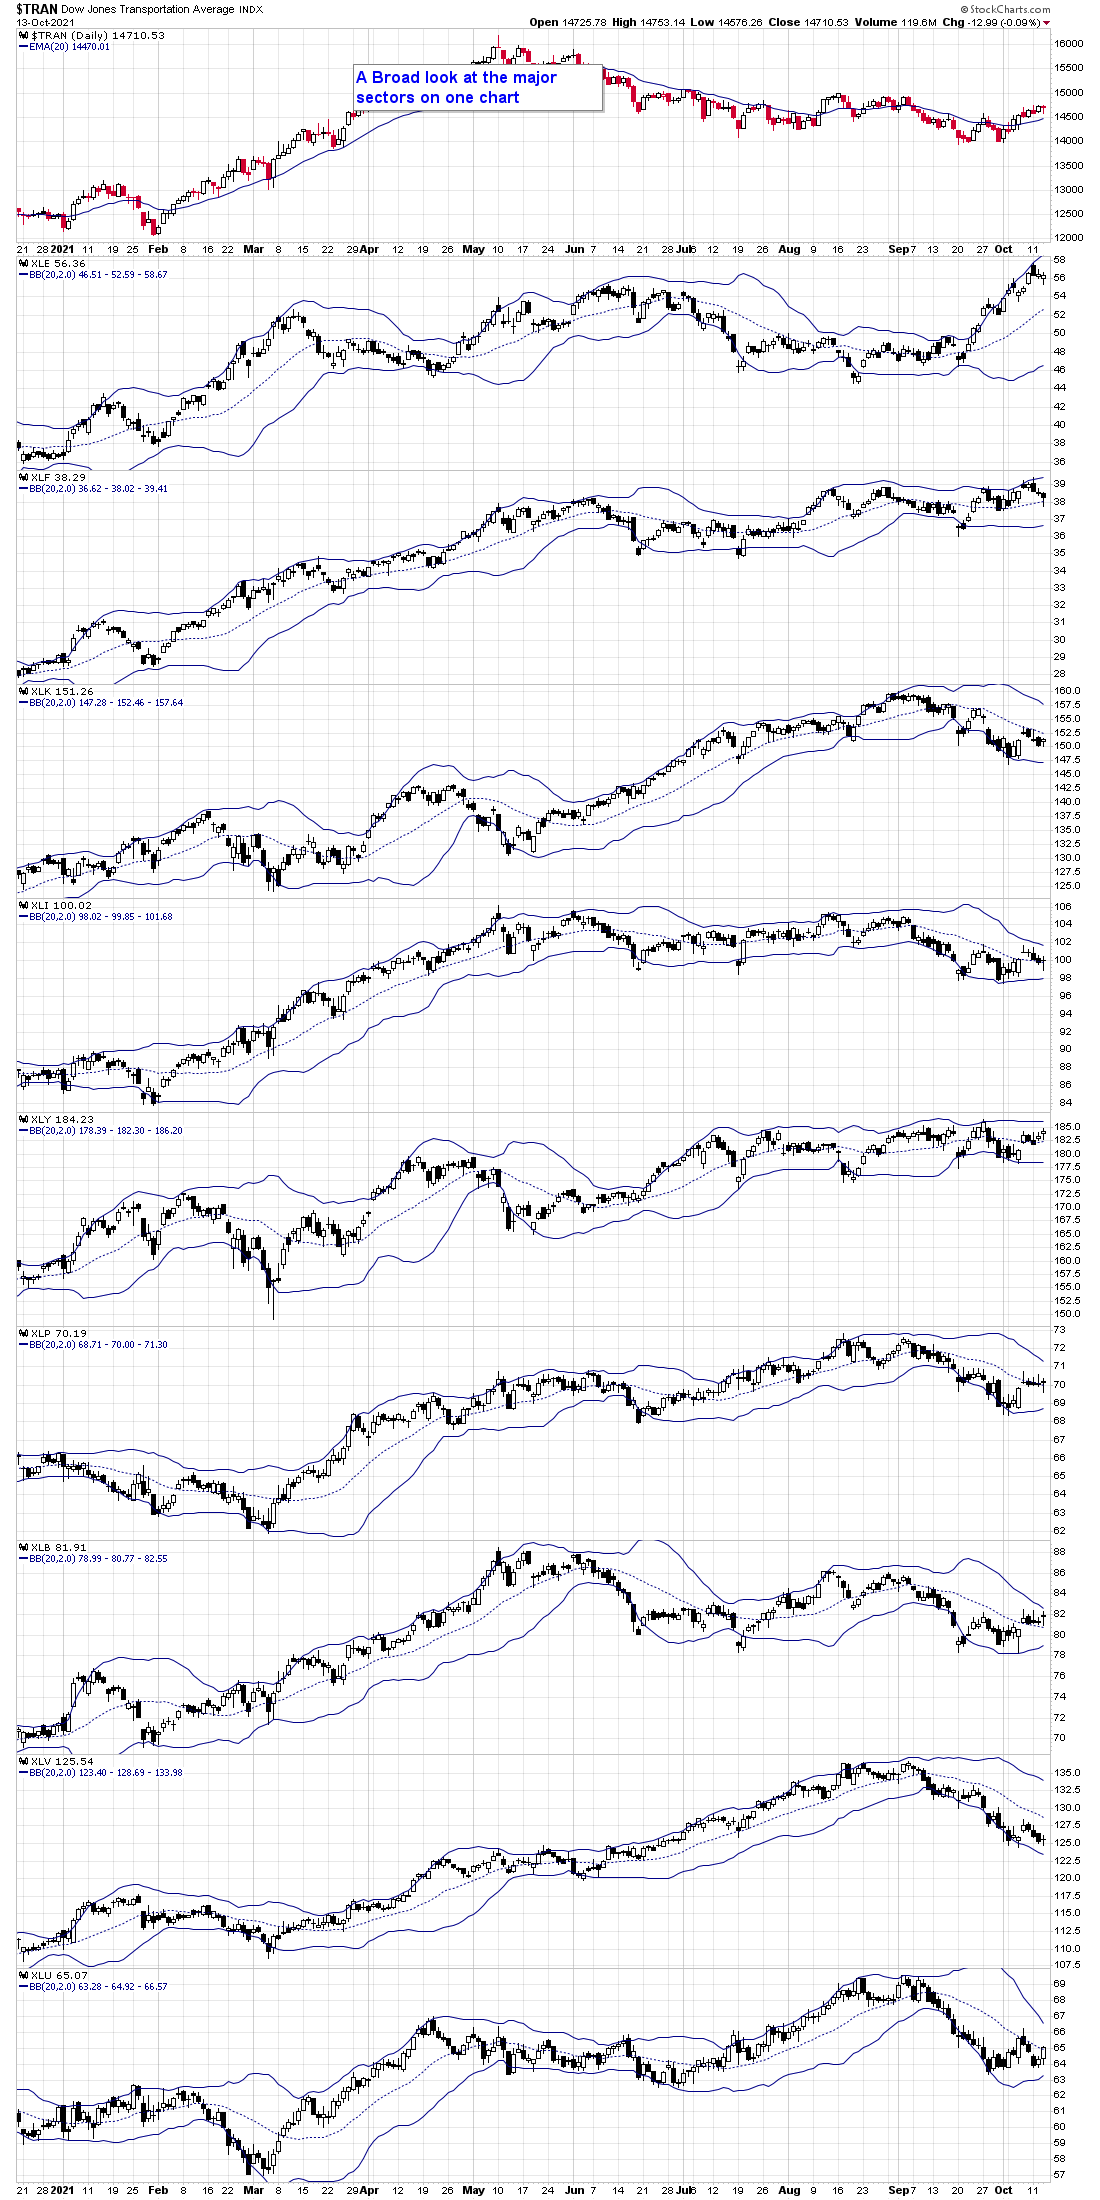
3. Major Sectors
4. US Dollar, Commodities, Precious Metals and GDX and individual names
5. Trade Ideas - I added a few setups and the precious metal setups have been SWEET!
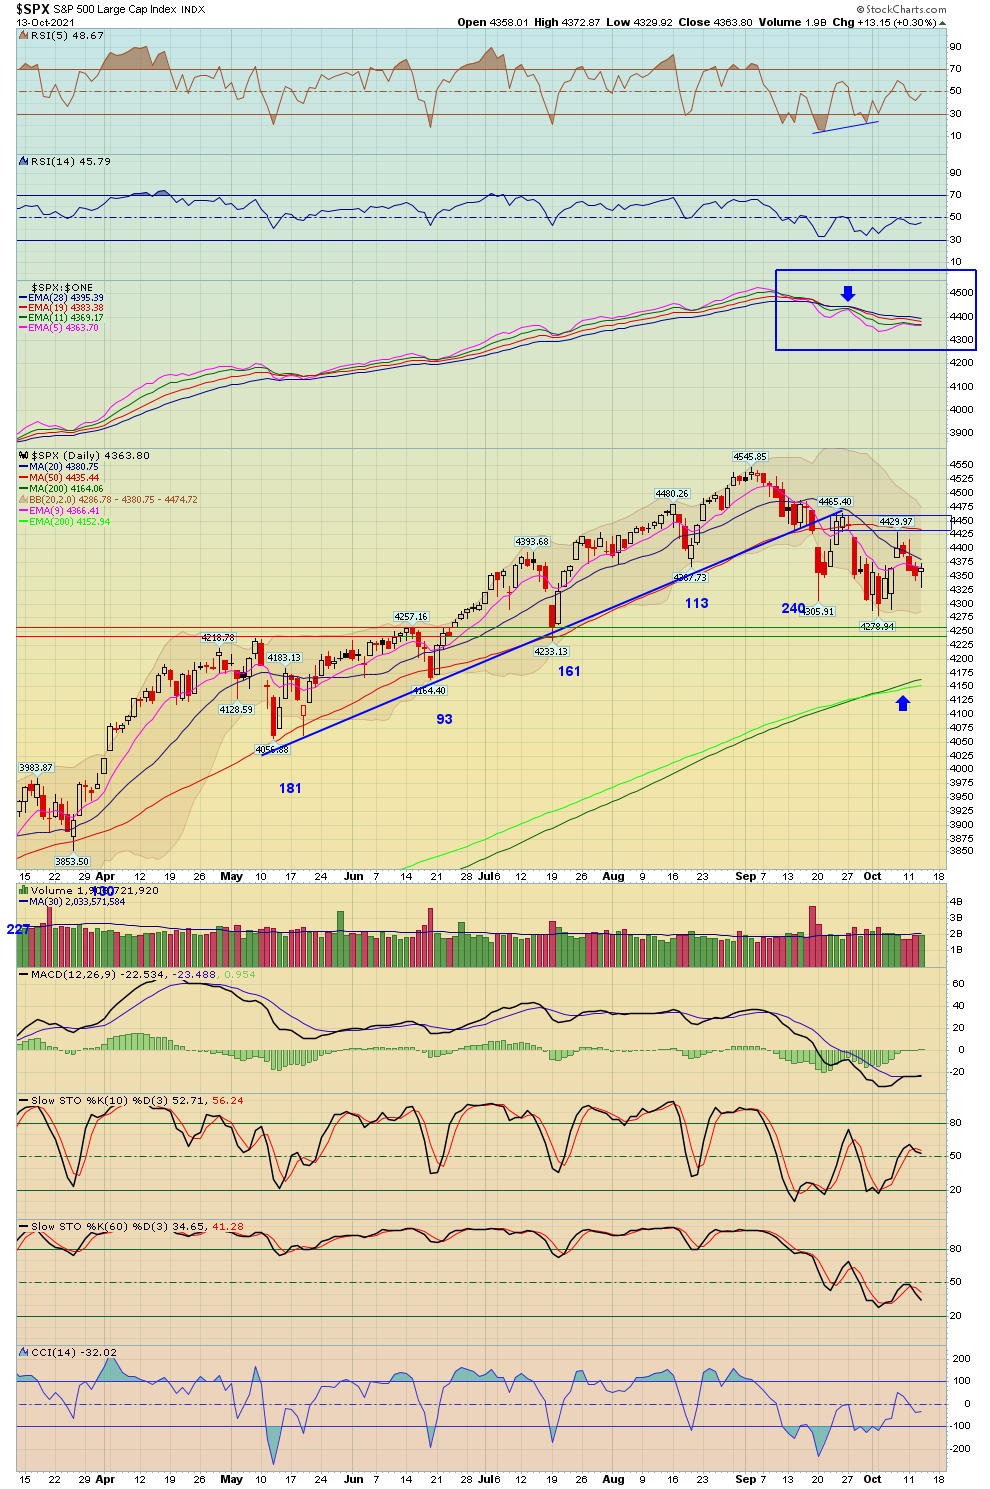
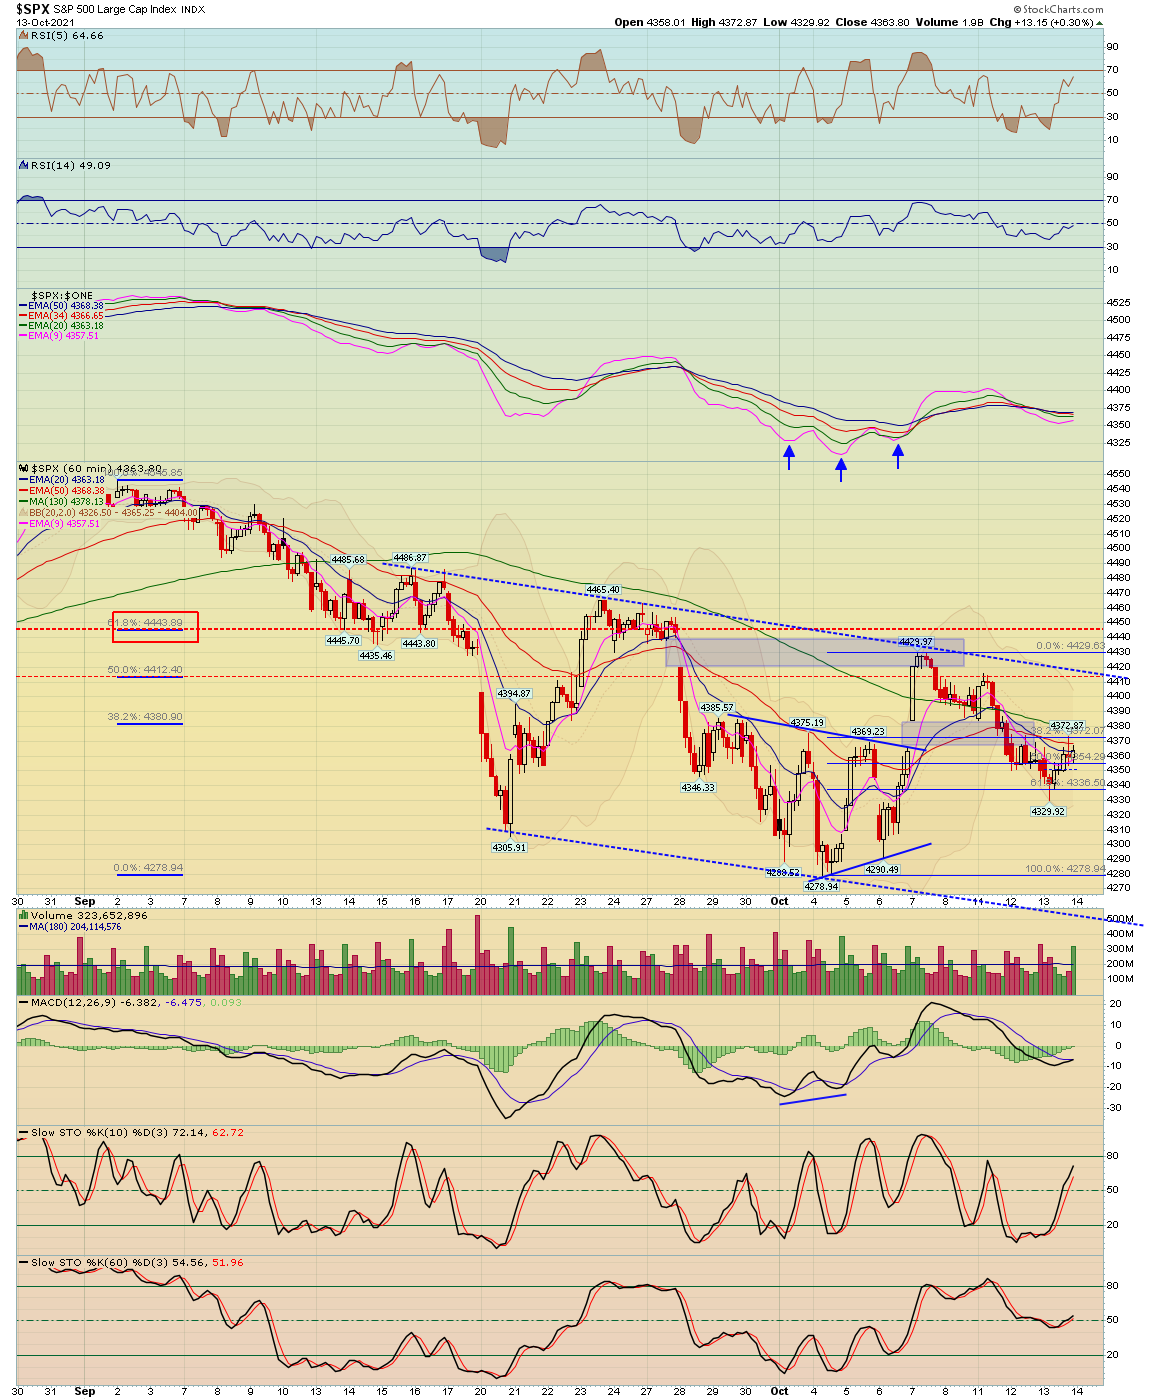
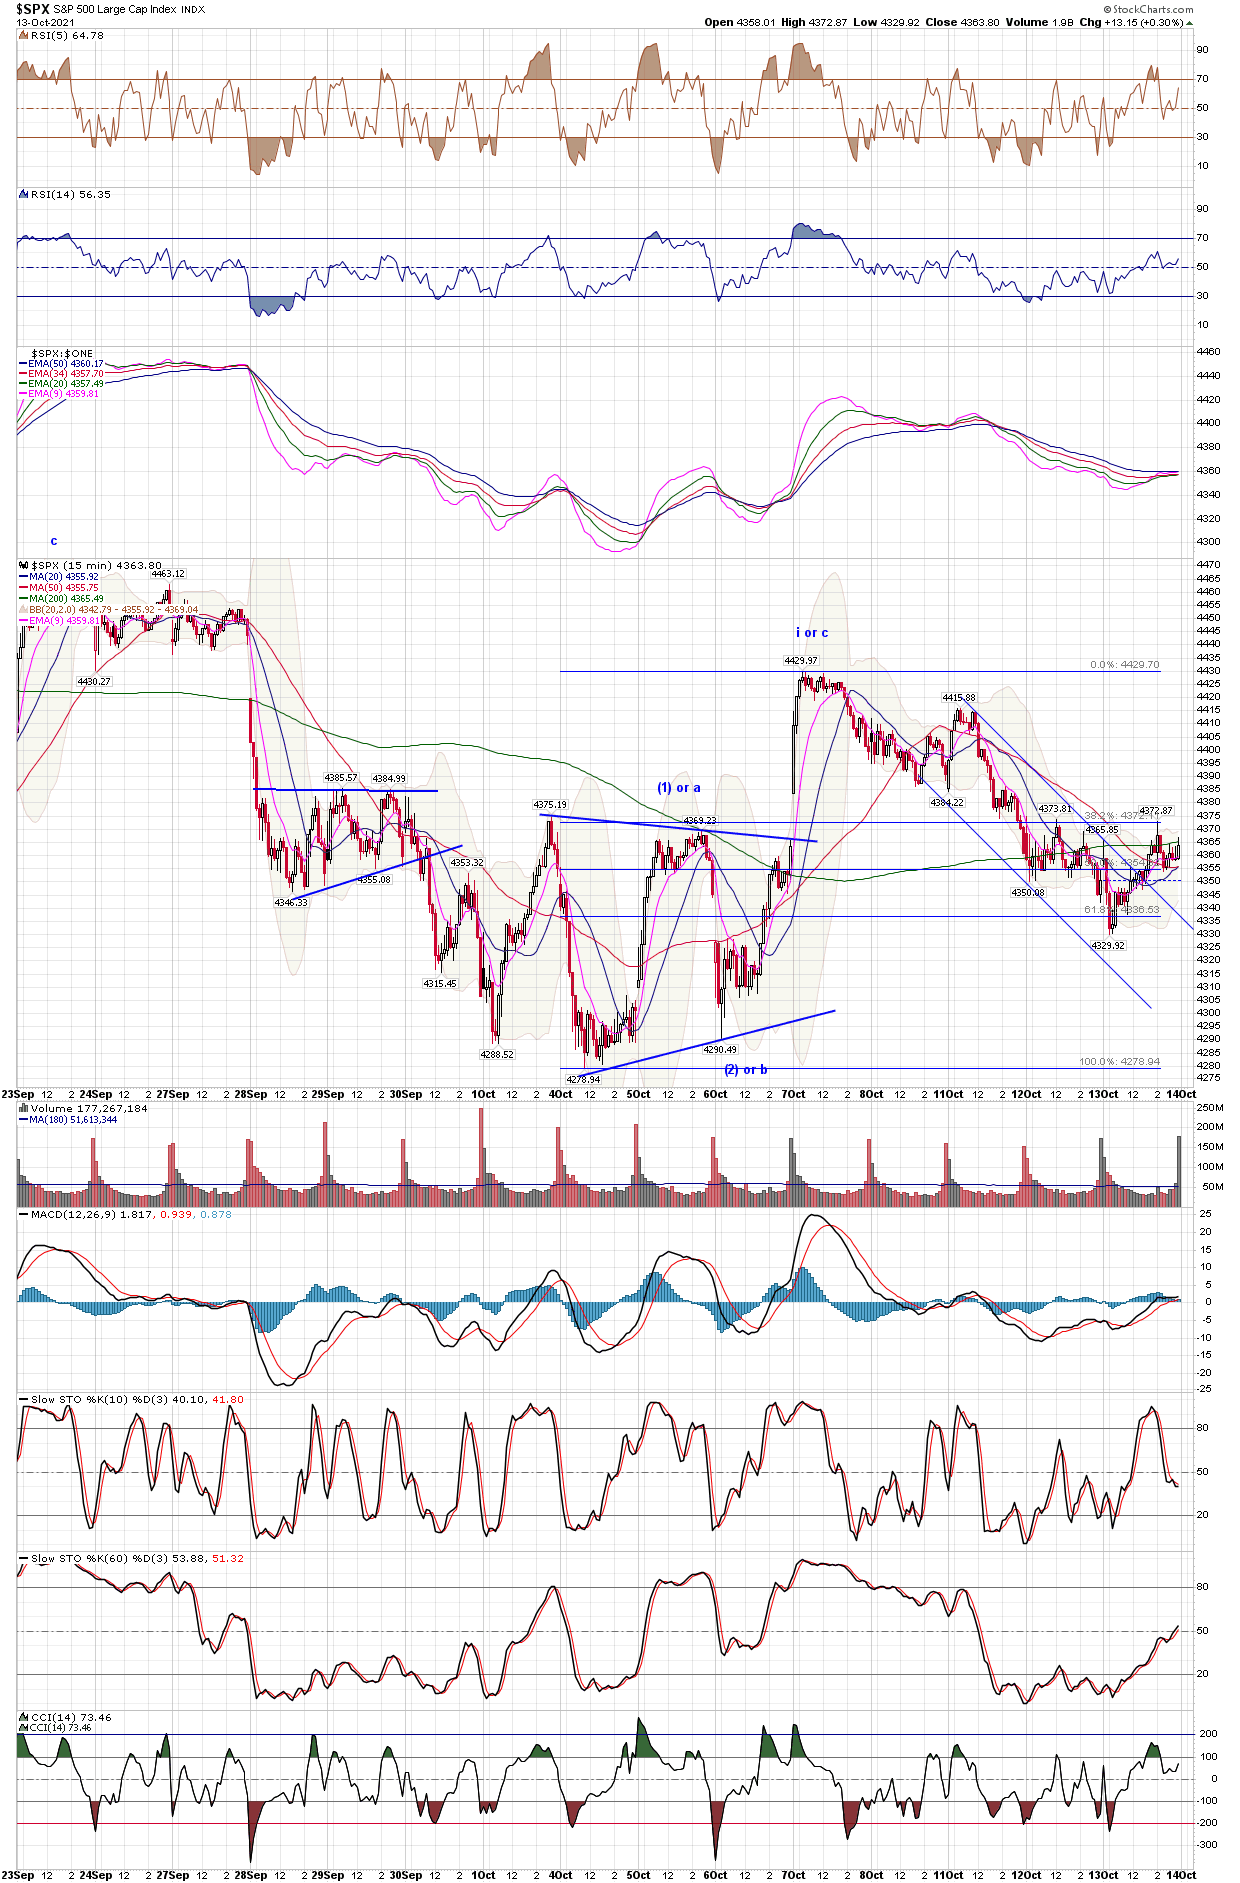
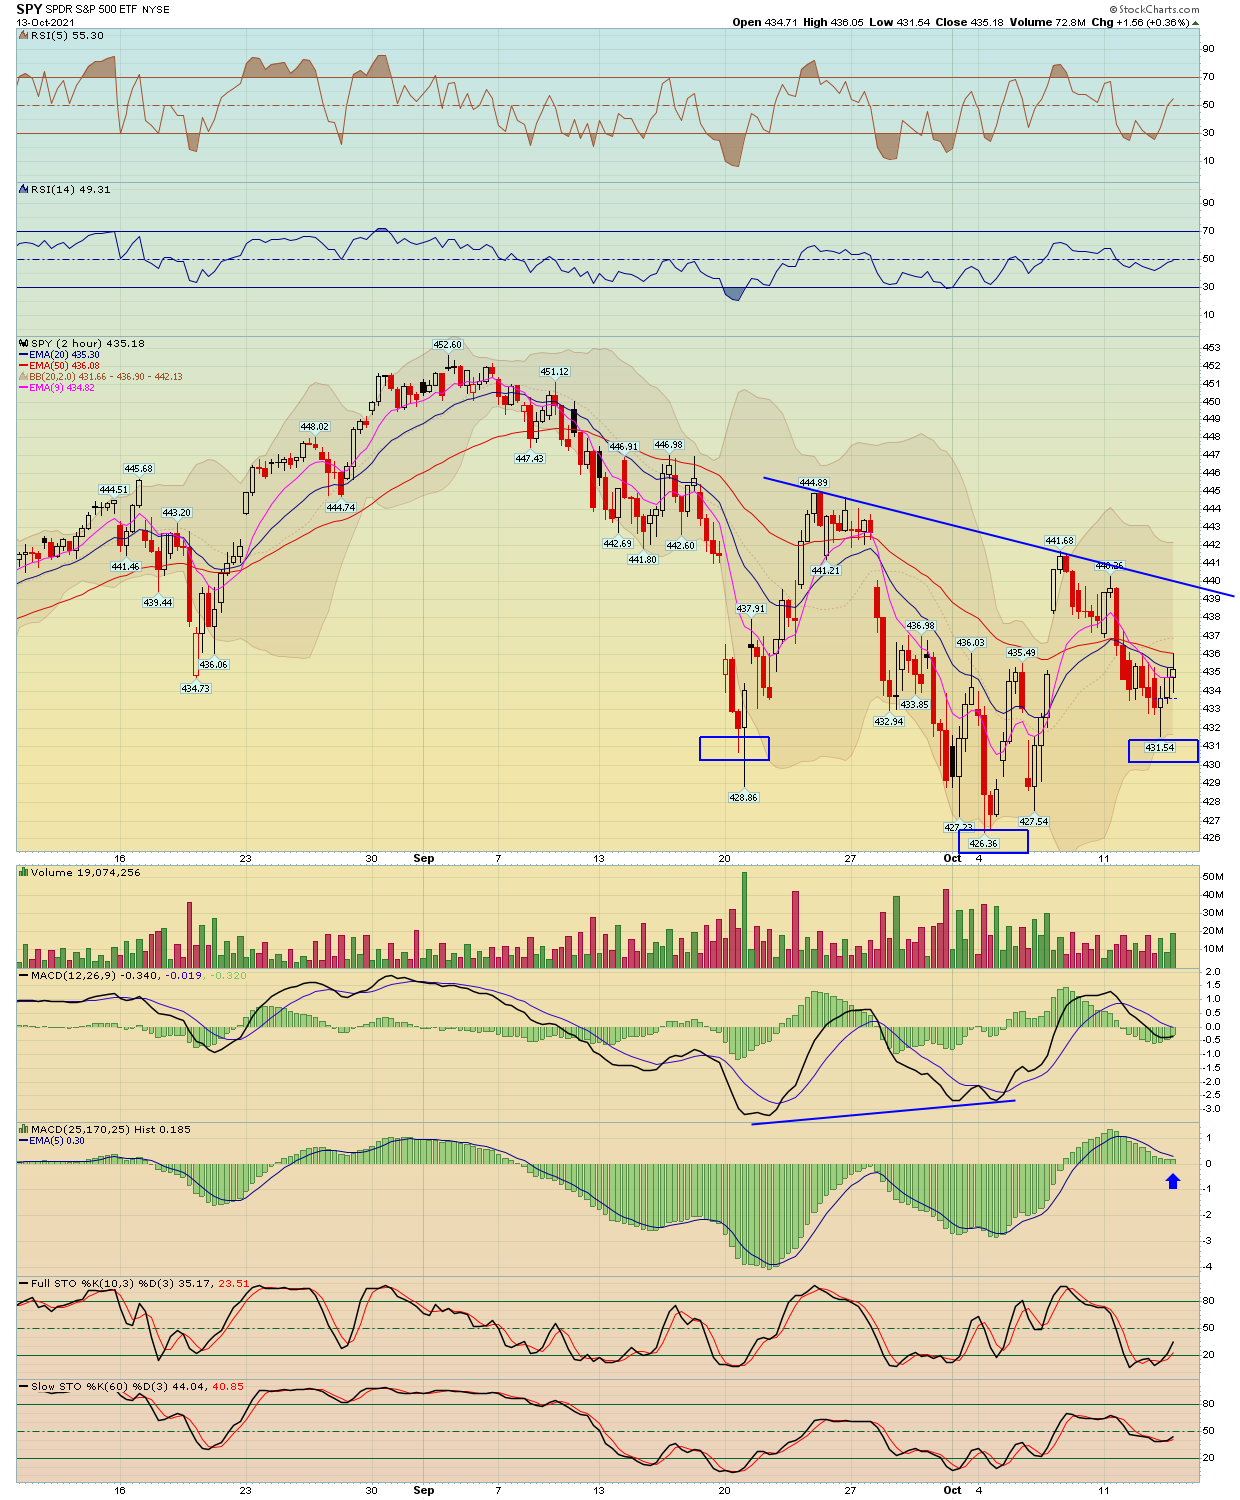
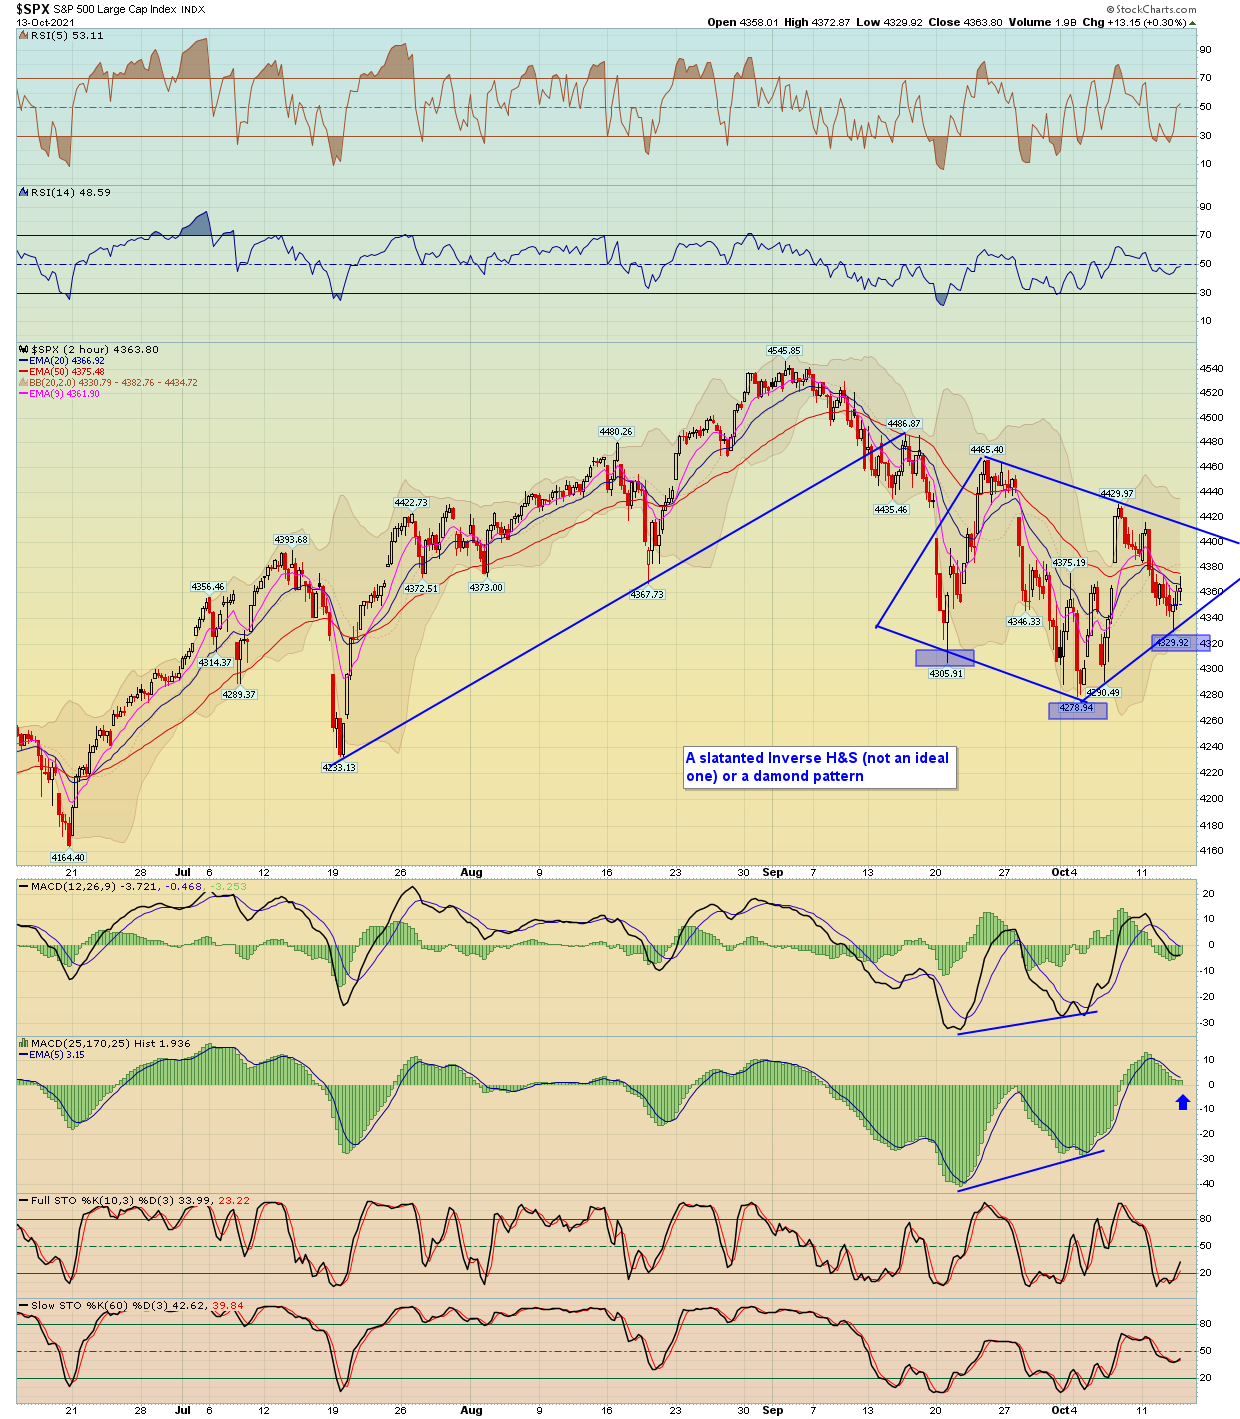
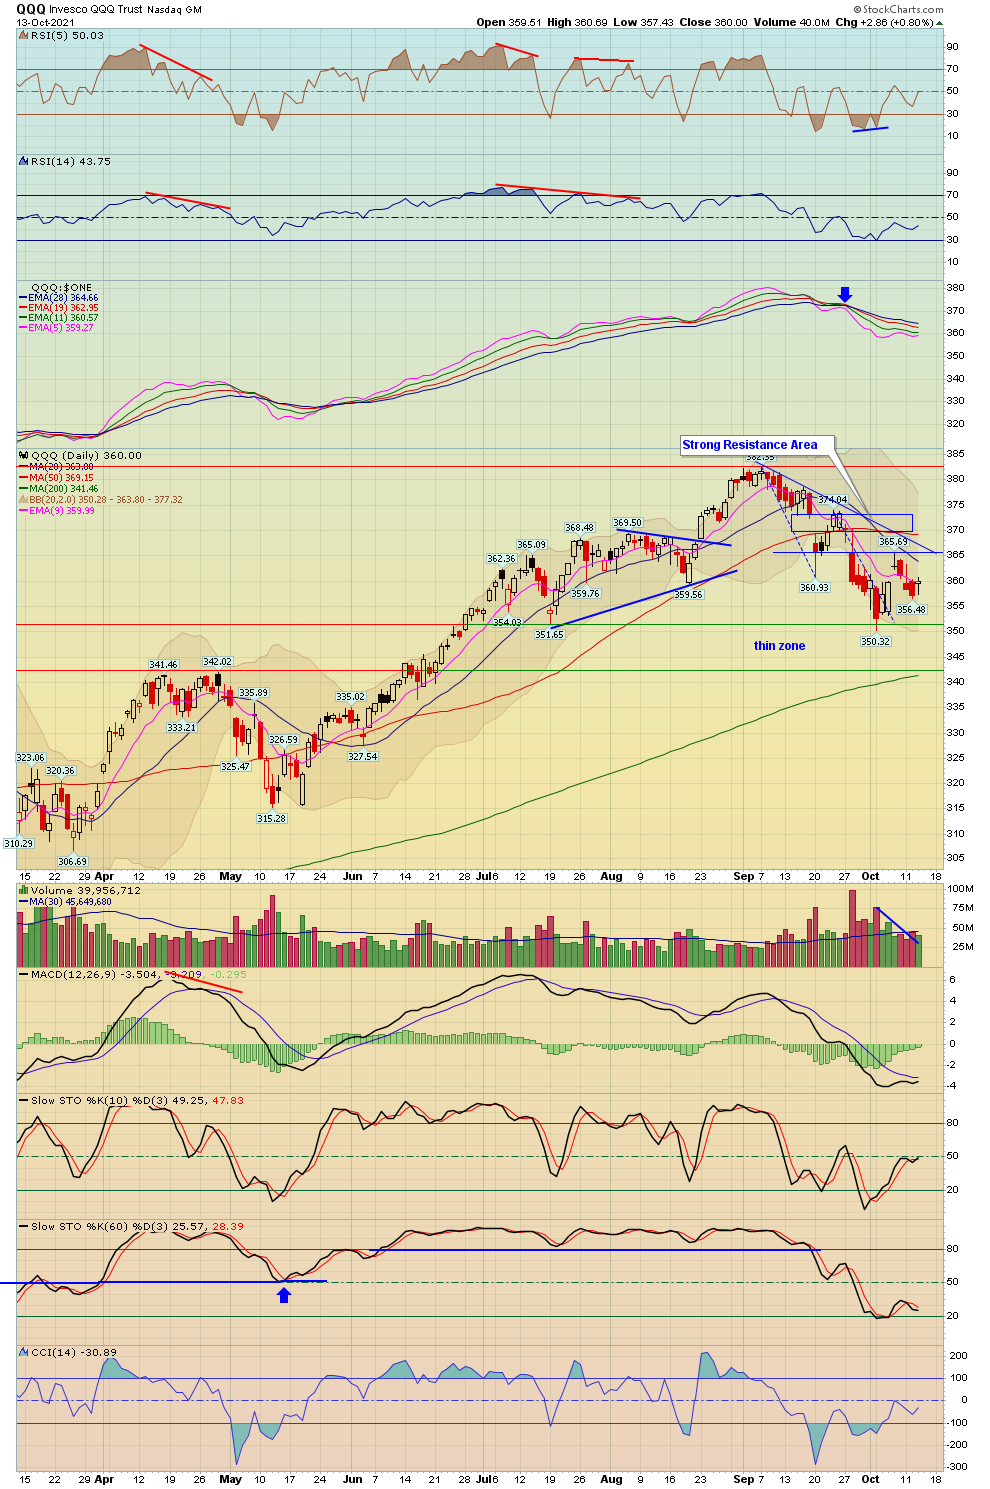
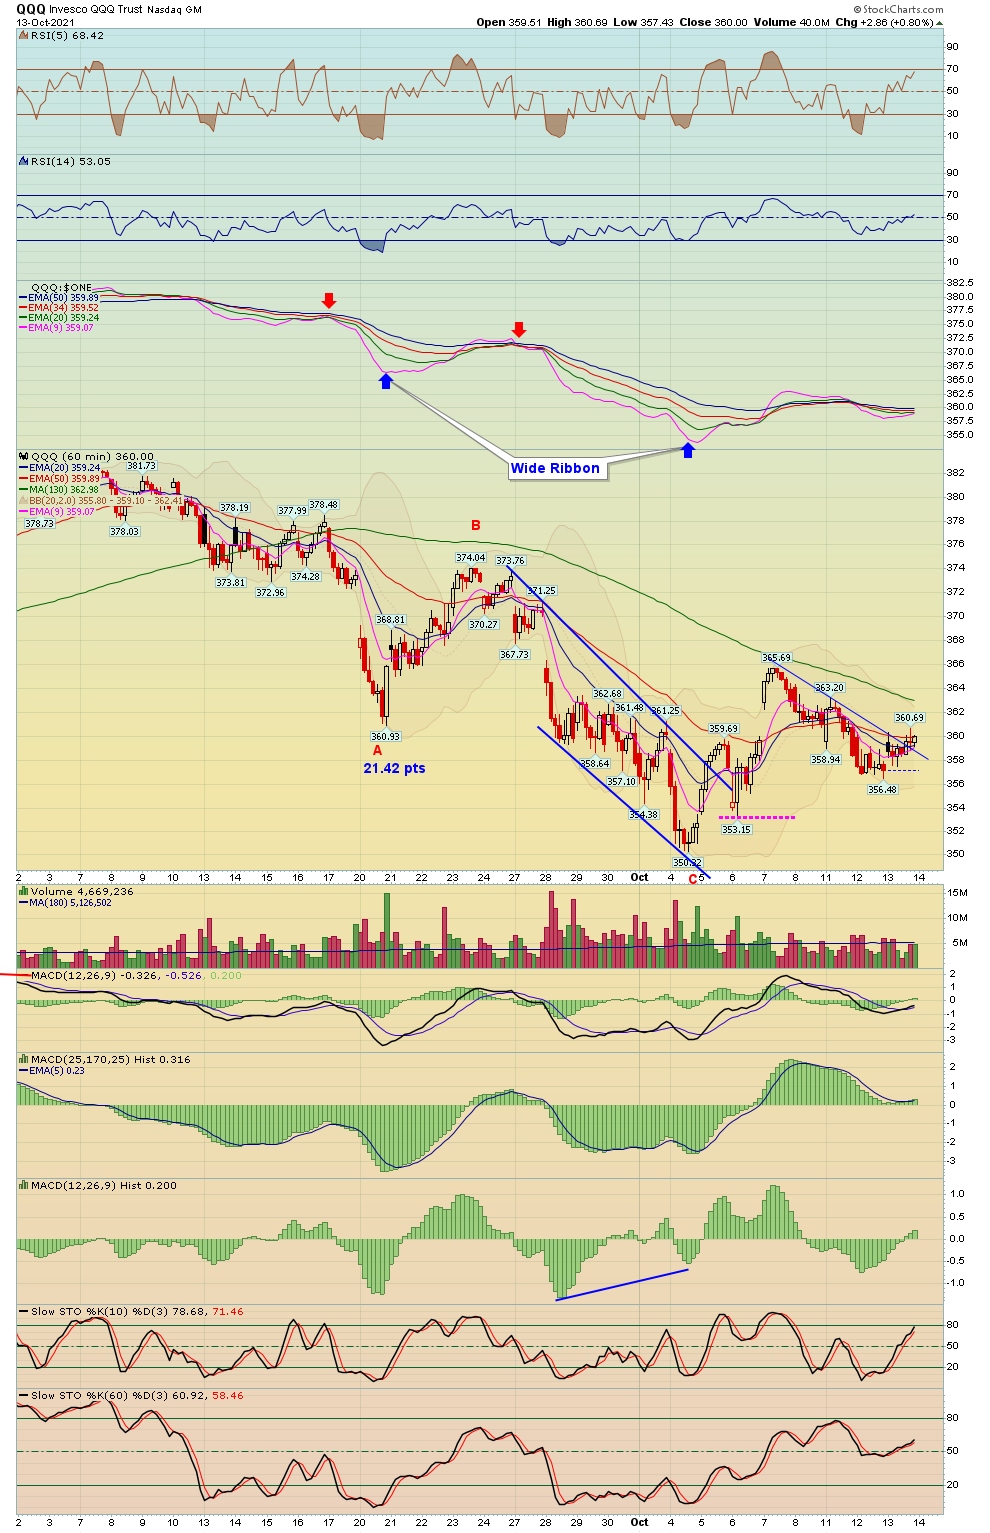
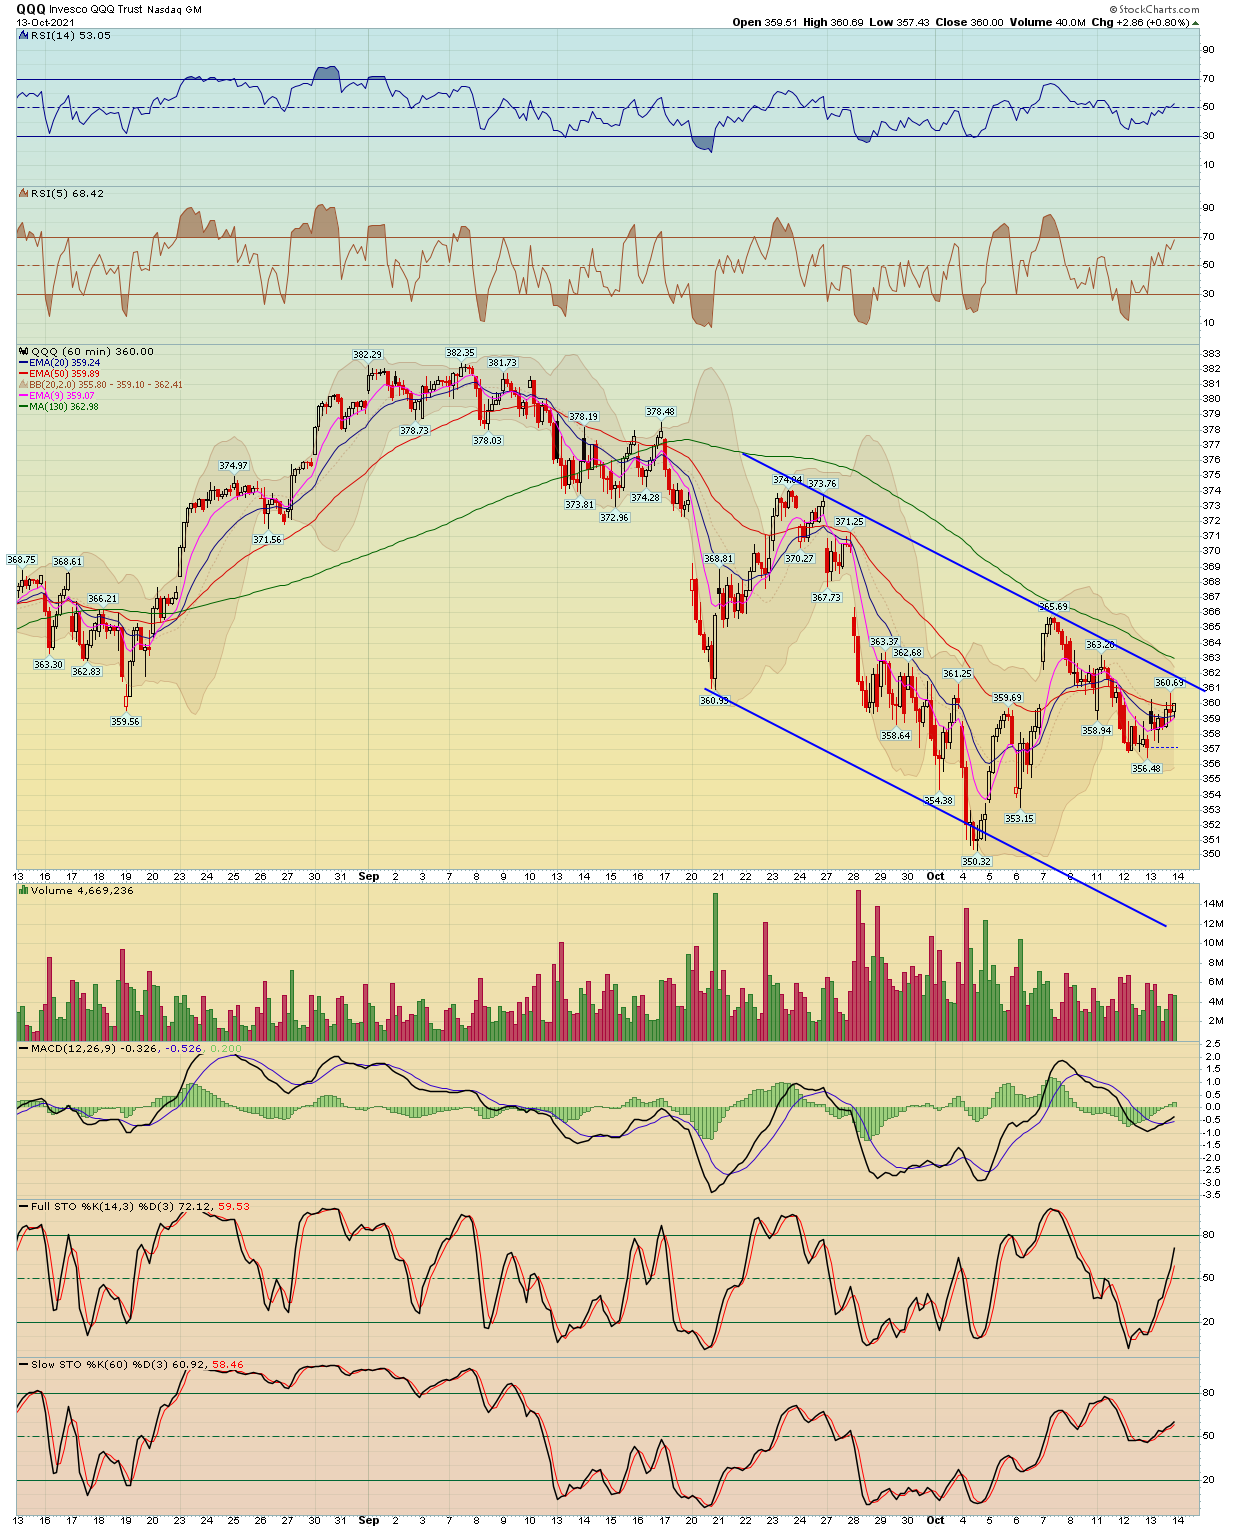
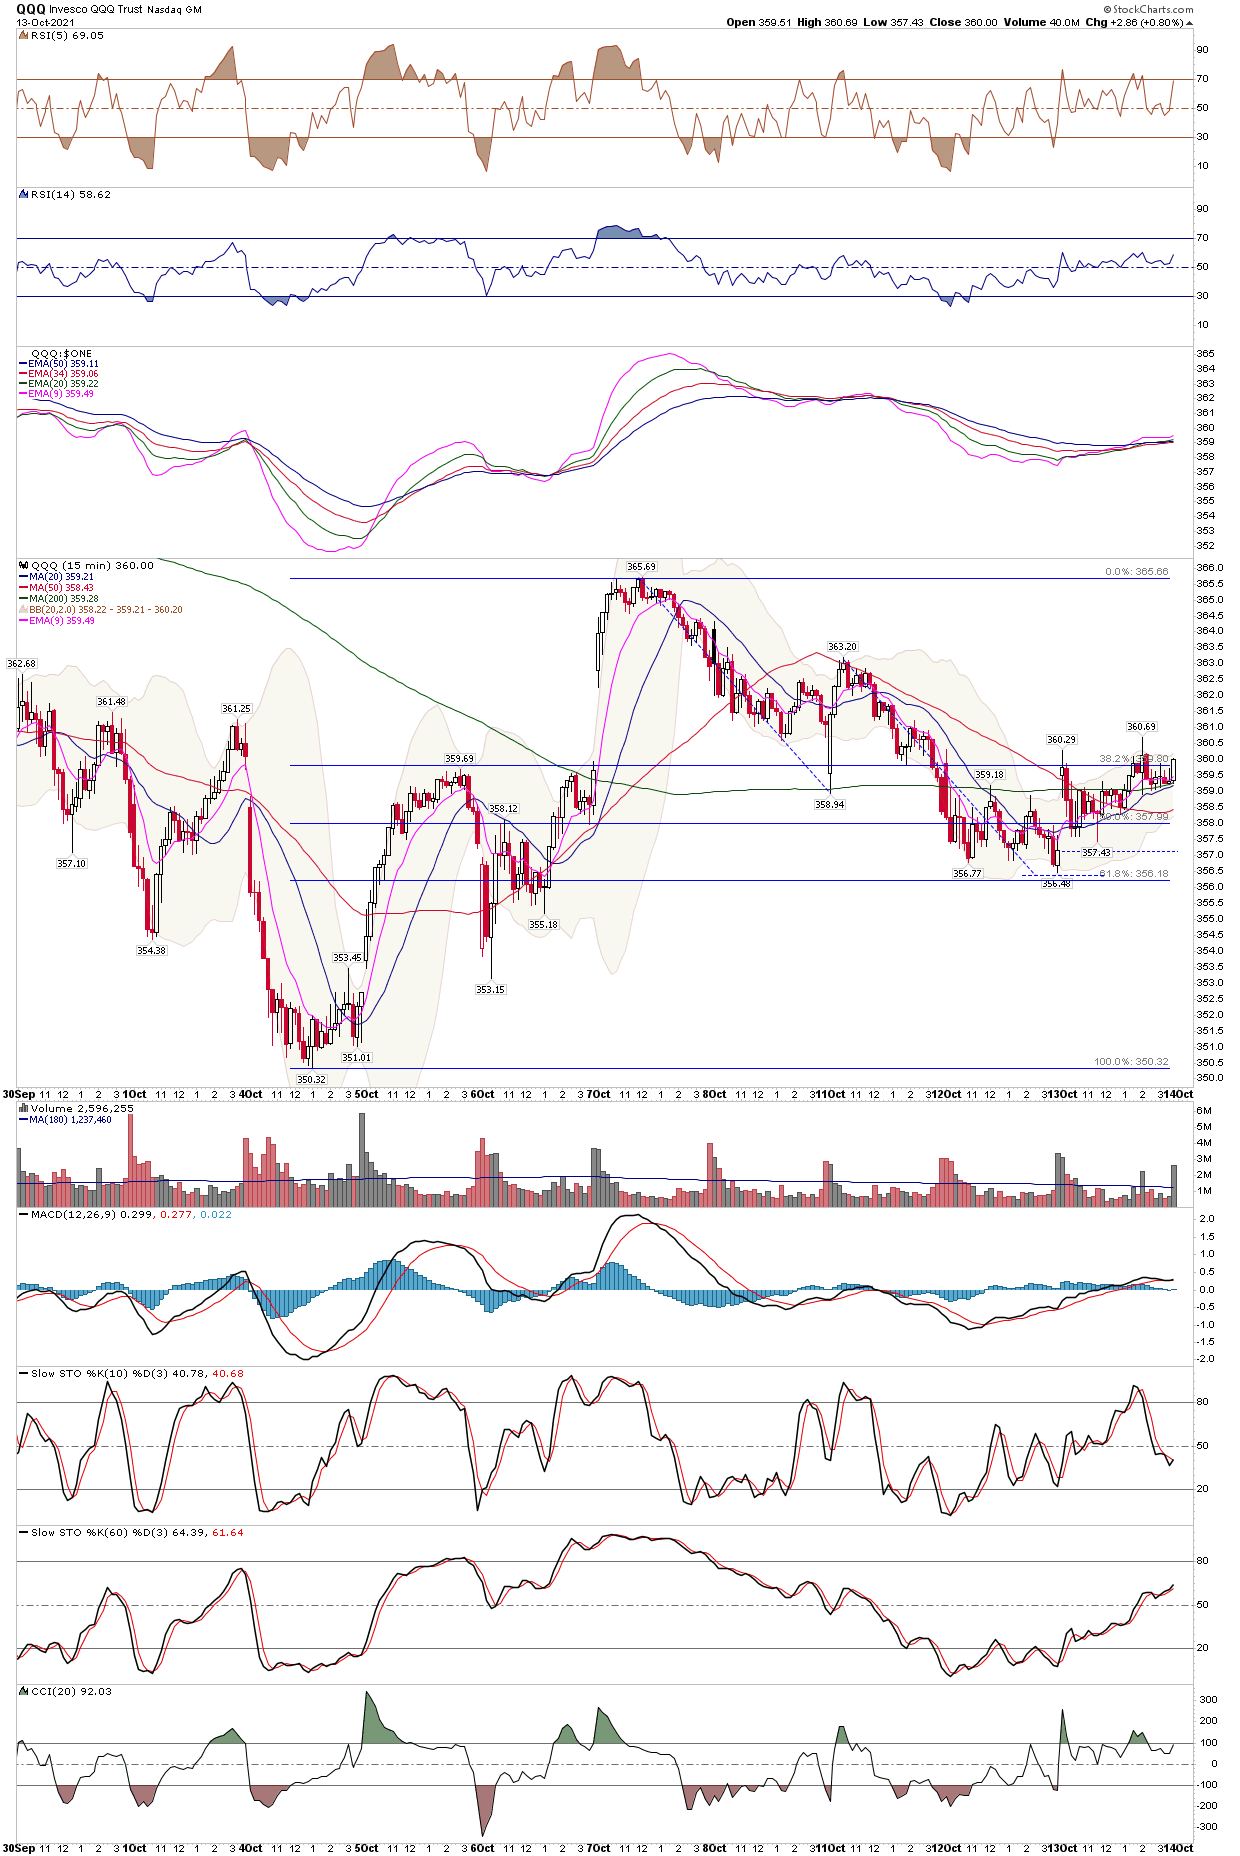
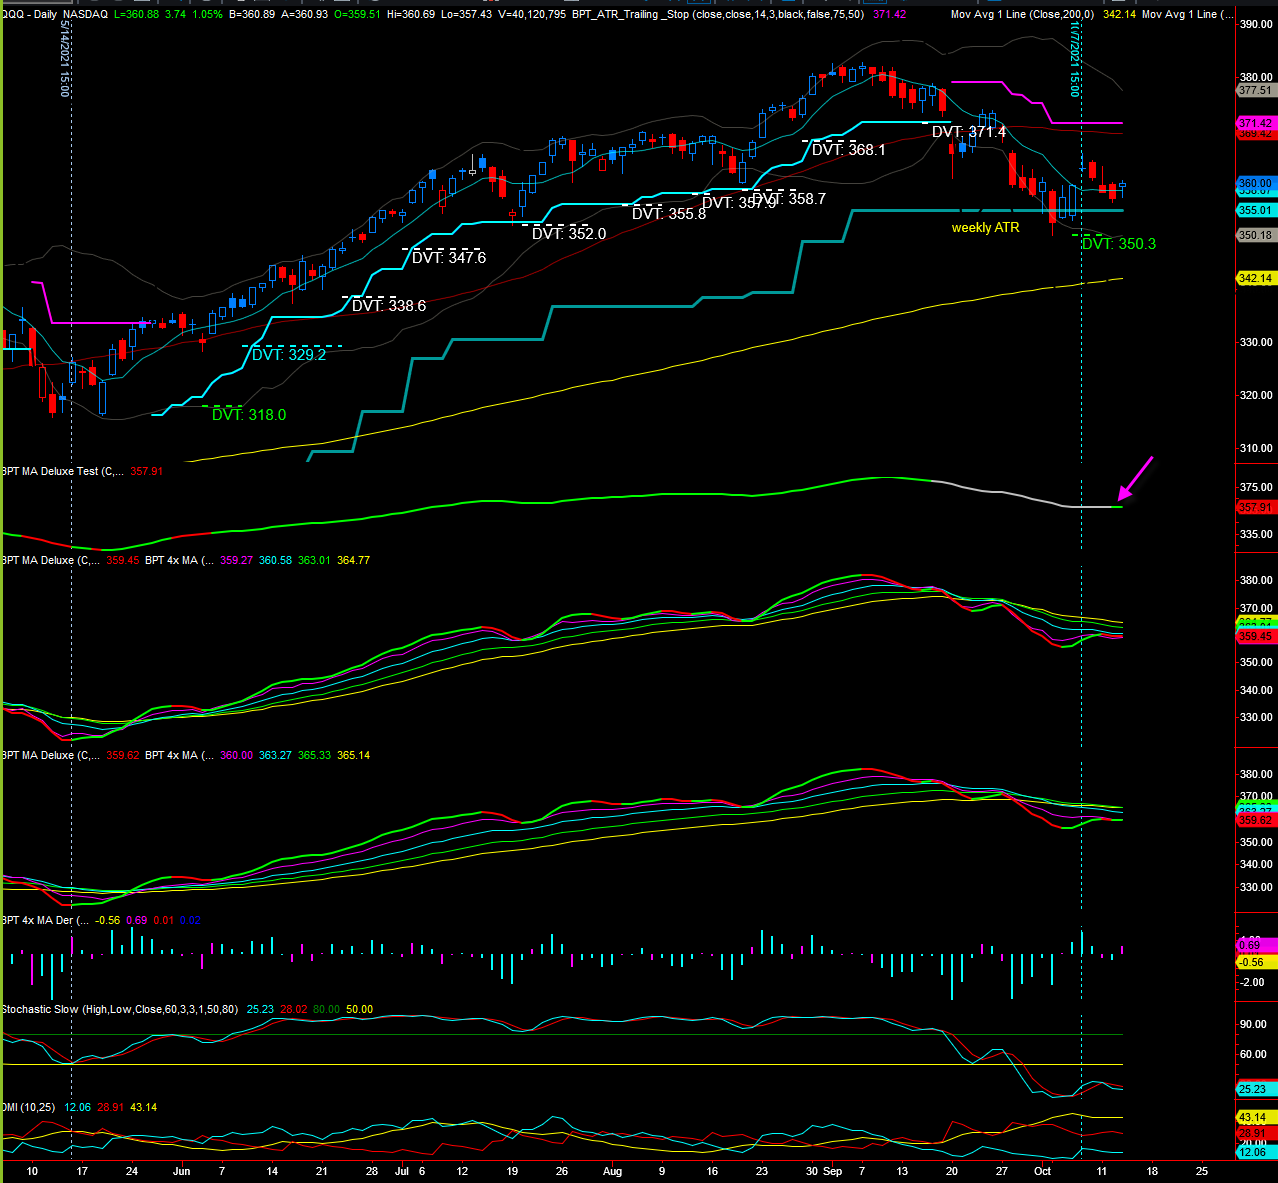
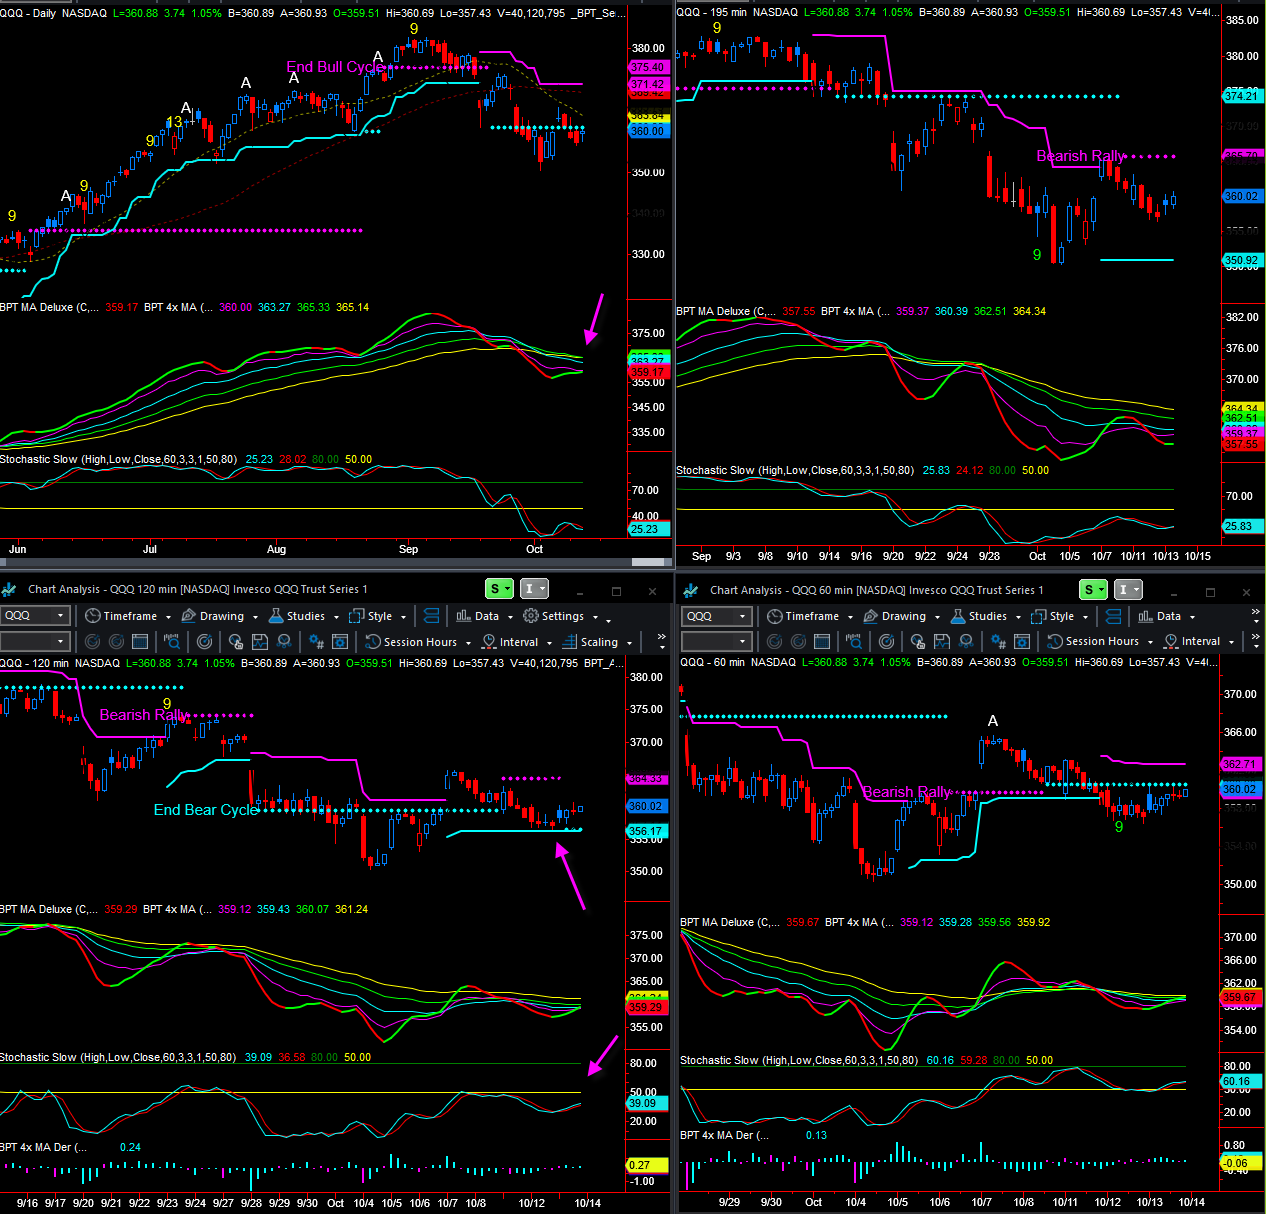
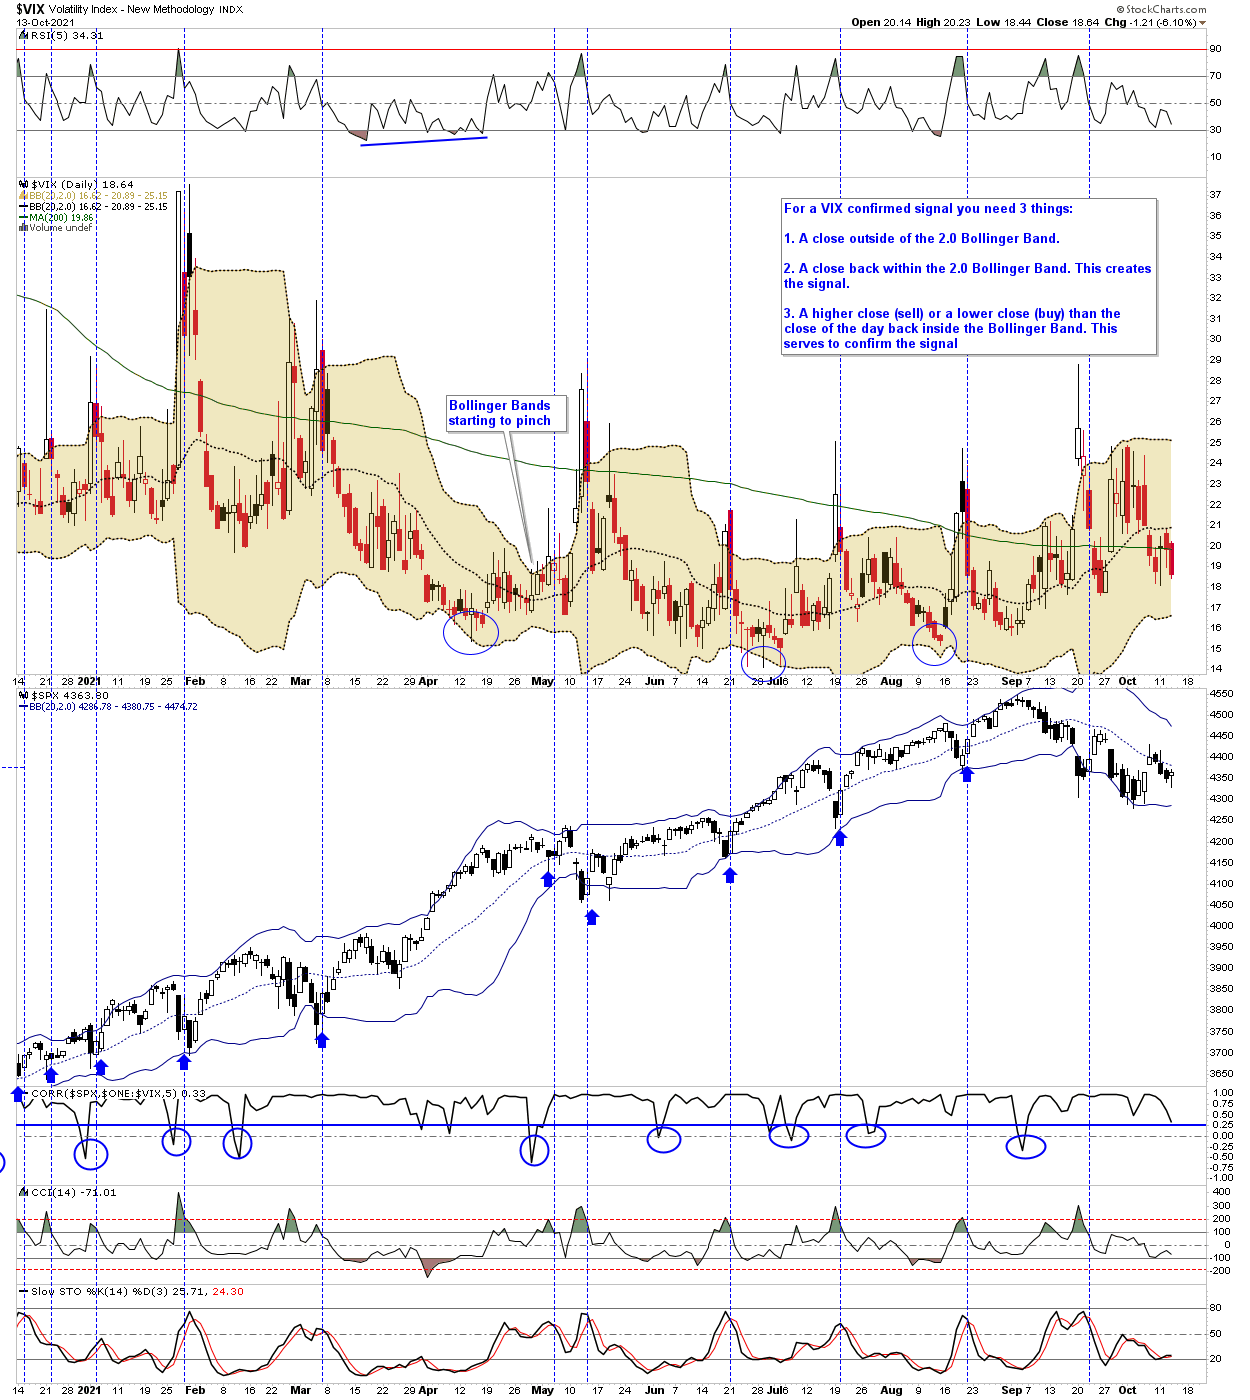
Quick Notes: The market held in once again, despite a little weakness in the morning, with all the major indexes closing positive for the day. The SPX rallied near a 61.8% Fib retracement zone, which was a positive. A pattern I'm monitor for the SPX is a potential diamond or sloppy inverse H&S pattern. Otherwise the onus is still on the Bulls.
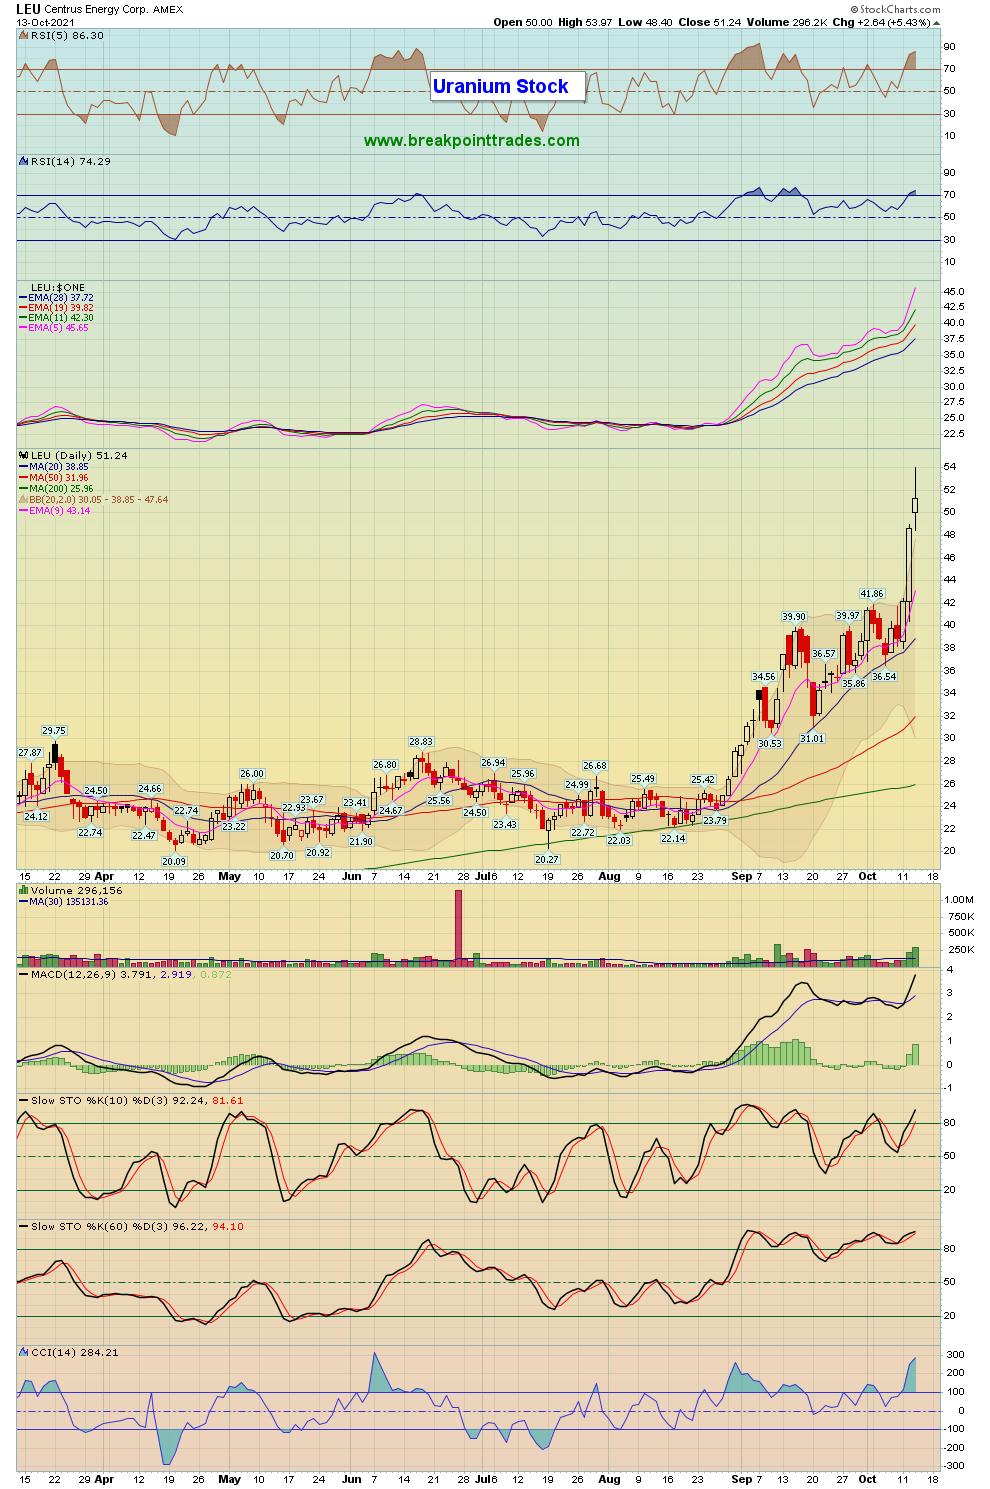
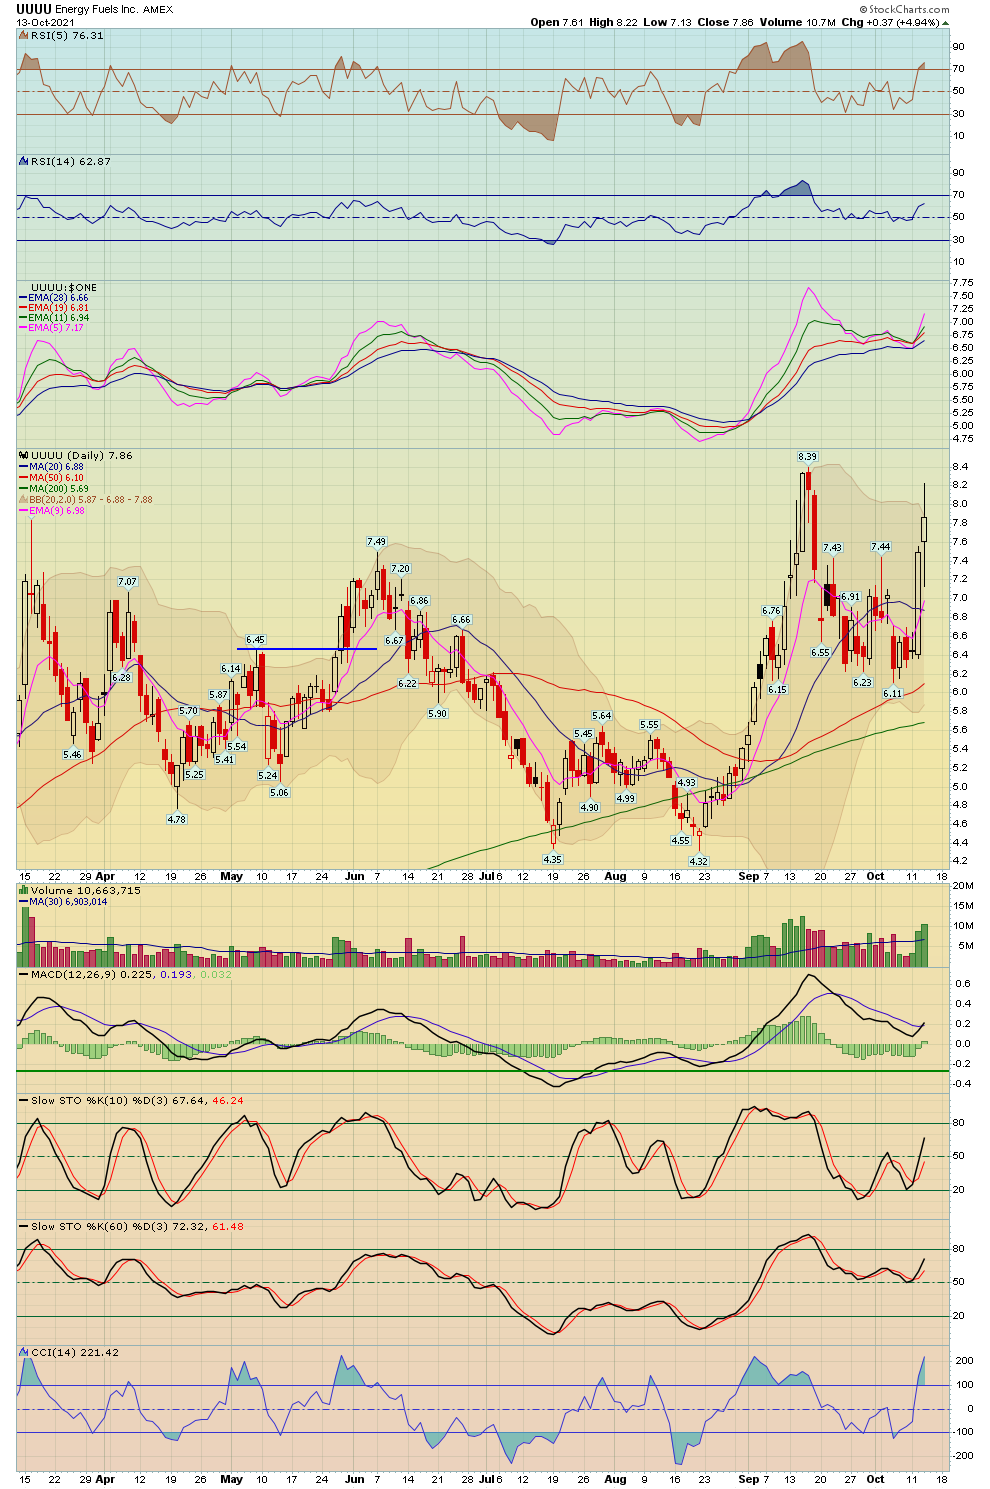
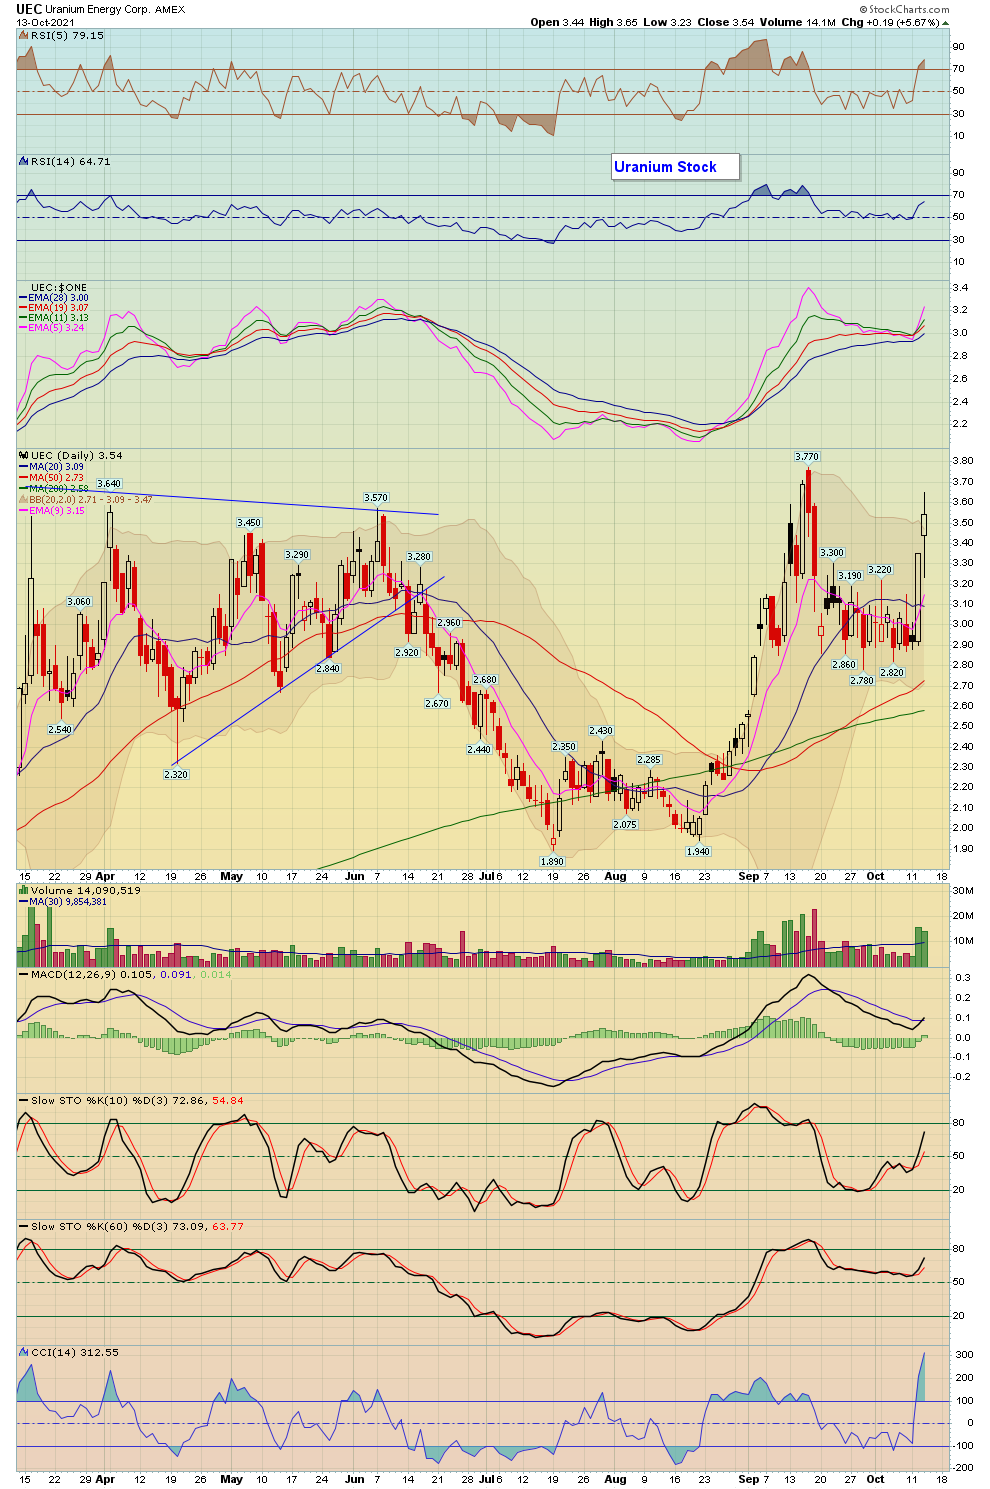
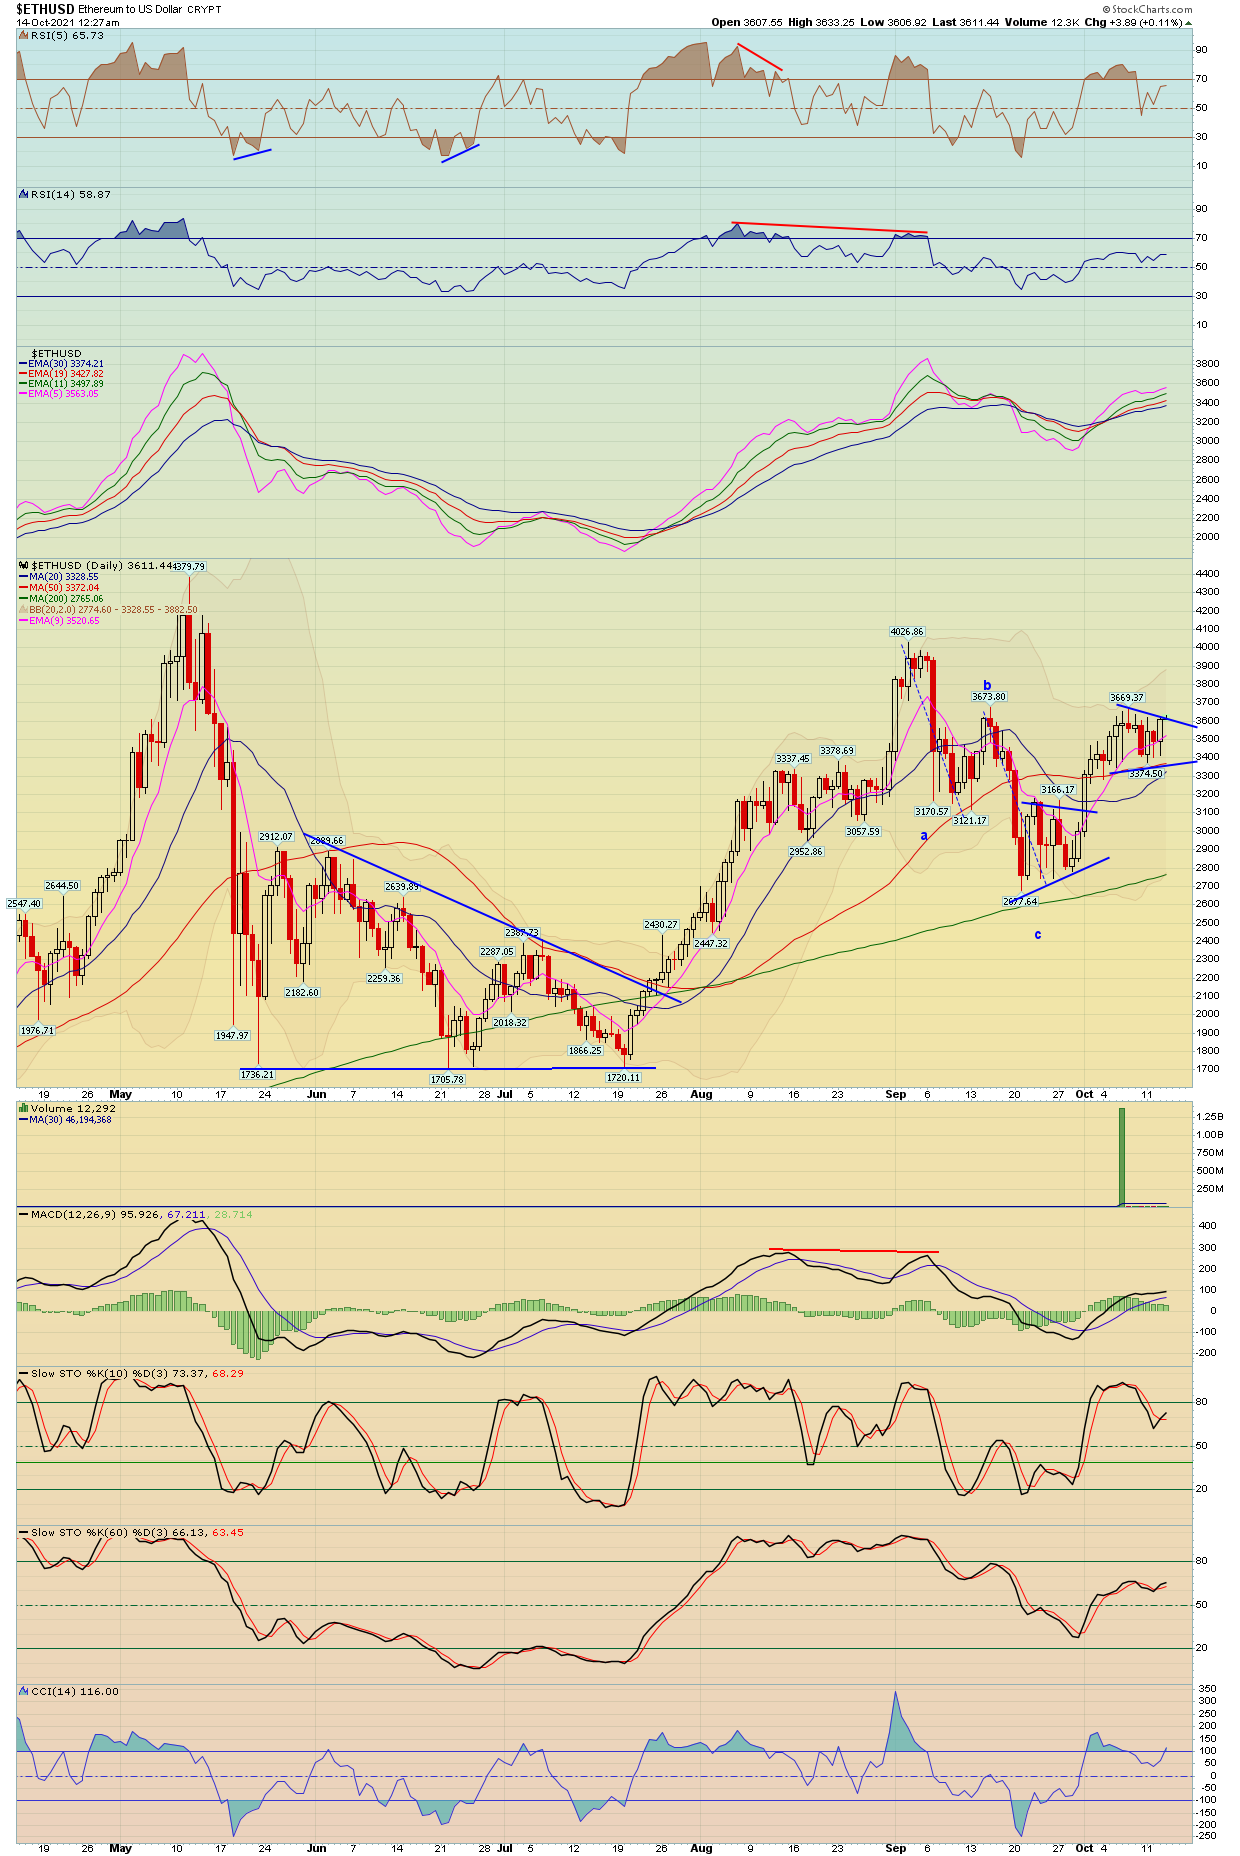
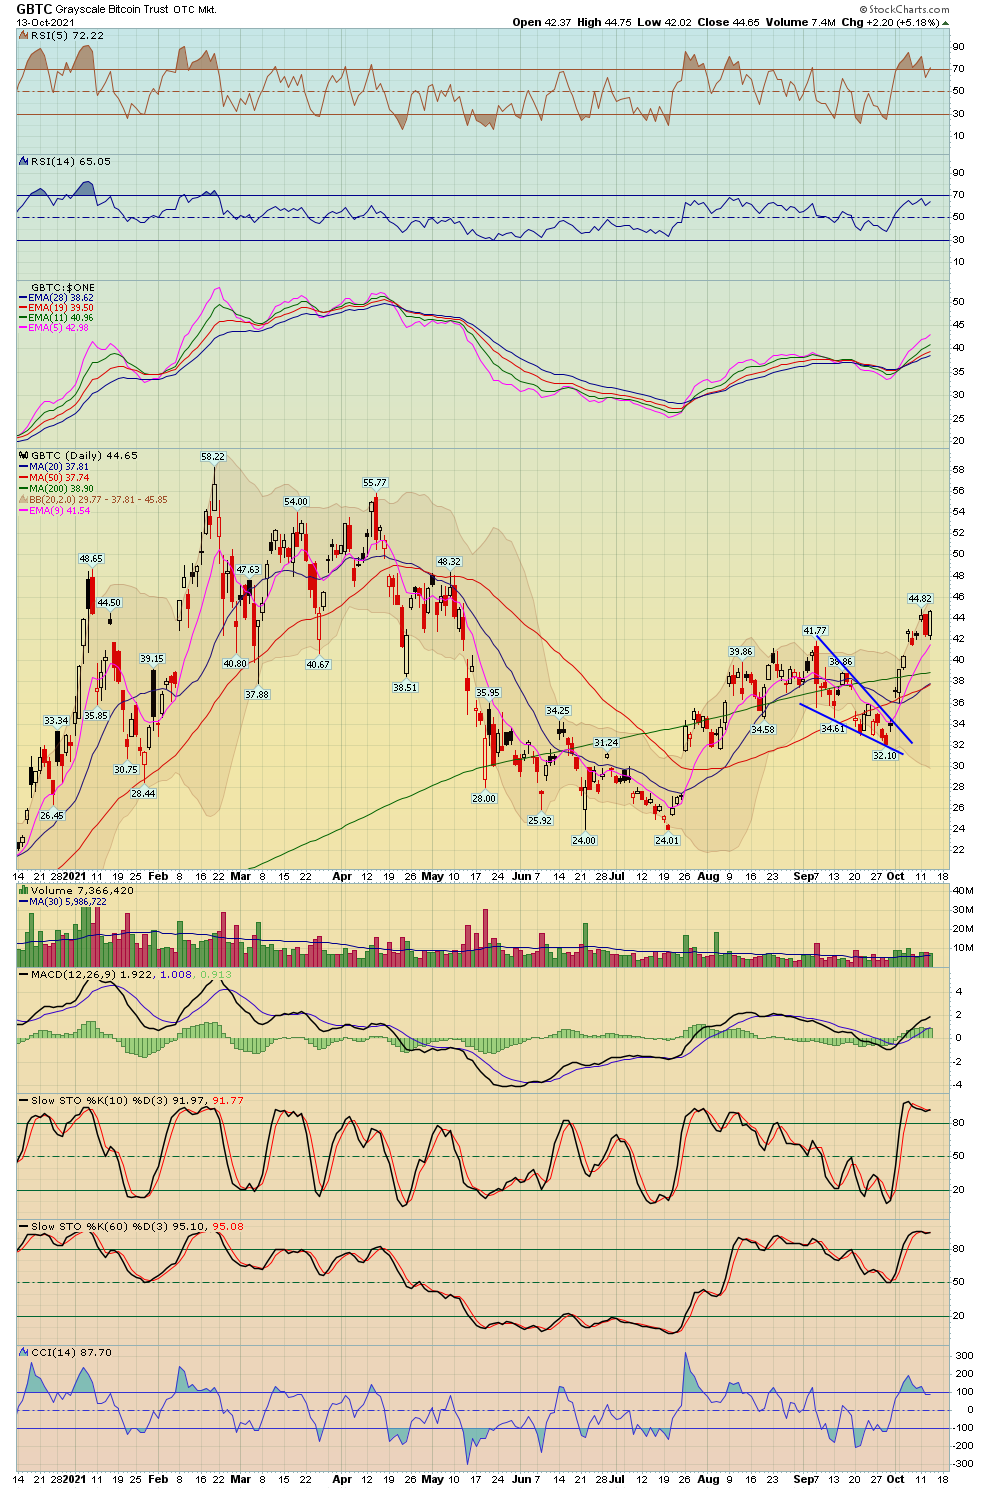
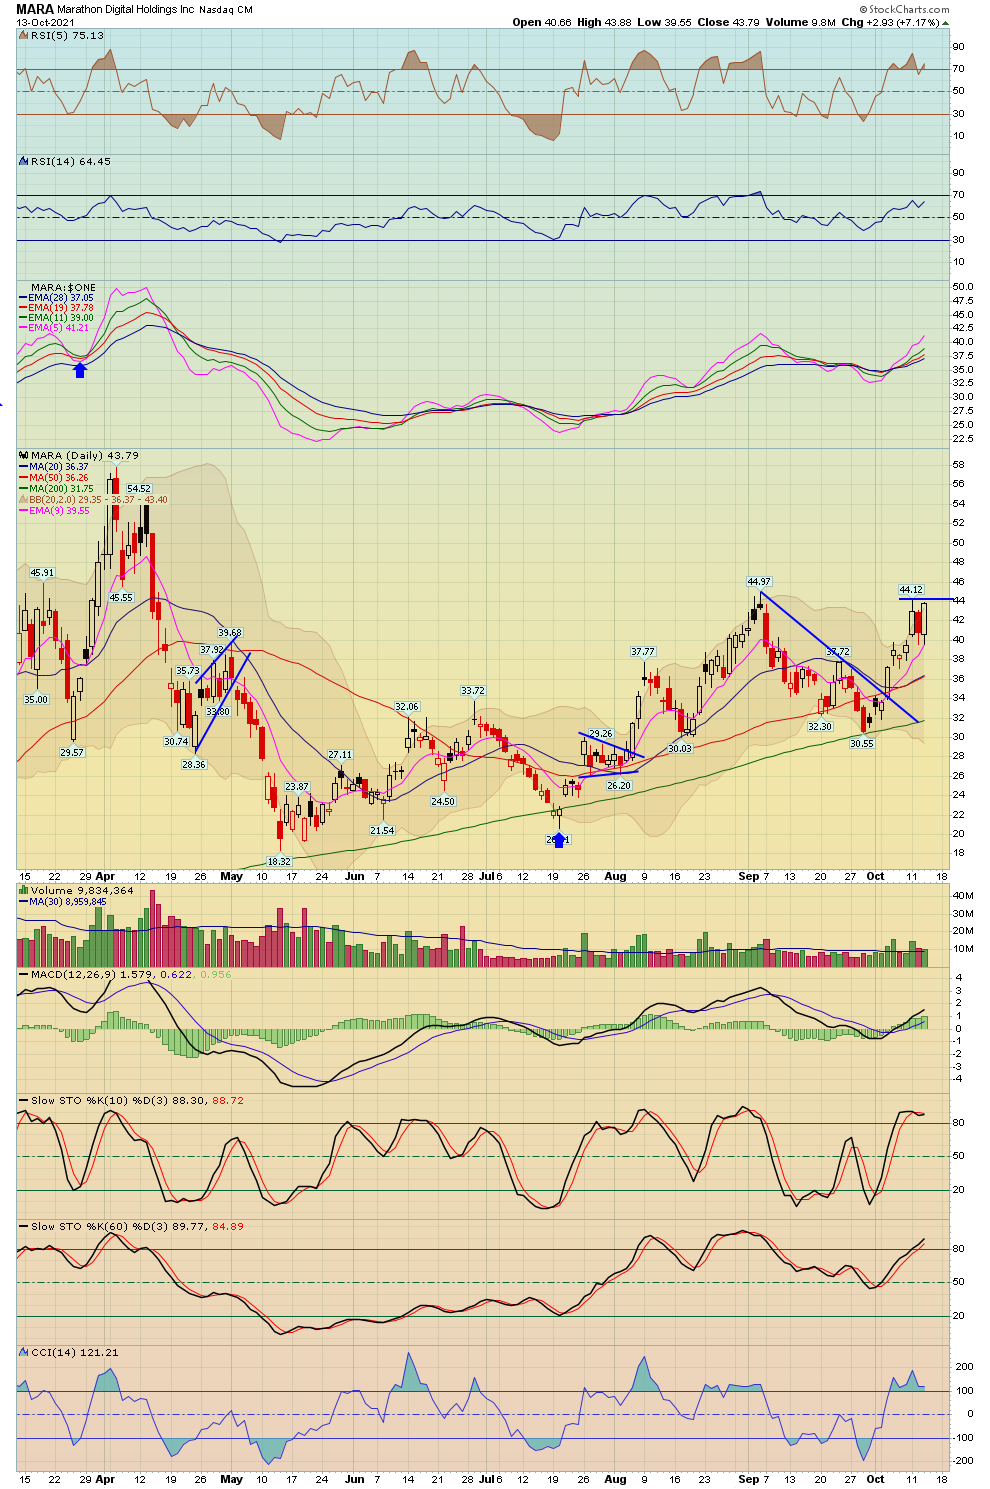
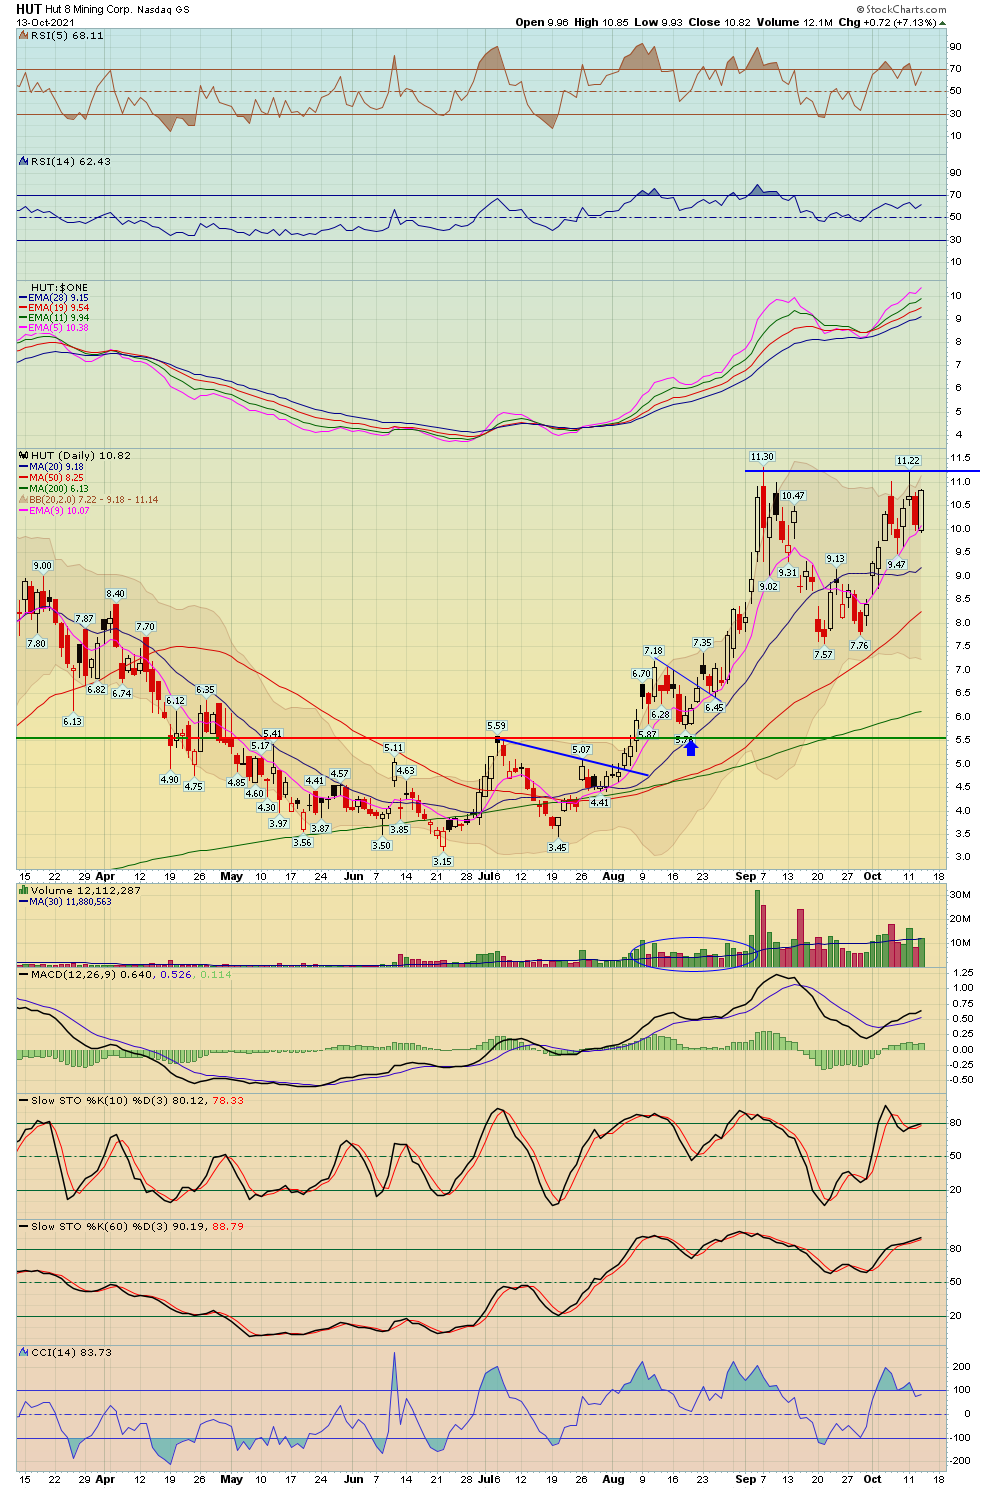
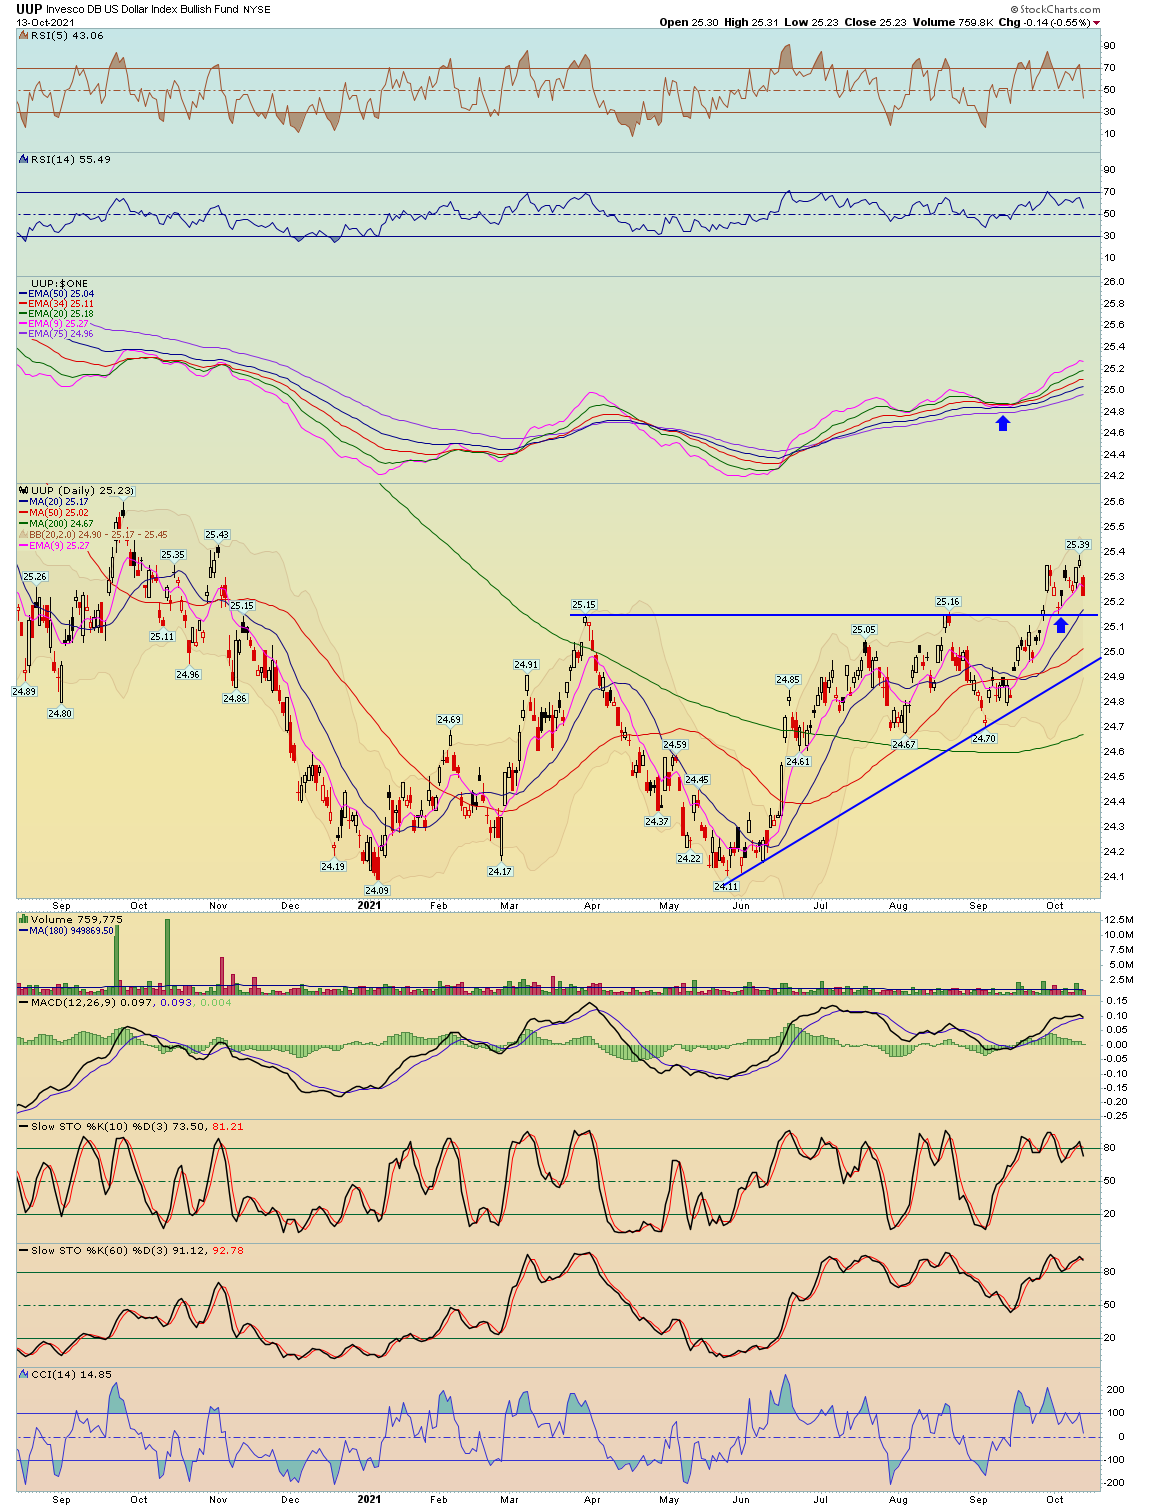
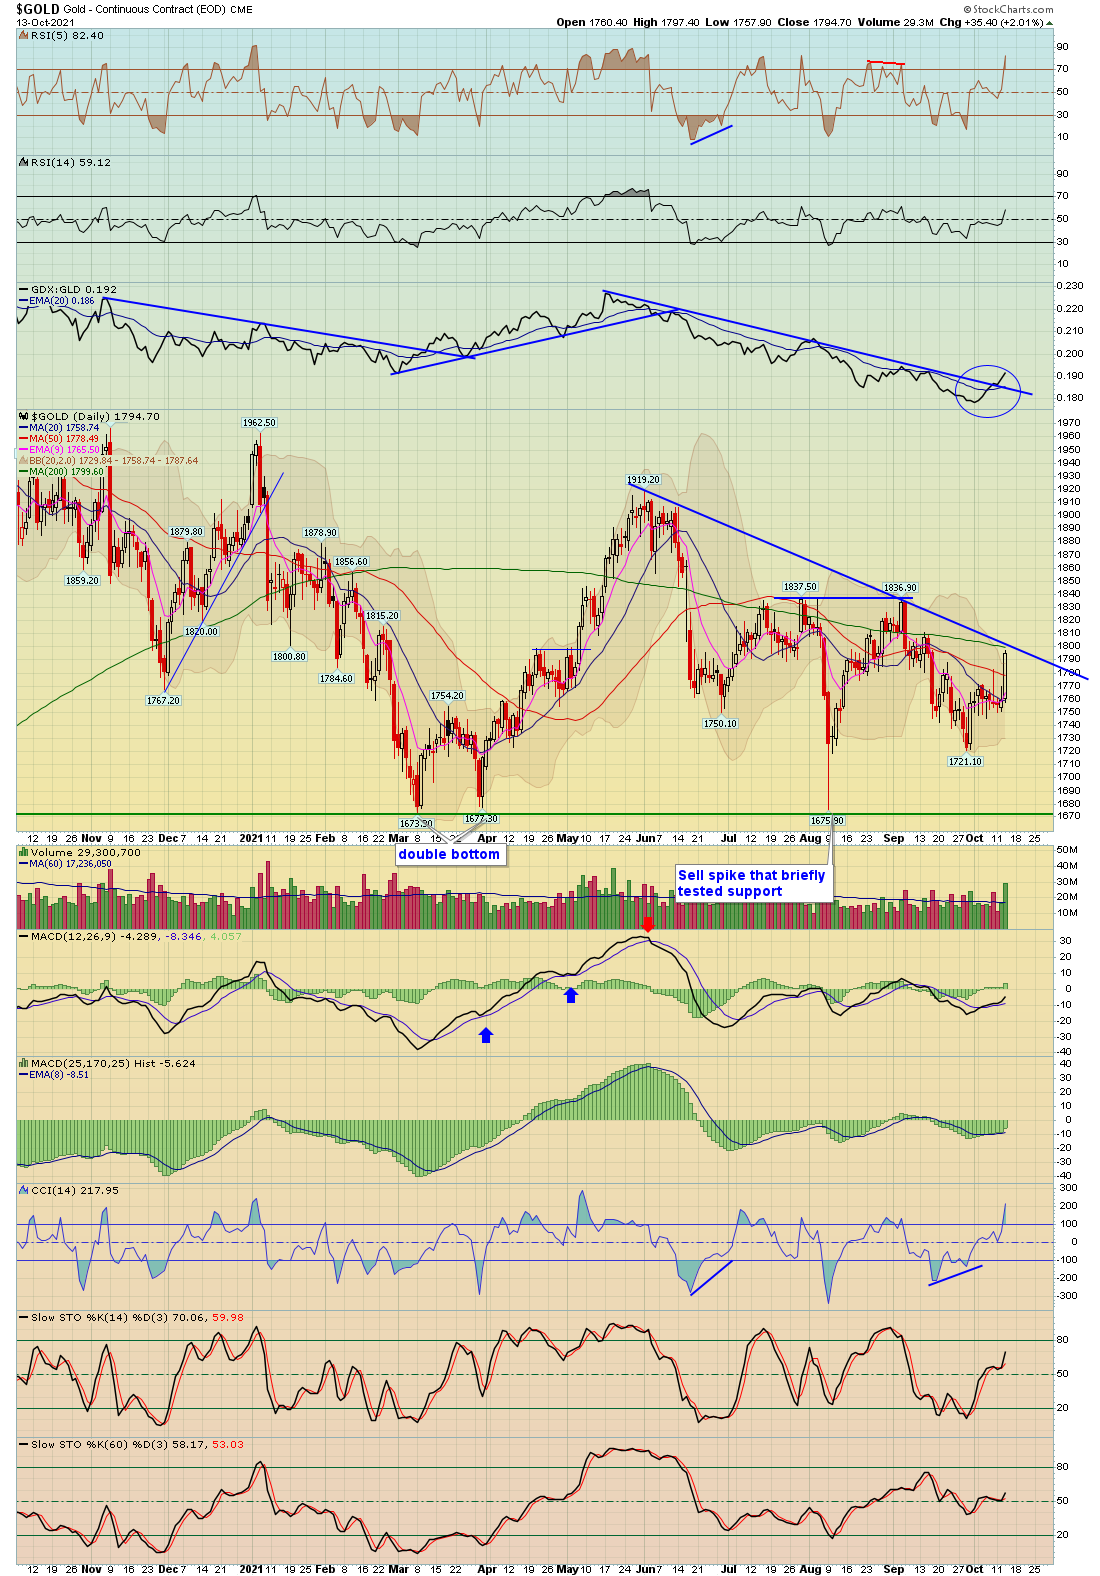
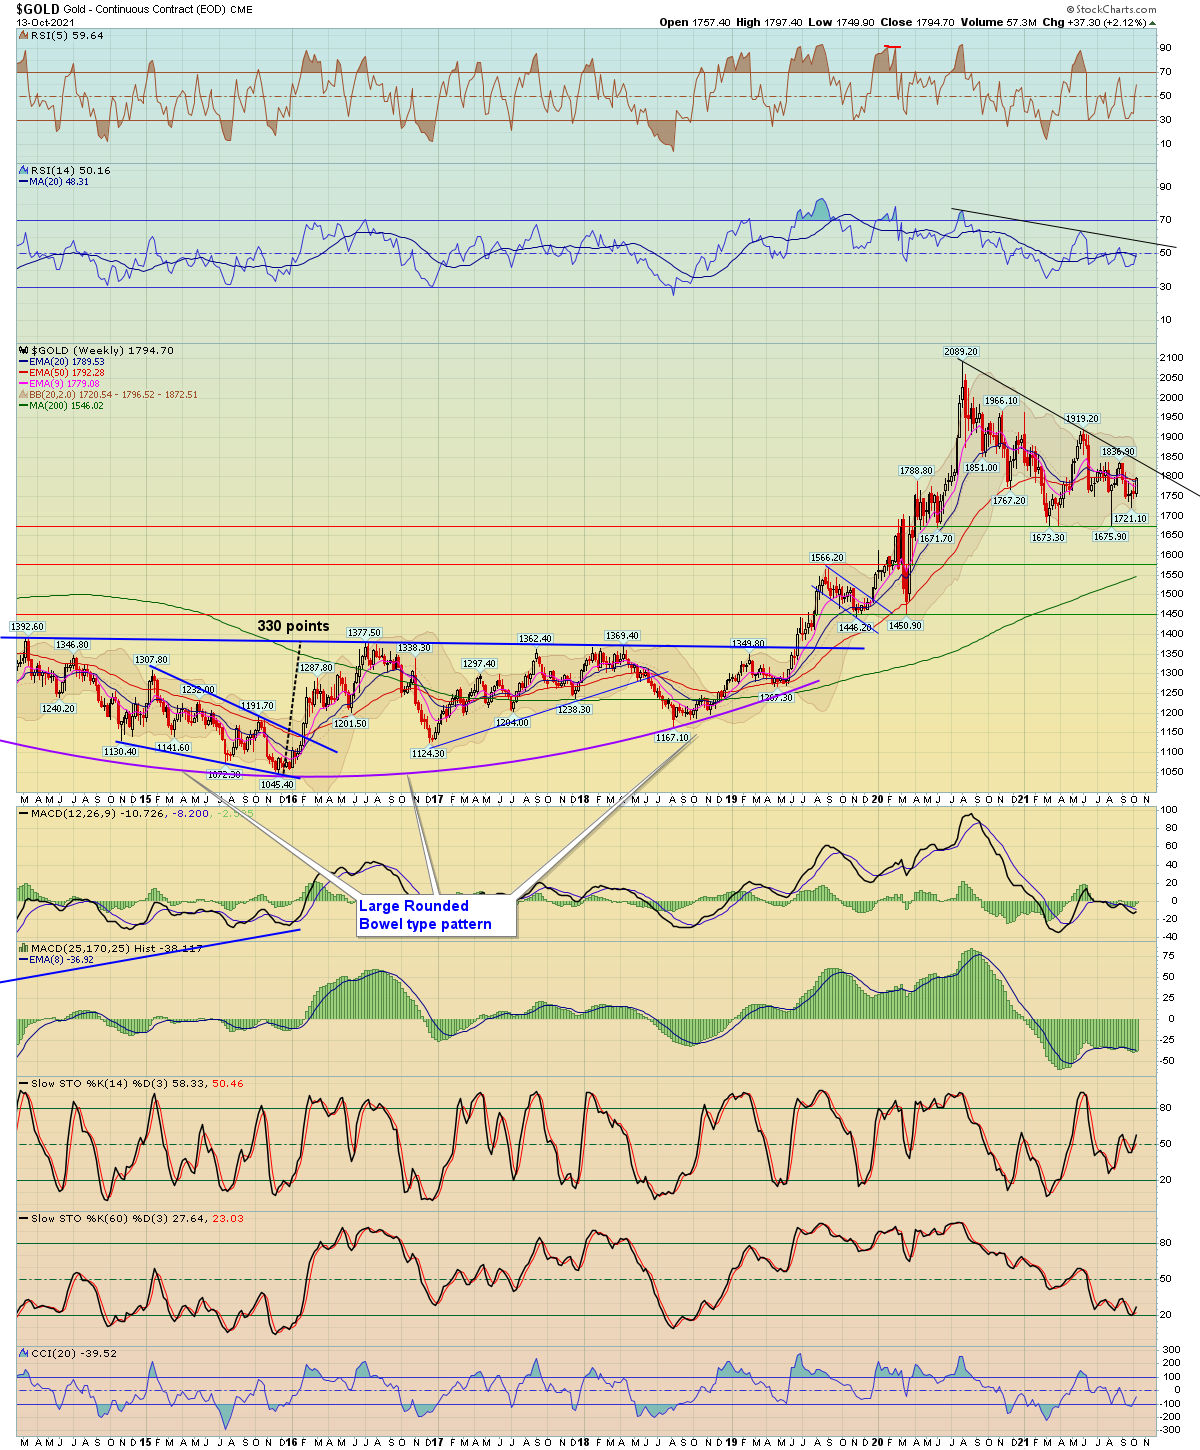
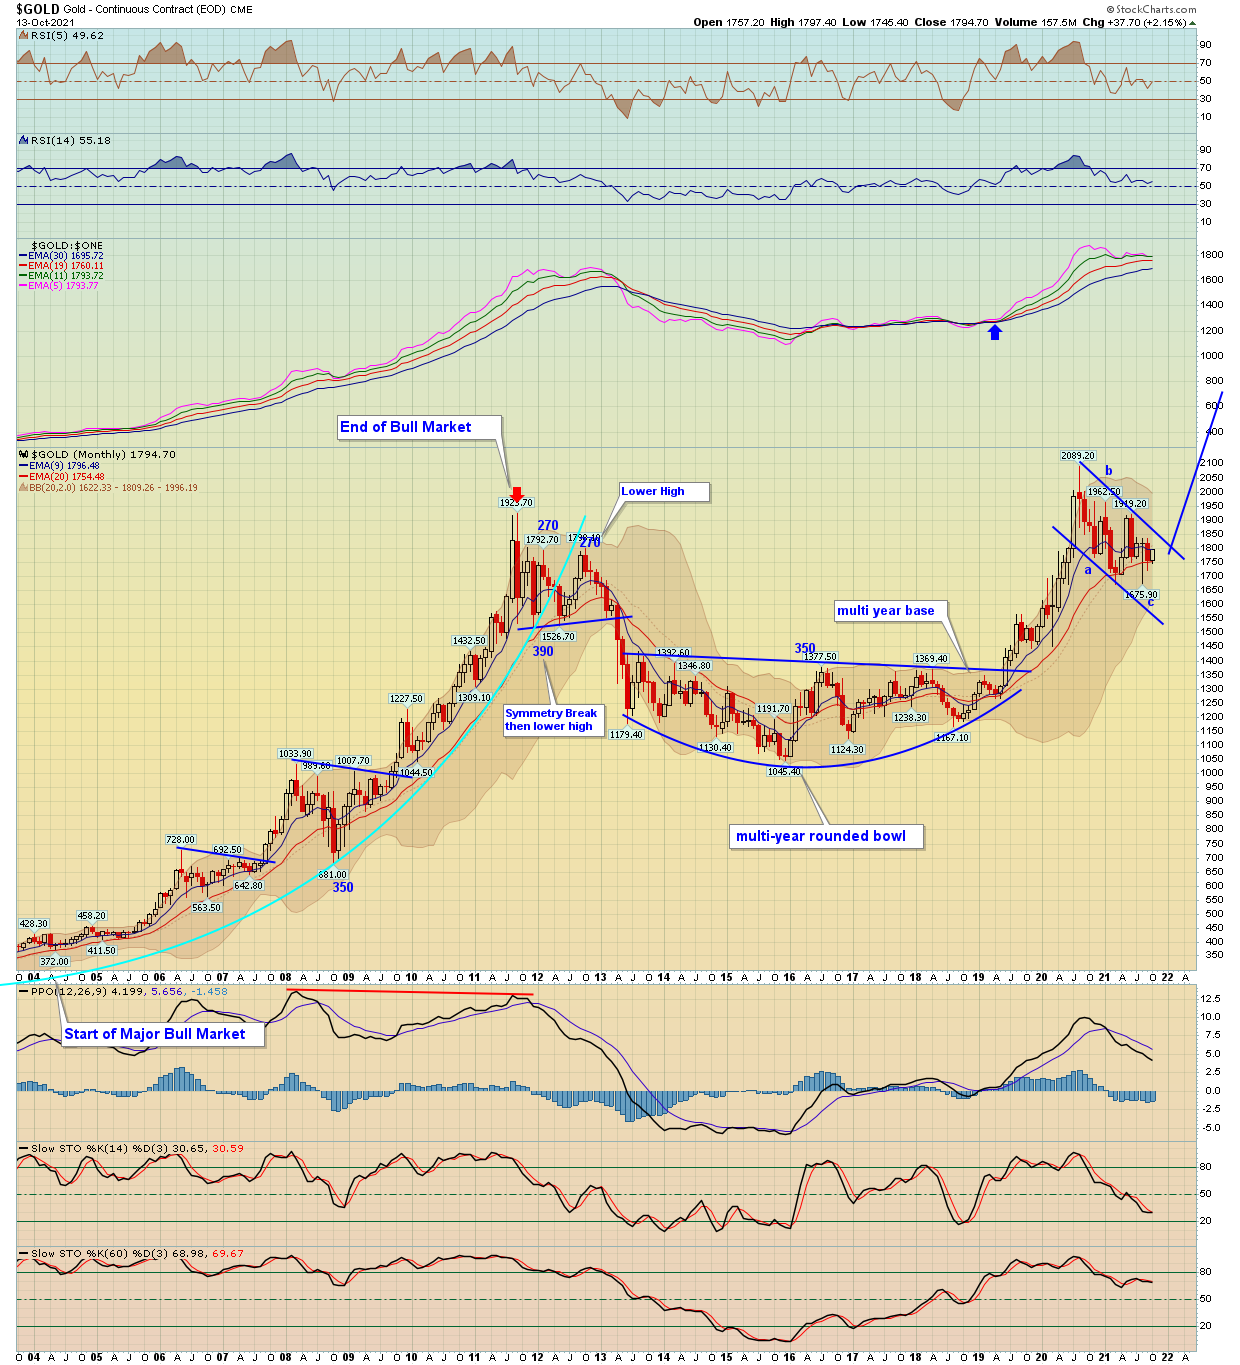
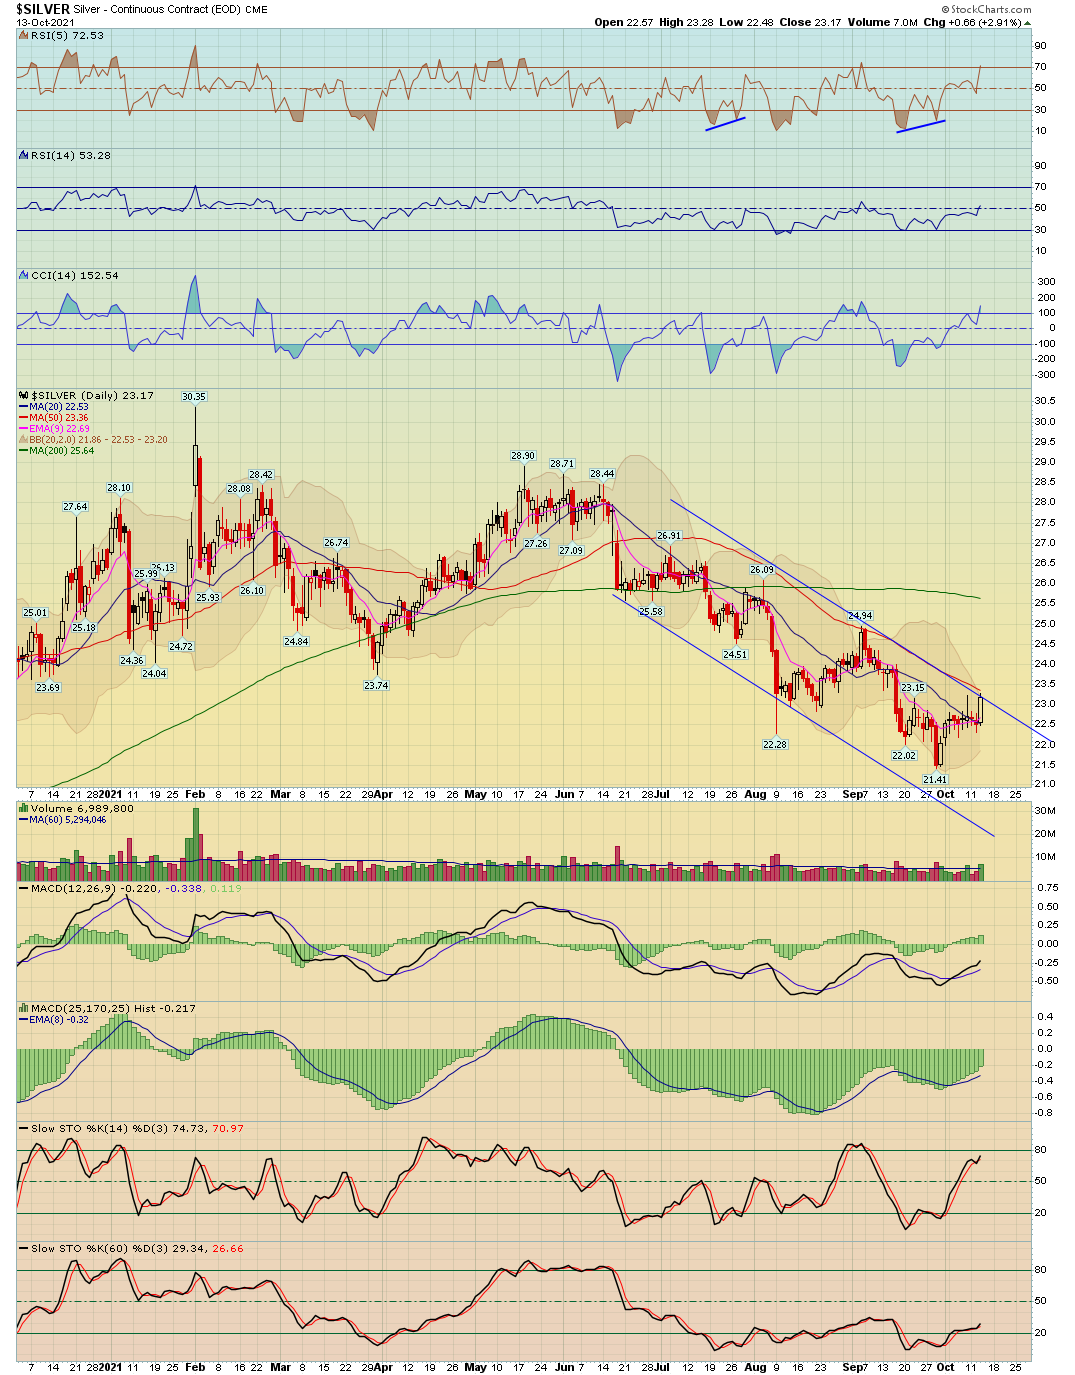
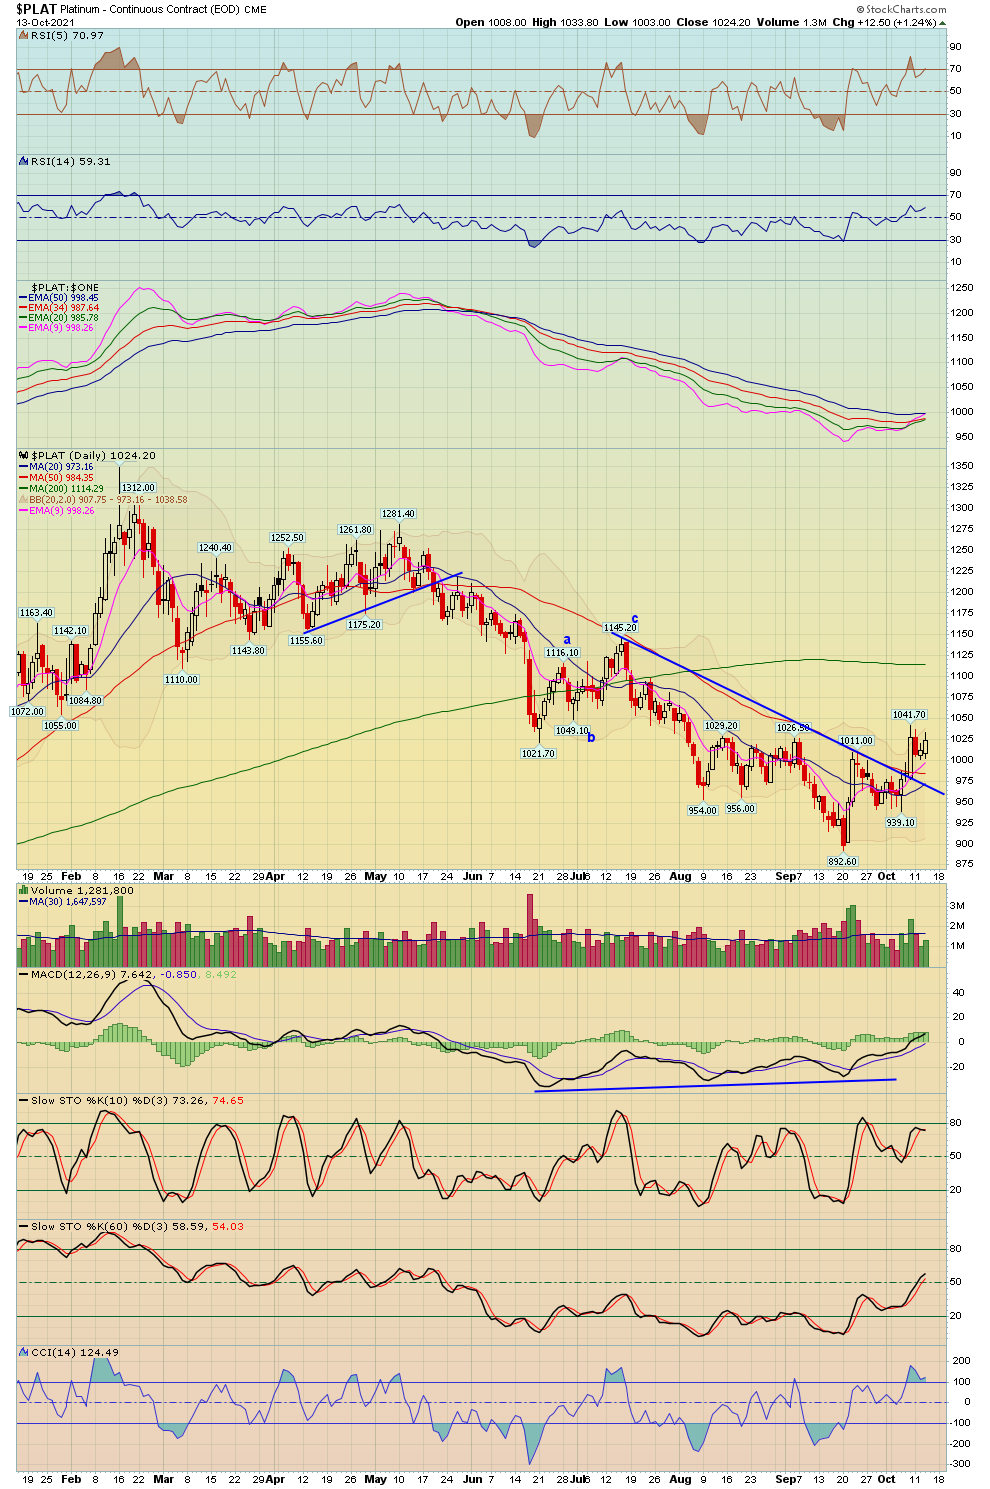
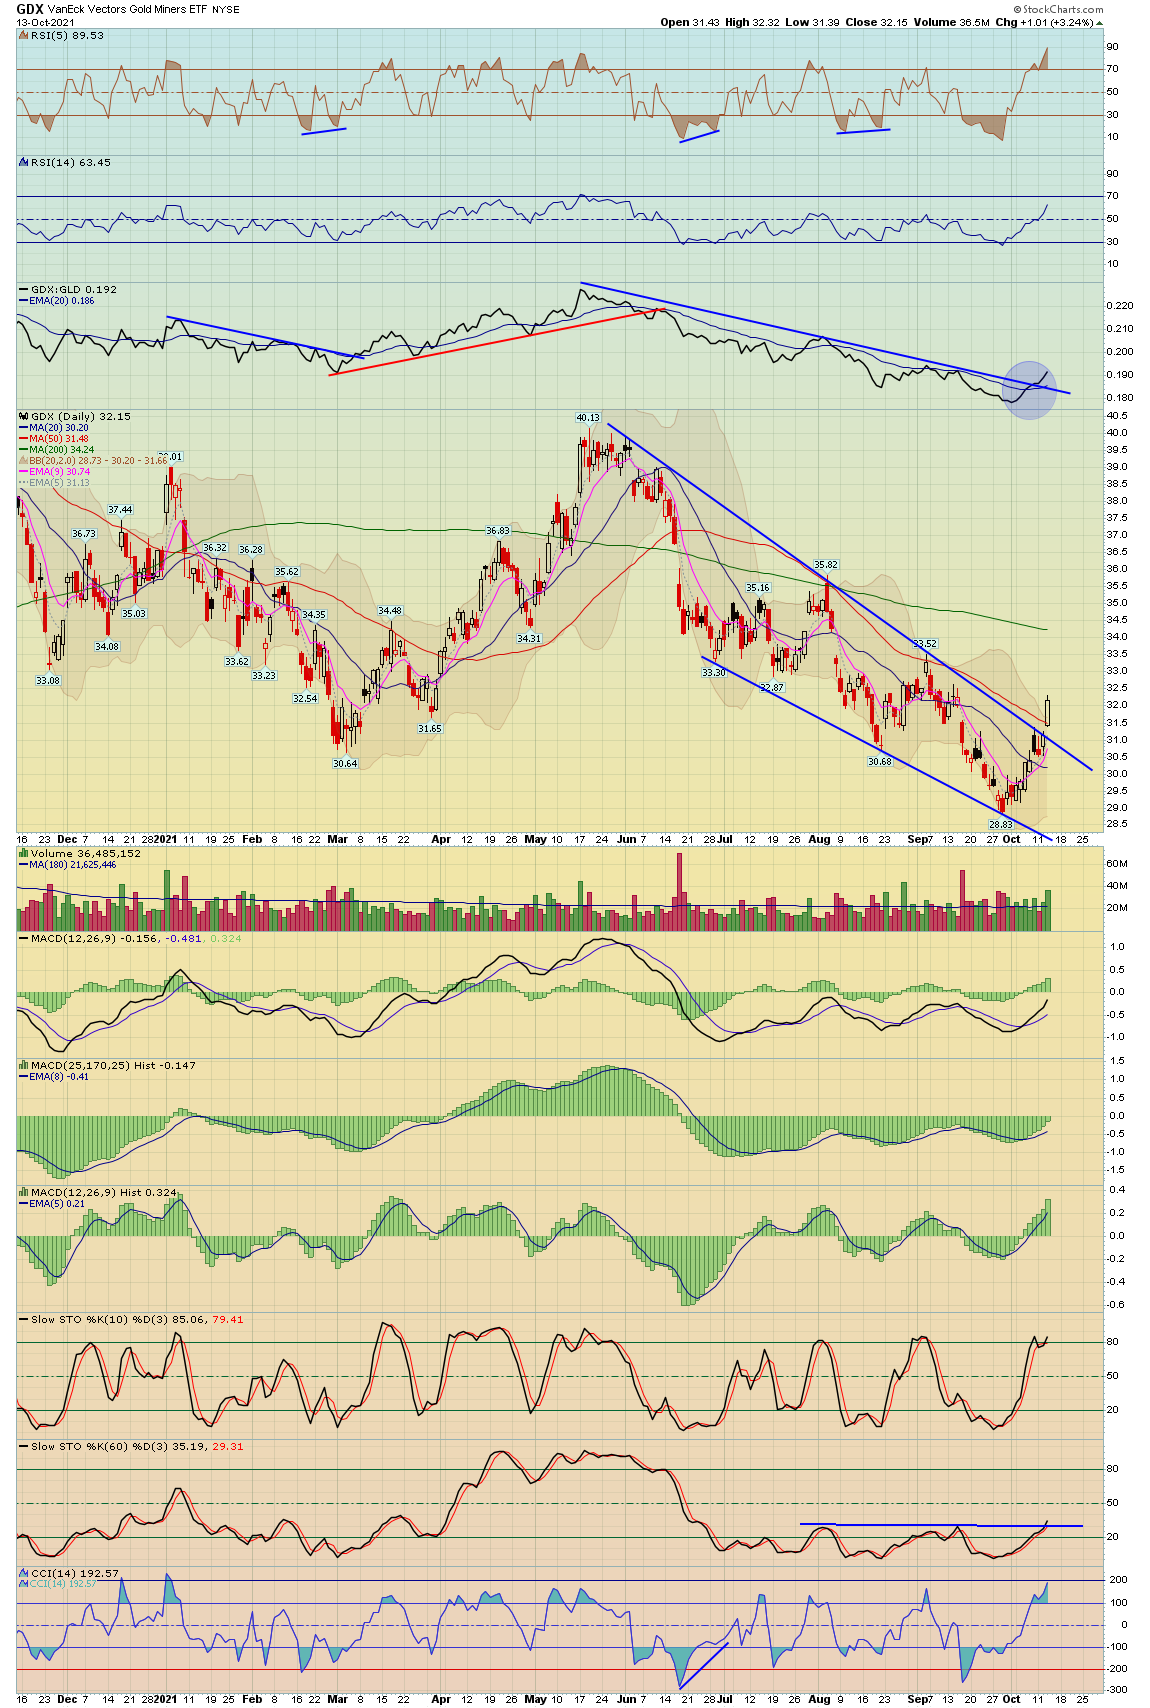
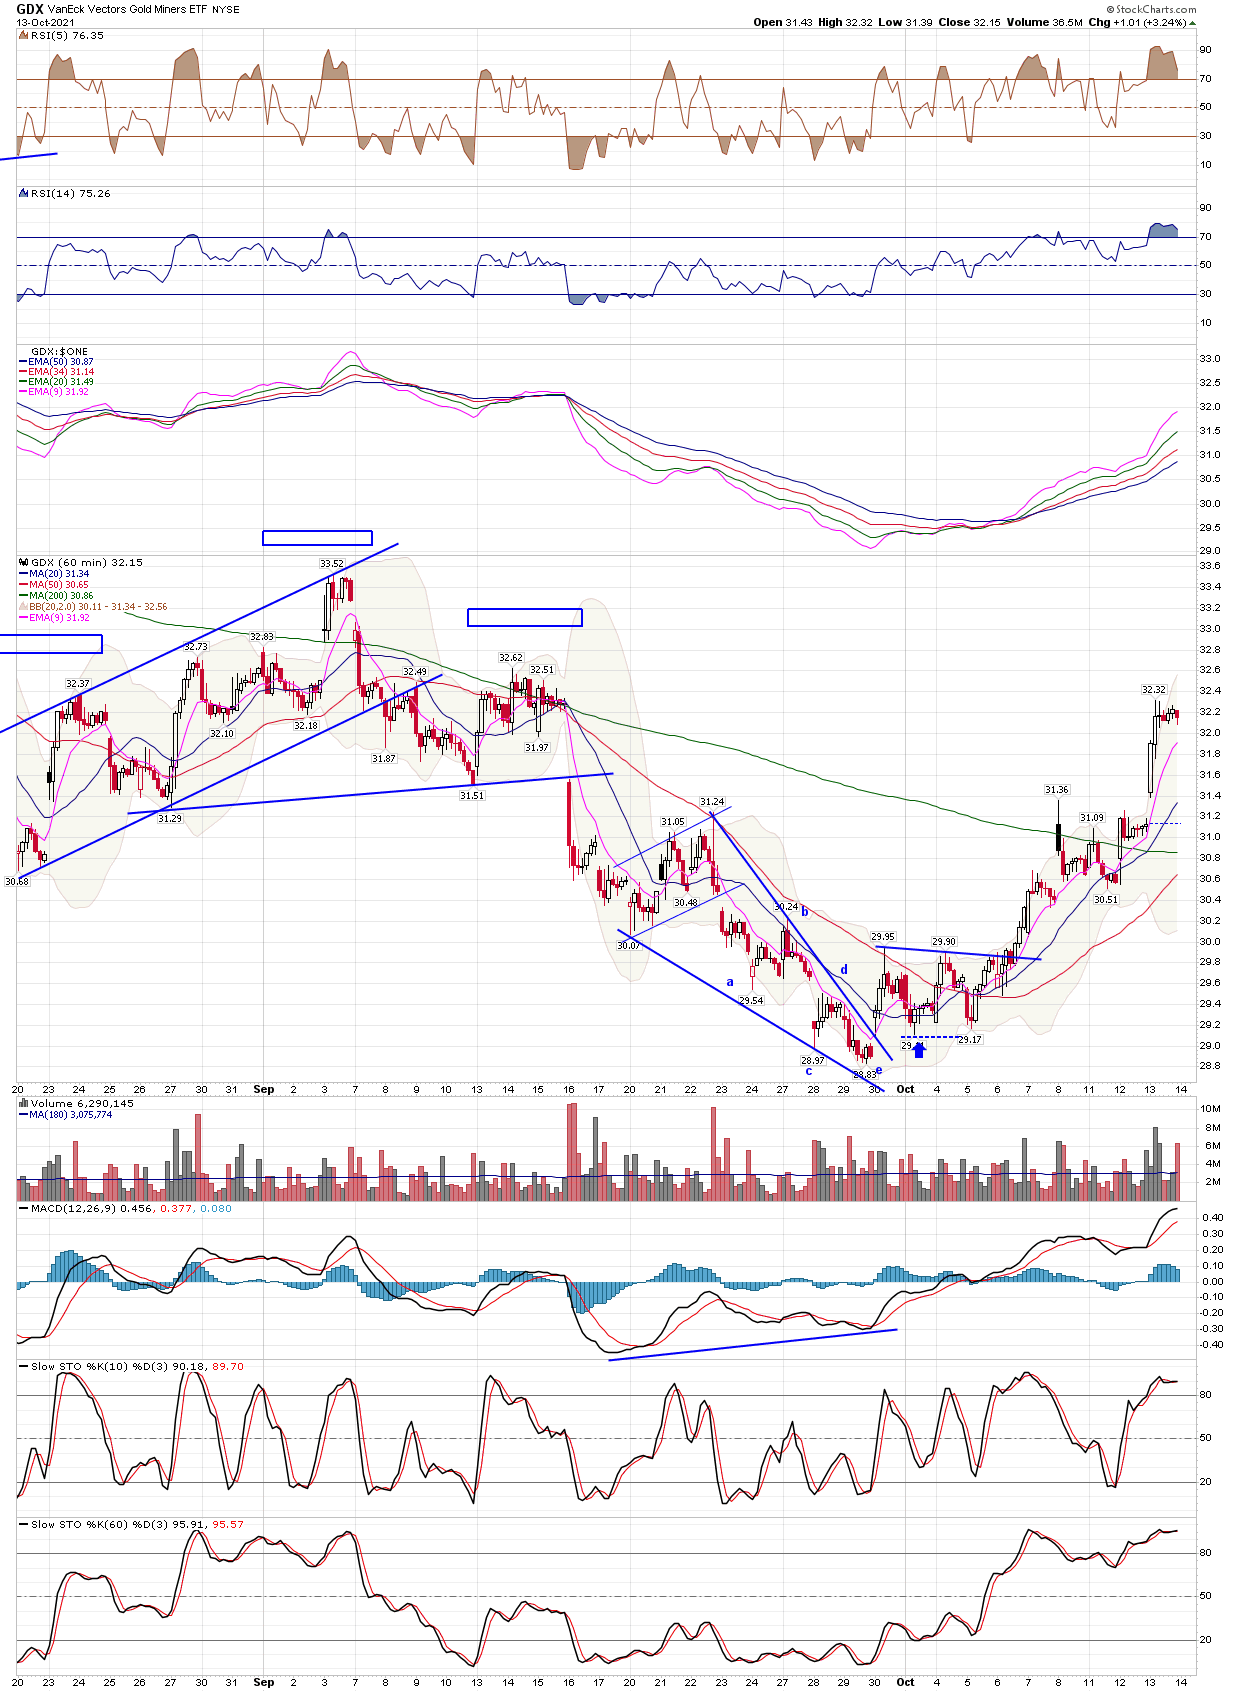
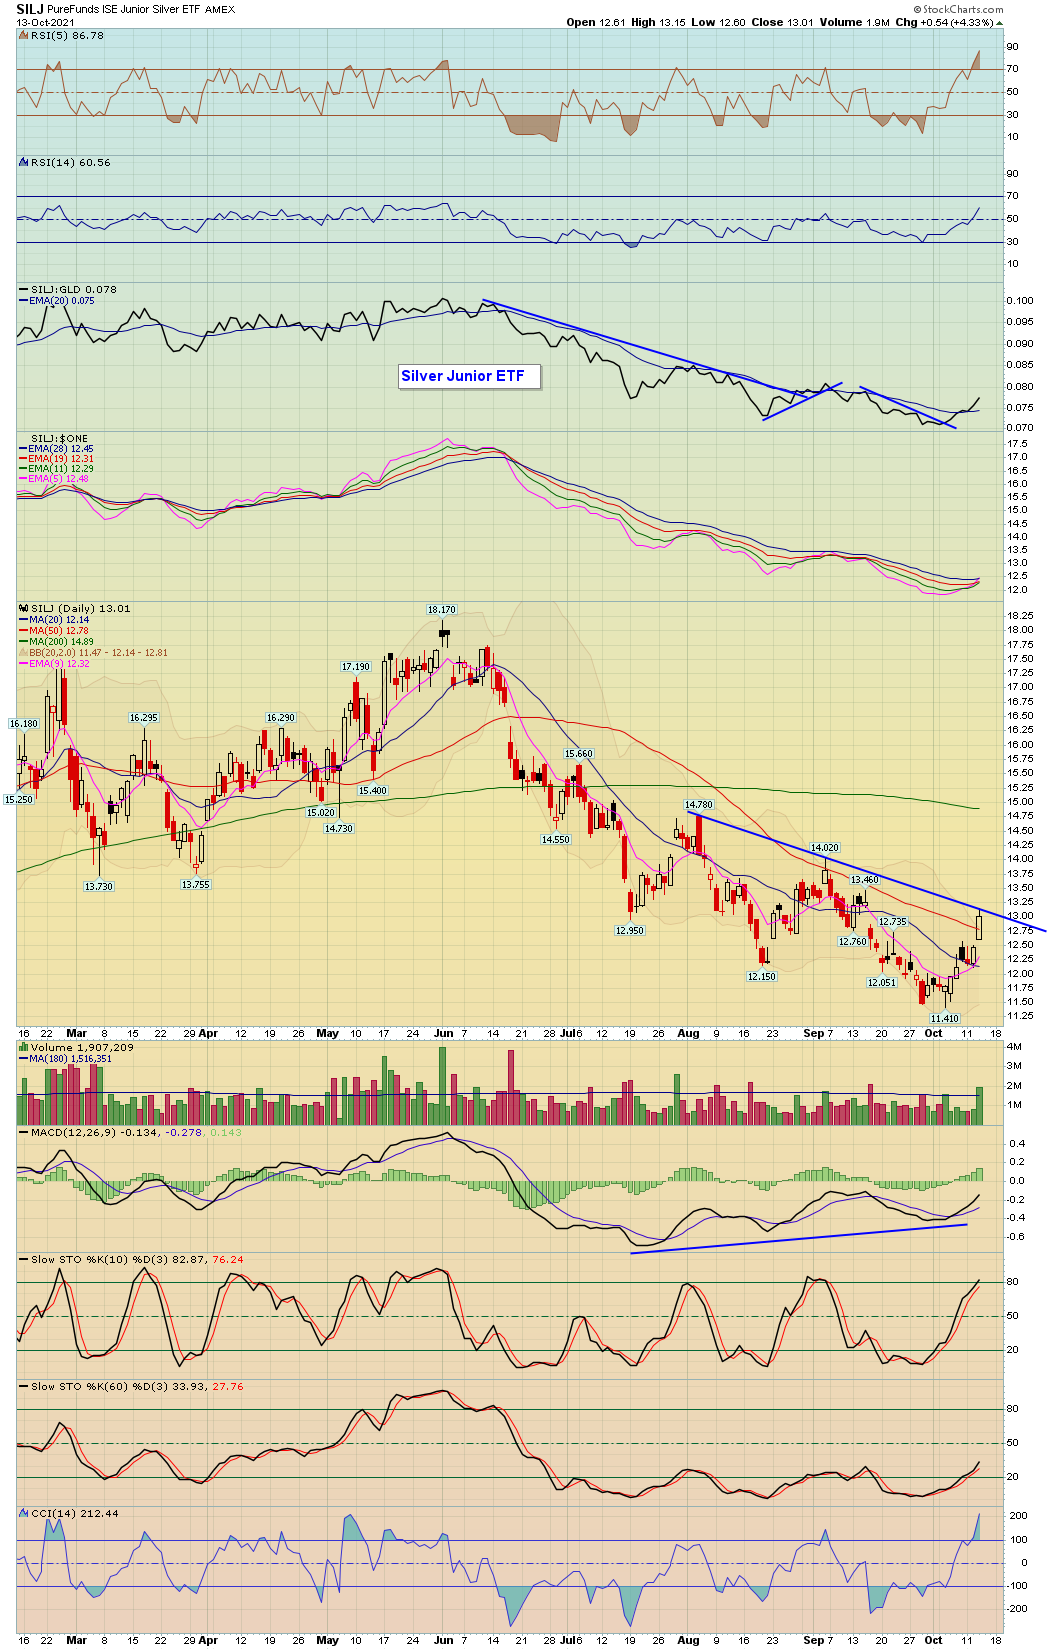
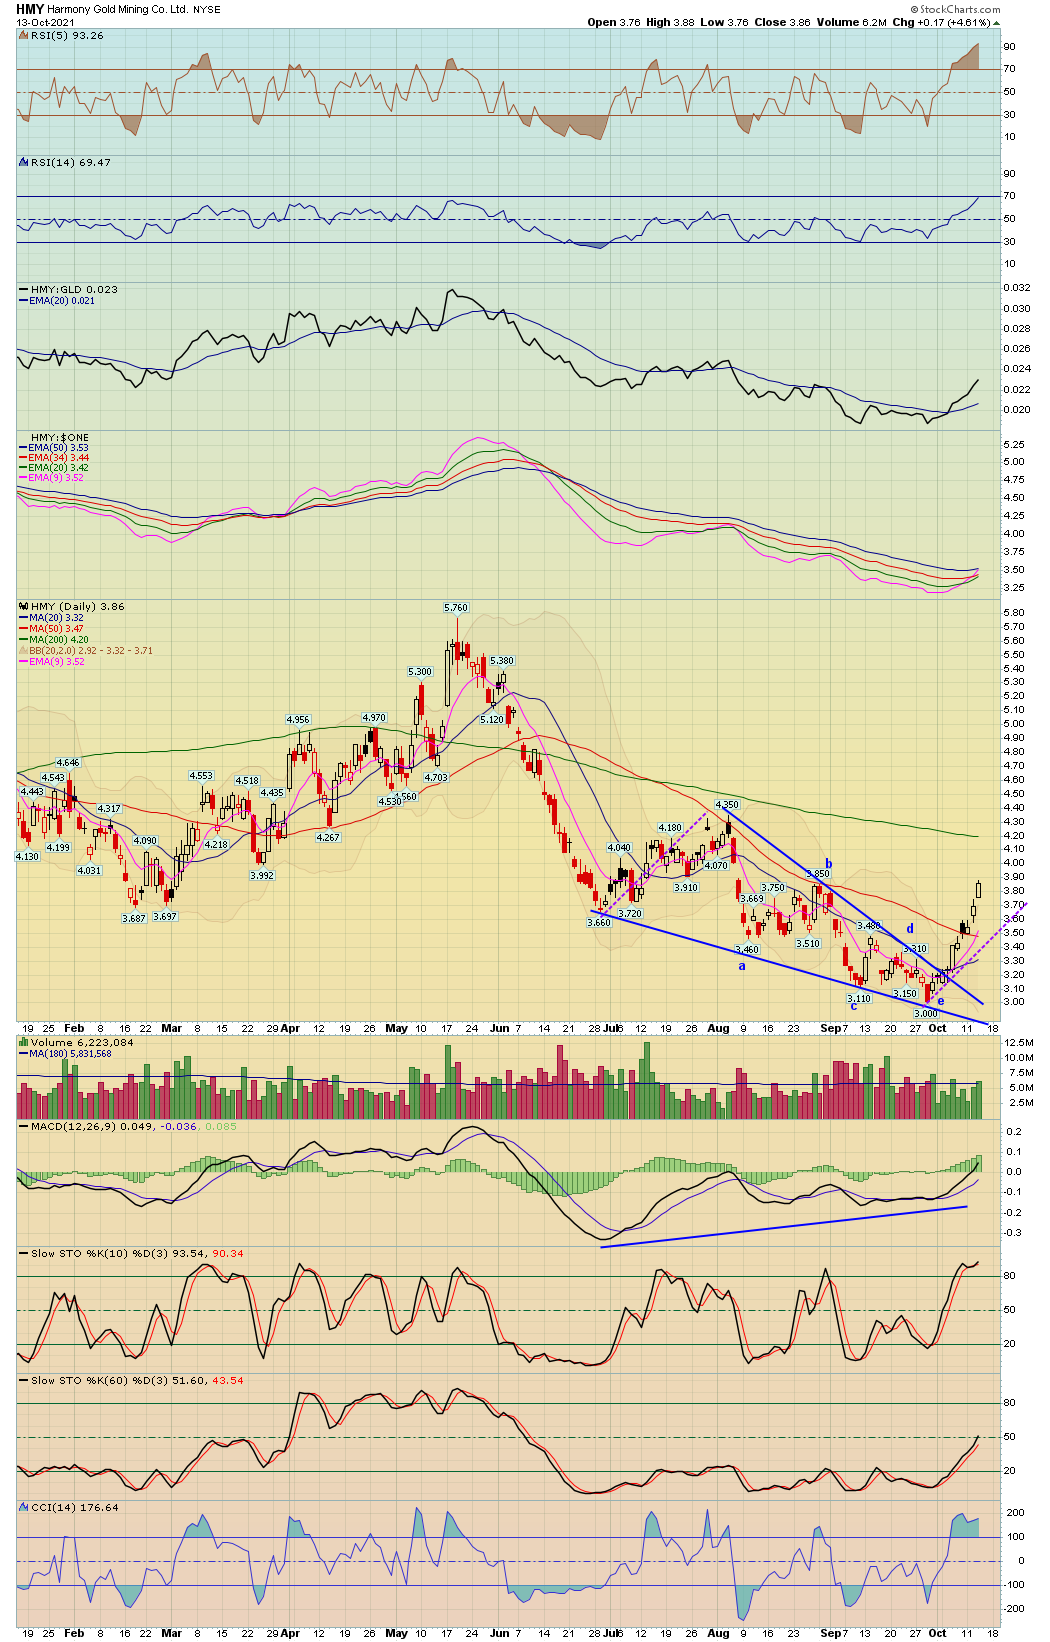
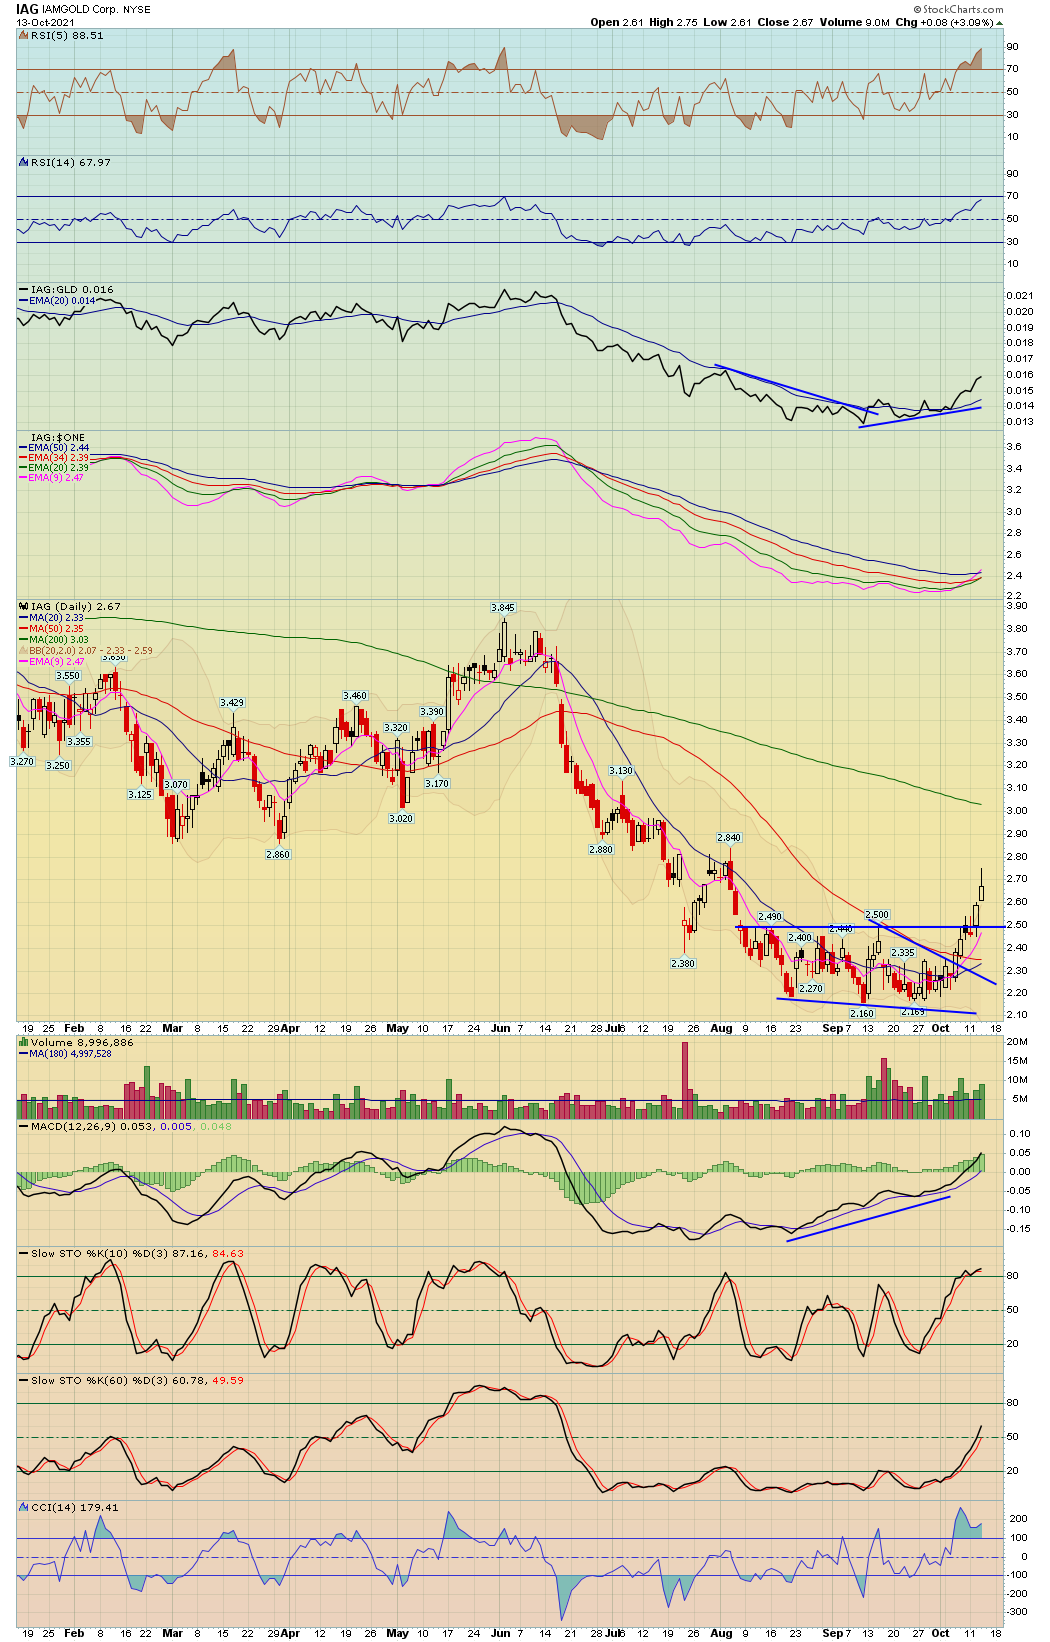
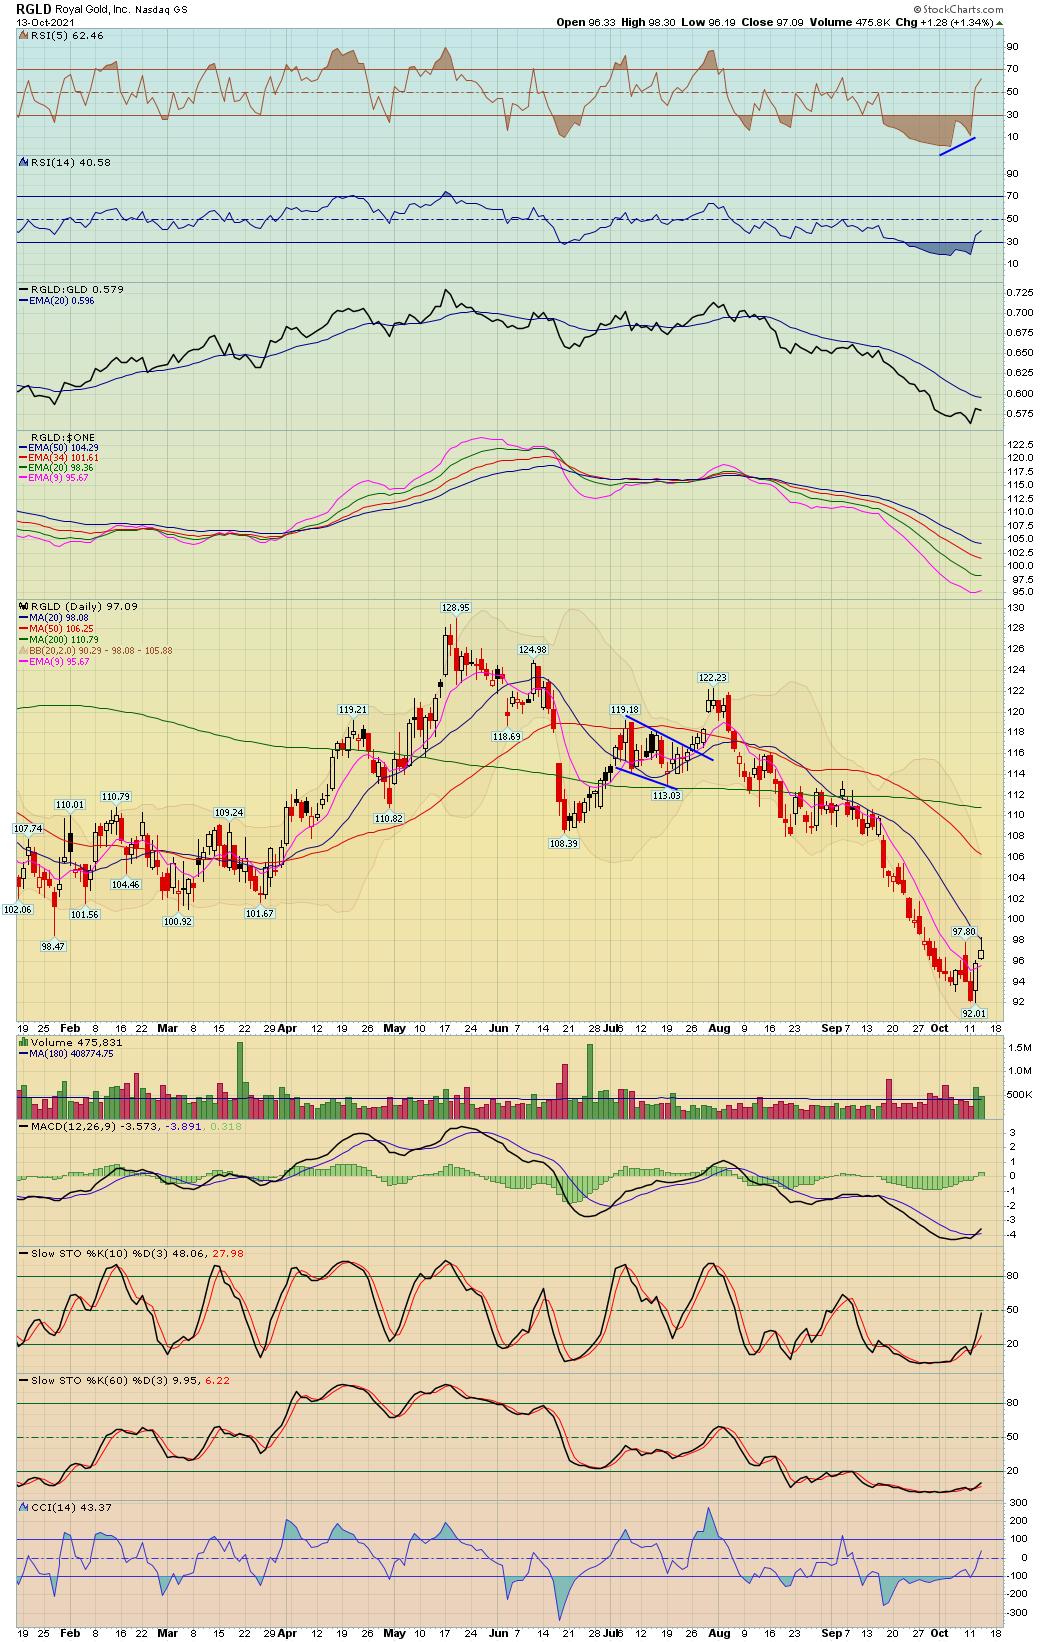
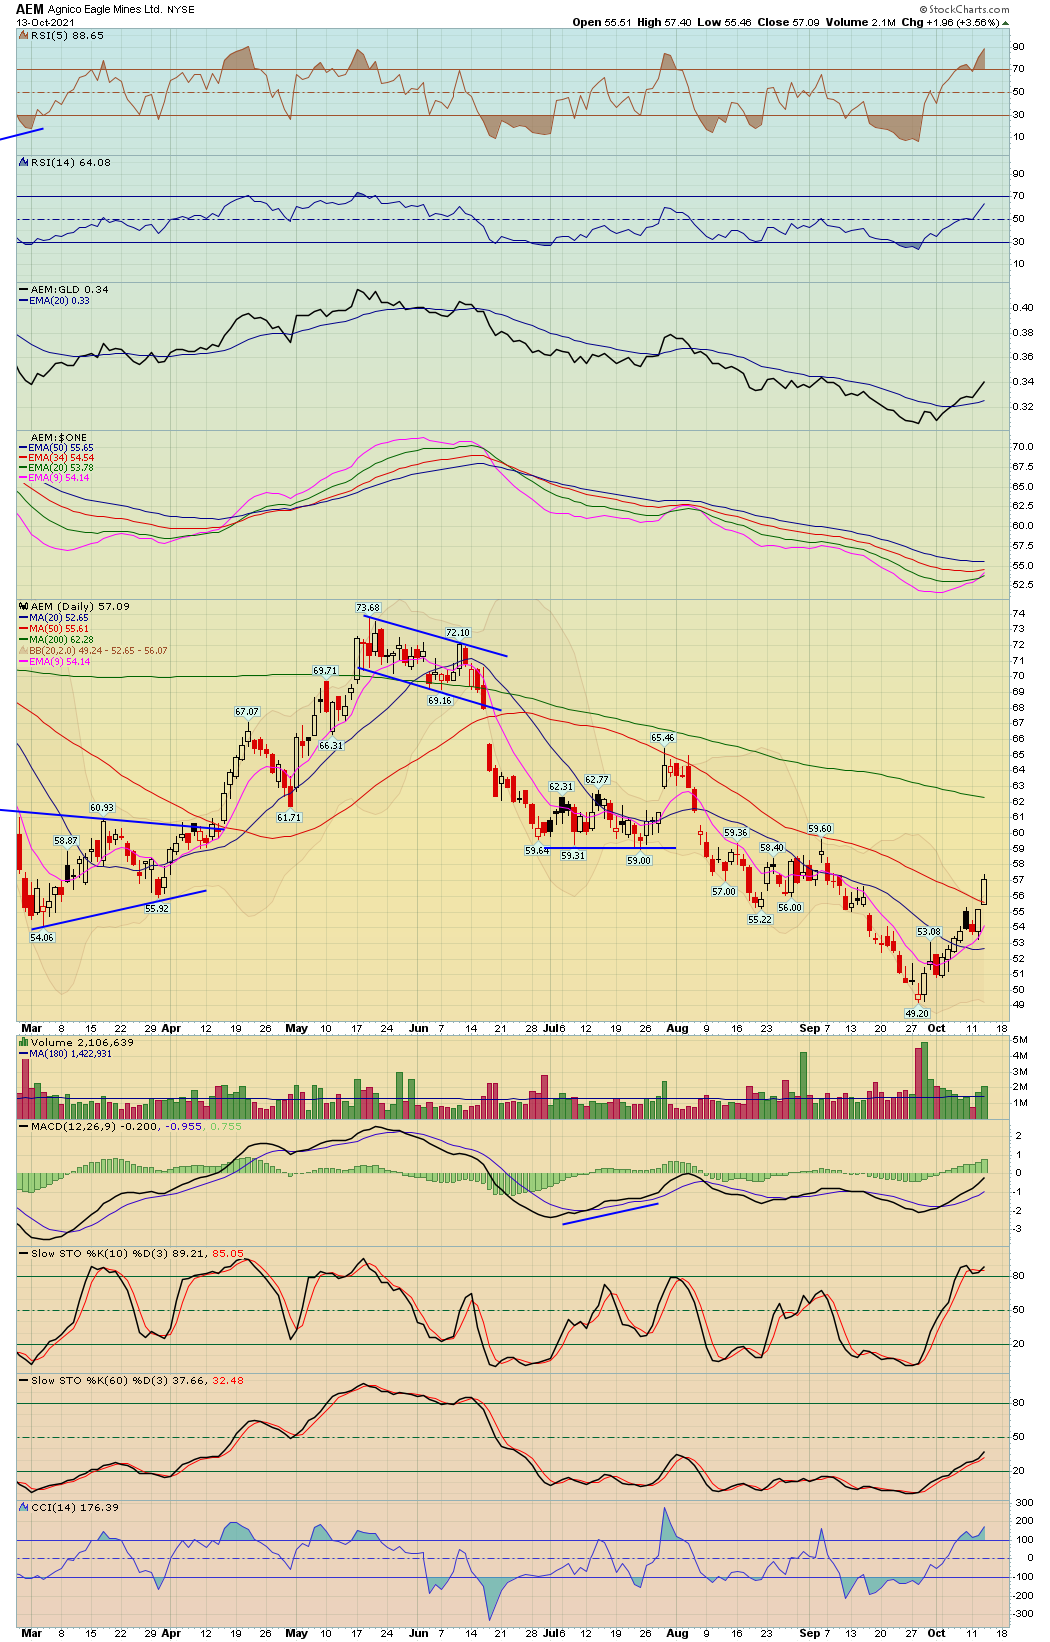
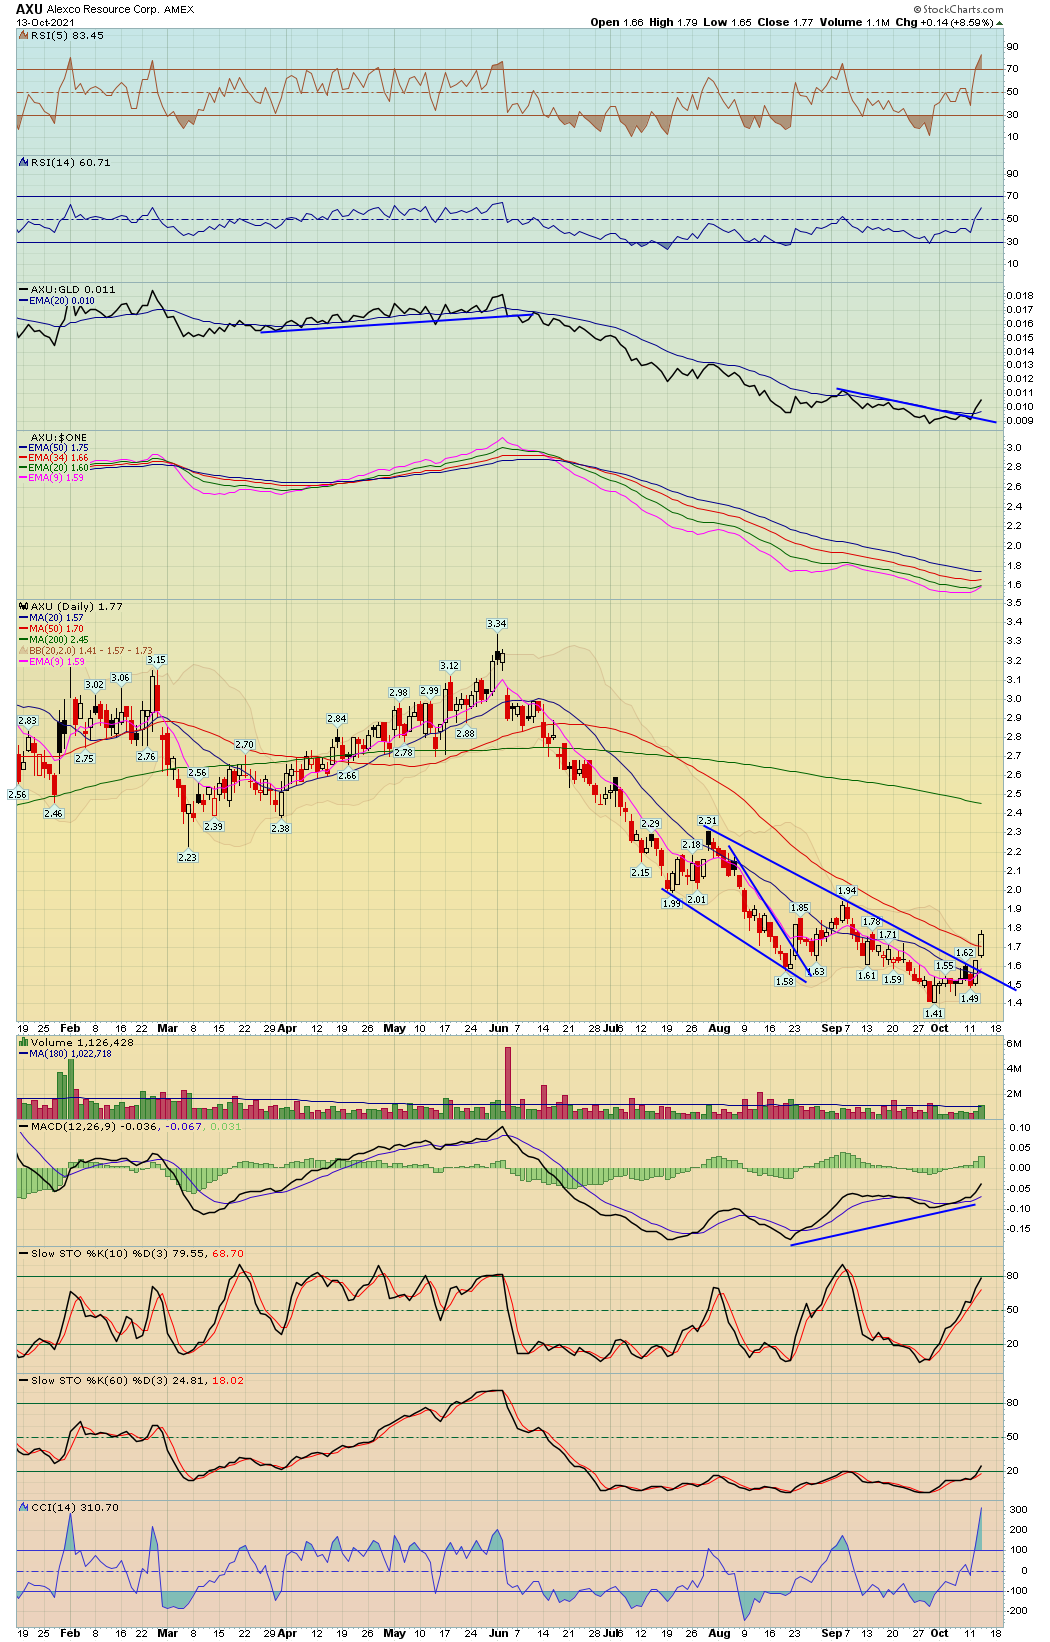
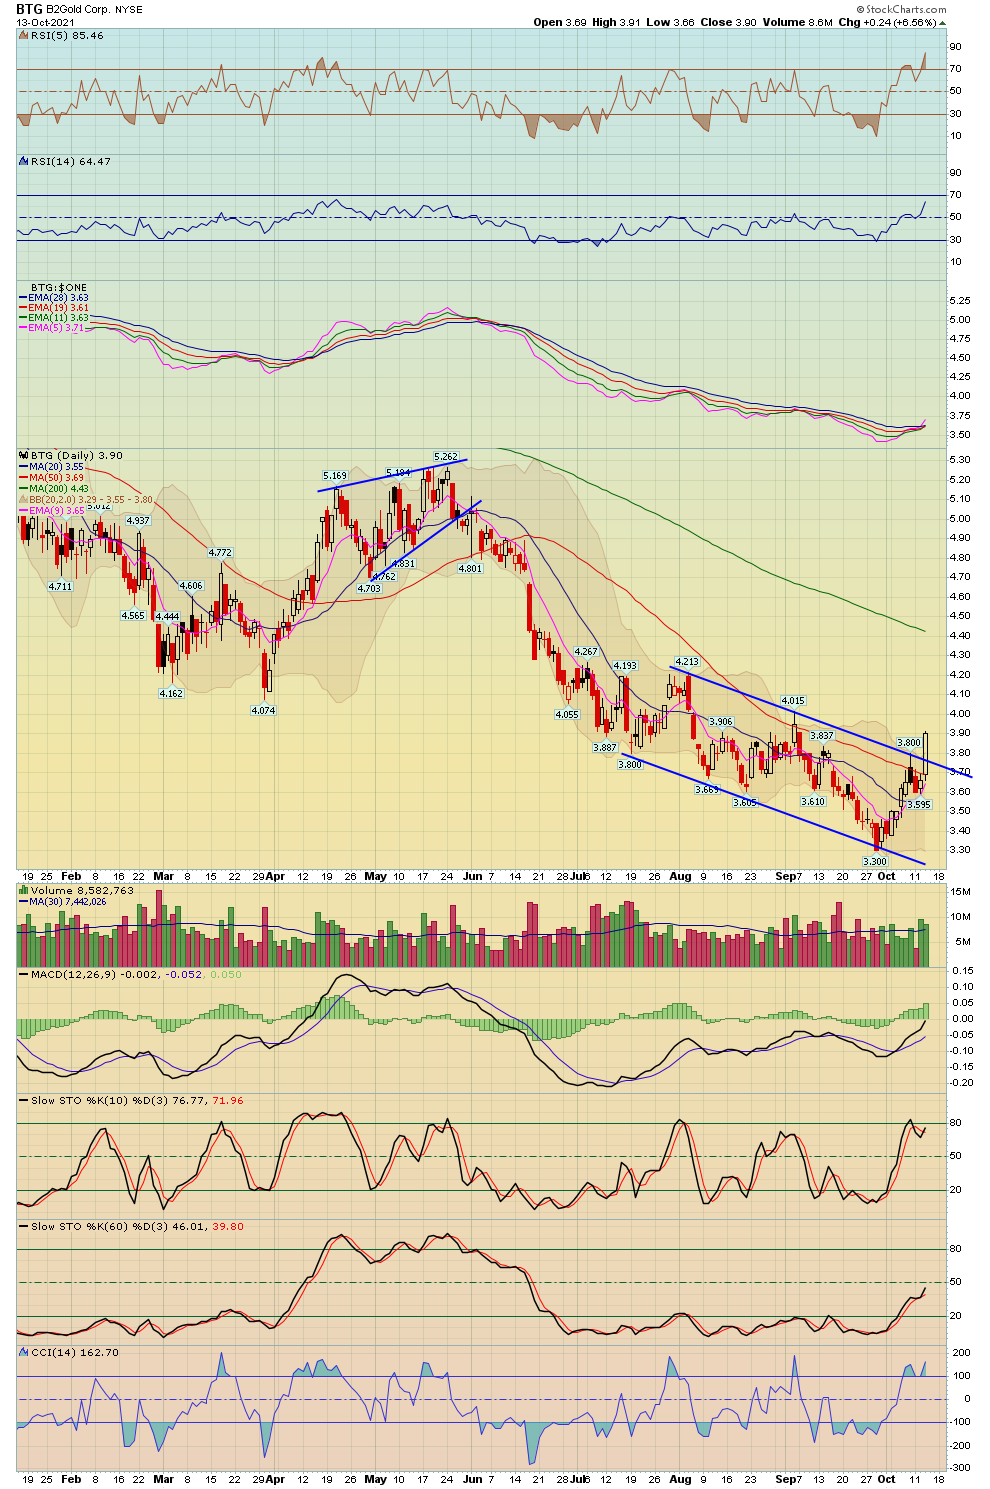
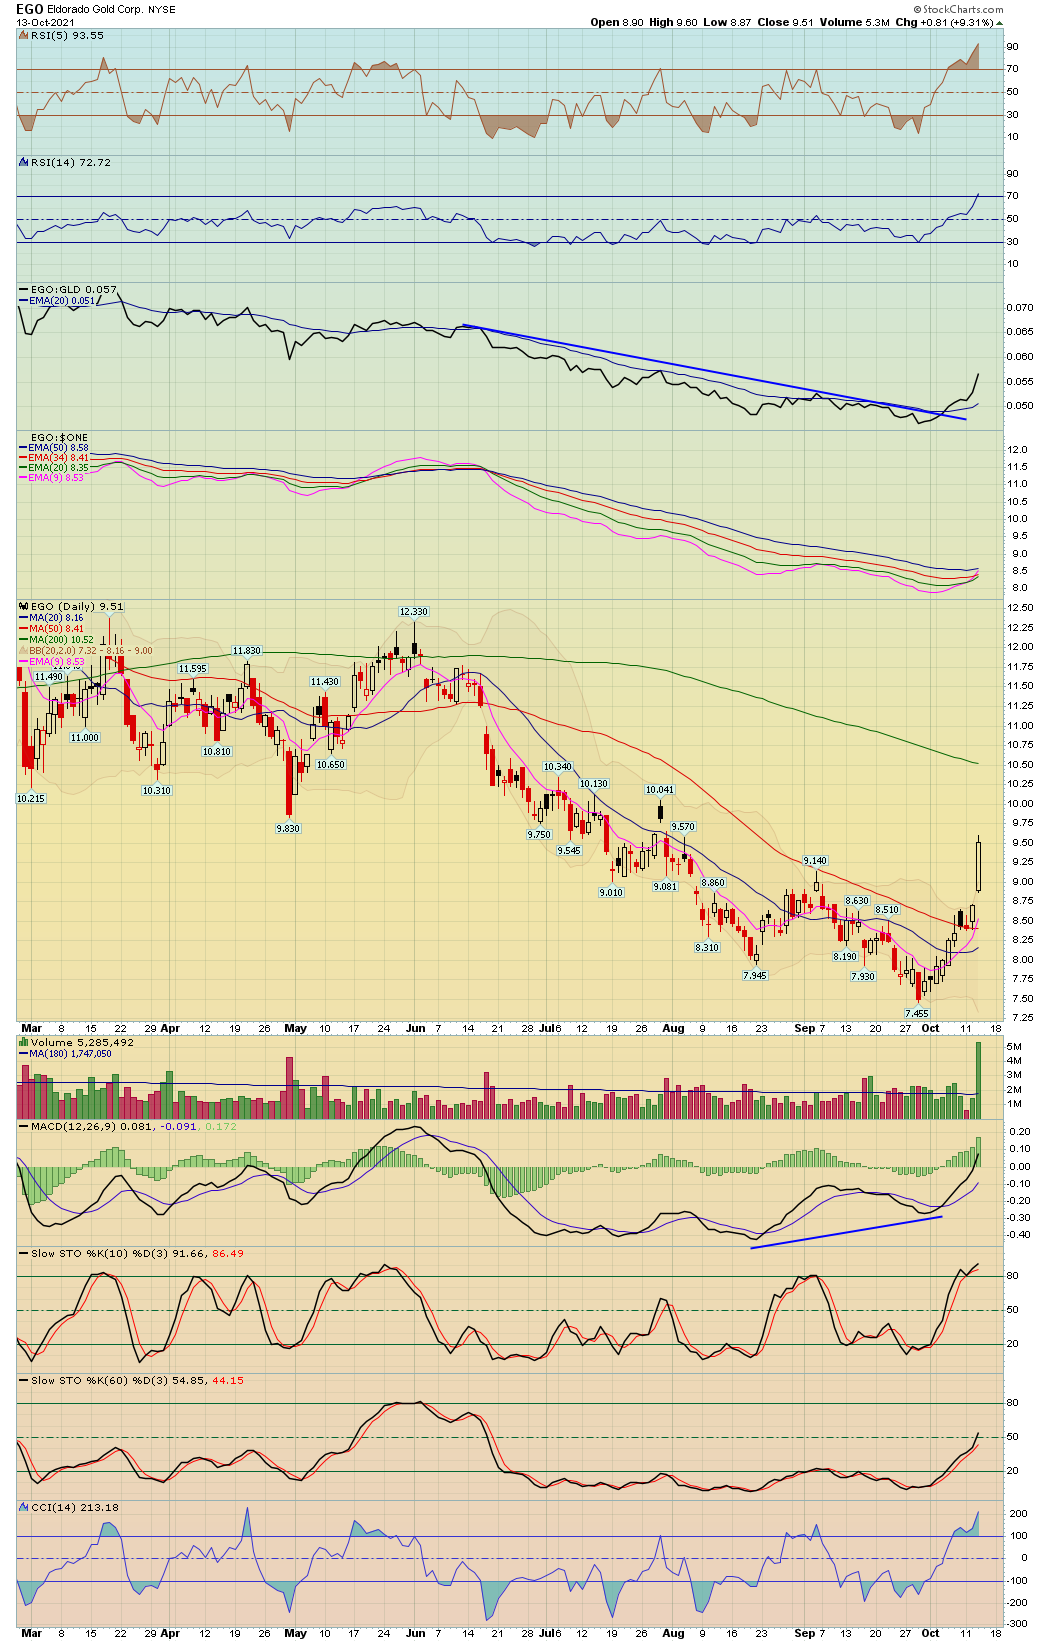
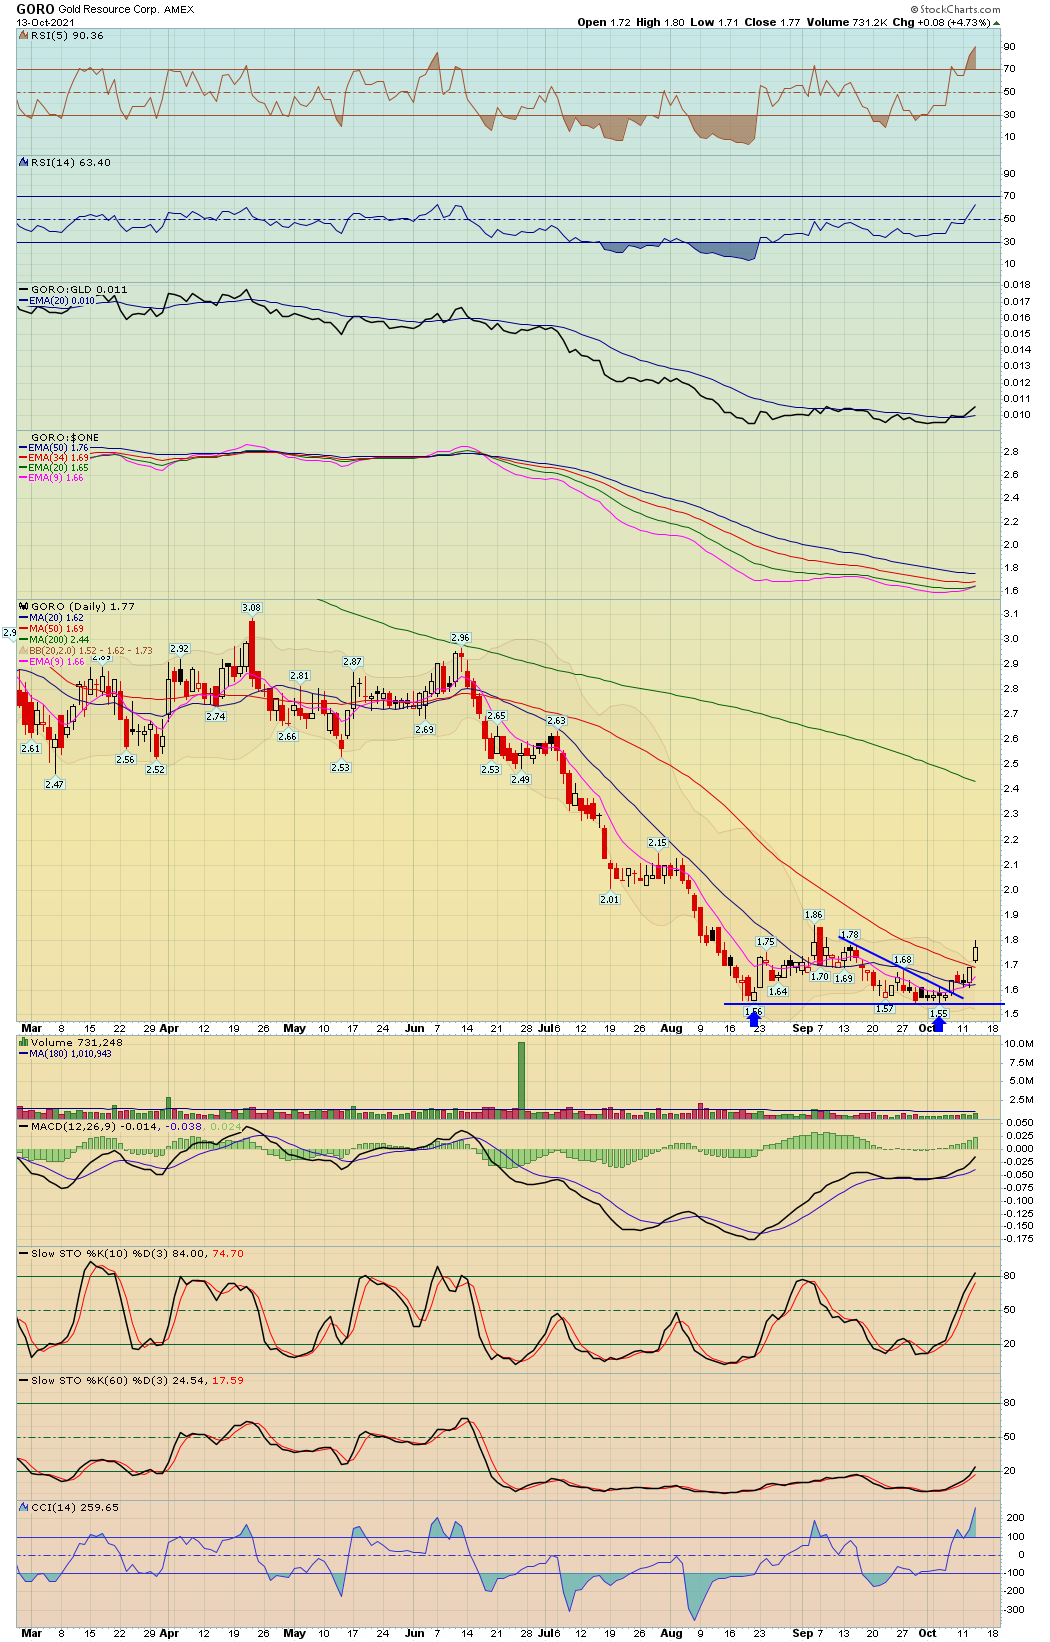
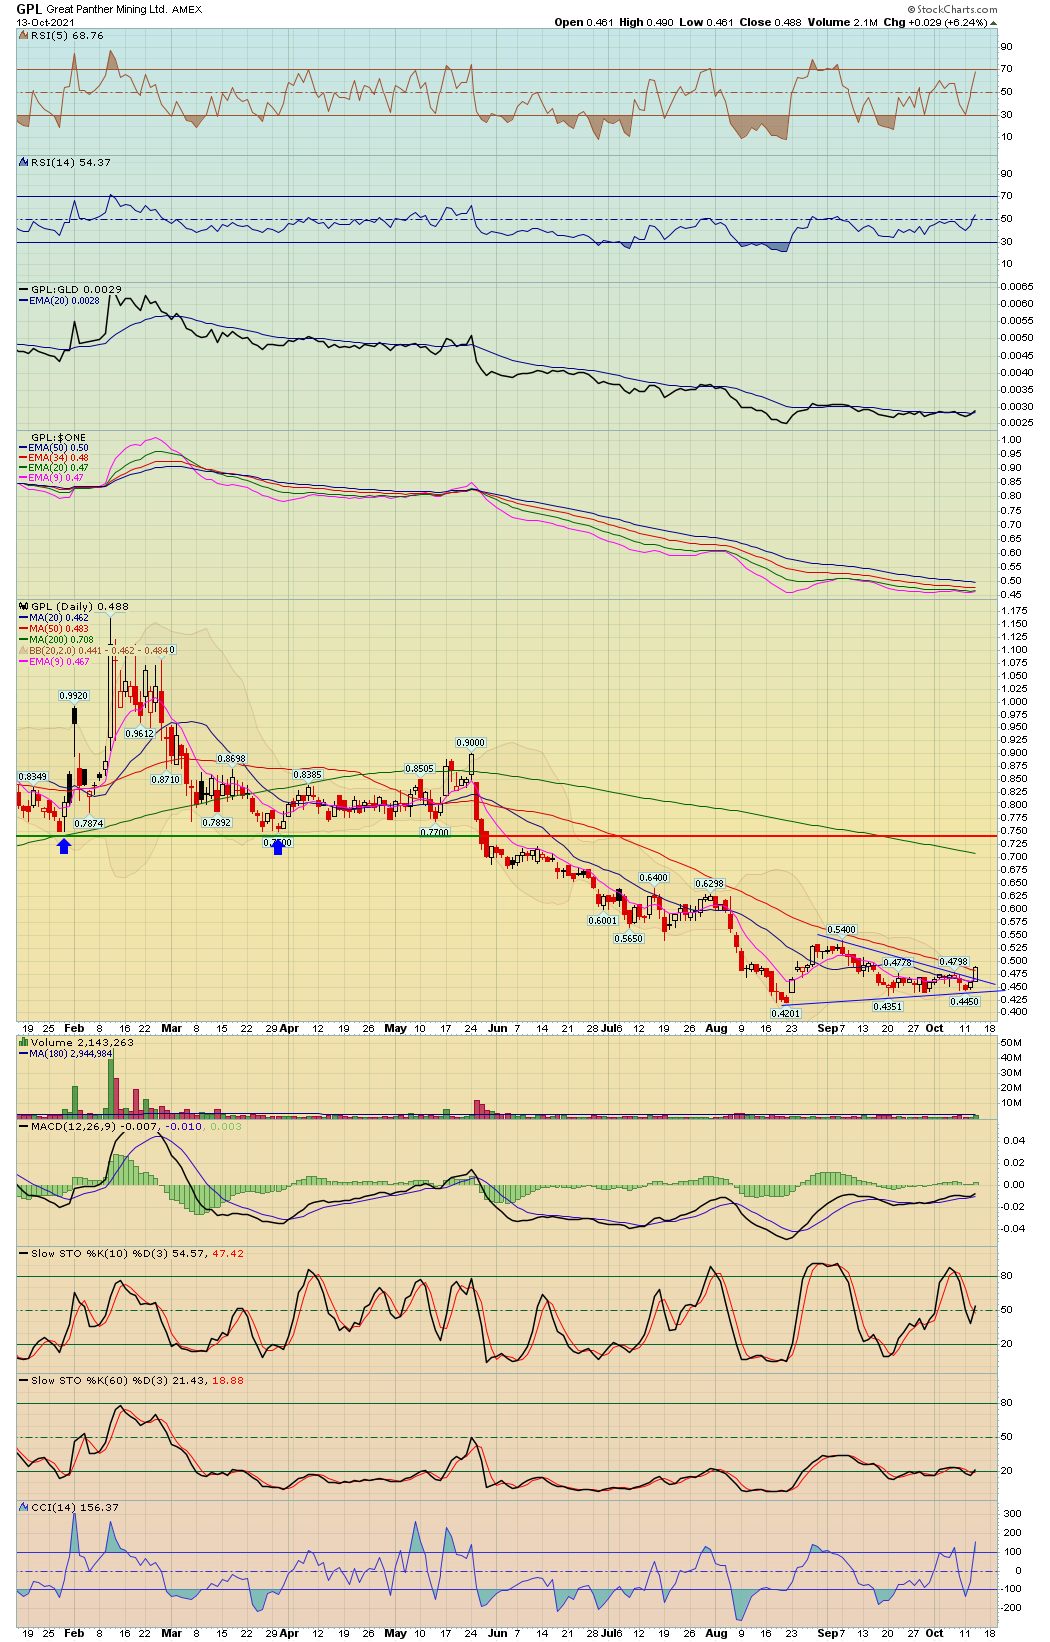
Precious metals and stocks had a great day! Congrats if you bought some of these setups that I've been showing for nearly two weeks such as HMY, IAG, SLIJ, etc. The stocks have been leading the metal for over a week, which was bullish.
2
| Major Indexes | Index Symbol | ETF Symbol | % G / L Day | % G / L Week | Close |
|---|---|---|---|---|---|
| Dow Jones | INDU - W | DIA - W | 0.00% | -1.06% | 34,377.81 |
| S&P 500 | SPX - W | SPY - W | 0.30% | -0.63% | 4,363.80 |
| Wilshire 5000 | WLSH - W | 0.44% | -0.27% | 45,531.00 | |
| Nasdaq | COMPQ - W | 0.73% | -0.05% | 14,571.64 | |
| NDX 100 | NDX - W | QQQ - W | 0.77% | -0.31% | 14,774.60 |
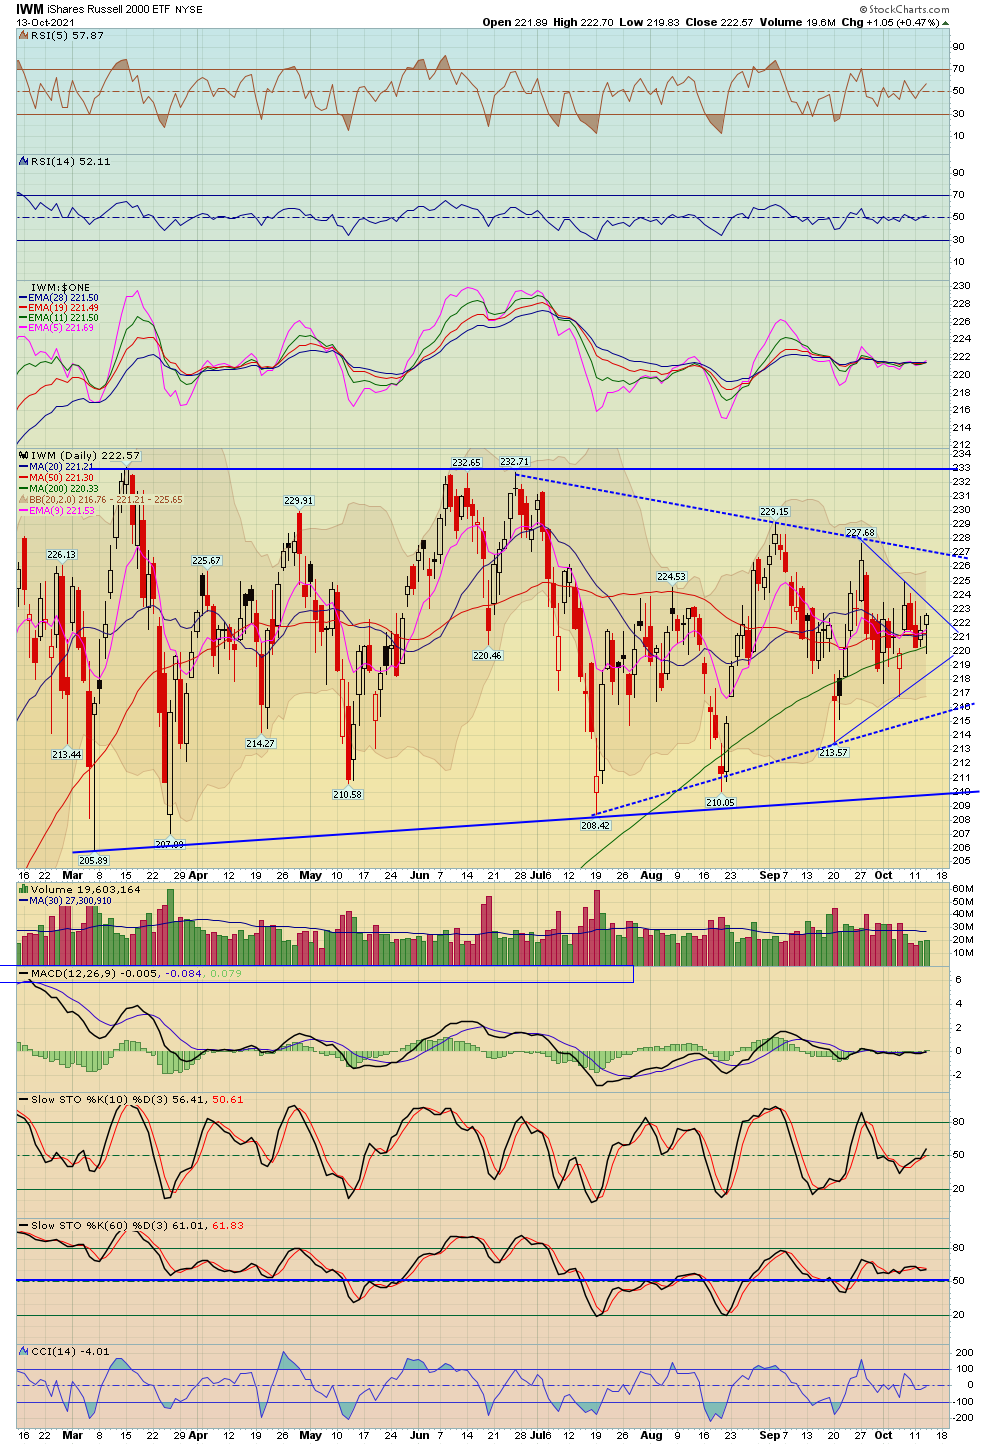
| Russel 2000 (Small Caps) | IWM - W | 0.47% | 0.45% | 222.57 |
| Market Sectors | Index Symbol | ETF Symbol | % G / L Day | % G / L Week | Close |
|---|---|---|---|---|---|
| Transports | TRAN - W | IYT - W | -0.09% | 0.48% | 14,710.53 |
| Banks | BKX - W | -0.77% | -2.17% | 133.42 | |
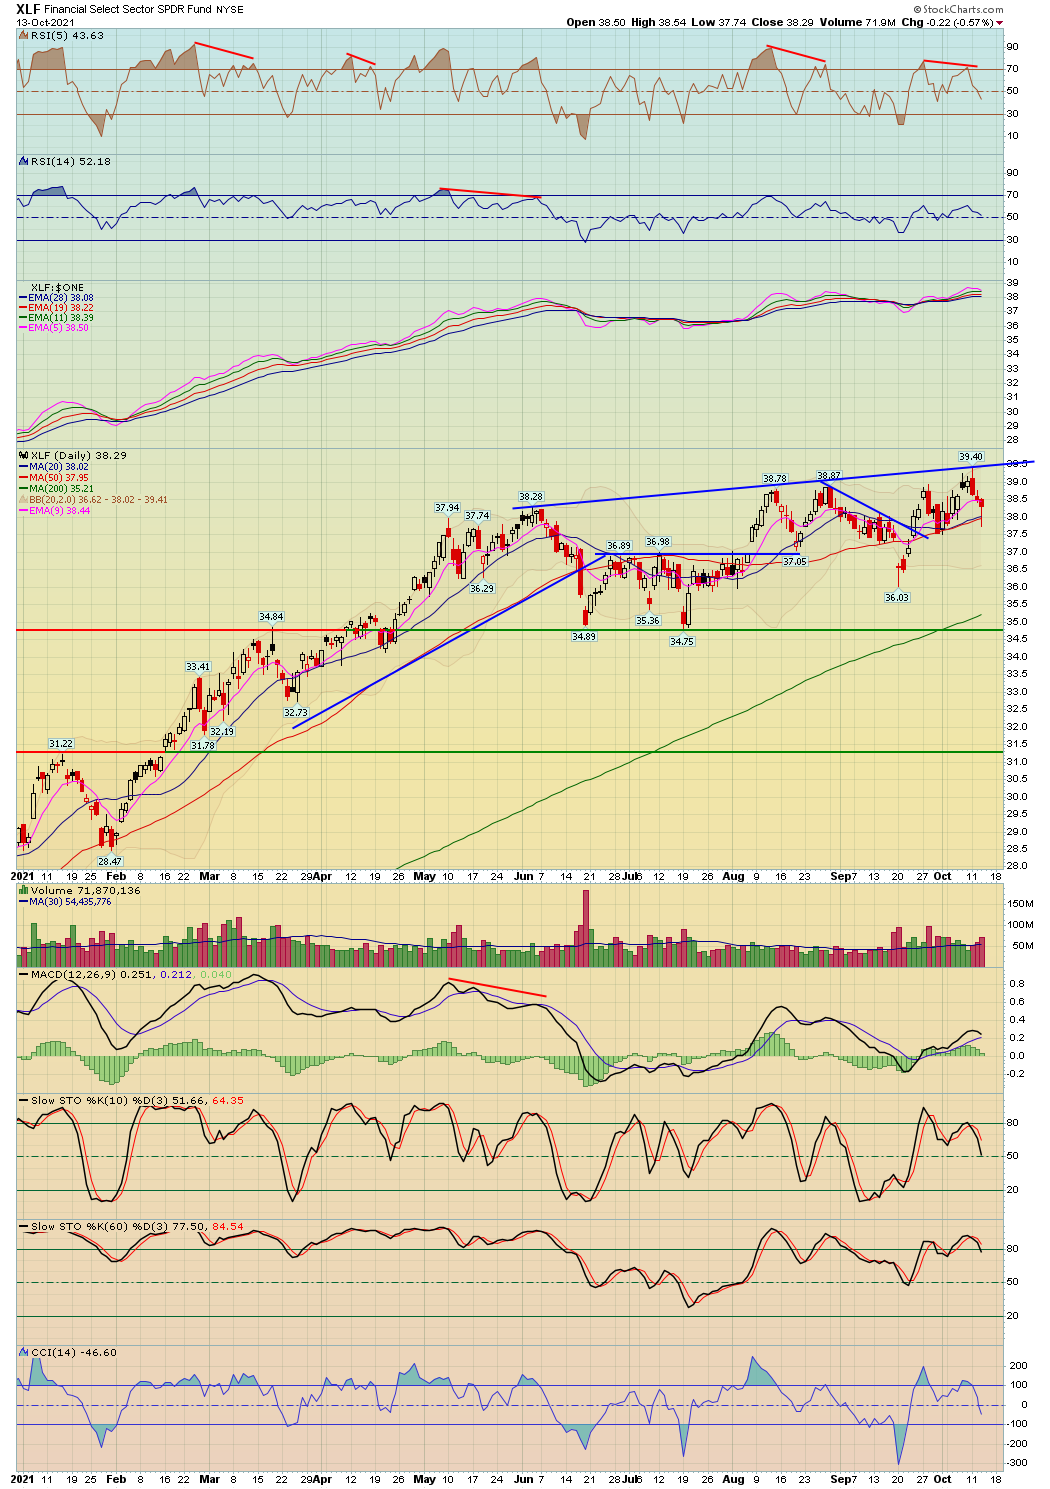
| Financials | XLF - W | -0.57% | -1.87% | 38.29 | |
| Brokers | XBD - W | -0.37% | -1.65% | 480.58 | |
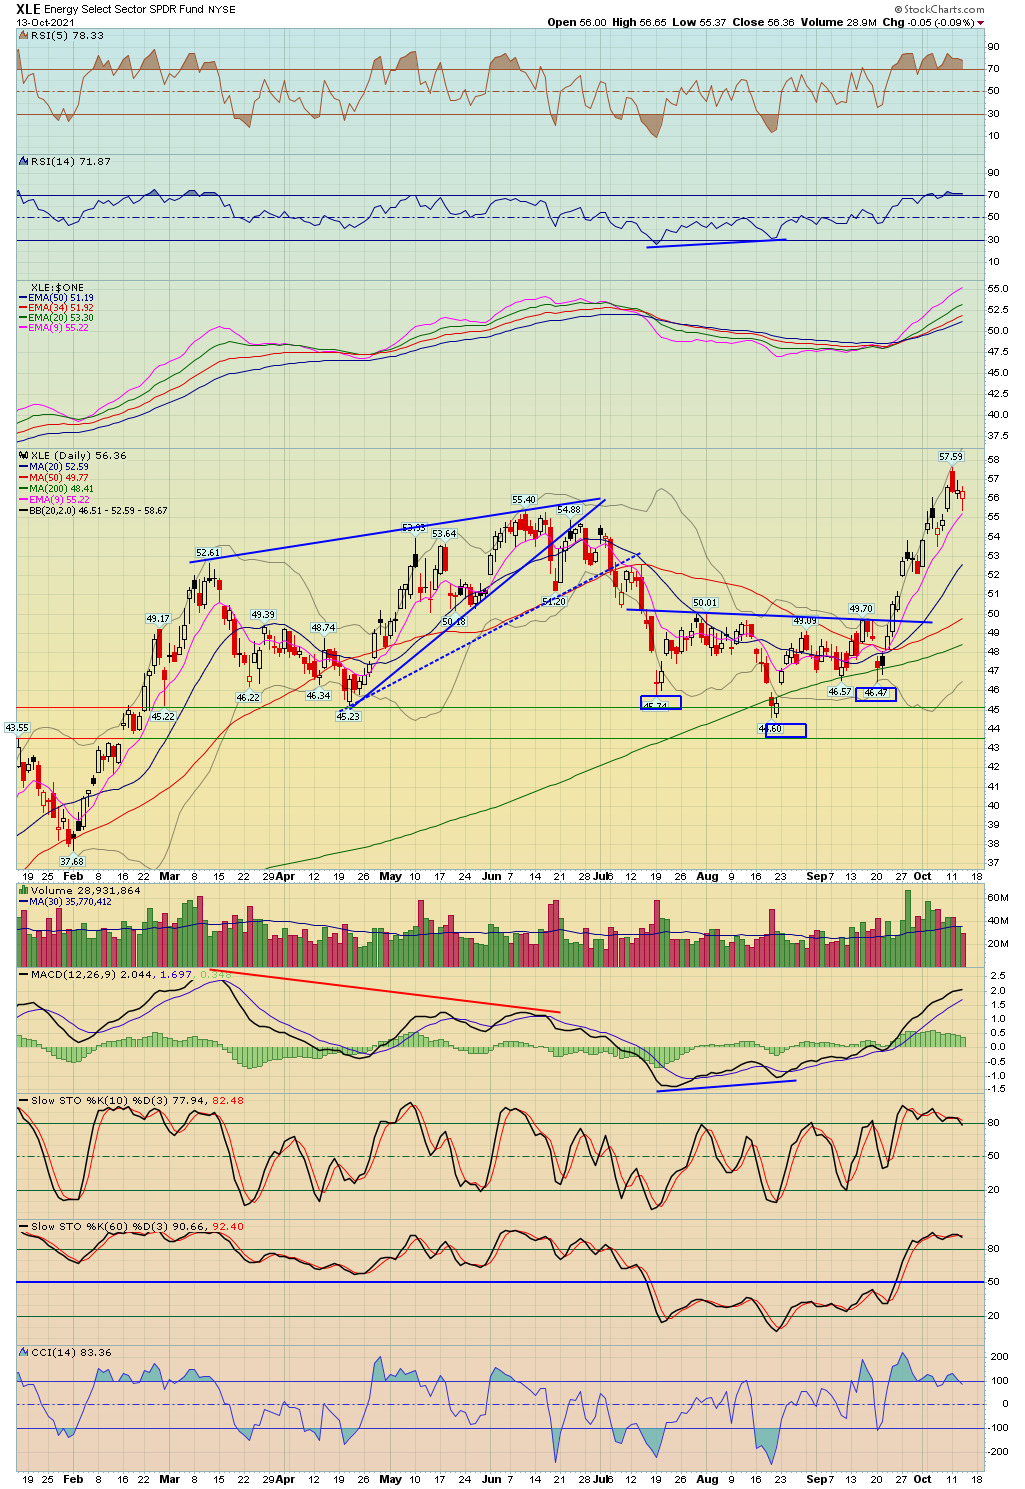
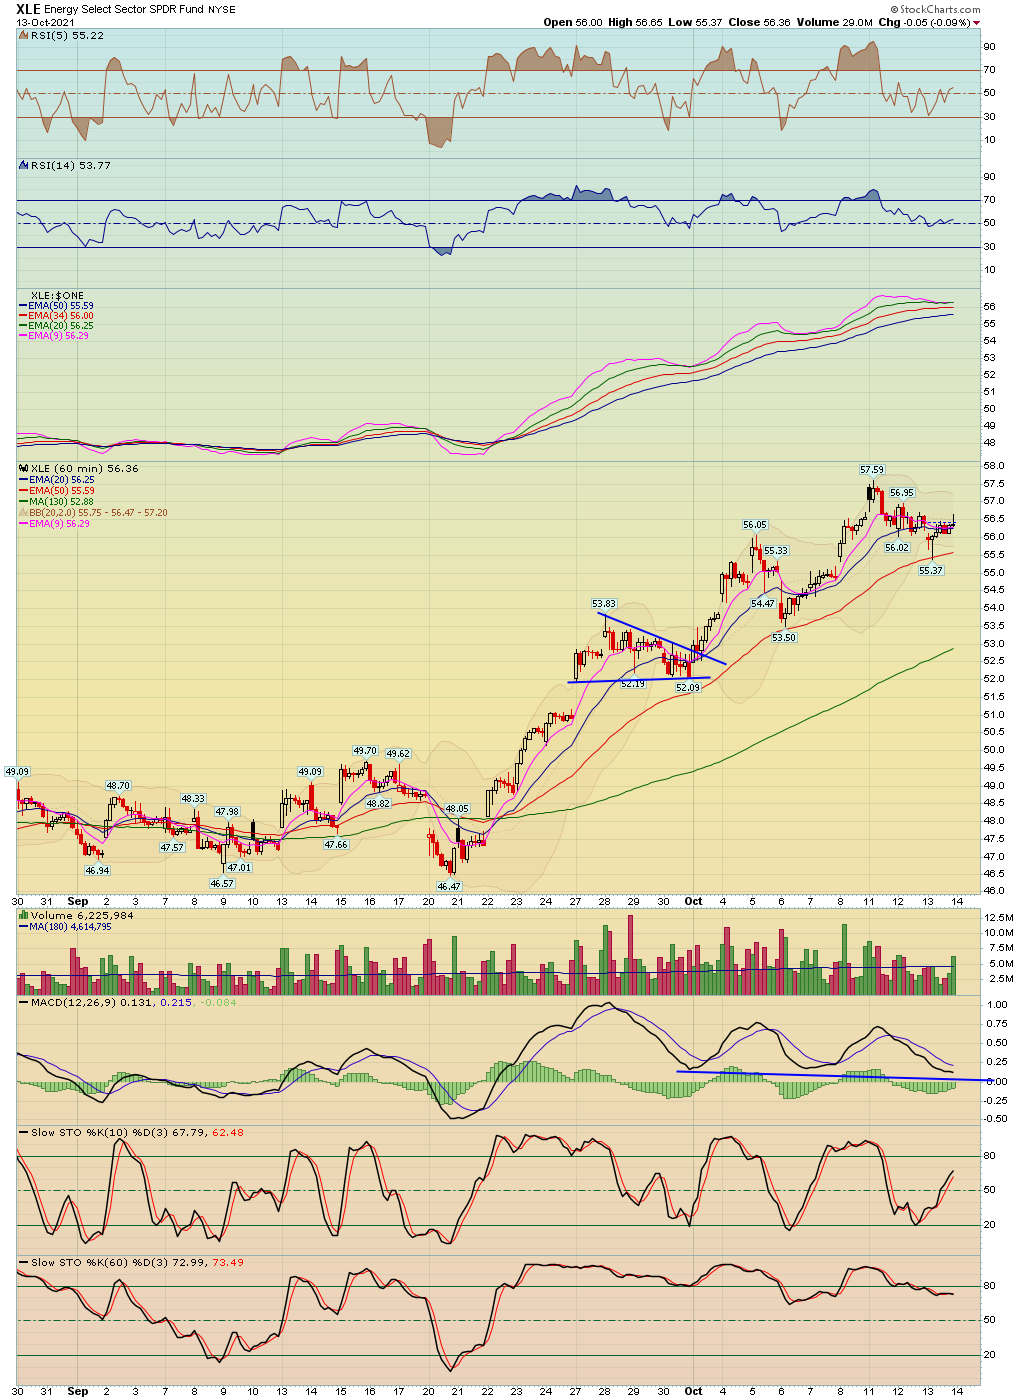
| XLE (Energy Select) | XLE - W | -0.09% | -0.37% | 56.36 | |
| Oil Service Holders | OIH - W | 0.59% | 1.52% | 217.30 | |
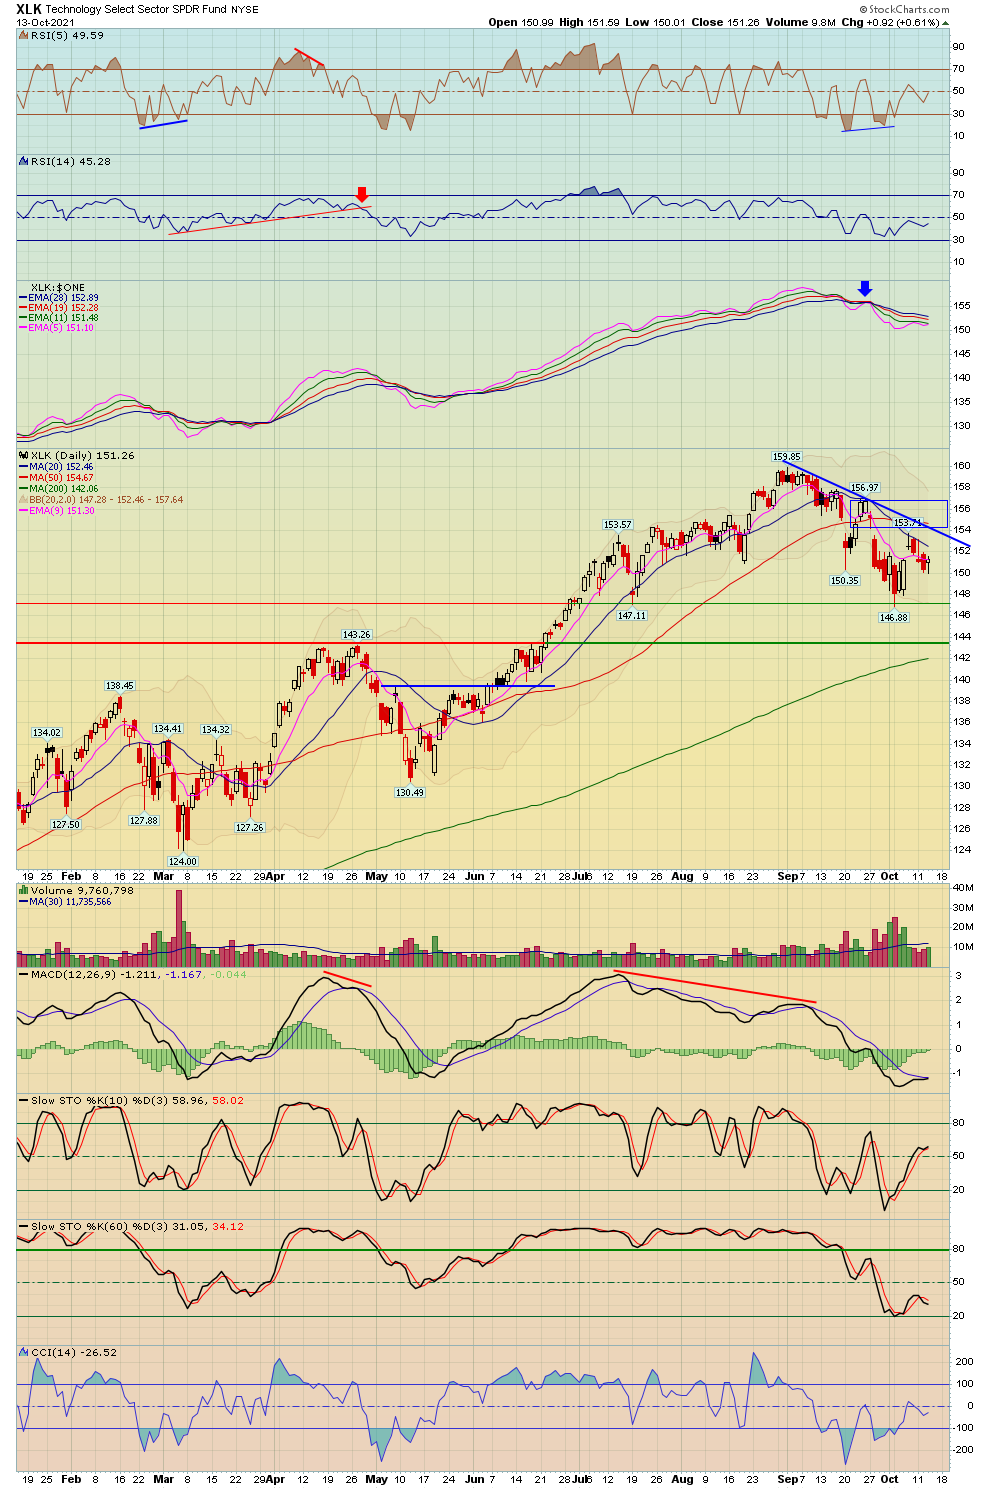
| Technology | XLK - W | 0.61% | -0.46% | 151.26 | |
| Semiconductor | SOX - W | SMH - W | 0.46% | -1.65% | 3,192.75 |
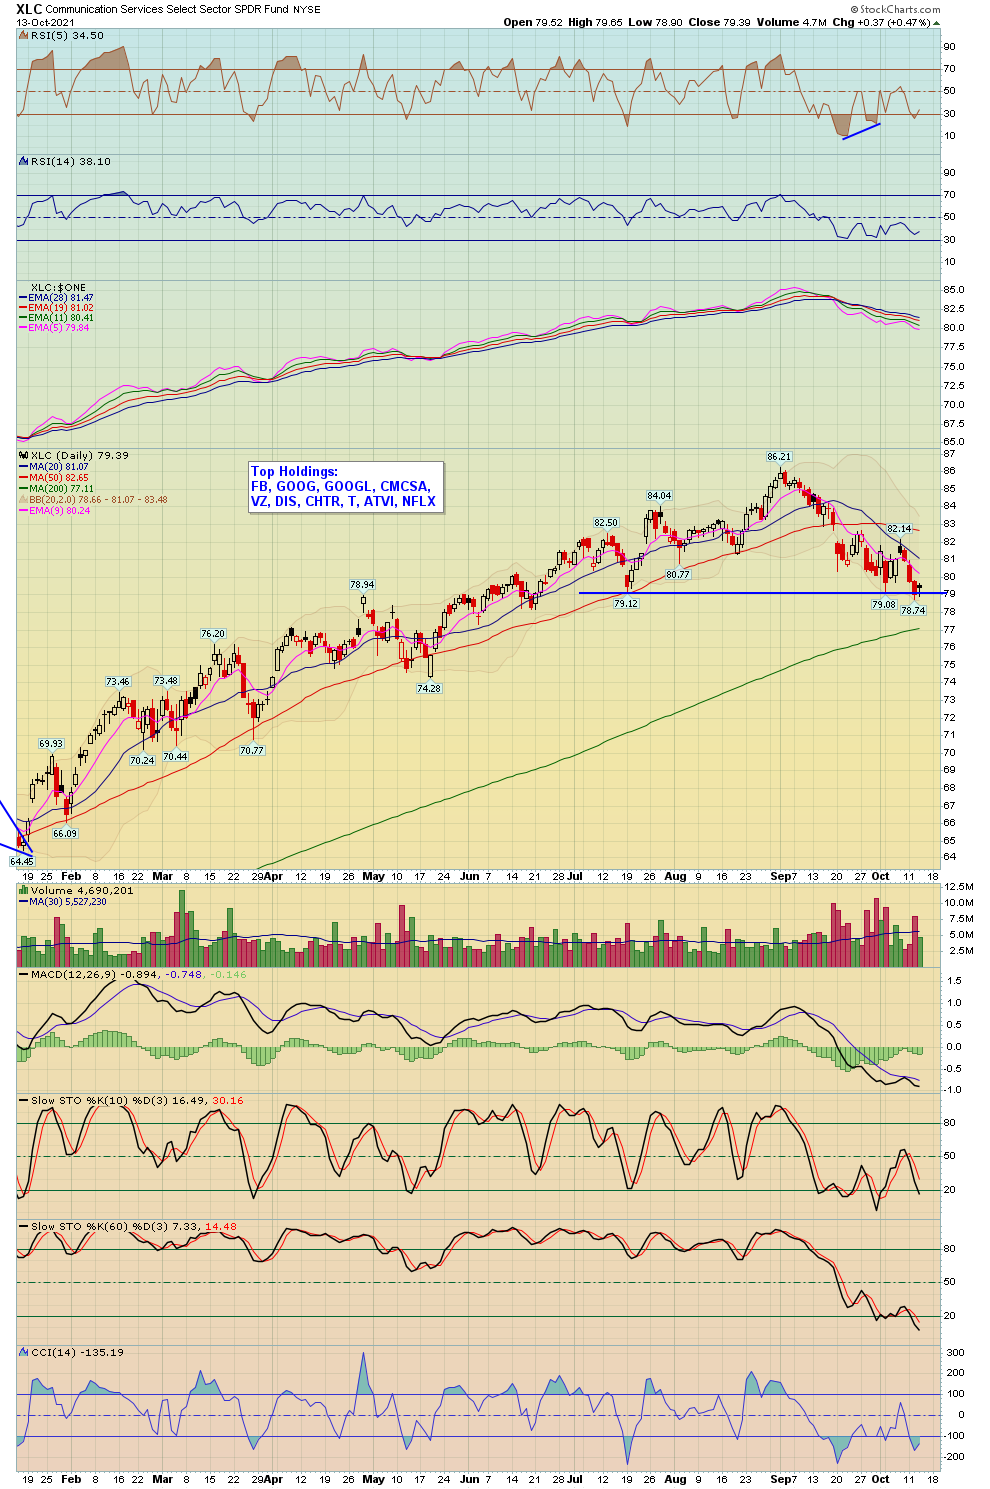
| Communication Services | XLC - W | 0.47% | -1.96% | 79.39 | |
| Retail | XRT - W | 0.72% | -0.43% | 90.45 | |
| Consumer Staples | XLP - W | 0.19% | 0.20% | 70.19 | |
| Consumer Discretionary | XLY - W | 0.49% | 0.88% | 184.23 | |
| Industrials | XLI - W | 0.21% | -0.92% | 100.02 | |
| Real Estate | IYR - W | 0.70% | 2.35% | 105.76 | |
| Homebuilders | HGX - W | XHB - W | 0.73% | 1.24% | 452.56 |
| Materials | XLB - W | 0.75% | 0.90% | 81.91 | |
| Metals And Mining | XME - W | 1.46% | 3.37% | 43.88 | |
| Biotechnology | BTK - W | XBI - W | -0.46% | -0.53% | 5,571.52 |
| Healthcare | XLV - W | 0.16% | -1.10% | 125.54 | |
| Drugs | DRG - W | 0.39% | -0.77% | 737.59 | |
| Utilities | UTIL - W | XLU - W | 1.22% | 0.61% | 890.14 |
| Currencies | Index Symbol | ETF Symbol | % G / L Day | % G / L Week | Close |
|---|---|---|---|---|---|
| US Dollar | UUP - W | -0.55% | -0.16% | 25.23 | |
| Euro | XEU - W | FXE - W | 0.56% | 0.19% | 115.95 |
| Yen | XJY - W | FXY - W | 0.27% | -0.93% | 88.27 |
| Australian | XAD - W | FXA - W | 0.36% | 0.94% | 73.78 |
| British Pound | XBP - W | FXB - W | 0.52% | 0.28% | 136.57 |
| Chinese Yuan | CYB - W | 0.63% | 0.29% | 28.09 | |
| Canadian Dollar | CDW - W | FXC - W | 0.16% | 0.22% | 80.35 |
| Swiss Franc | XSF - W | FXF - W | 0.72% | 0.47% | 108.20 |
| Cryptocurrencies | Index Symbol | ETF Symbol | % G / L Day | % G / L Week | Close |
|---|---|---|---|---|---|
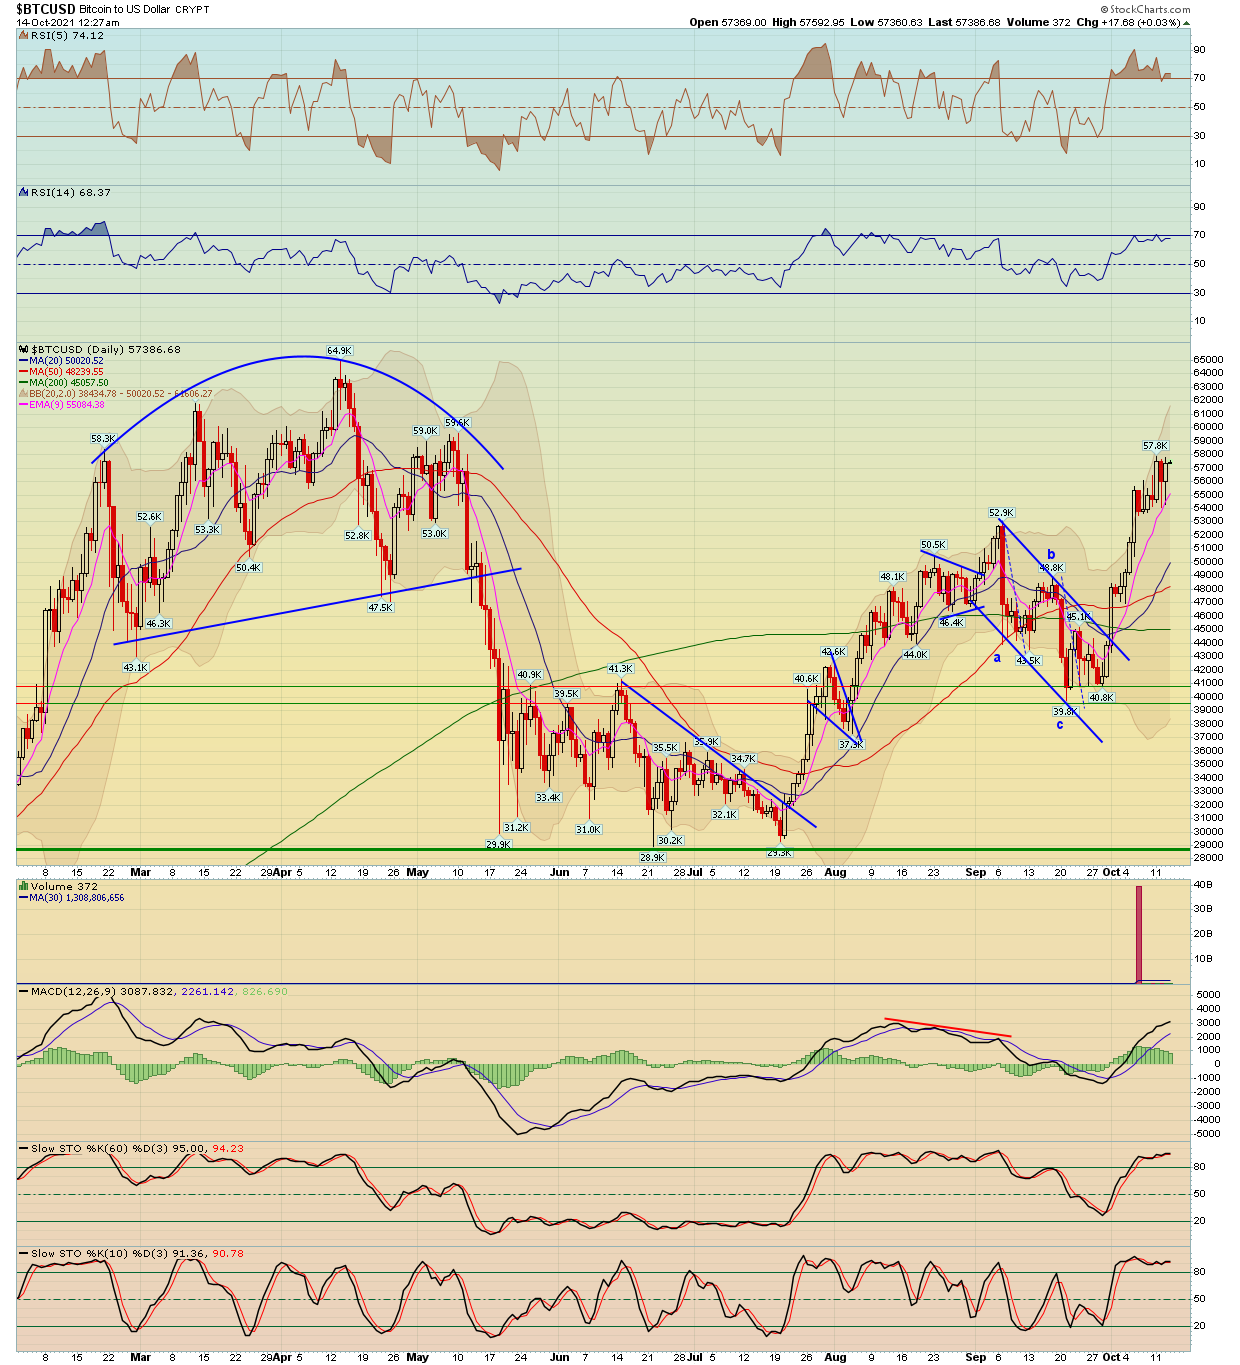
| Bitcoin | BTCUSD - W | 1.84% | 4.28% | 57,043.98 | |
| Bitcoin Cash | BCHUSD - W | 0.27% | 0.62% | 589.08 | |
| Etherium | ETHUSD - W | 2.53% | 4.75% | 3,578.91 | |
| Monero | XMRUSD - W | -1.09% | 1.28% | 274.06 | |
| Litecoin | LTCUSD - W | 2.09% | 0.73% | 176.20 | |
| Ripple | XRPUSD - W | 0.73% | -2.29% | 1.11 |
| Commodities | Index Symbol | ETF Symbol | % G / L Day | % G / L Week | Close |
|---|---|---|---|---|---|
| Commodities | DBC - W | 0.57% | 1.24% | 21.28 | |
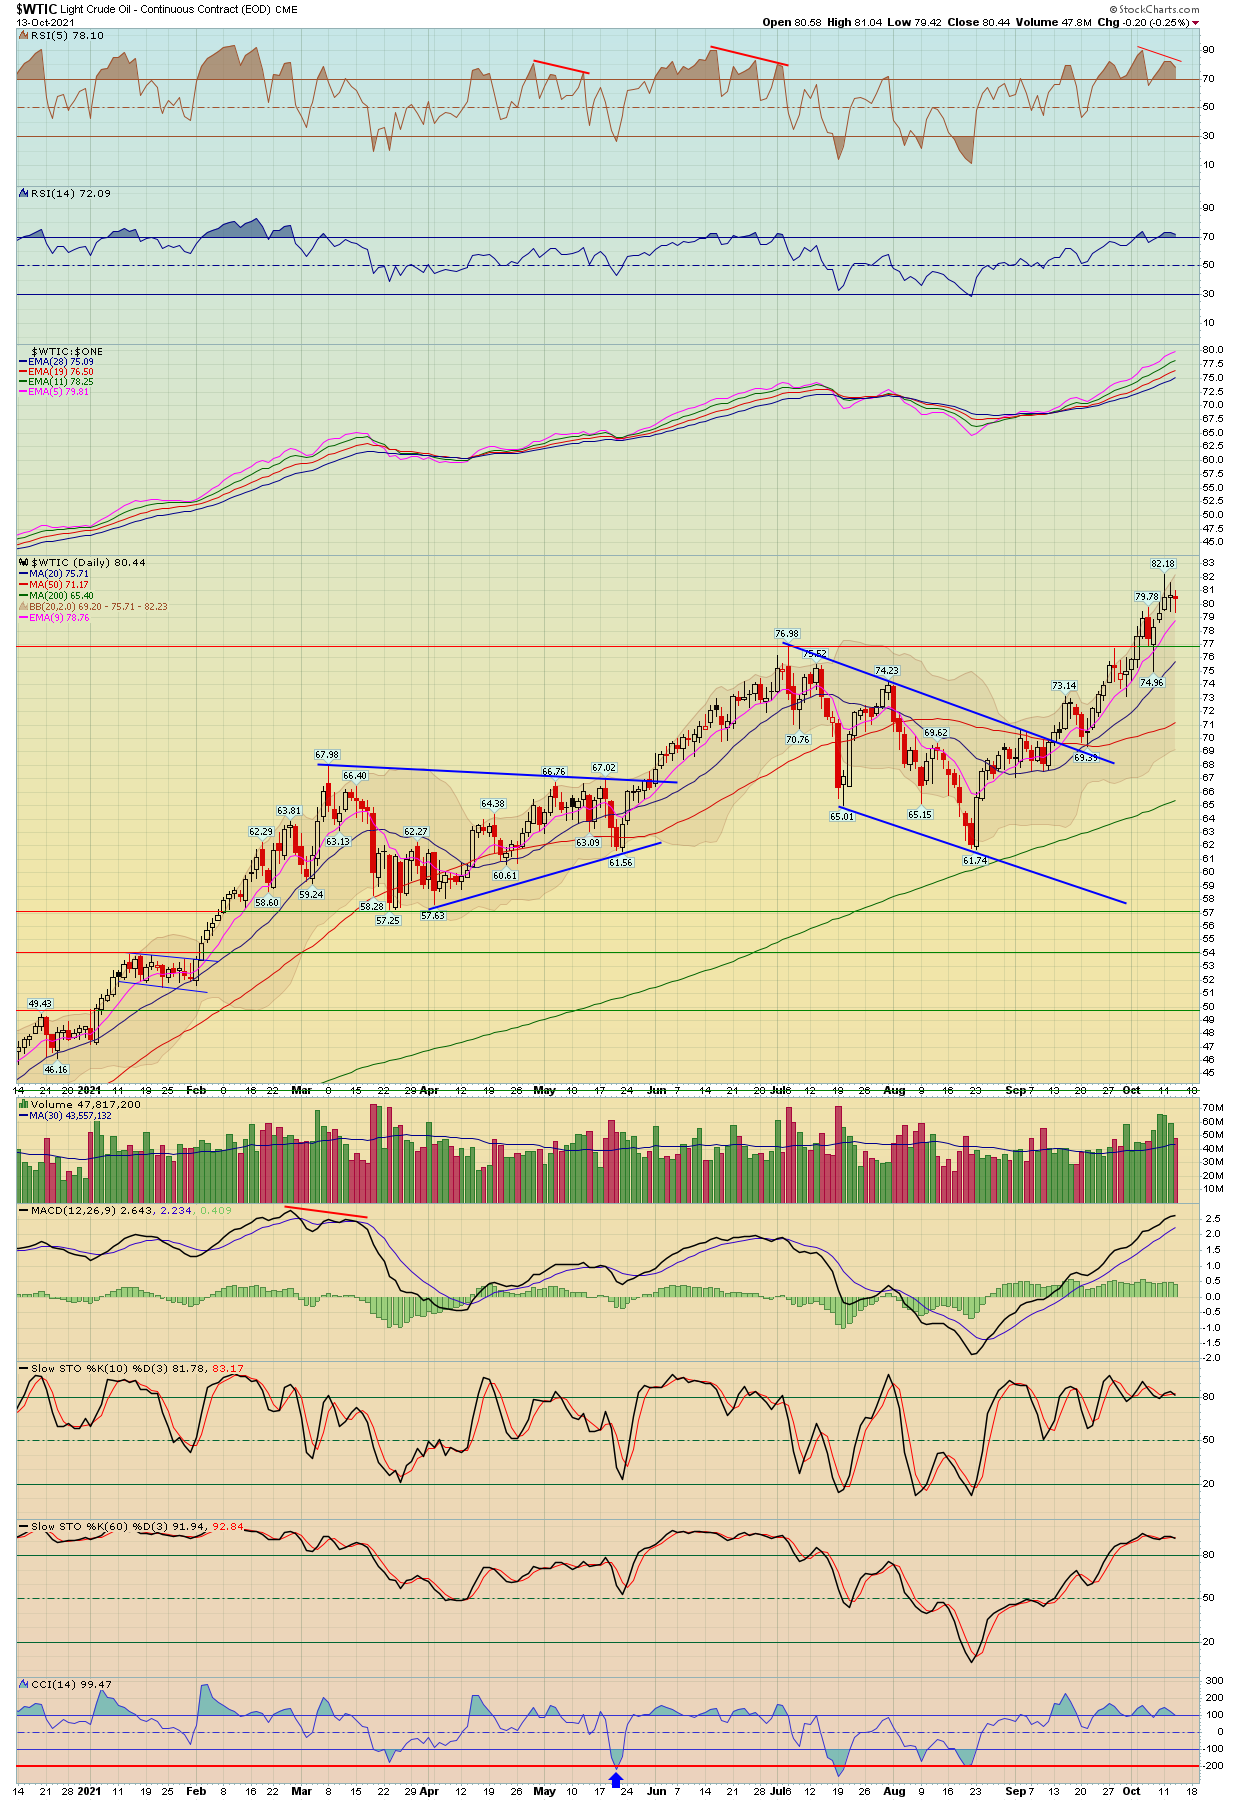
| Crude Oil | WTIC - W | USO - W | -0.25% | 1.37% | 80.44 |
| Gasoline | GASO - W | 0.69% | 1.66% | 2.35 | |
| Natural Gas | NATGAS - W | UNG - W | 1.54% | 0.45% | 5.59 |
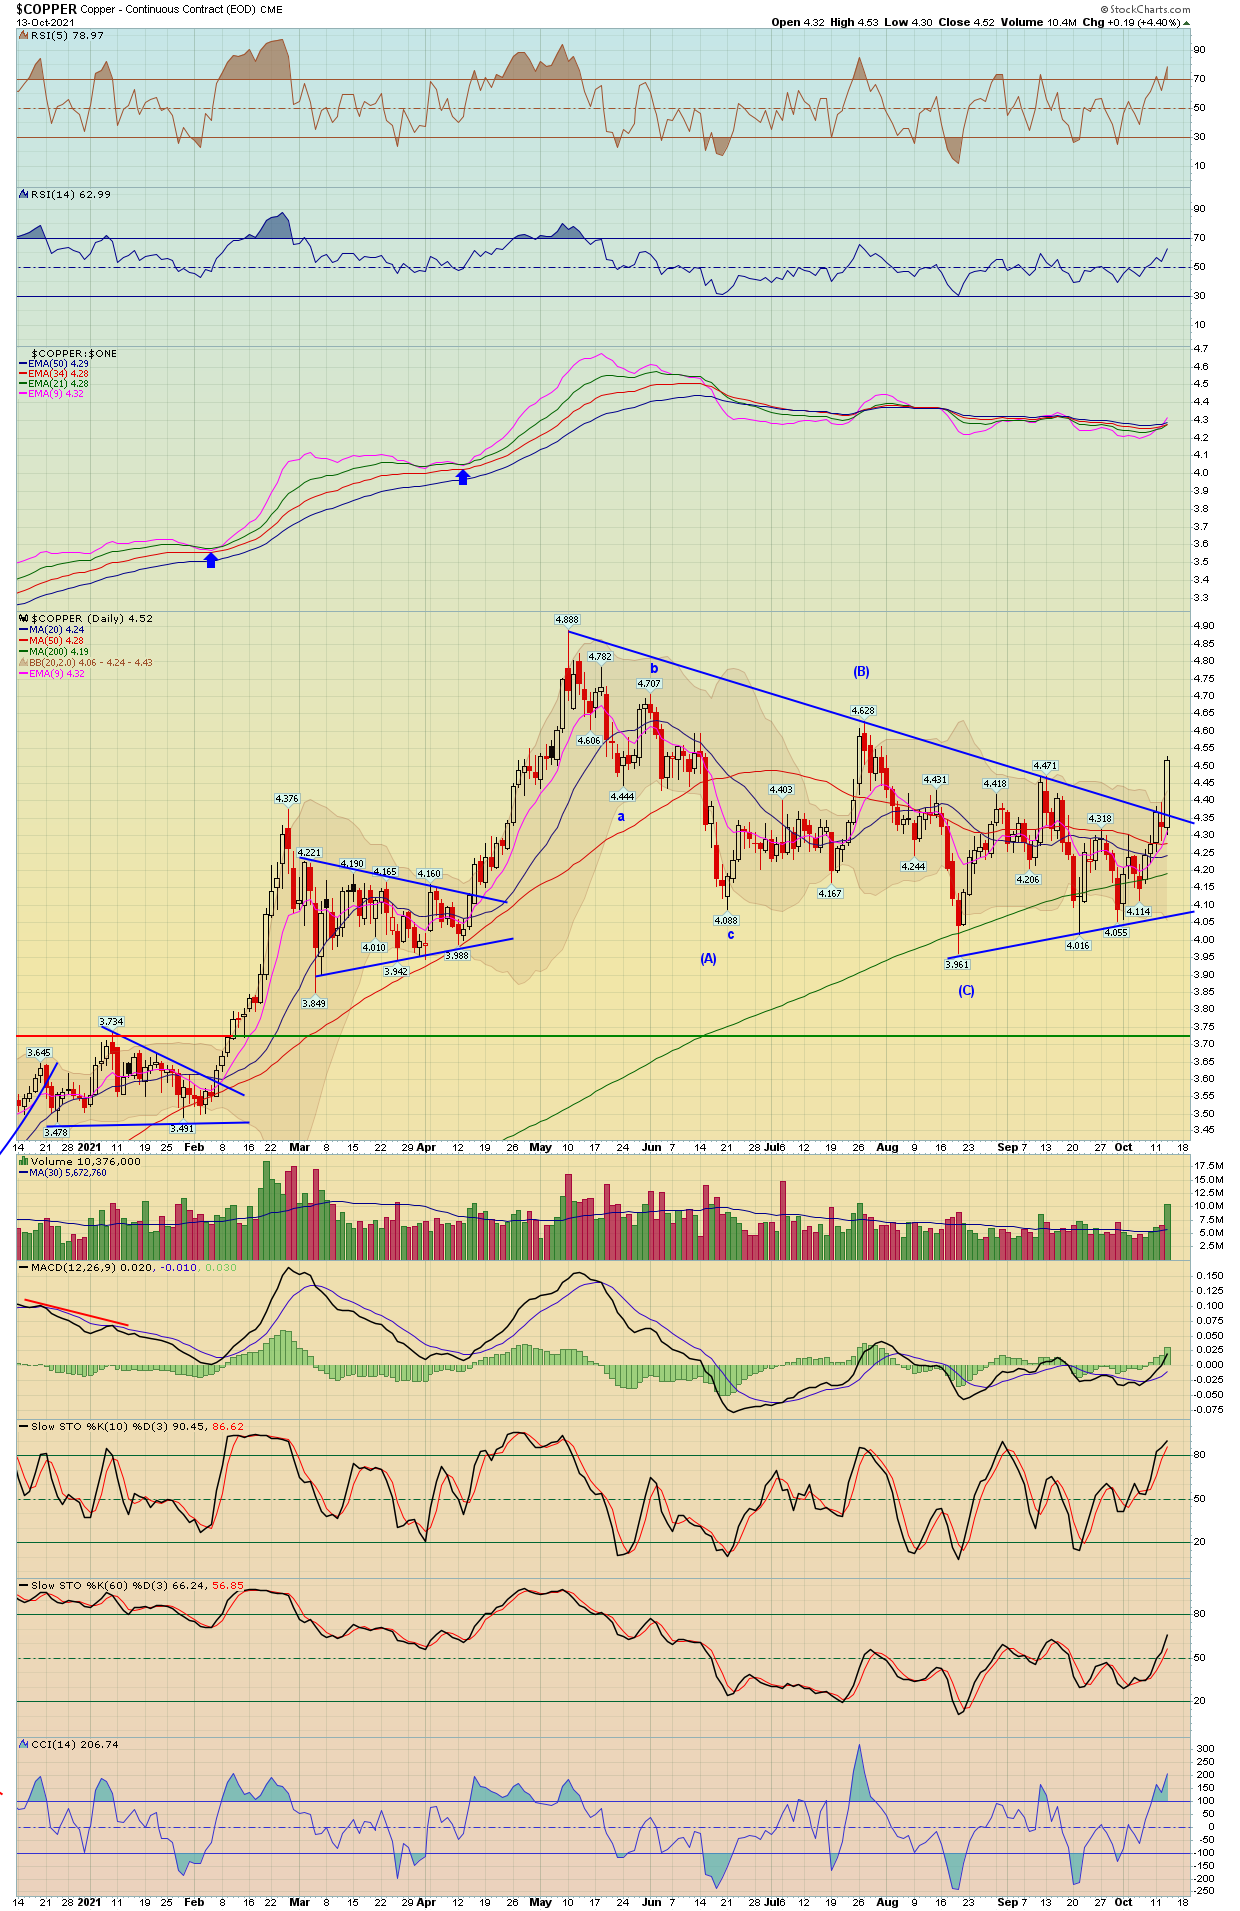
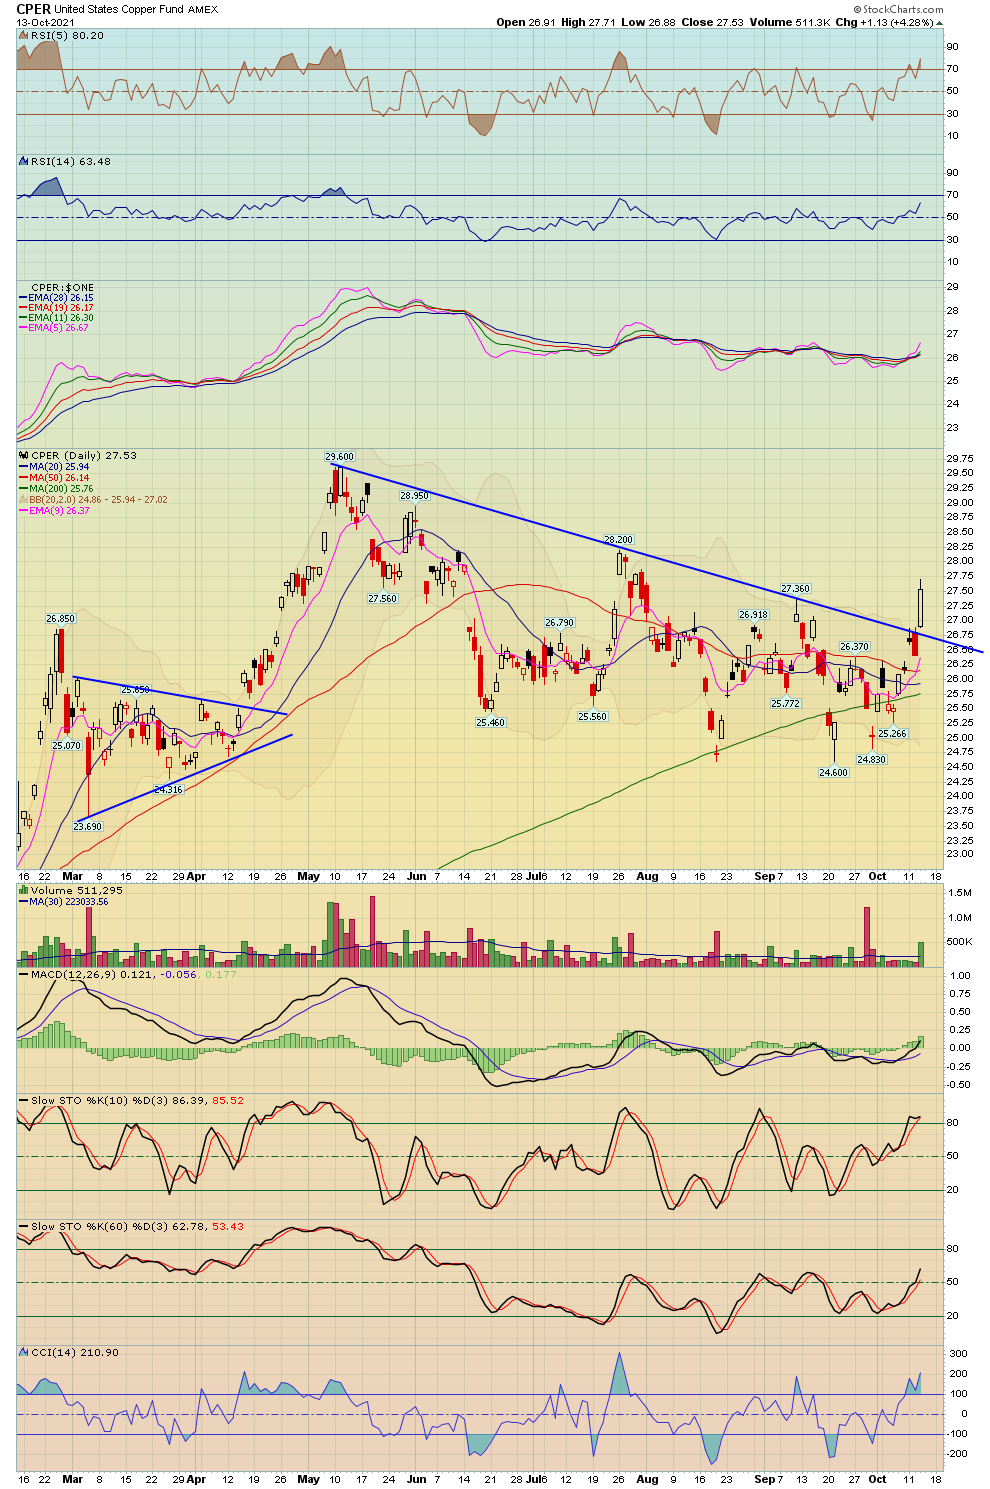
| Copper | COPPER - W | JJCB - W | 4.40% | 5.63% | 4.52 |
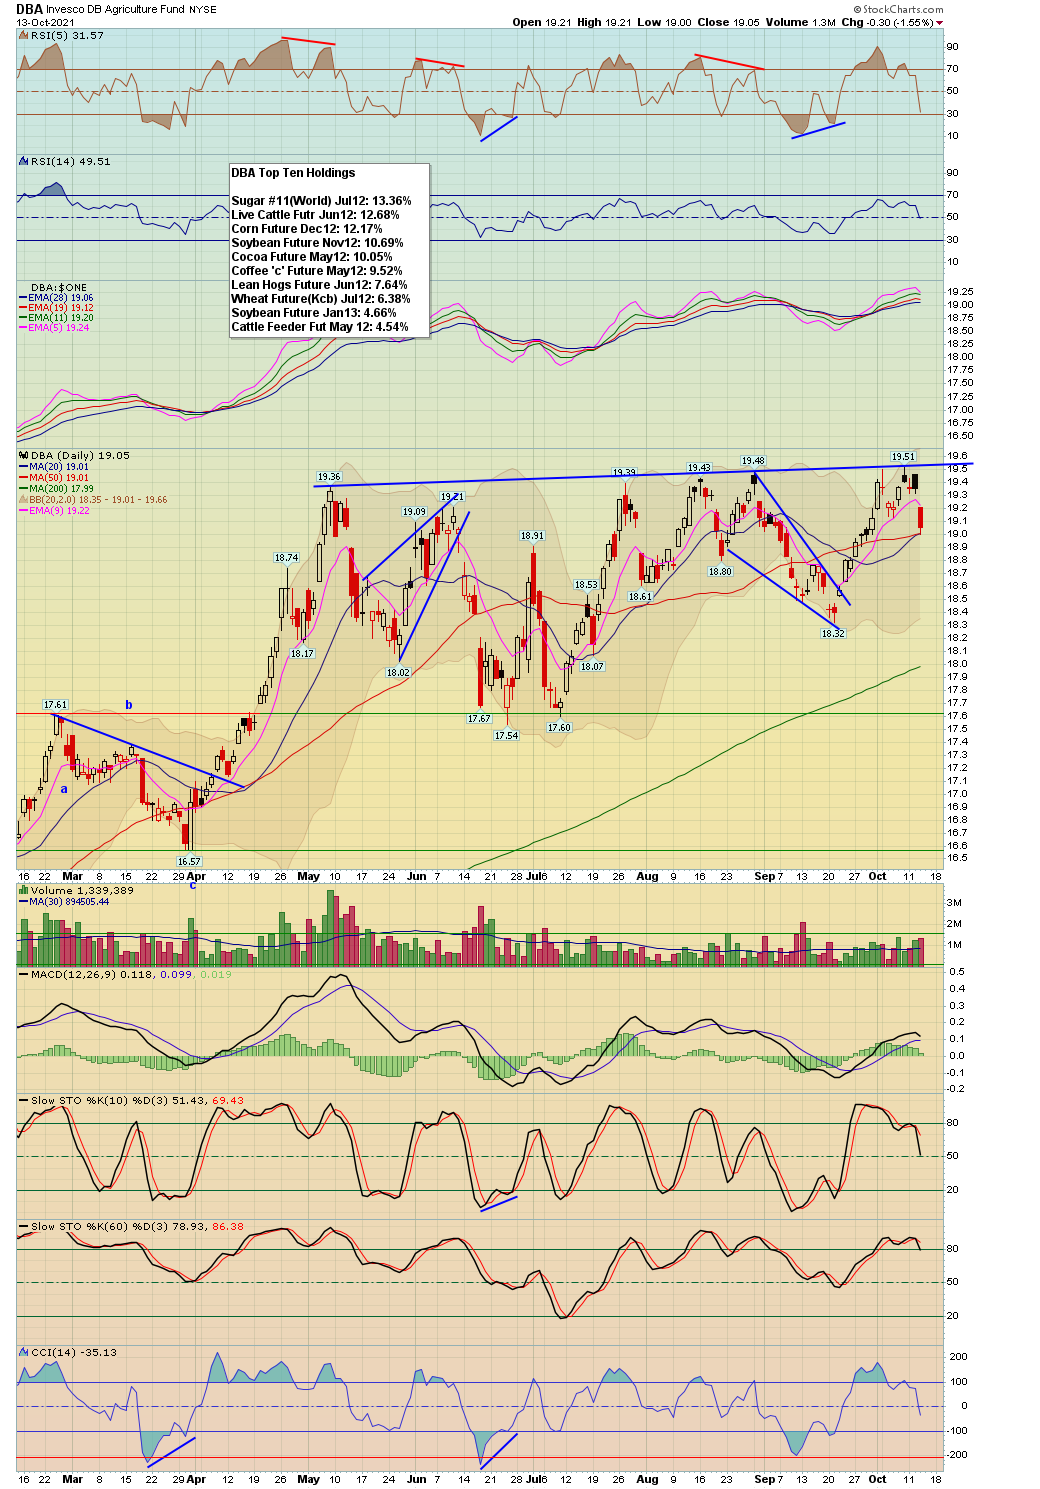
| Agriculture | DBA - W | -1.55% | -1.85% | 19.05 | |
| Corn | CORN - W | CORN - W | -1.96% | -3.44% | 512.25 |
| Wheat | WHEAT - W | WEAT - W | -2.08% | -2.08% | 718.75 |
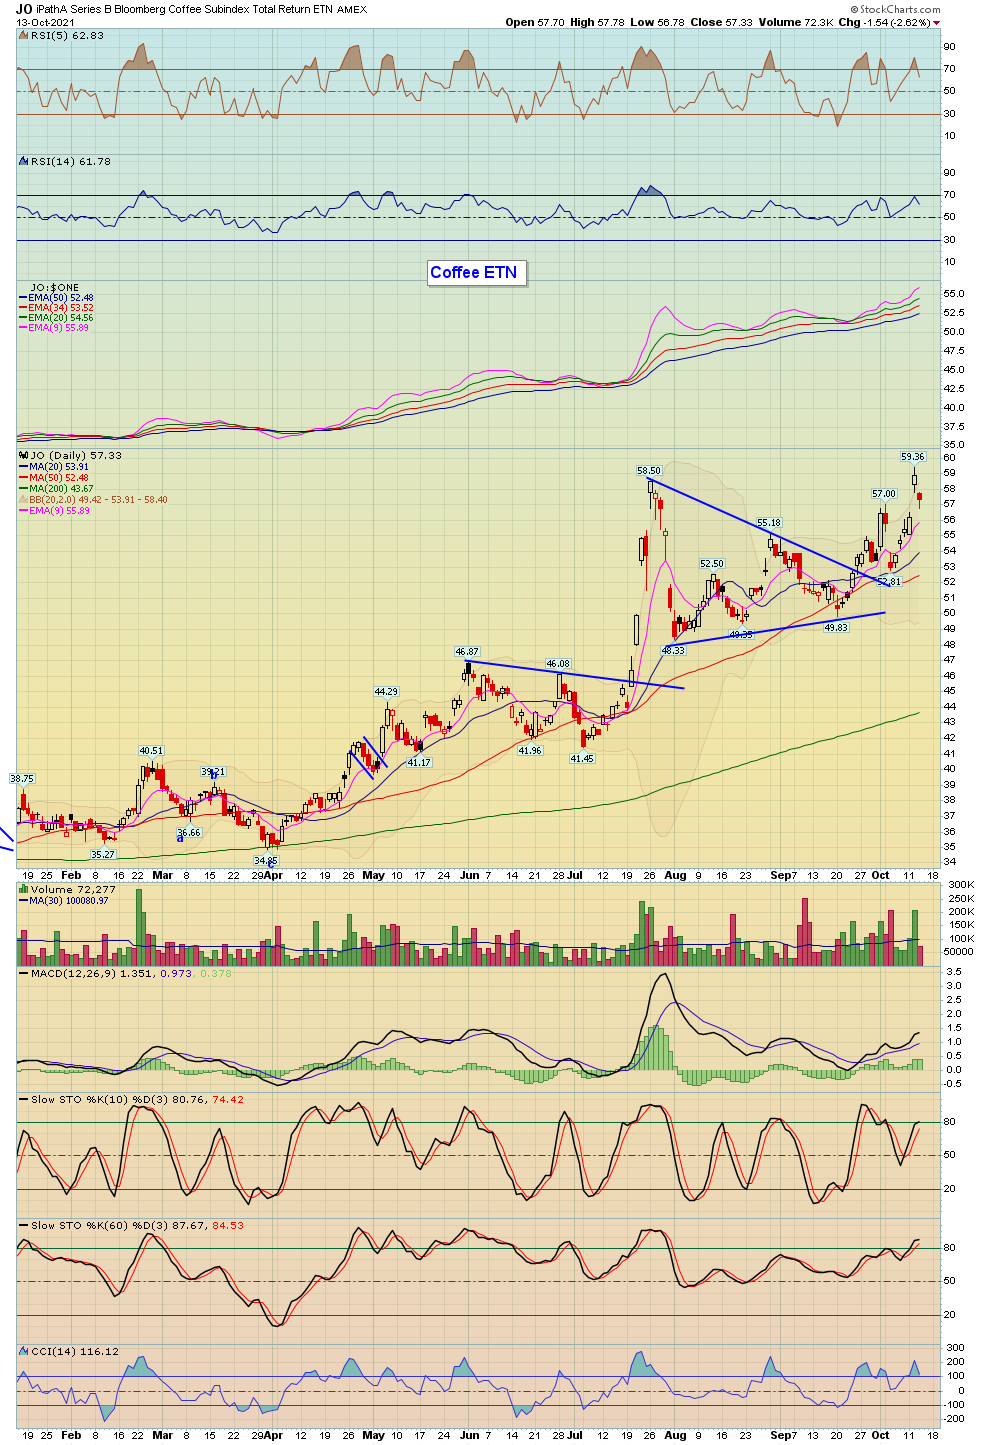
| Coffee | JO - W | -2.62% | 3.45% | 57.33 | |
| Sugar | CANE - W | -0.68% | -1.42% | 9.52 |
| Precious Metals | Index Symbol | ETF Symbol | % G / L Day | % G / L Week | Close |
|---|---|---|---|---|---|
| Gold Metal | GLD - W | 1.78% | 2.05% | 167.59 | |
| Silver | SLV - W | 1.91% | 1.81% | 21.33 | |
| Platinum | PPLT - W | 1.05% | -0.38% | 95.30 | |
| Palladium | PALL - W | 2.51% | 1.53% | 196.48 | |
| GDX Gold Miners ETF | GDX - W | 3.24% | 4.83% | 32.15 |
| Bonds | Index Symbol | ETF Symbol | % G / L Day | % G / L Week | Close |
|---|---|---|---|---|---|
| High Yield Corporate Bond | HYG - W | 0.27% | 0.14% | 86.88 | |
| TLT 20 Year Bond ETF | TLT - W | 0.97% | 2.44% | 145.34 | |
| 10 Year Treasury Yield | TNX - W | -1.96% | -3.49% | 15.49 | |
| 30 Year Treasury Yield | TYX - W | -3.09% | -5.60% | 20.41 |
3
| Release | ET | For | Trading Impact | Forecast | Consensus | Prior |
|---|---|---|---|---|---|---|
| Oct 12 | ||||||
| NFIB Small Business Optimism | 06:00 | Sep | Low | NA | NA | 100.1 |
| JOLTS - Job Openings | 10:00 | Aug | Low | NA | NA | 11.098M |
| Oct 13 | ||||||
| MBA Mortgage Applications Index | 07:00 | 10/09 | Low | NA | NA | -6.9% |
| CPI | 08:30 | Sep | High | 0.3% | 0.3% | 0.3% |
| Core CPI | 08:30 | Sep | High | 0.3% | 0.3% | 0.1% |
| FOMC Minutes | 14:00 | Sept | Medium | NA | NA | NA |
| Oct 14 | ||||||
| PPI | 08:30 | Sep | High | 0.6% | 0.6% | 0.7% |
| Core PPI | 08:30 | Sep | High | 0.5% | 0.5% | 0.6% |
| Initial Claims | 08:30 | 10/09 | High | 323K | 332K | 326K |
| Continuing Claims | 08:30 | 10/02 | High | NA | NA | 2.714M |
| EIA Natural Gas Inventories | 10:30 | 10/09 | Low | NA | NA | +118 bcf |
| EIA Crude Oil Inventories | 11:00 | 10/09 | High | NA | NA | +2.35M |
| Oct 15 | ||||||
| Retail Sales | 08:30 | Sep | High | -0.5% | -0.3% | 0.7% |
| Retail Sales ex-auto | 08:30 | Sep | High | 0.6% | 0.4% | 1.8% |
| Empire State Manufacturing | 08:30 | Oct | Low | 27.0 | 25.0 | 34.3 |
| Import Price Index | 08:30 | Sep | Low | NA | NA | -0.3% |
| Import Prices ex-oil | 08:30 | Sep | Low | NA | NA | -0.1% |
| Export Price Index | 08:30 | Sep | Low | NA | NA | 0.4% |
| Export Prices ex-ag. | 08:30 | Sep | Low | NA | NA | 0.2% |
| Business Inventories | 10:00 | Aug | Low | 0.7% | 0.7% | 0.5% |
| Univ. of Michigan Consumer Sentiment - Prelim | 10:00 | Oct | High | 73.0 | 73.5 | 72.8 |
Stock Earnings Calender:
Click here for a list of Stocks that are reporting Earnings
**Generally we never hold a position into earnings since the risk/reward is too great
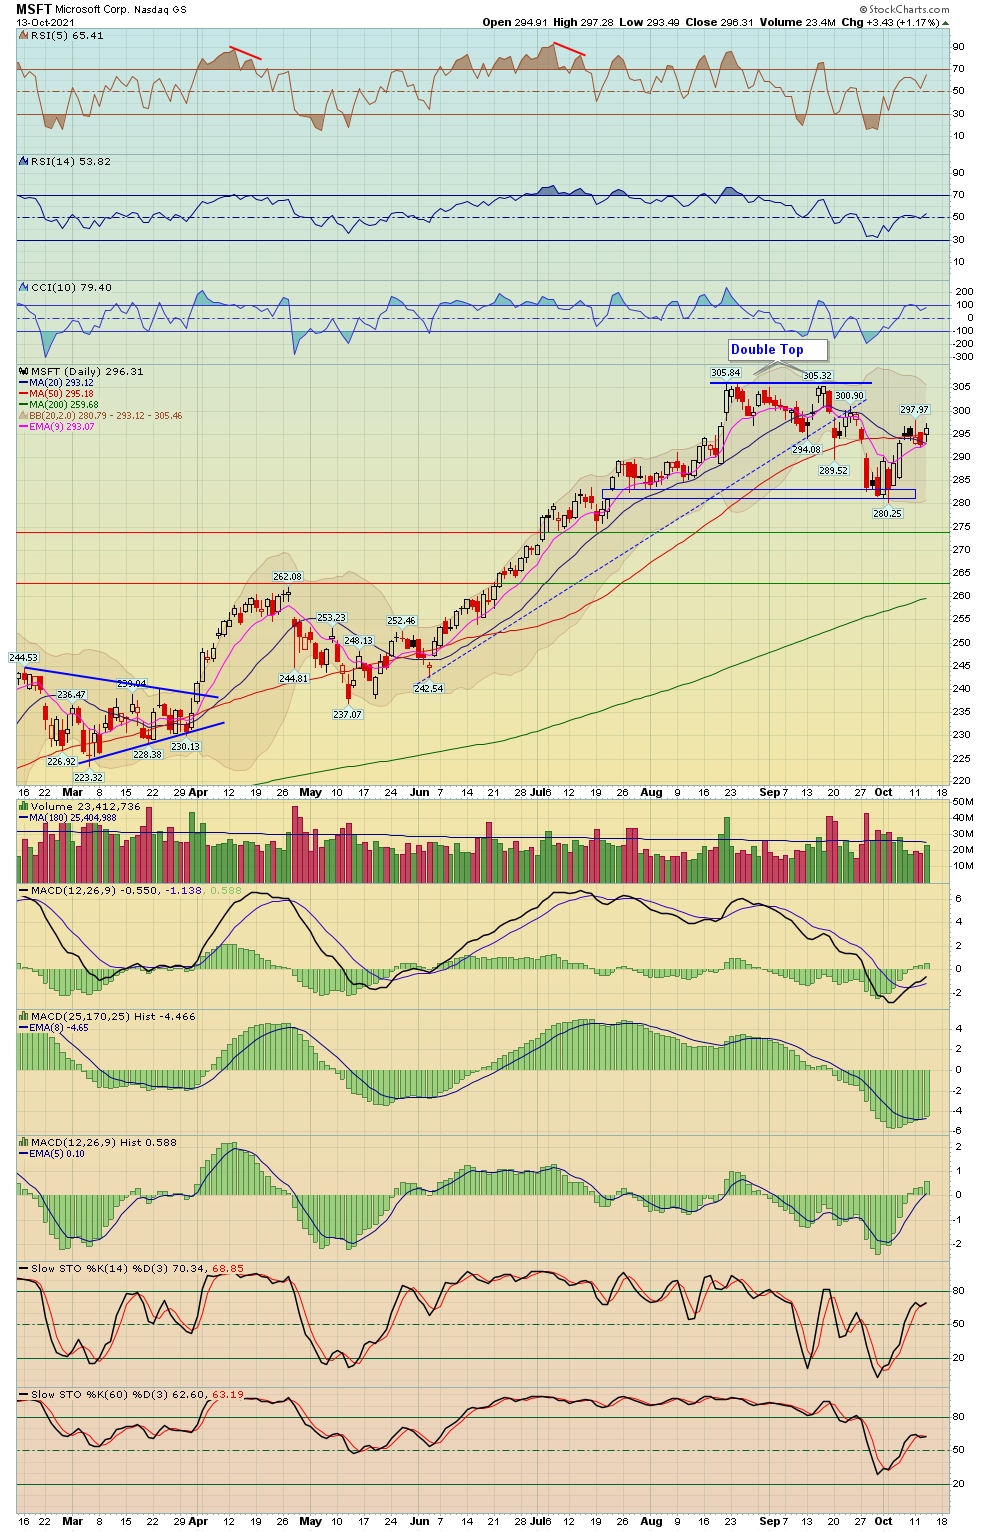
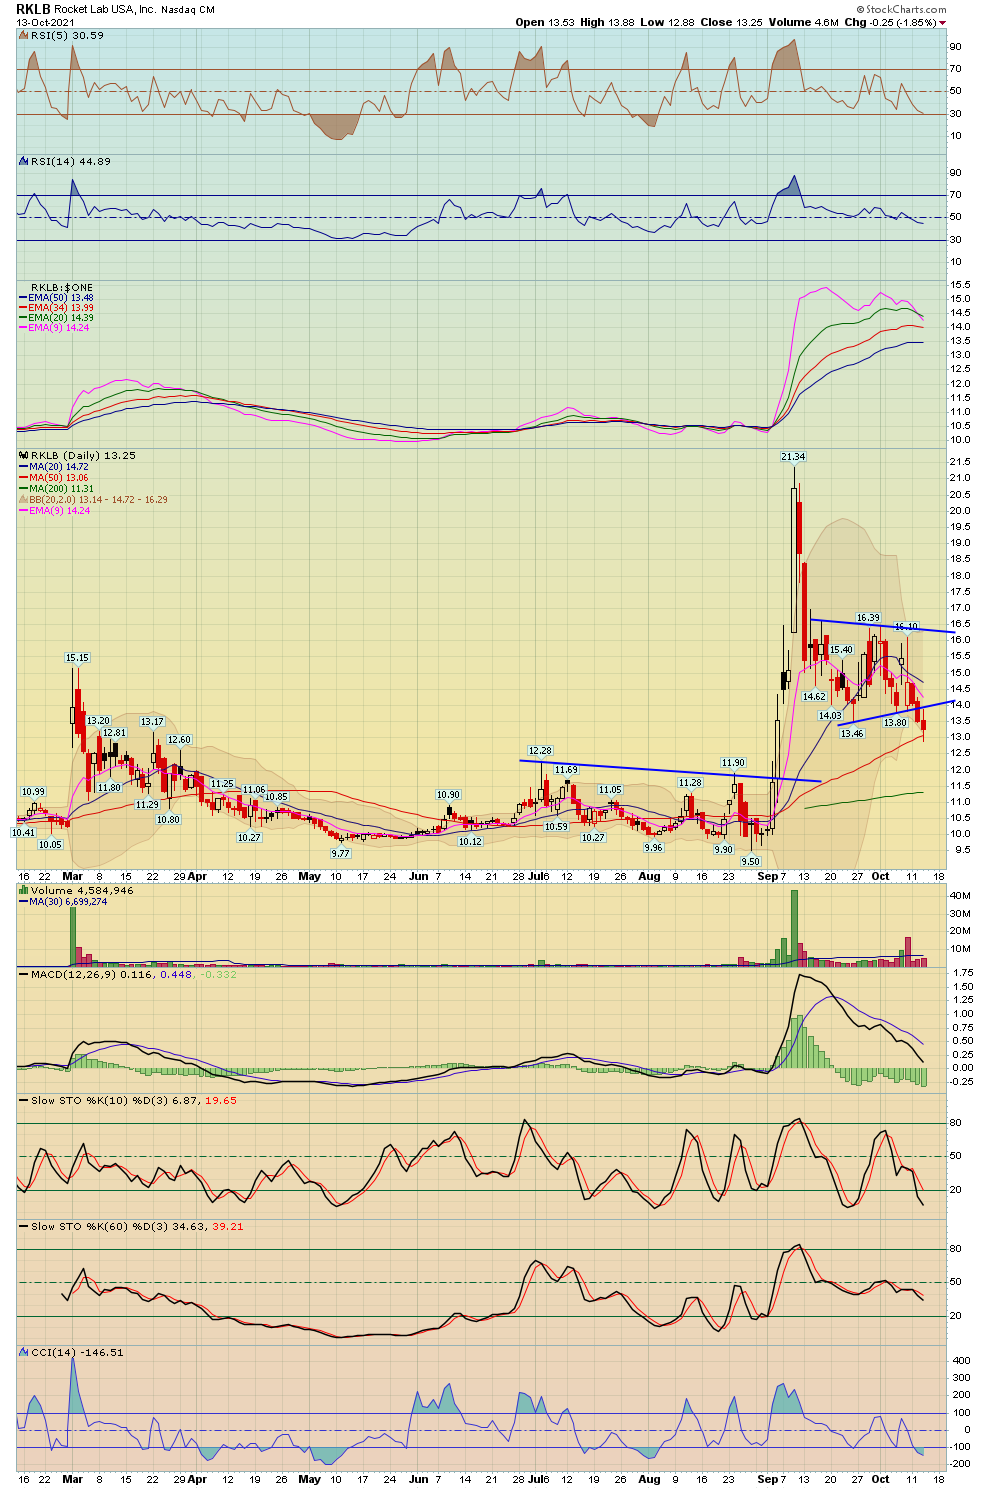
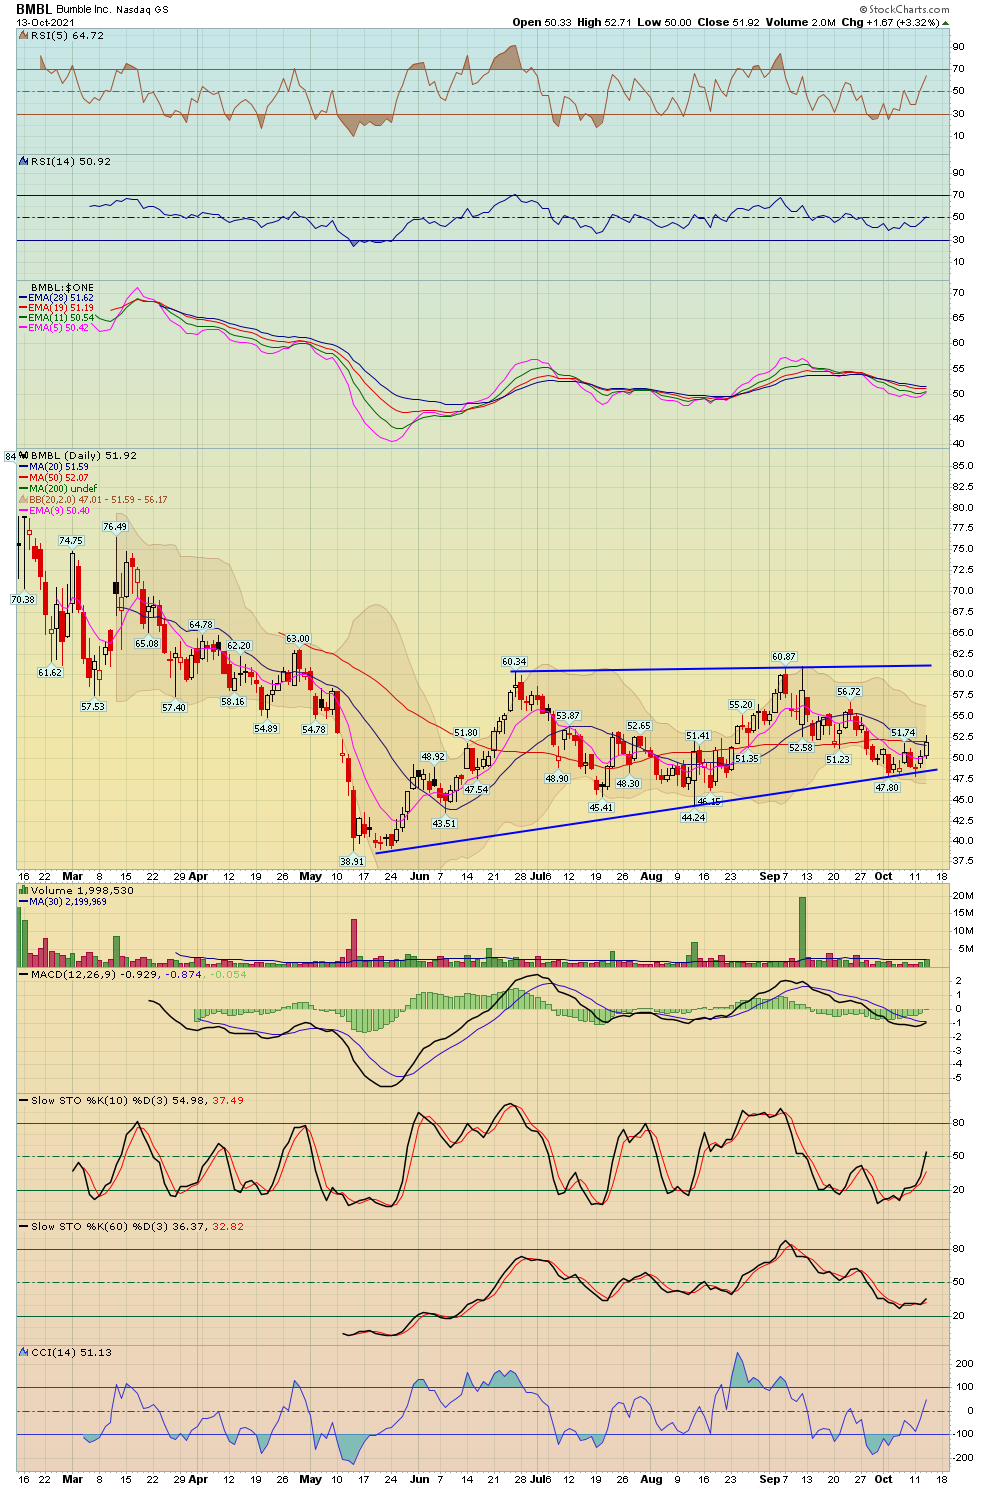
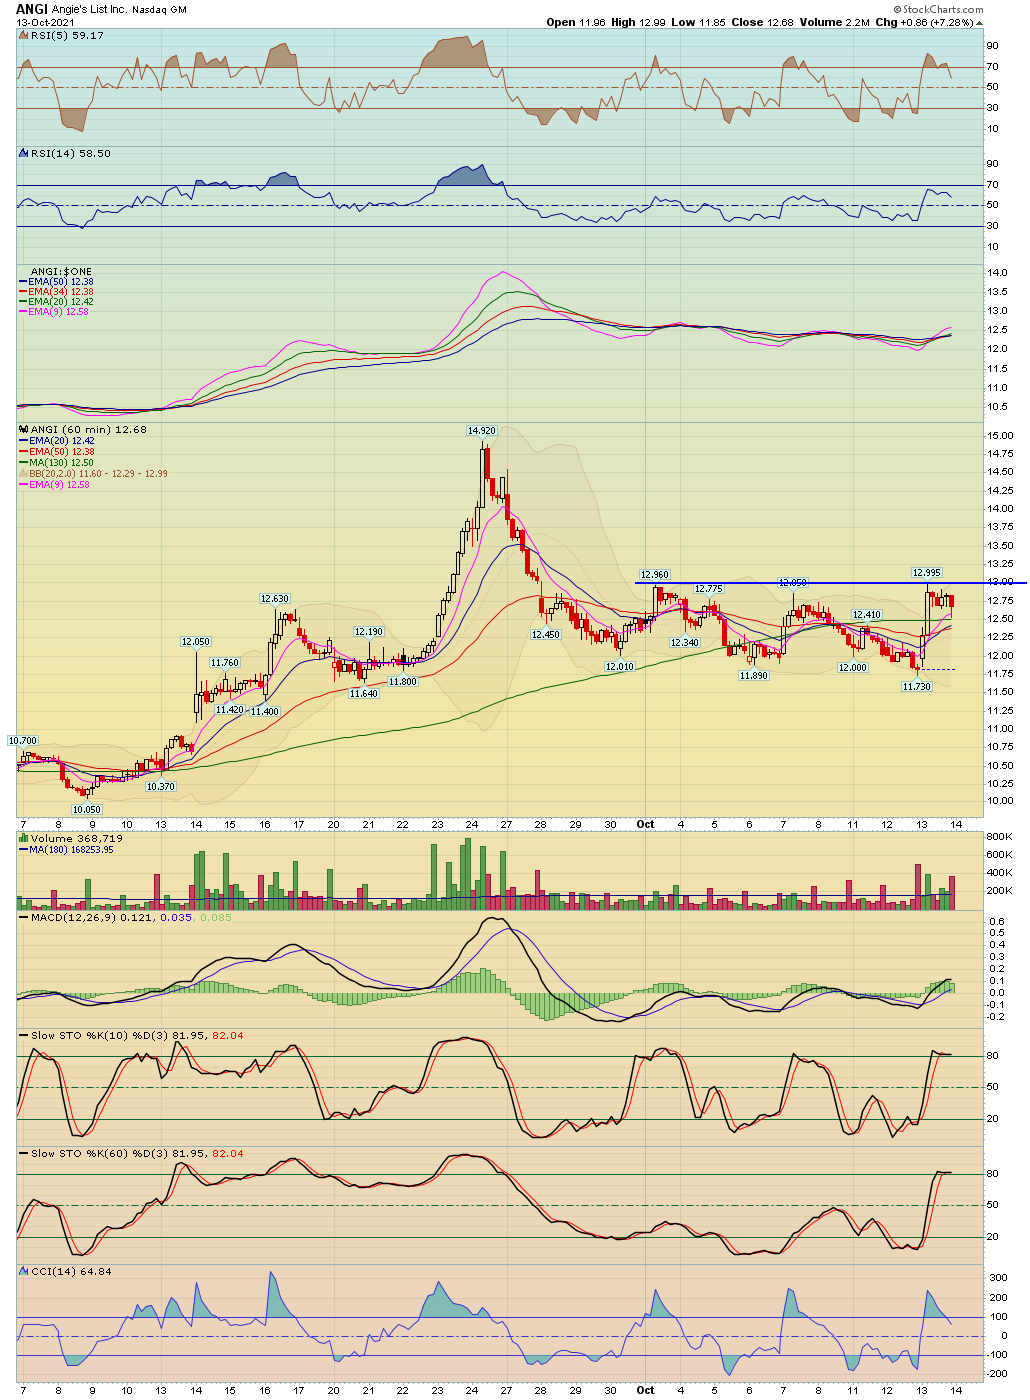
4 - View Live Chart
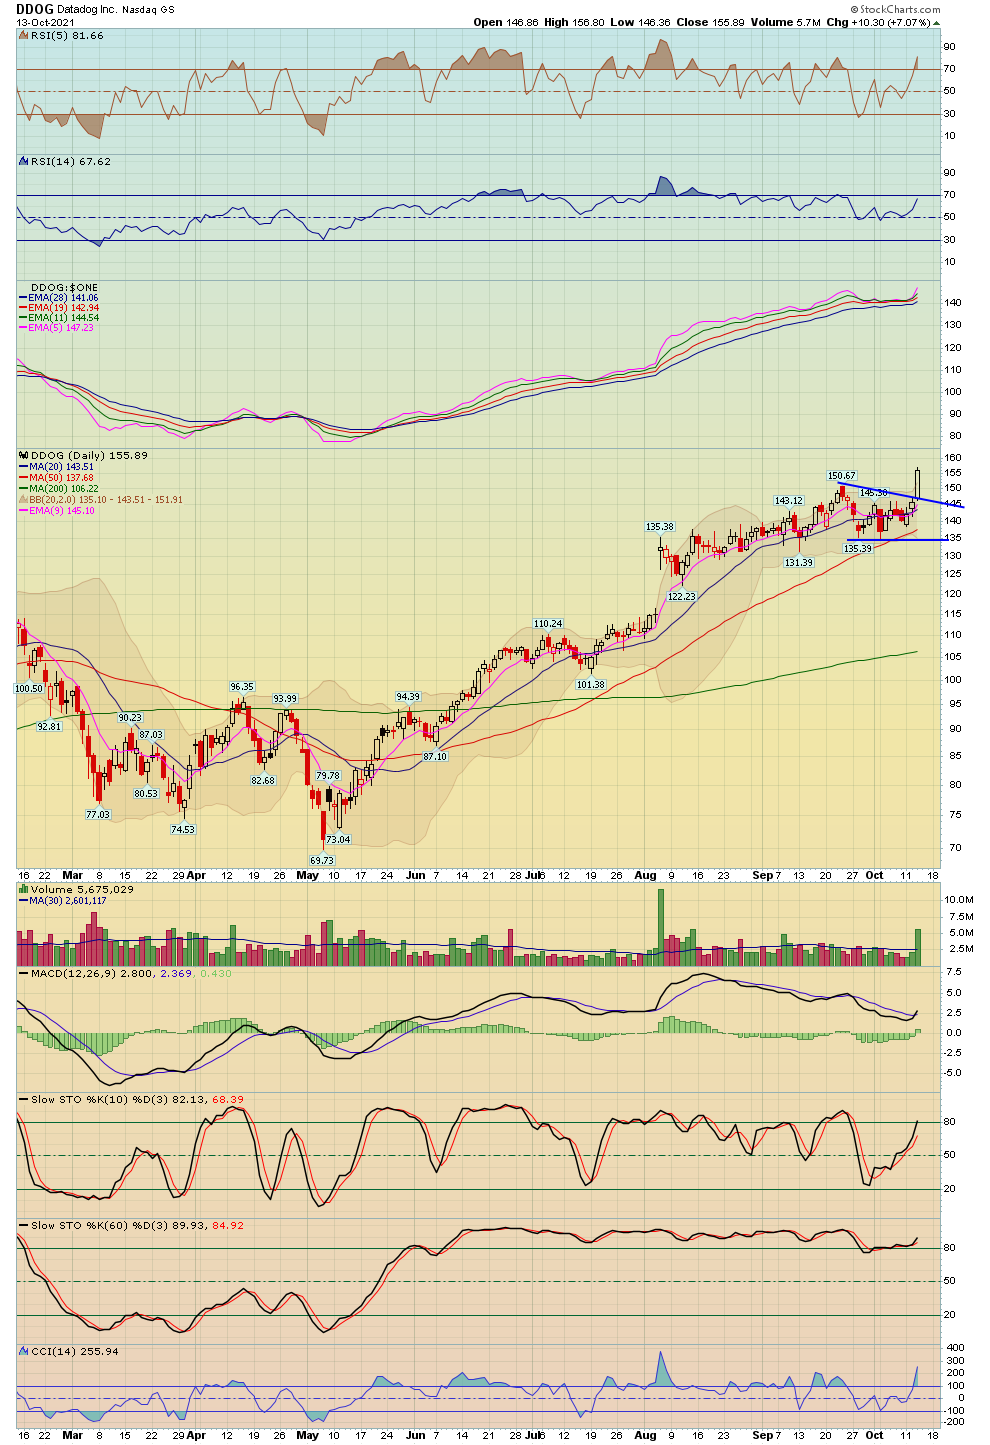
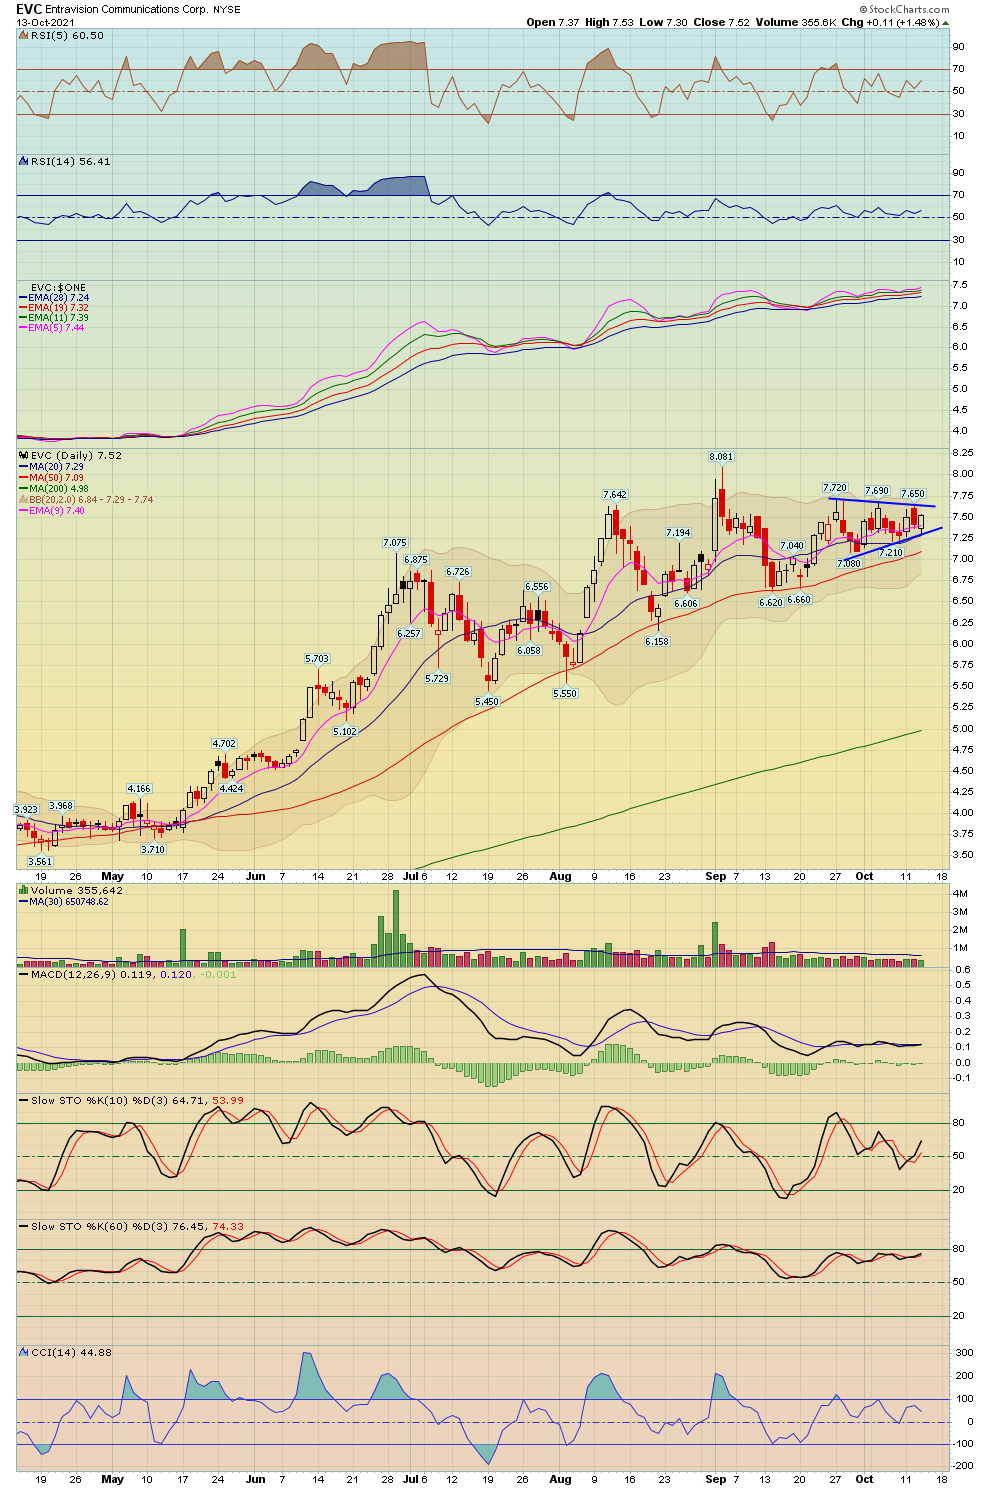
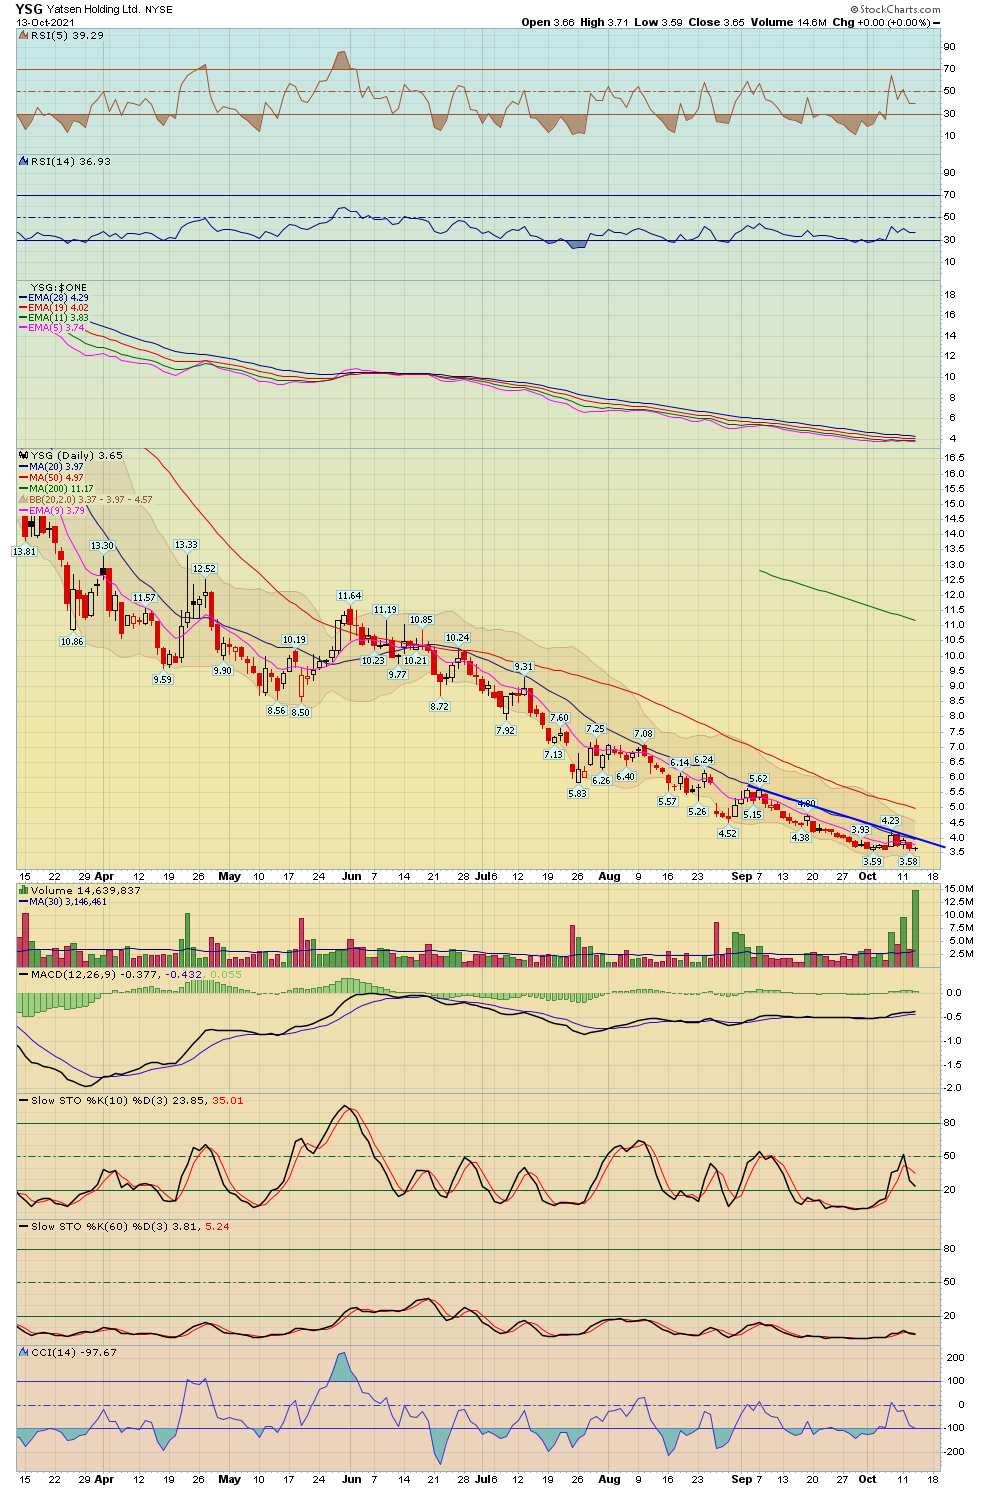
5 - View Live Chart
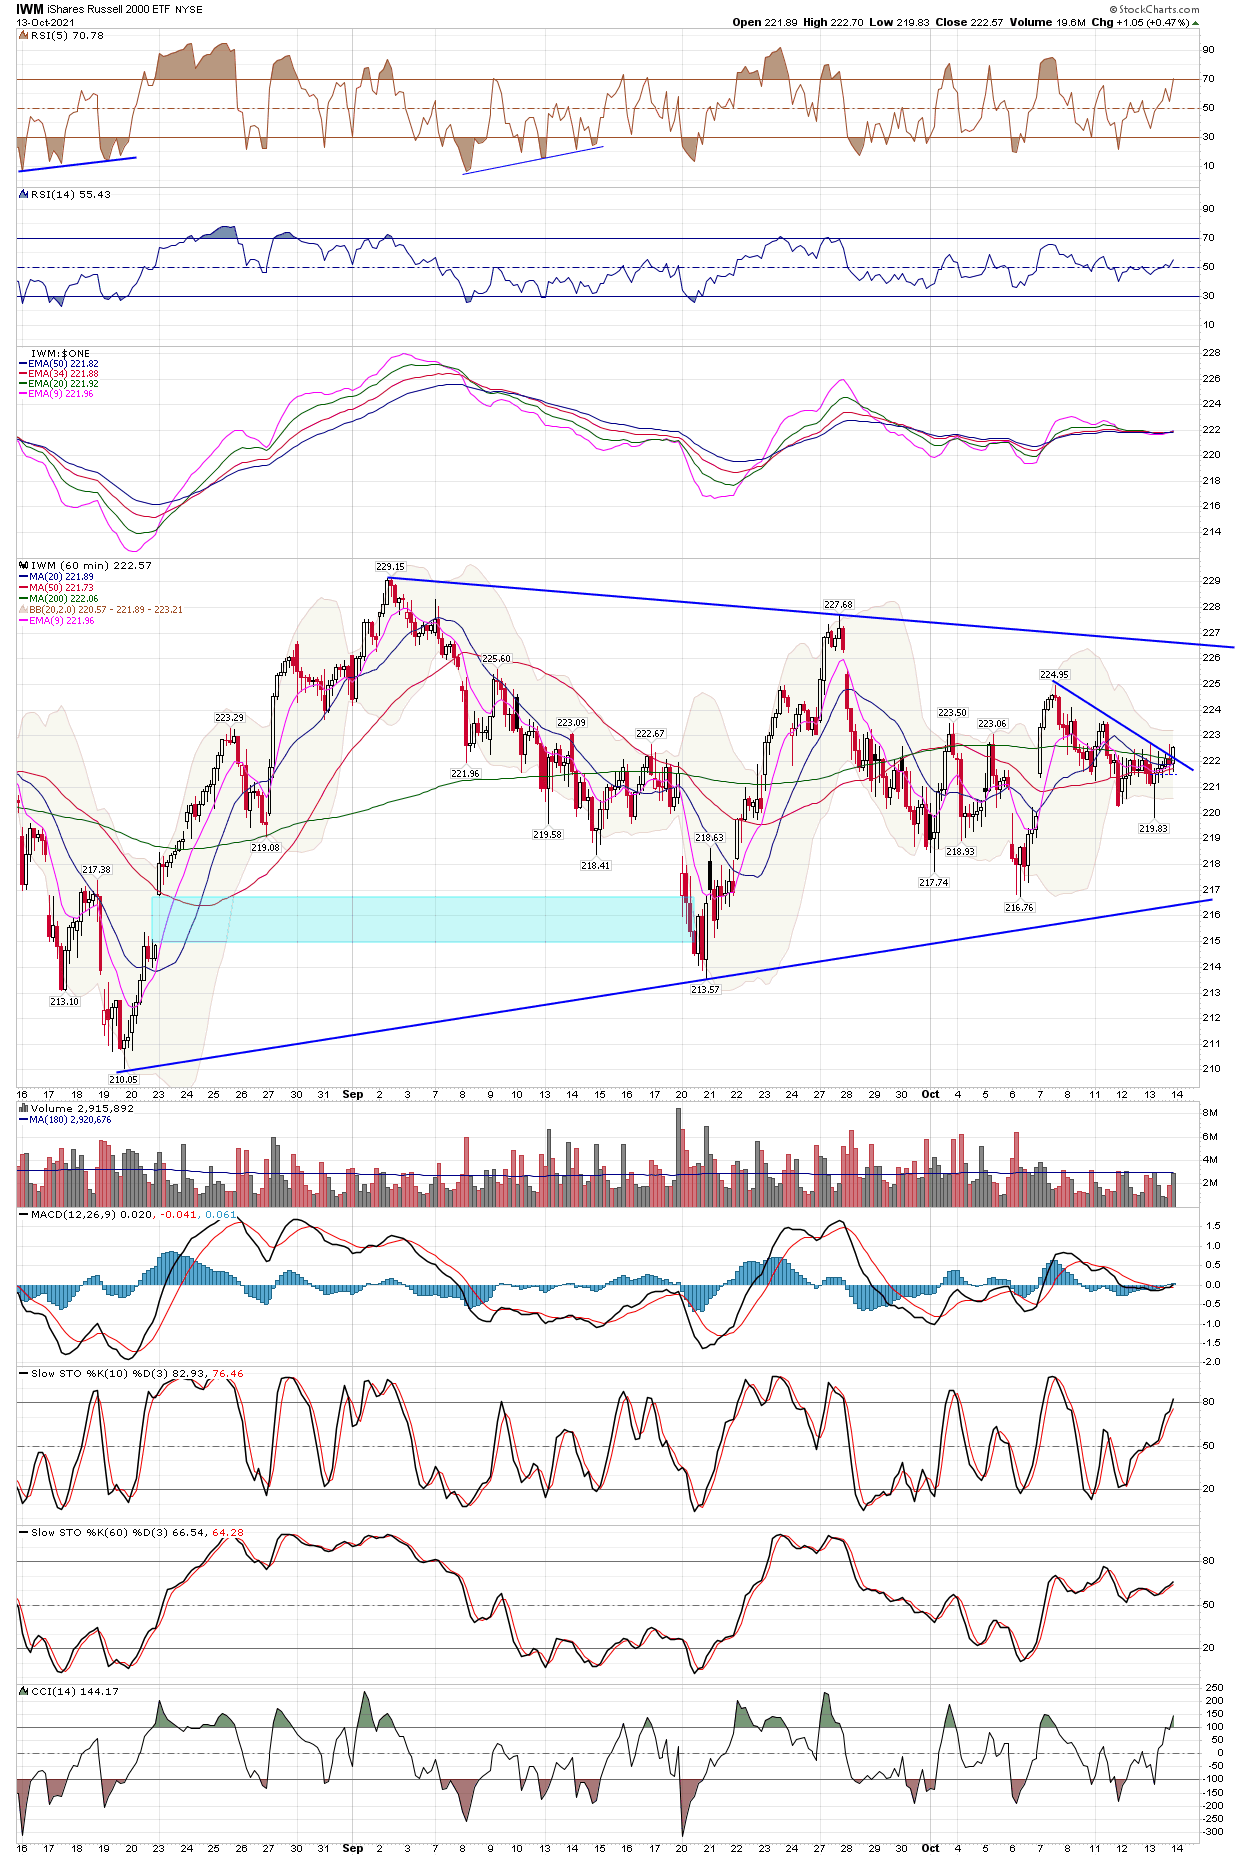
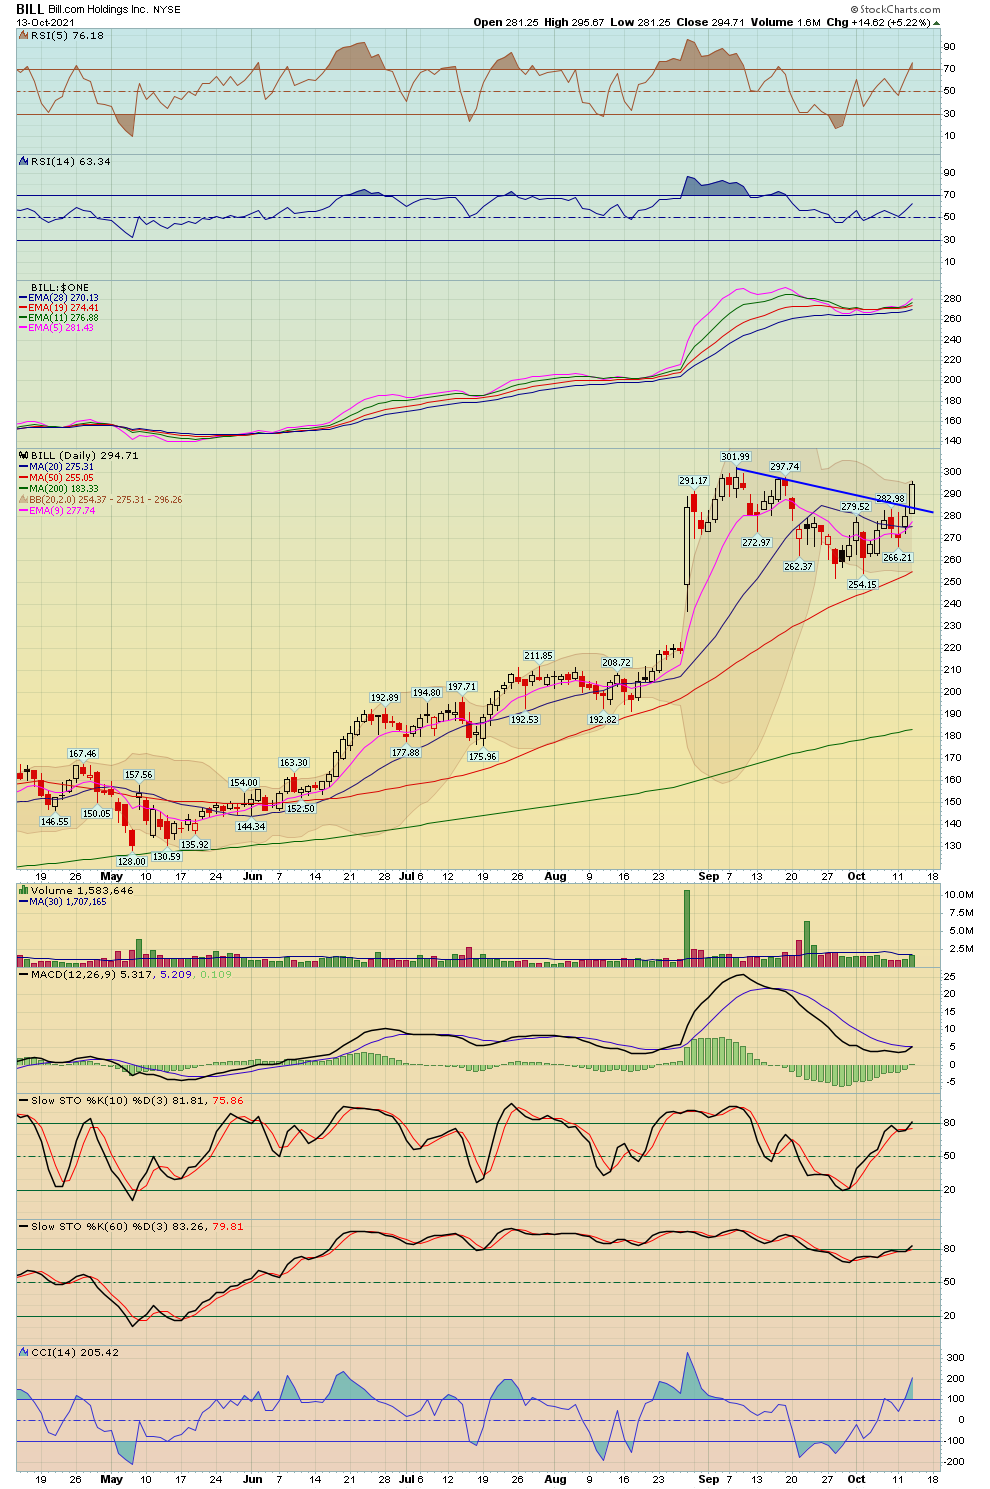
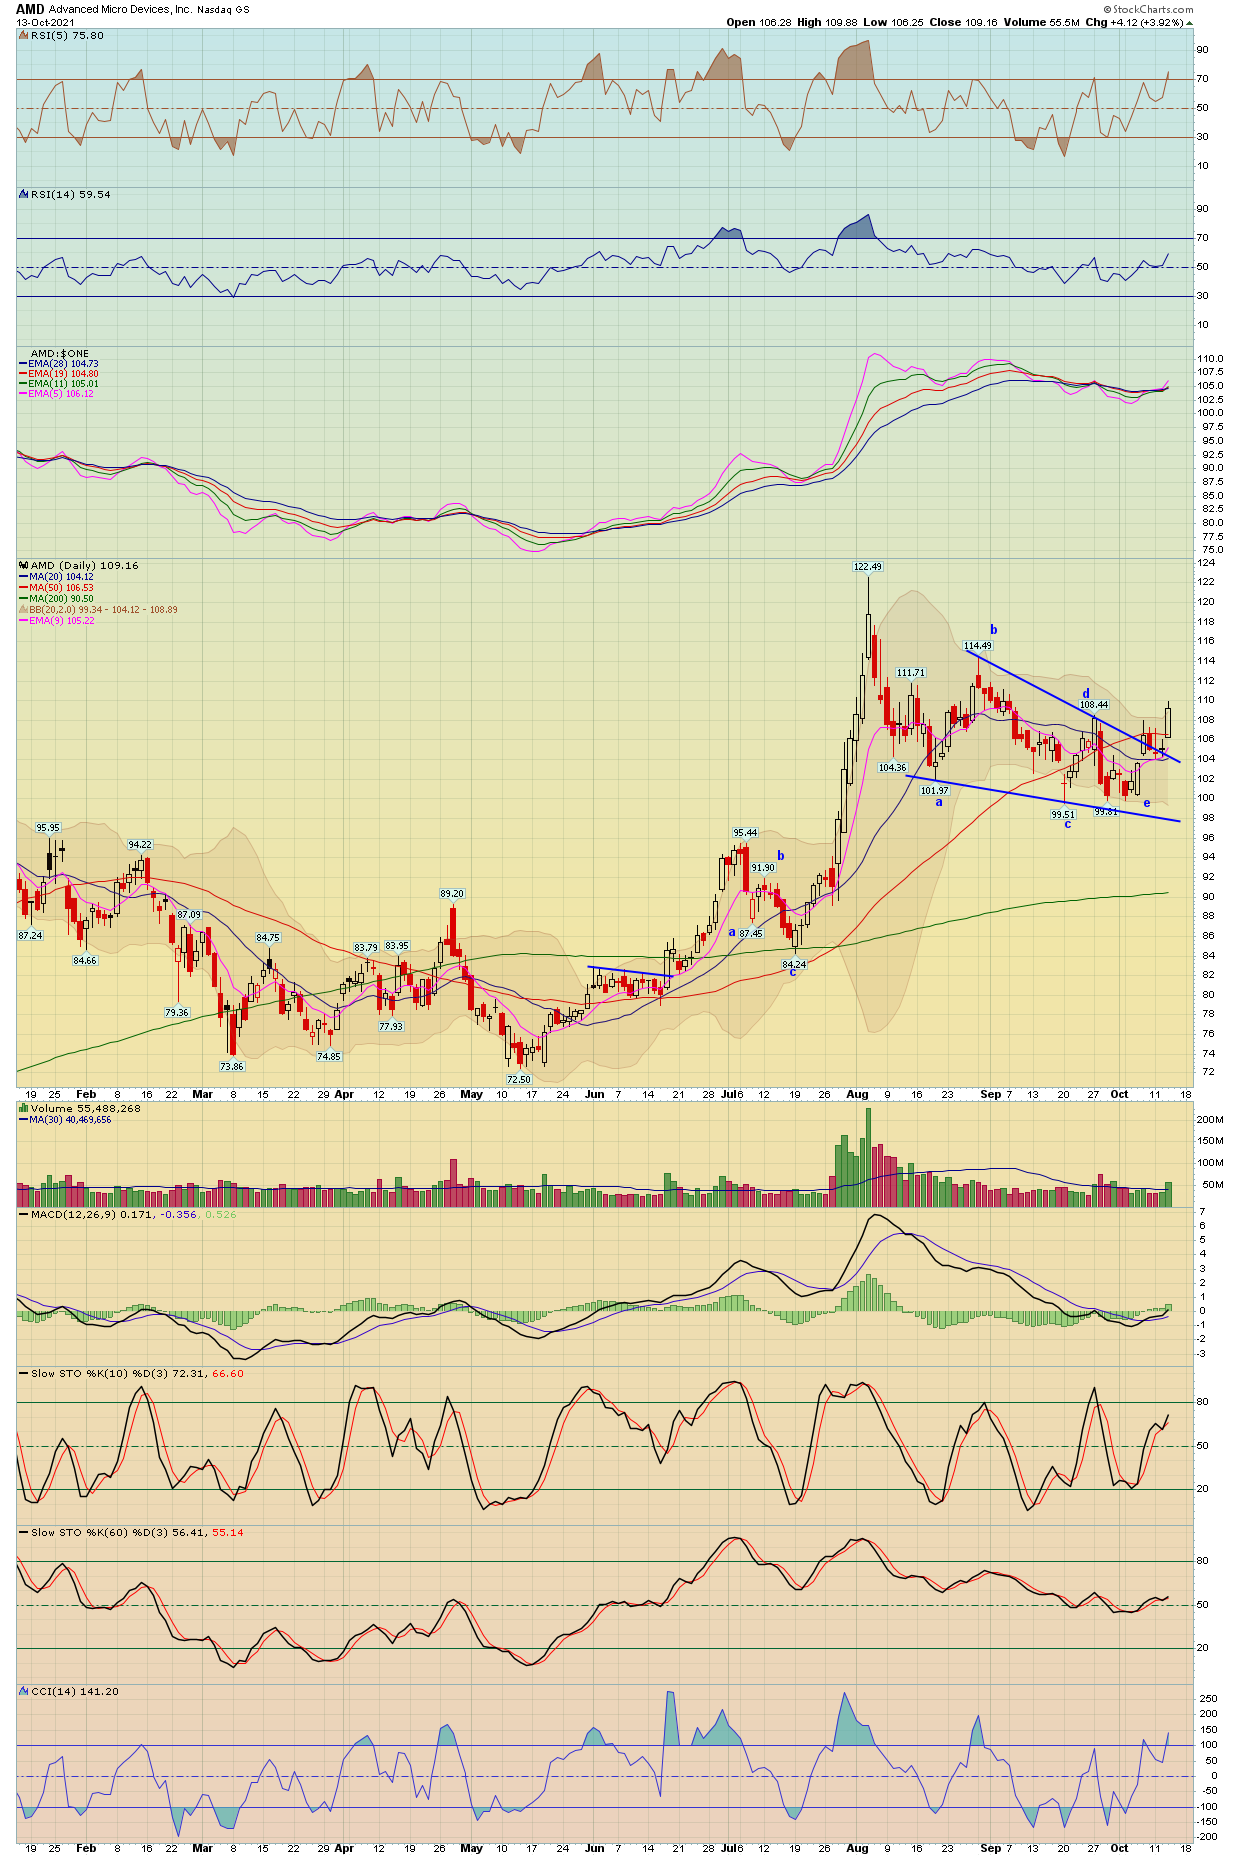
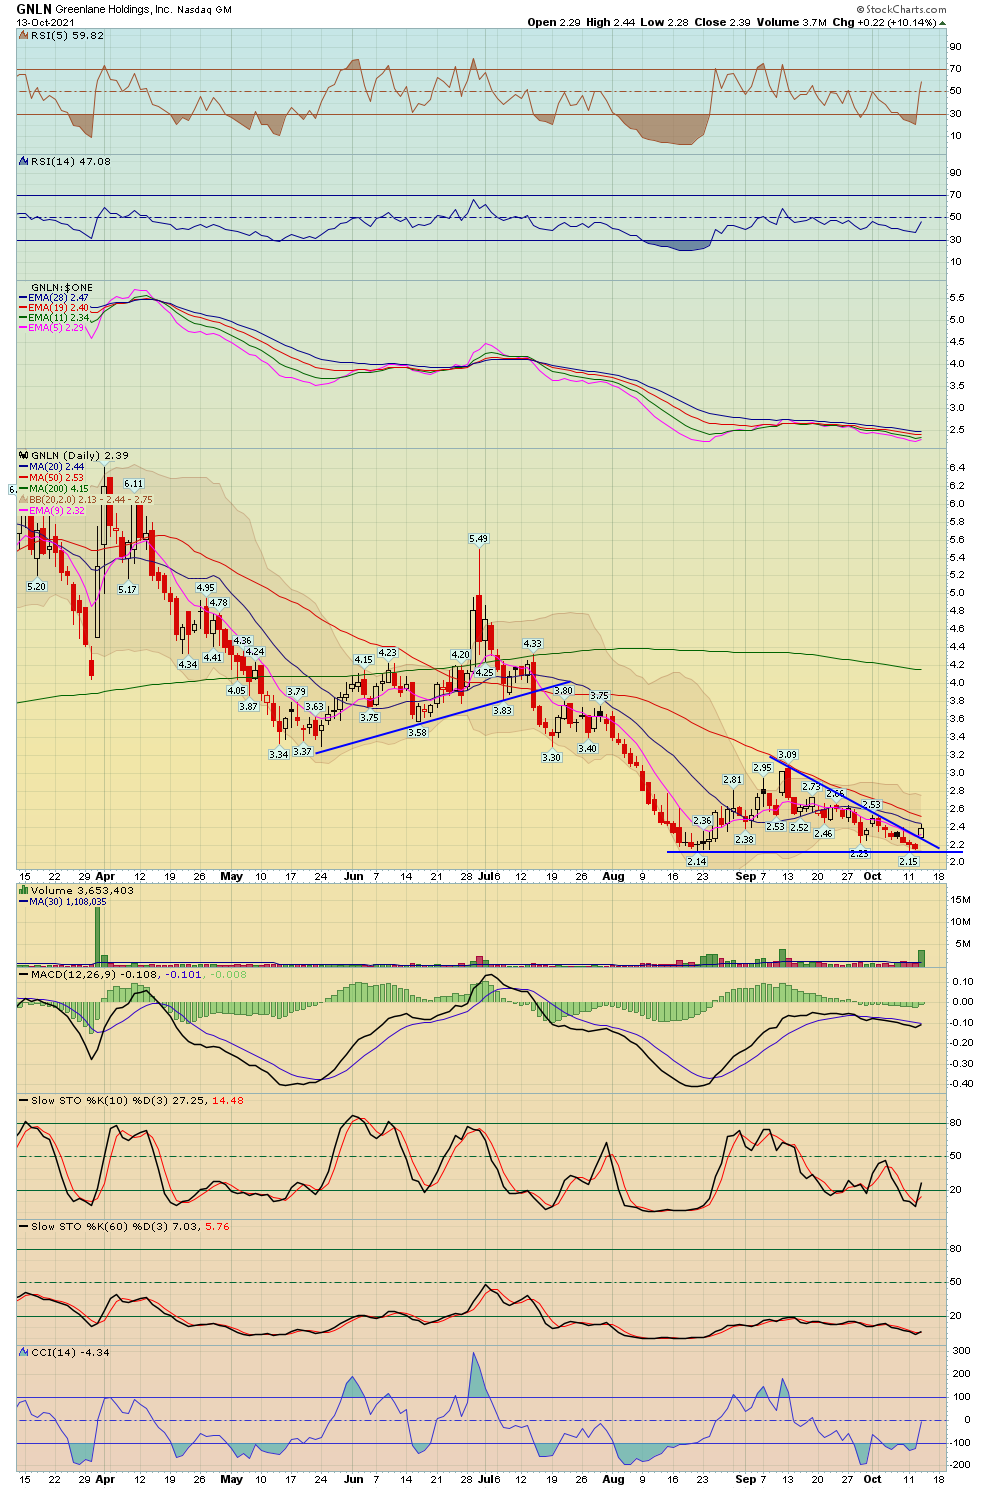
6 - View Live Chart
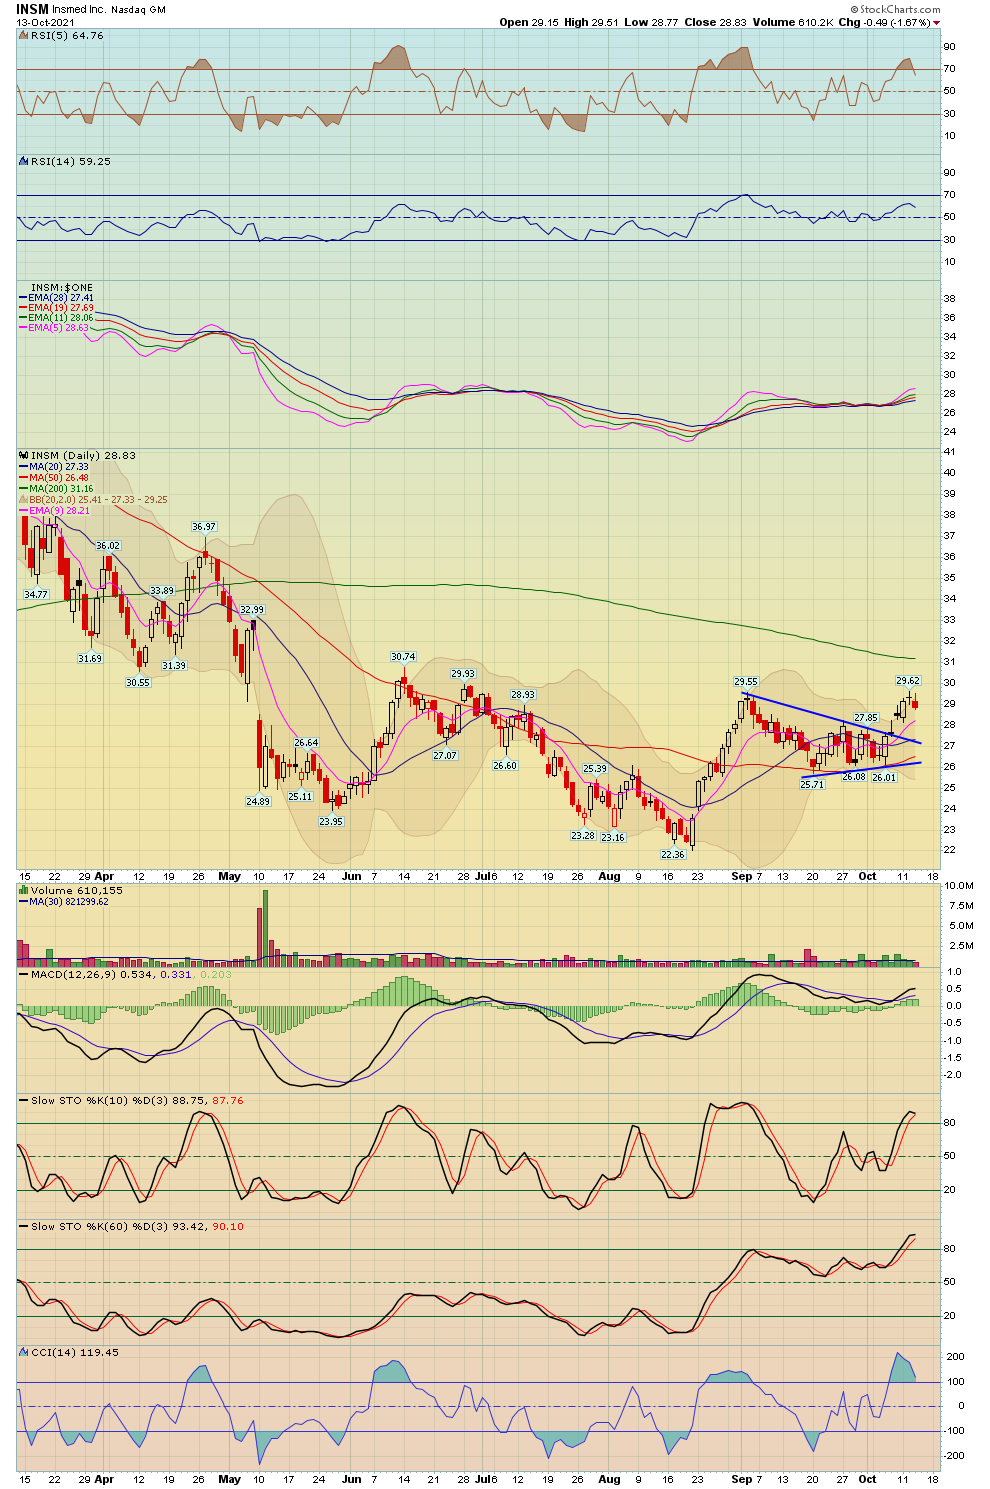
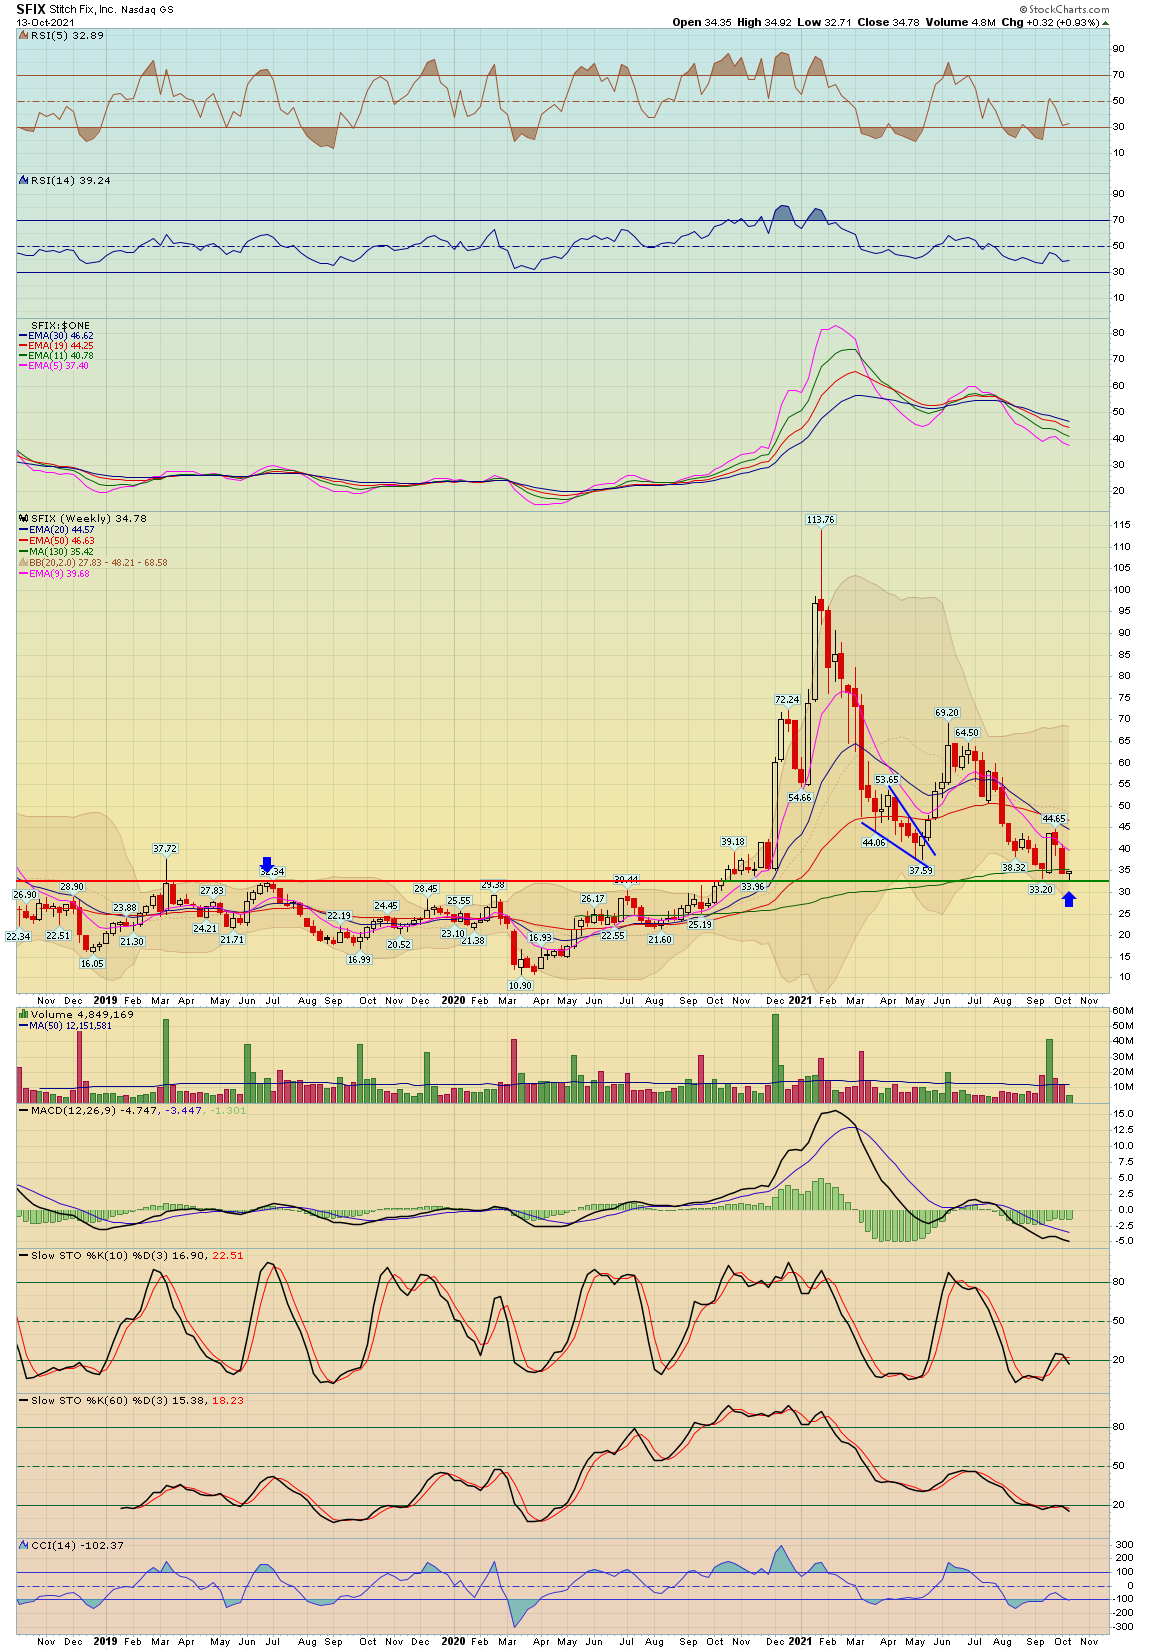
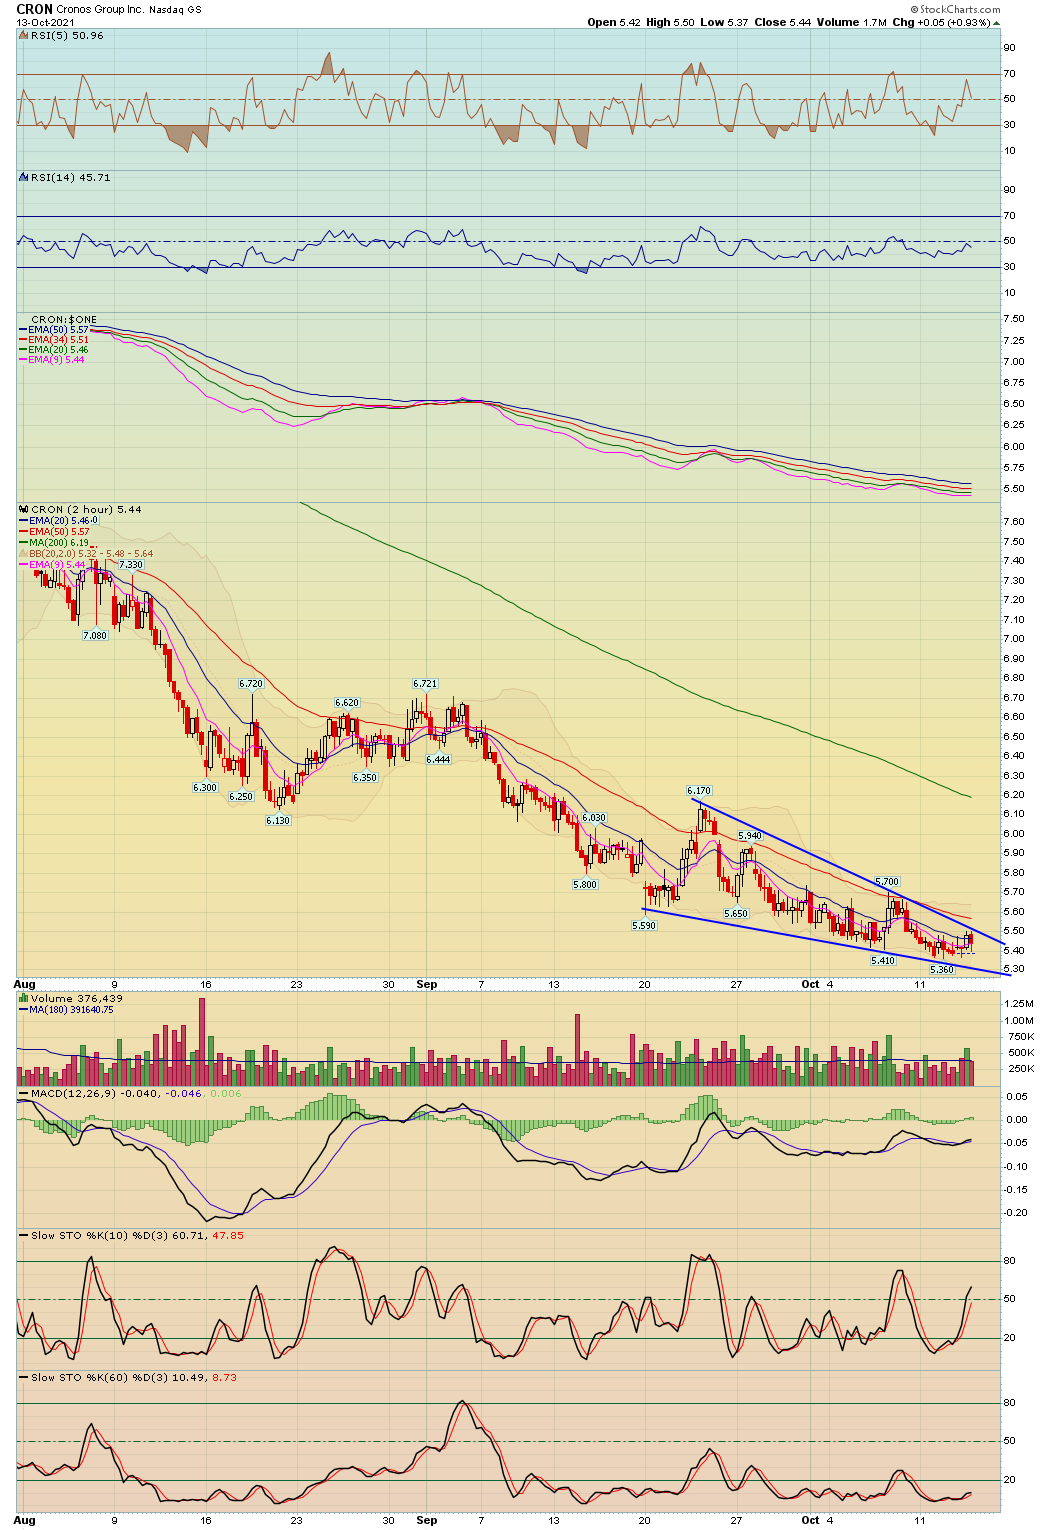
7 - View Live Chart
8 - View Live Chart
9 - View Live Chart
10
11
12 - View Live Chart
13 - View Live Chart
14 - View Live Chart
15 - View Live Chart
16
17
18 - View Live Chart
19 - View Live Chart
20 - View Live Chart
21 - View Live Chart
22 - View Live Chart
23 - View Live Chart
24 - View Live Chart
25 - View Live Chart
26 - View Live Chart
27 - View Live Chart
28 - View Live Chart
29 - View Live Chart
30 - View Live Chart
31 - View Live Chart
32 - View Live Chart
33 - View Live Chart
34 - View Live Chart
35 - View Live Chart
36 - View Live Chart
37 - View Live Chart
38 - View Live Chart
39 - View Live Chart
40 - View Live Chart
41 - View Live Chart
42 - View Live Chart
43 - View Live Chart
44 - View Live Chart
45 - View Live Chart
46 - View Live Chart
47 - View Live Chart
48 - View Live Chart
49 - View Live Chart
50 - View Live Chart
51 - View Live Chart
52 - View Live Chart
53 - View Live Chart
54 - View Live Chart
55 - View Live Chart
56 - View Live Chart
57 - View Live Chart
58 - View Live Chart
59 - View Live Chart
60 - View Live Chart
61 - View Live Chart
62 - View Live Chart
63 - View Live Chart
64 - View Live Chart
65 - View Live Chart
66 - View Live Chart
67 - View Live Chart
68 - View Live Chart
69 - View Live Chart
70 - View Live Chart
71 - View Live Chart
72 - View Live Chart
73 - View Live Chart
74 - View Live Chart
75 - View Live Chart
76 - View Live Chart
77 - View Live Chart
78 - View Live Chart
79 - View Live Chart
80 - View Live Chart
81 - View Live Chart
82 - View Live Chart
83 - View Live Chart
- Hide Player Link to Newsletter Audio