BPT Weekend Newsletter for Sunday August 29th, 2021 - free
Disclaimer: Intraday Chart Links will show up as daily charts unless you have an active stockcharts.com membership and are signed in, you can sign up here.
1
Table of Contents:
1. Glance at last Week Stats, Upcoming Economic Table, Earnings Release Dates
2. Review of the Major Indexes/Indicators
3. Examine All Sector Charts
4. Commodities (Crude Oil, Natural Gas, Copper, DBA, Lumber, Coffee, Uranium)
5. Overview of Bonds via TLT/JNK
6. Currencies (US Dollar, Euro) and Bitcoin
7. Precious Metals (Gold/Silver) and GDX/GDXJ and a few individual names
8. Trade Setups: Mostly covering triggered setups from the last 1 - 2 weeks, otherwise did add a few new setups.
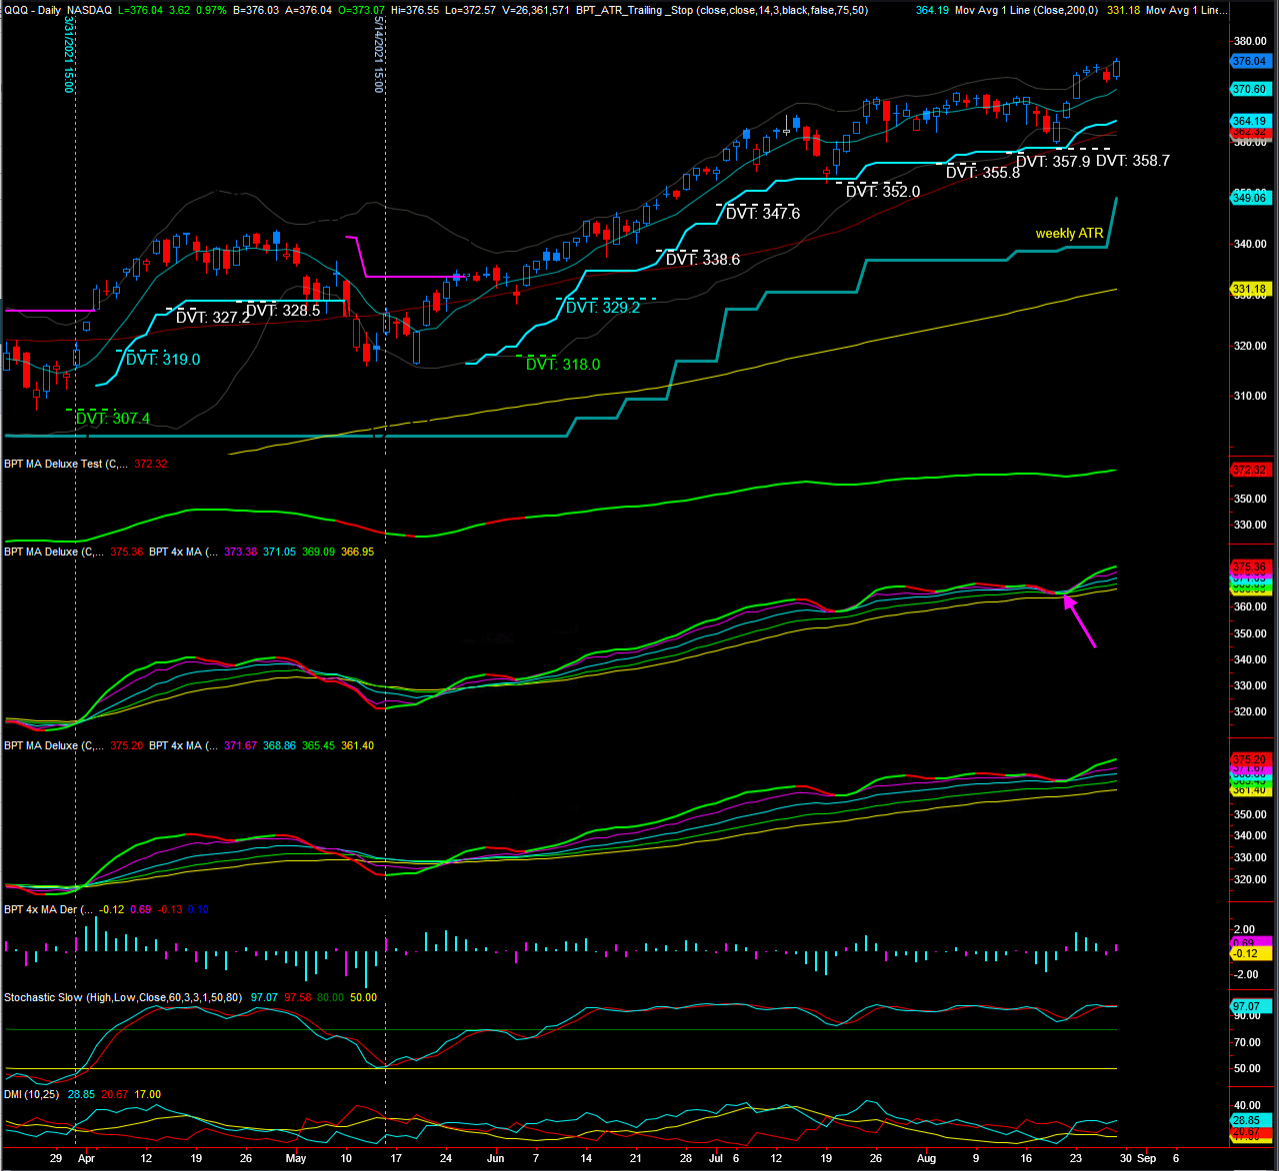
Quick Comments: The market has continued to push higher since after that brief correction ended last Thursday morning. On Friday the SPX closed at a new all-time high and closed up 1.5% for the week. The Nasdaq 100 QQQ also closed at at a new all-time high on Friday and closed up 2.8% for the week. The Dow Jones closed up the least for the week gaining about 1%, while the Russell 2000 gained the most closing up 5% for the week! Basically, what we are seeing here is the Russell 2000 playing some catch up to the other indexes as it's lagged behind the other major indexes for so long.
As you know Jackson Hole was on Thursday and Friday and Powell on Friday basically made it clear that the Fed wasn't going to taper anytime soon. Let's face it guys, these billings and trillions of dollars of money printing and liquidity are what's been driving the market for years - at the end of the day that's all that maters. The market is like a hopelessly addicted heroin addict and the drugs (money printing and liquidity) must continue to flow in order to sustain the uptrend. Clearly the market responded very favorably to Powell's dovish comments on Friday.
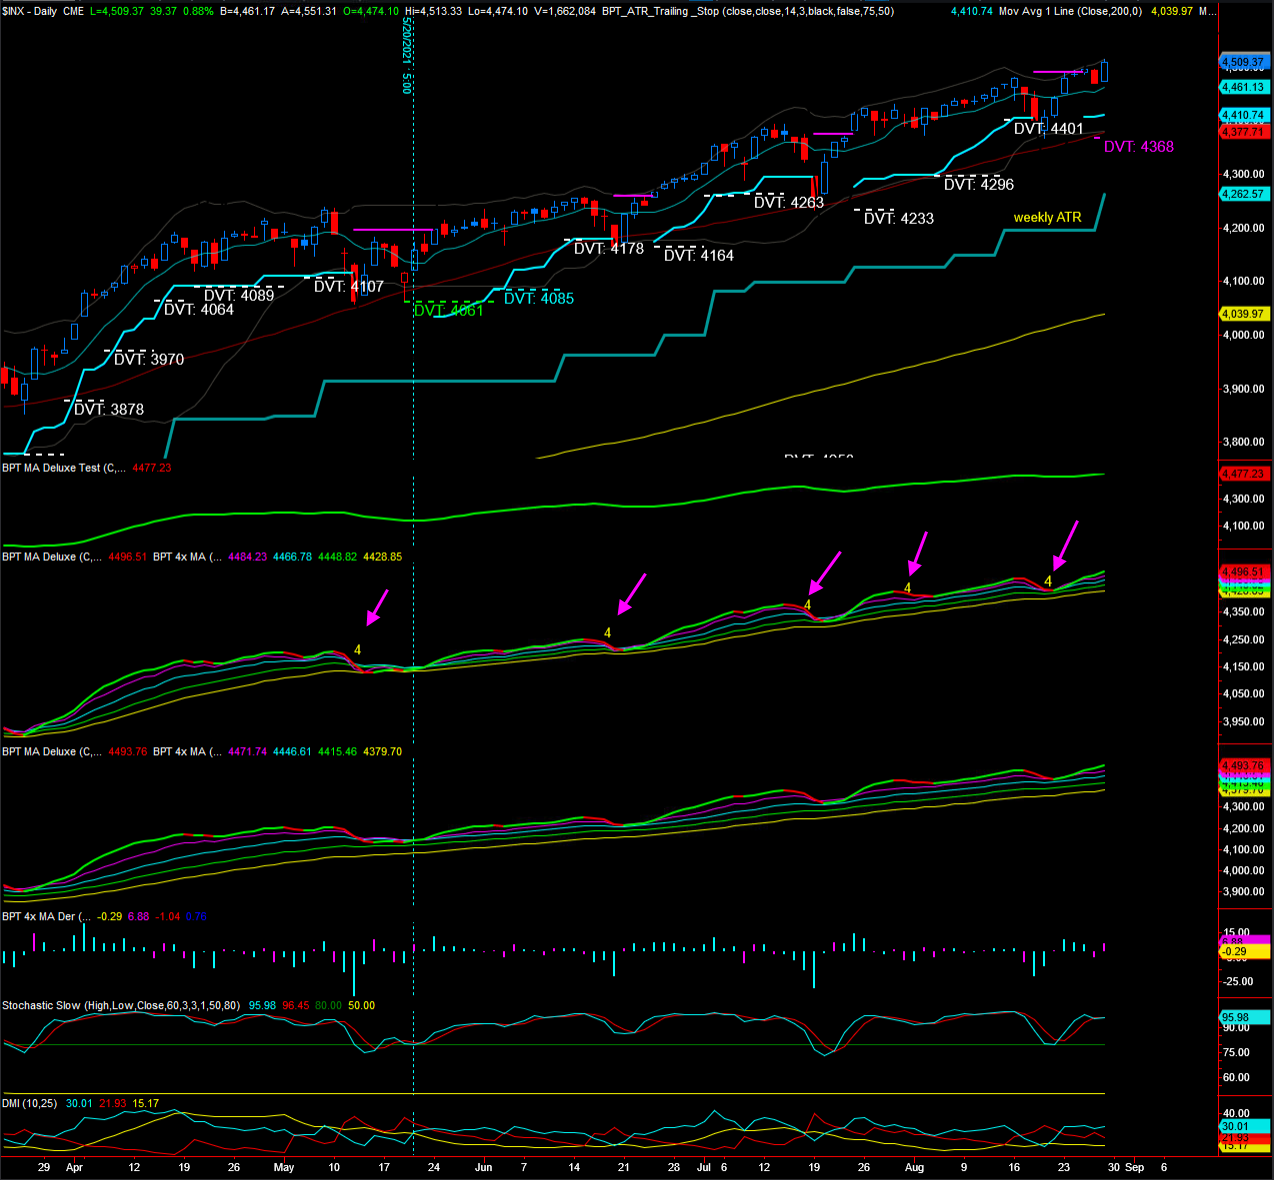
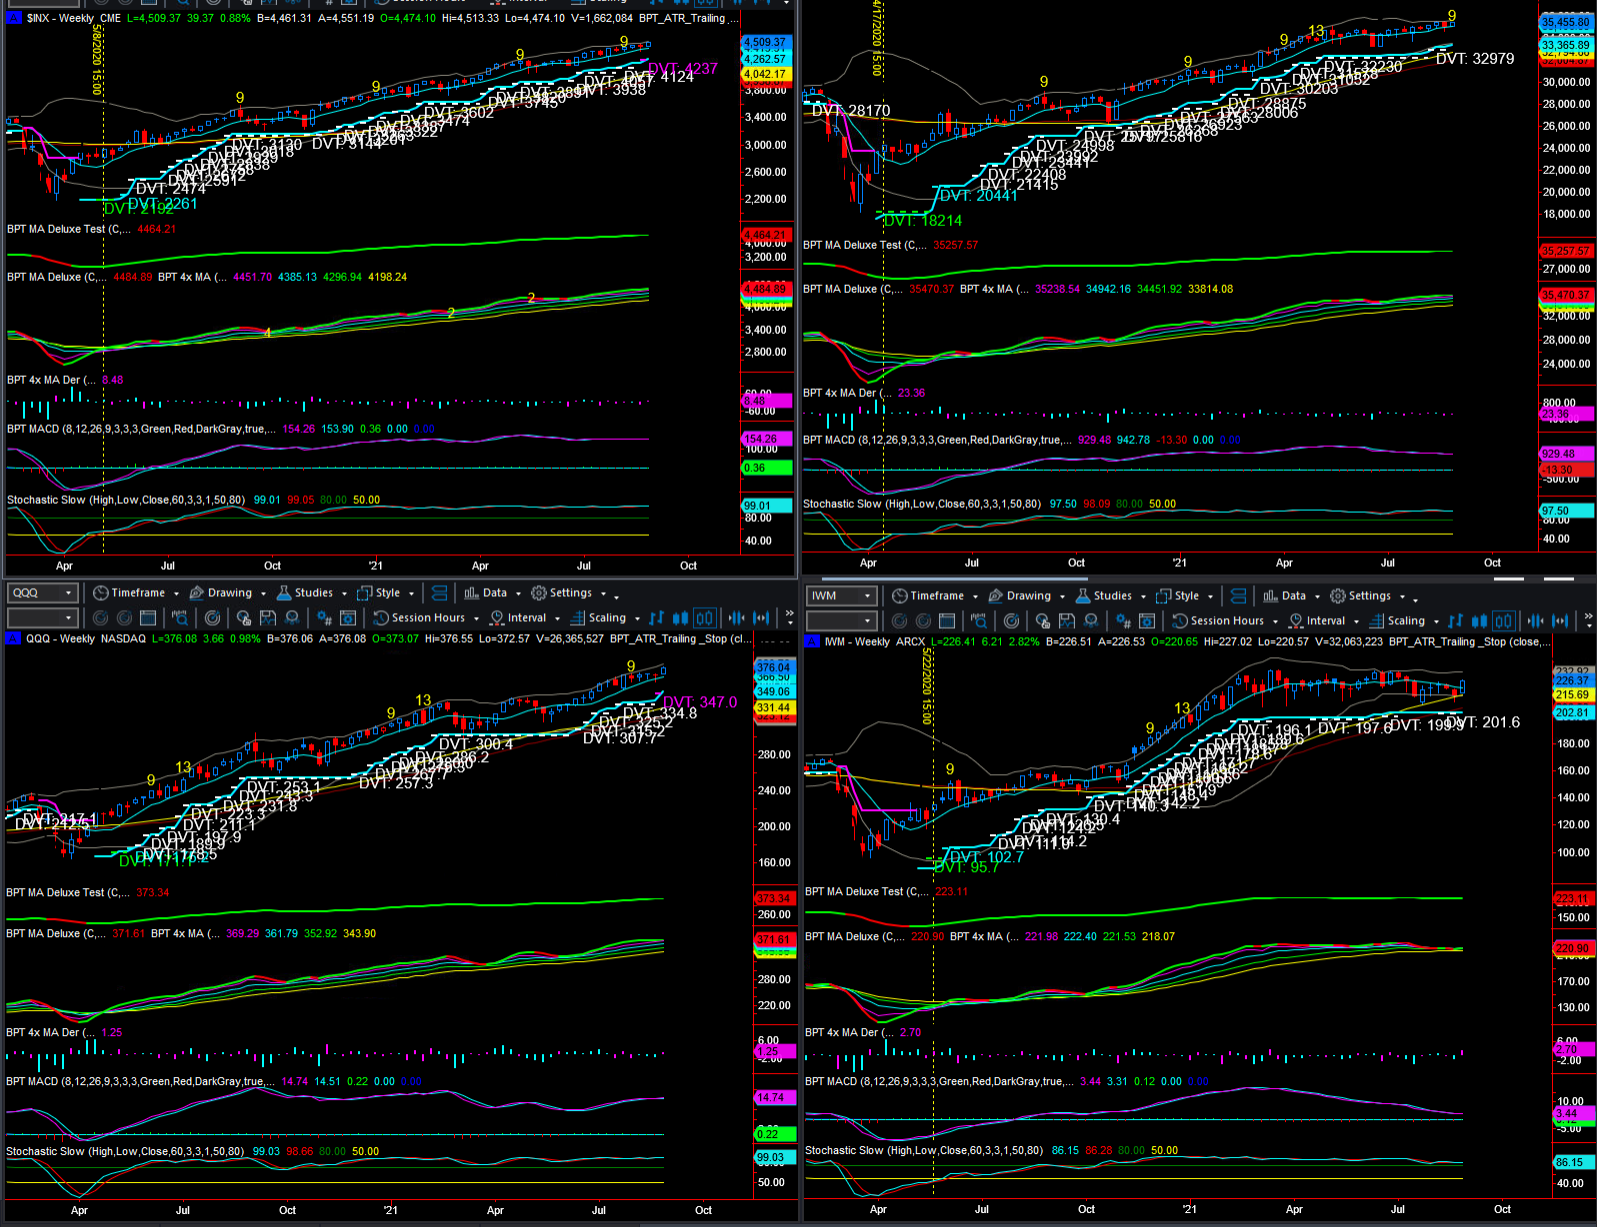
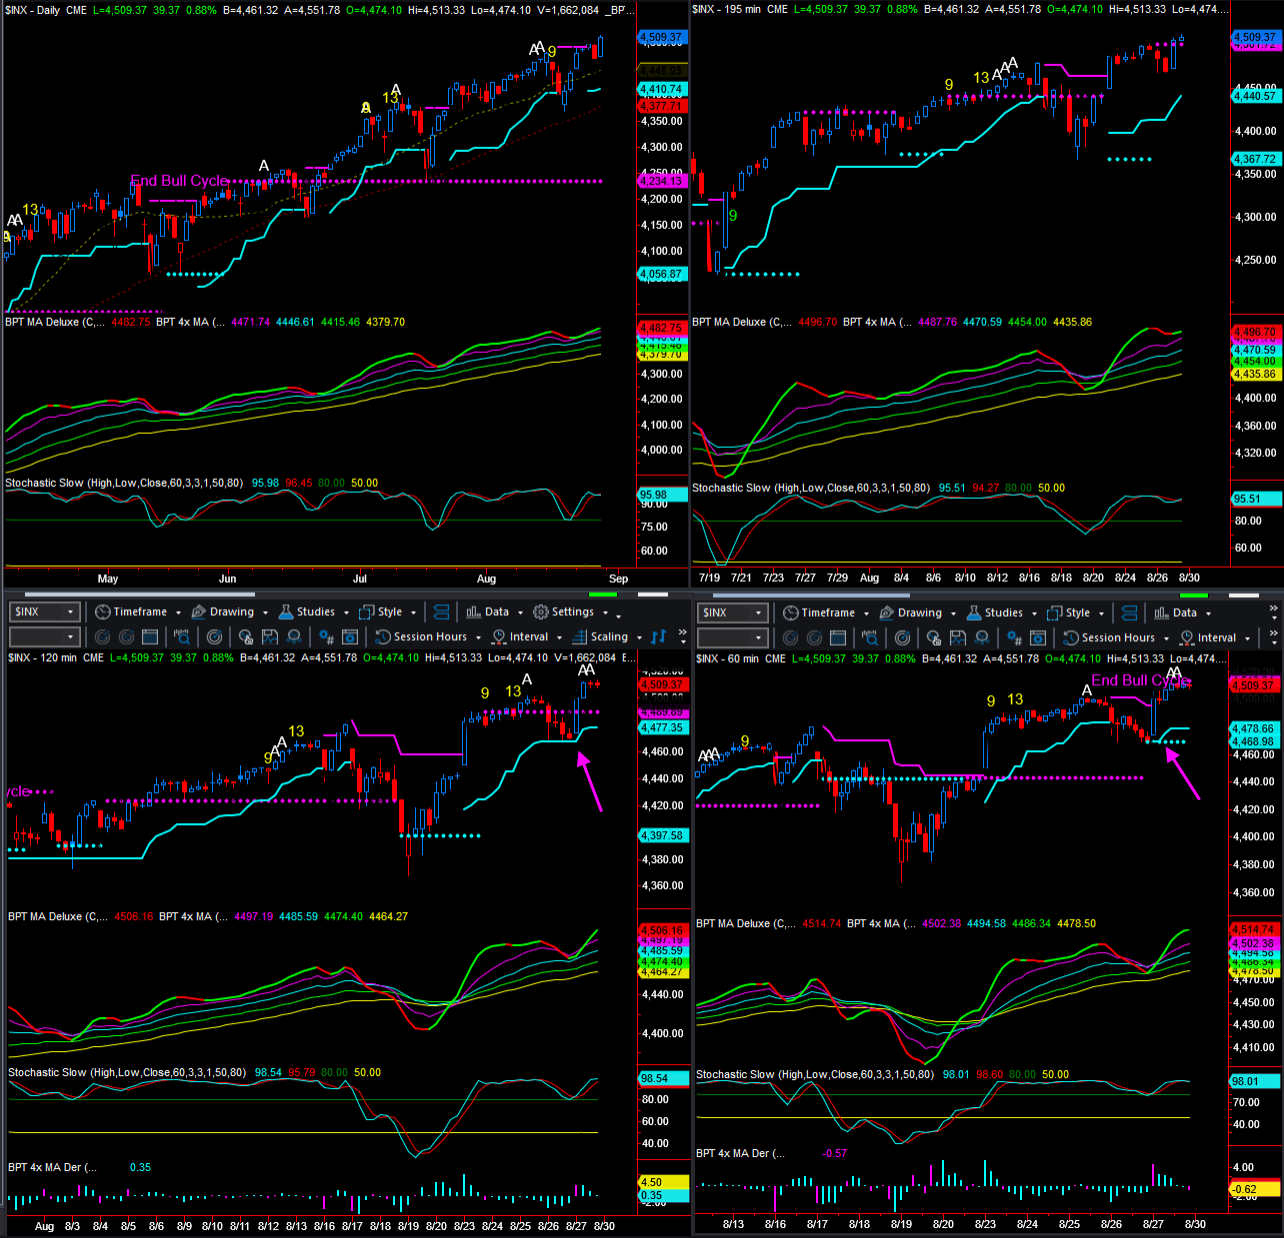
This coming week, the two indexes that I'll be most focused on are the Russell 2000 and the S&P 500. If the market is going to continue higher the index I'd probably want to be in is the Russell as it has the most catch up to do and would likely outperform the other indexes on a % basis. Regarding the S&P 500 my concern at the moment is a possible 5 wave pattern, which I'll show on the 60 min time frame, that has MACD divergence. The SPX also tagged the 4500 area, which has been a target for many market technicians for a while. The market is also in a timing window where sometimes you see a change in trend, and September tends to be historically the weaker seasonality time of the year. Should the market start selling off right from here, the wave 5 top could come into play. However, if the market remains strong, and we continue to see the Russell 2000 outperform, then that would be positive for the 'Bulls'. So, let's see how the market reacts early this week, and your job will be to react accordingly. Remember, you project and monitor, but you react to what unfolds. Another thing to consider, the S&P 500 during over the last 6 market corrections has tested and then reversed/found support near its 50-day MA. Should the market enter another correction I don't think it will be lucky # 7, I think the SPX would lose the 50-day MA this time around, so take note.
Below we'll also take a look at a few key market indicators such as the VIX, VVIX etc. By the way, the VVIX did close slightly below 110 on Friday. We'll also look at all the major 21 market sectors. We'll look at commodities, which have all had a correction but seem to be recovering and the weaker dollar is helping. Precious Metals have had some wild action as of late, however that area looks like it has put in a potential bottom and may work higher over time.
Lastly, I'll go over a slew of recent trade ideas from the last 2 weeks that have triggered, and I did add a few more setups to monitor; though I had trouble finding a ton of grade A setups, so no reason to force the issue.
Also, at the same time I'm recording this video I'm also recording my screen for a video. It's a shame that Breakpoint Trades doesn't have a large YouTube presence, therefore I will attempt to change that and thus for the foreseeable future I'll be recording a video for the market newsletters, however the standard newsletter format the you love will still be available as well.
let's look over the charts
2
| Major Indexes | Index Symbol | ETF Symbol | % G / L Day | % G / L Week | Close |
|---|---|---|---|---|---|
| Dow Jones | INDU - W | DIA - W | 0.69% | 0.96% | 35,455.80 |
| S&P 500 | SPX - W | SPY - W | 0.88% | 1.52% | 4,509.37 |
| Wilshire 5000 | WLSH - W | 1.07% | 2.11% | 46,877.90 | |
| Nasdaq | COMPQ - W | 1.23% | 2.82% | 15,129.50 | |
| NDX 100 | NDX - W | QQQ - W | 1.01% | 2.26% | 15,432.95 |
| Russel 2000 (Small Caps) | IWM - W | 2.82% | 5.05% | 226.41 |
| Market Sectors | Index Symbol | ETF Symbol | % G / L Day | % G / L Week | Close |
|---|---|---|---|---|---|
| Transports | TRAN - W | IYT - W | 1.23% | 2.41% | 14,905.00 |
| Banks | BKX - W | 1.74% | 5.22% | 131.70 | |
| Financials | XLF - W | 1.33% | 3.48% | 39.00 | |
| Brokers | XBD - W | 2.25% | 4.47% | 491.52 | |
| XLE (Energy Select) | XLE - W | 2.67% | 7.45% | 49.31 | |
| Oil Service Holders | OIH - W | 5.45% | 13.53% | 191.29 | |
| Technology | XLK - W | 0.96% | 1.45% | 158.00 | |
| Semiconductor | SOX - W | SMH - W | 1.96% | 5.53% | 3,436.45 |
| Communication Services | XLC - W | 1.58% | 2.41% | 84.72 | |
| Retail | XRT - W | 0.81% | 2.02% | 96.19 | |
| Consumer Staples | XLP - W | 0.35% | -1.35% | 71.78 | |
| Consumer Discretionary | XLY - W | 0.91% | 2.38% | 181.84 | |
| Industrials | XLI - W | 0.69% | 2.23% | 104.92 | |
| Real Estate | IYR - W | 0.97% | 0.16% | 107.17 | |
| Homebuilders | HGX - W | XHB - W | 1.62% | 3.22% | 495.21 |
| Materials | XLB - W | 1.32% | 2.59% | 85.95 | |
| Metals And Mining | XME - W | 4.50% | 7.66% | 44.82 | |
| Biotechnology | BTK - W | XBI - W | 0.84% | 2.88% | 5,939.27 |
| Healthcare | XLV - W | -0.11% | -1.09% | 134.63 | |
| Drugs | DRG - W | -0.48% | -2.52% | 787.37 | |
| Utilities | UTIL - W | XLU - W | 0.05% | -1.95% | 932.25 |
| Currencies | Index Symbol | ETF Symbol | % G / L Day | % G / L Week | Close |
|---|---|---|---|---|---|
| US Dollar | UUP - W | -0.44% | -0.92% | 24.89 | |
| Euro | XEU - W | FXE - W | 0.38% | 0.84% | 117.97 |
| Yen | XJY - W | FXY - W | 0.20% | -0.04% | 91.05 |
| Australian | XAD - W | FXA - W | 1.06% | 2.58% | 73.14 |
| British Pound | XBP - W | FXB - W | 0.48% | 1.03% | 137.65 |
| Chinese Yuan | CYB - W | 0.46% | 0.49% | 27.78 | |
| Canadian Dollar | CDW - W | FXC - W | 0.49% | 1.53% | 79.21 |
| Swiss Franc | XSF - W | FXF - W | 0.74% | 0.66% | 109.77 |
| Cryptocurrencies | Index Symbol | ETF Symbol | % G / L Day | % G / L Week | Close |
|---|---|---|---|---|---|
| Bitcoin | BTCUSD - W | 4.45% | -0.72% | 48,937.14 | |
| Bitcoin Cash | BCHUSD - W | 3.85% | -6.36% | 629.68 | |
| Etherium | ETHUSD - W | 5.54% | 0.72% | 3,264.92 | |
| Monero | XMRUSD - W | 7.77% | 2.60% | 314.41 | |
| Litecoin | LTCUSD - W | 4.34% | -5.86% | 175.11 | |
| Ripple | XRPUSD - W | 8.01% | -5.54% | 1.16 |
| Commodities | Index Symbol | ETF Symbol | % G / L Day | % G / L Week | Close |
|---|---|---|---|---|---|
| Commodities | DBC - W | 1.27% | 7.26% | 19.20 | |
| Crude Oil | WTIC - W | USO - W | 1.96% | 10.62% | 68.74 |
| Gasoline | GASO - W | 1.30% | 12.14% | 2.12 | |
| Natural Gas | NATGAS - W | UNG - W | 4.20% | 13.50% | 4.39 |
| Copper | COPPER - W | JJCB - W | 1.70% | 4.71% | 4.33 |
| Agriculture | DBA - W | 0.78% | 2.55% | 19.32 | |
| Corn | CORN - W | CORN - W | 0.54% | 3.12% | 553.75 |
| Wheat | WHEAT - W | WEAT - W | -0.91% | 0.58% | 732.50 |
| Coffee | JO - W | 2.33% | 6.37% | 52.74 | |
| Sugar | CANE - W | 1.99% | 4.08% | 9.69 |
| Precious Metals | Index Symbol | ETF Symbol | % G / L Day | % G / L Week | Close |
|---|---|---|---|---|---|
| Gold Metal | GLD - W | 1.50% | 2.09% | 170.19 | |
| Silver | SLV - W | 2.20% | 4.59% | 22.33 | |
| Platinum | PPLT - W | 3.32% | 1.56% | 94.32 | |
| Palladium | PALL - W | 1.12% | 5.97% | 225.42 | |
| GDX Gold Miners ETF | GDX - W | 3.59% | 5.71% | 32.61 |
| Bonds | Index Symbol | ETF Symbol | % G / L Day | % G / L Week | Close |
|---|---|---|---|---|---|
| High Yield Corporate Bond | HYG - W | 0.27% | 0.77% | 87.96 | |
| TLT 20 Year Bond ETF | TLT - W | 0.68% | -0.72% | 149.46 | |
| 10 Year Treasury Yield | TNX - W | -2.24% | 4.13% | 13.12 | |
| 30 Year Treasury Yield | TYX - W | -1.18% | 2.35% | 19.18 |
3
| Release | ET | For | Trading Impact | Forecast | Consensus | Prior |
|---|---|---|---|---|---|---|
| Aug 30 | ||||||
| Pending Home Sales | 10:00 | Jul | Low | 0.3% | 0.5% | -1.9% |
| Aug 31 | ||||||
| FHFA Housing Price Index | 09:00 | Jun | Low | NA | NA | 1.7% |
| S&P Case-Shiller Home Price Index | 09:00 | Jun | Low | 18.0% | 17.6% | 17.0% |
| Chicago PMI | 09:45 | Aug | Low | 68.5 | 68.0 | 73.4 |
| Consumer Confidence | 10:00 | Aug | High | 122.2 | 123.0 | 129.1 |
| Sep 01 | ||||||
| MBA Mortgage Applications Index | 07:00 | 08/28 | Low | NA | NA | 1.6% |
| ADP Employment Change | 08:15 | Aug | Medium | 700K | 660K | 330K |
| ISM Manufacturing Index | 10:00 | Aug | High | 58.0% | 58.5% | 59.5% |
| Construction Spending | 10:00 | Jul | Low | 0.2% | 0.2% | 0.1% |
| EIA Crude Oil Inventories | 10:30 | 08/28 | High | NA | NA | -2.98M |
| Sep 02 | ||||||
| Productivity-Rev. | 08:30 | Q2 | Low | 2.5% | 2.5% | 2.3% |
| Unit Labor Costs - Rev | 08:30 | Q2 | Low | 0.8% | 0.8% | 1.0% |
| Initial Claims | 08:30 | 08/28 | High | 345K | 348K | 353K |
| Continuing Claims | 08:30 | 08/21 | High | NA | NA | 2.862M |
| Trade Balance | 08:30 | Jul | Medium | -$73.7B | -$74.0B | -$75.7B |
| Factory Orders | 10:00 | Jul | Low | 0.4% | 0.4% | 1.5% |
| EIA Natural Gas Inventories | 10:30 | 08/28 | Low | NA | NA | +29 bcf |
| Sep 03 | ||||||
| Nonfarm Payrolls | 08:30 | Aug | High | 800K | 750K | 943K |
| Nonfarm Private Payrolls | 08:30 | Aug | High | 700K | 650K | 703K |
| Unemployment Rate | 08:30 | Aug | High | 5.2% | 5.2% | 5.4% |
| Avg. Hourly Earnings | 08:30 | Aug | High | 0.3% | 0.3% | 0.4% |
| Average Workweek | 08:30 | Aug | High | 34.8 | 34.8 | 34.8 |
| ISM Non-Manufacturing Index | 10:00 | Aug | High | 60.0% | 62.0% | 64.1% |
Stock Earnings Calender:
Click here for a list of Stocks that are reporting Earnings
**Generally we never hold a position into earnings since the risk/reward is too great
4

5 - View Live Chart

6 - View Live Chart

7 - View Live Chart

8 - View Live Chart

9 - View Live Chart

10 - View Live Chart

11

12 - View Live Chart

13 - View Live Chart

14 - View Live Chart

15 - View Live Chart

16 - View Live Chart

17 - View Live Chart

18 - View Live Chart

19
20
21
22
23 - View Live Chart

24 - View Live Chart

25 - View Live Chart

26
27

28
29
30 - View Live Chart

31 - View Live Chart

32 - View Live Chart

33 - View Live Chart

34 - View Live Chart

35 - View Live Chart

36 - View Live Chart

37 - View Live Chart

38 - View Live Chart

39 - View Live Chart

40 - View Live Chart

41 - View Live Chart

42 - View Live Chart

43 - View Live Chart

44 - View Live Chart

45 - View Live Chart

46 - View Live Chart

47 - View Live Chart

48 - View Live Chart

49 - View Live Chart

50 - View Live Chart

51 - View Live Chart

52 - View Live Chart

53 - View Live Chart

54 - View Live Chart

55 - View Live Chart

56 - View Live Chart

57 - View Live Chart

58 - View Live Chart

59 - View Live Chart

60 - View Live Chart

61 - View Live Chart

62 - View Live Chart

63 - View Live Chart

64 - View Live Chart

65 - View Live Chart

66 - View Live Chart

67 - View Live Chart

68 - View Live Chart

69 - View Live Chart

70 - View Live Chart

71 - View Live Chart

72 - View Live Chart

73 - View Live Chart

74 - View Live Chart

75 - View Live Chart

76 - View Live Chart

77 - View Live Chart

78 - View Live Chart

79 - View Live Chart

80 - View Live Chart

81 - View Live Chart

82 - View Live Chart

83 - View Live Chart

84 - View Live Chart

85 - View Live Chart

86 - View Live Chart

87 - View Live Chart

88 - View Live Chart

89 - View Live Chart

90 - View Live Chart

91 - View Live Chart

92 - View Live Chart

93 - View Live Chart

94 - View Live Chart

95 - View Live Chart

96 - View Live Chart

97 - View Live Chart

98 - View Live Chart

99 - View Live Chart

100 - View Live Chart

101 - View Live Chart

102 - View Live Chart

103 - View Live Chart

104 - View Live Chart

105 - View Live Chart

106 - View Live Chart

107 - View Live Chart

108 - View Live Chart

109 - View Live Chart

110 - View Live Chart

111 - View Live Chart

112 - View Live Chart

113 - View Live Chart

114 - View Live Chart

115 - View Live Chart

116 - View Live Chart

117 - View Live Chart

118 - View Live Chart

119 - View Live Chart

120 - View Live Chart

121 - View Live Chart

122 - View Live Chart

123 - View Live Chart

124 - View Live Chart

125 - View Live Chart

126 - View Live Chart

127 - View Live Chart

128 - View Live Chart

129 - View Live Chart

130 - View Live Chart

131 - View Live Chart

132 - View Live Chart

133 - View Live Chart

134 - View Live Chart

135 - View Live Chart

136 - View Live Chart

137 - View Live Chart

138 - View Live Chart

139 - View Live Chart

140 - View Live Chart

141 - View Live Chart

142 - View Live Chart

- Hide Player Link to Newsletter Audio
- Hide Player Link to Newsletter Audio
- Hide Player Link to Newsletter Audio