BPT Weekend Newsletter for Sunday July 19th, 2021 - free
Disclaimer: Intraday Chart Links will show up as daily charts unless you have an active stockcharts.com membership and are signed in, you can sign up here.
1
Table of Contents:
First off I hope everyone had a nice weekend! Steve is still out of town but will be back on July 21st but probably not back in the fold until the following day. Also this is an audio newsletter therefore I will cover my thoughts in the audio portion vs writing out my thoughts here so please listen.
1. Discussion of open SPY System trade and other up coming Systems
2. Glance at last Week Stats, Upcoming Economic Table, Earnings Release Dates
3. Review of the Major Indexes/Indicators and KISS Systems
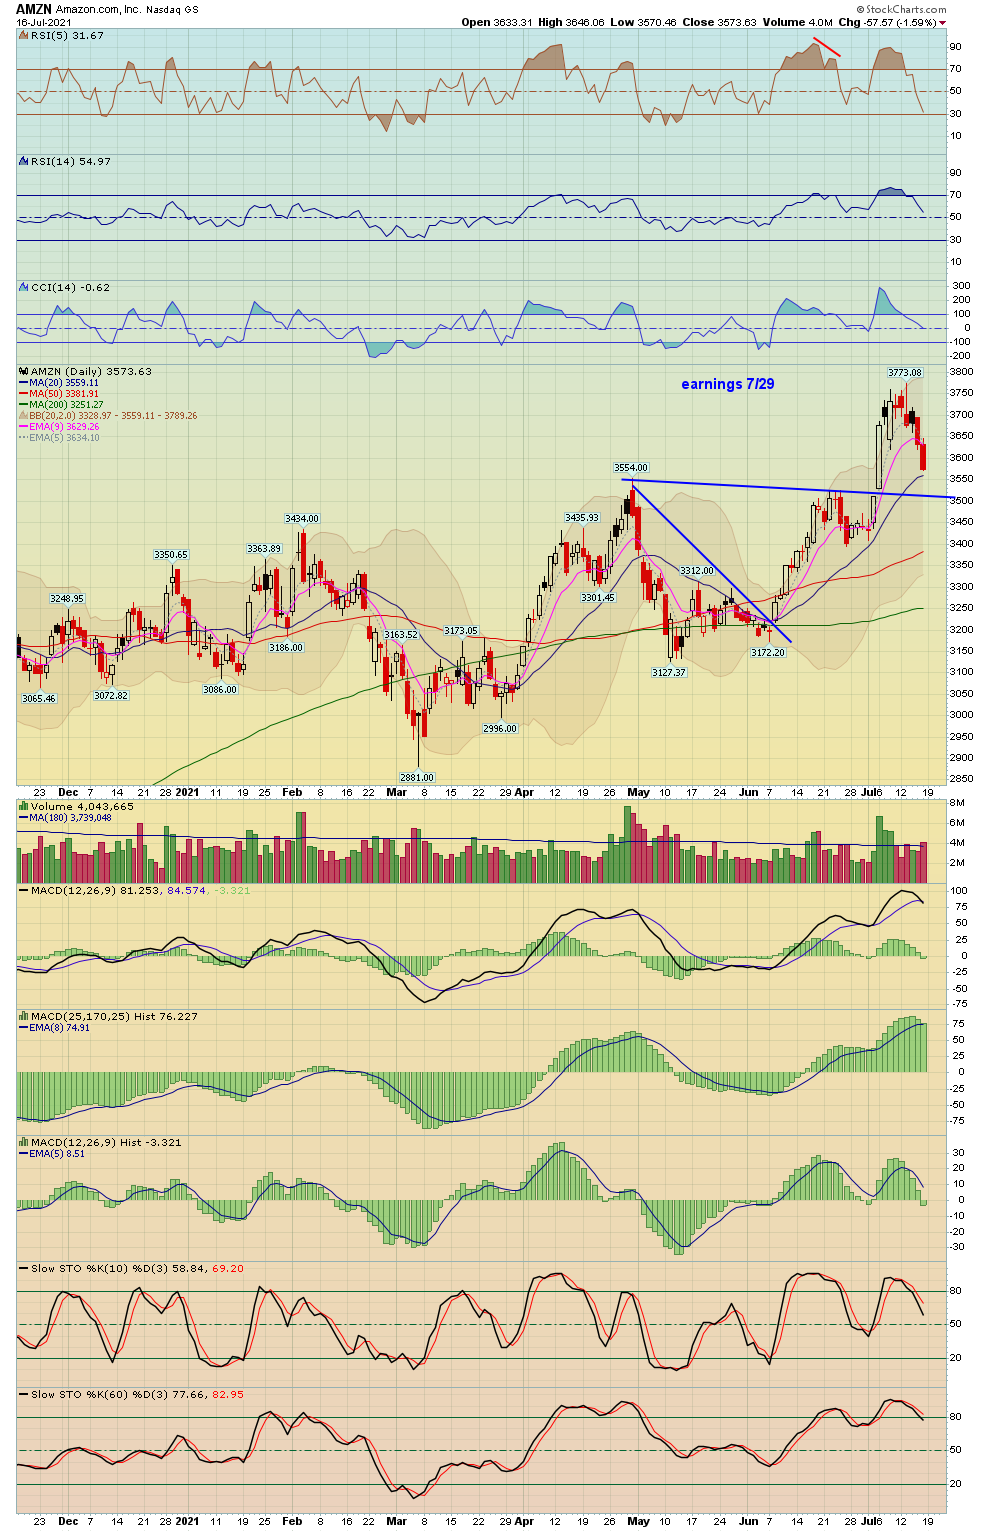
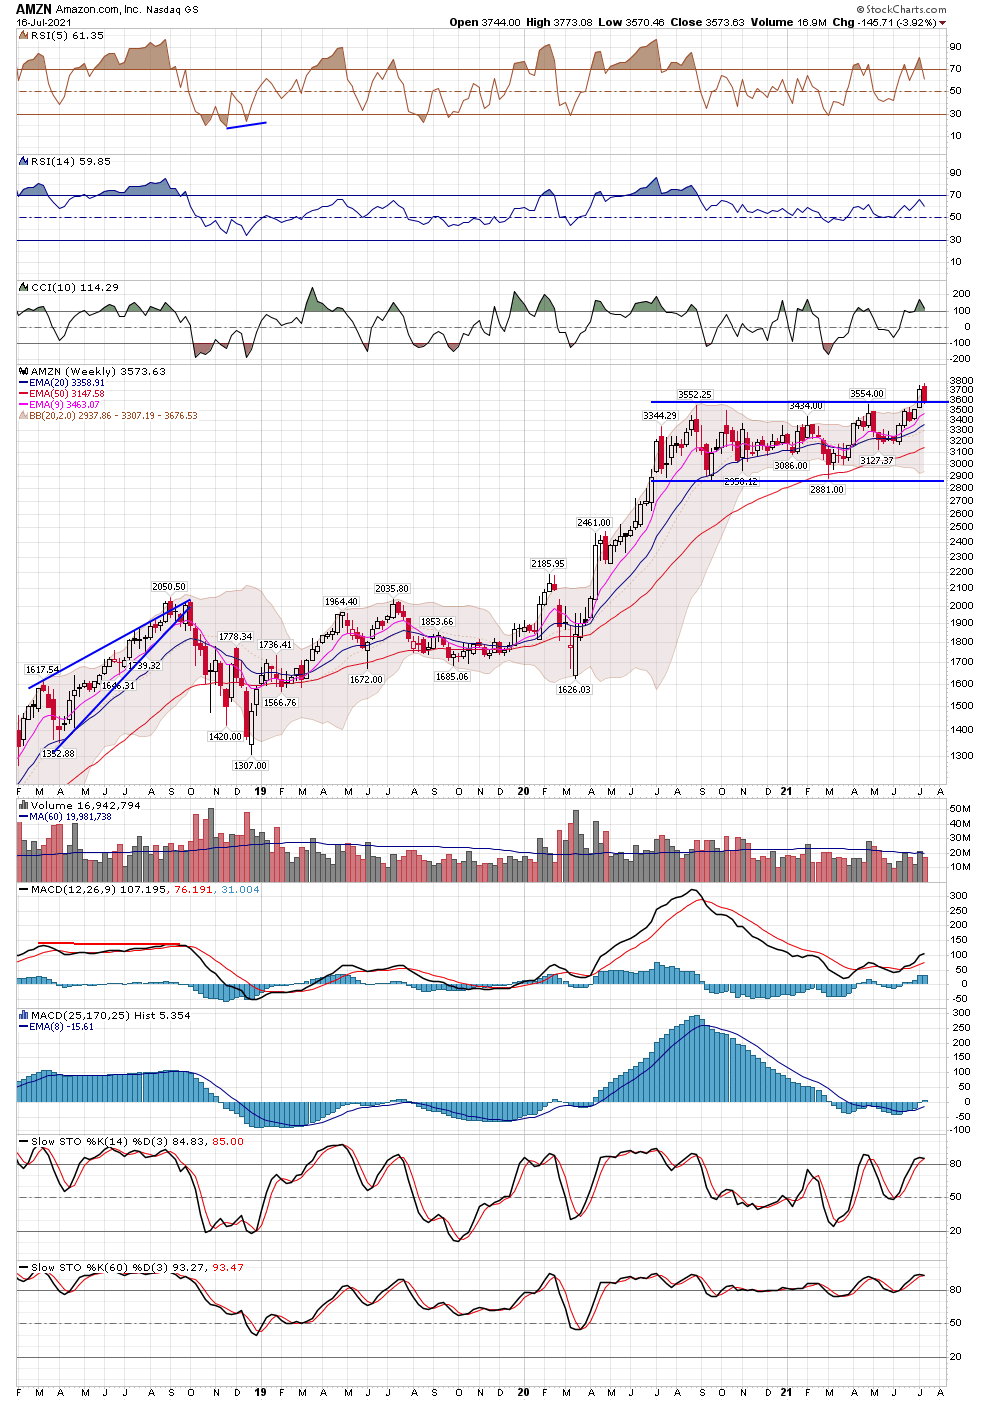
4. Upcoming Earnings a look at various stocks
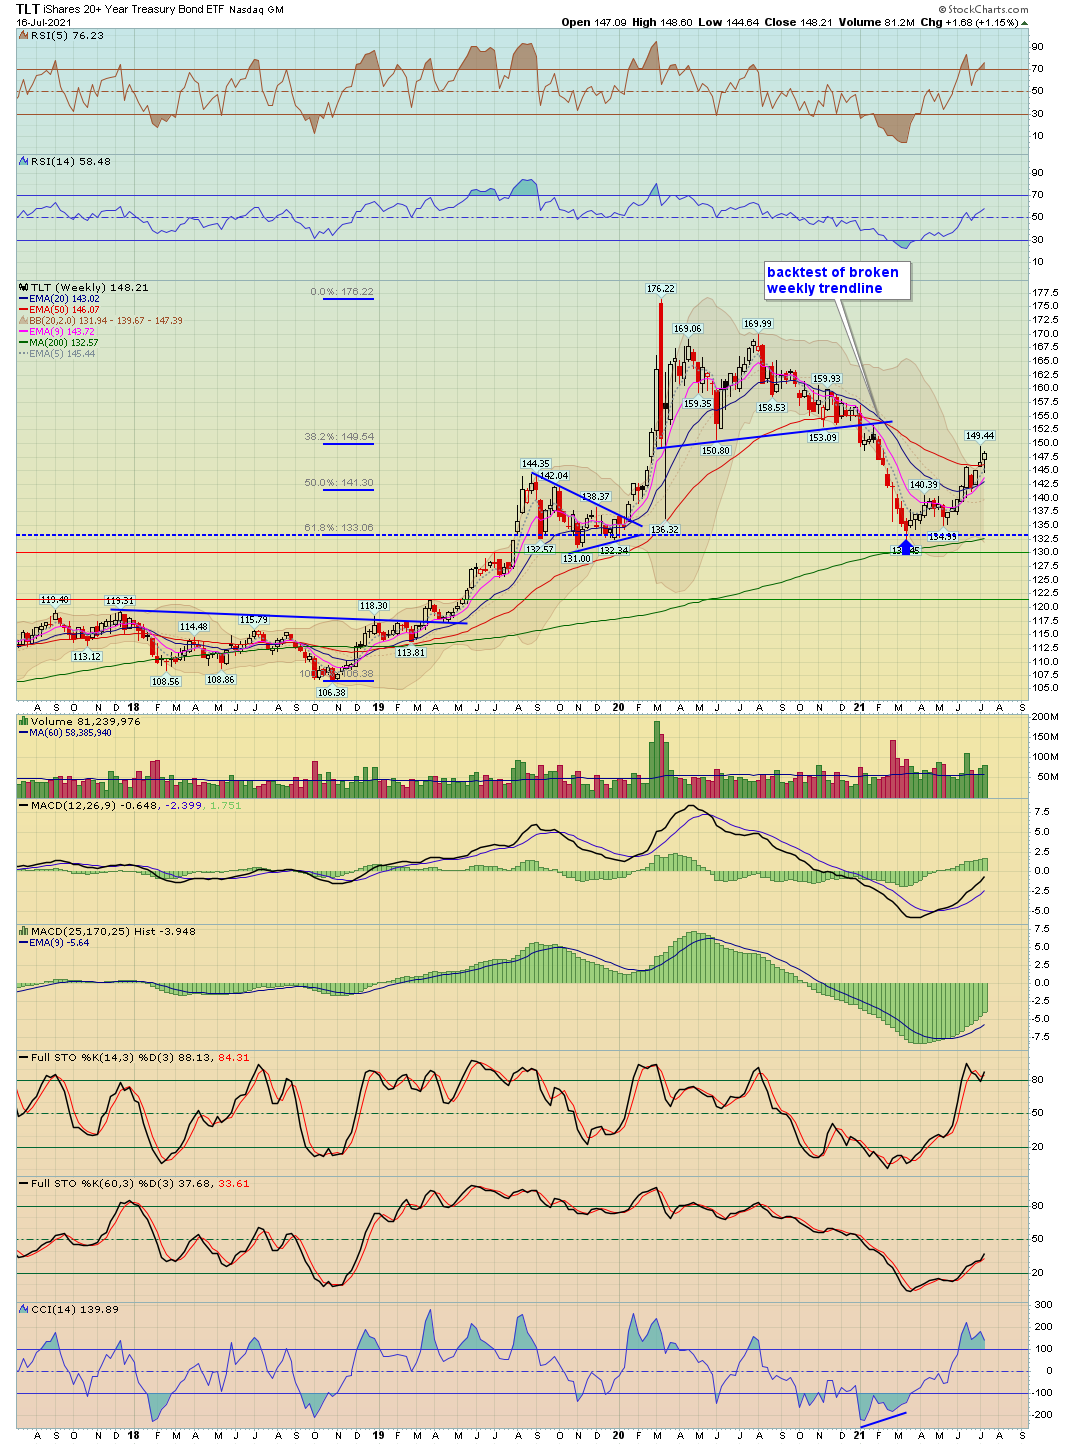
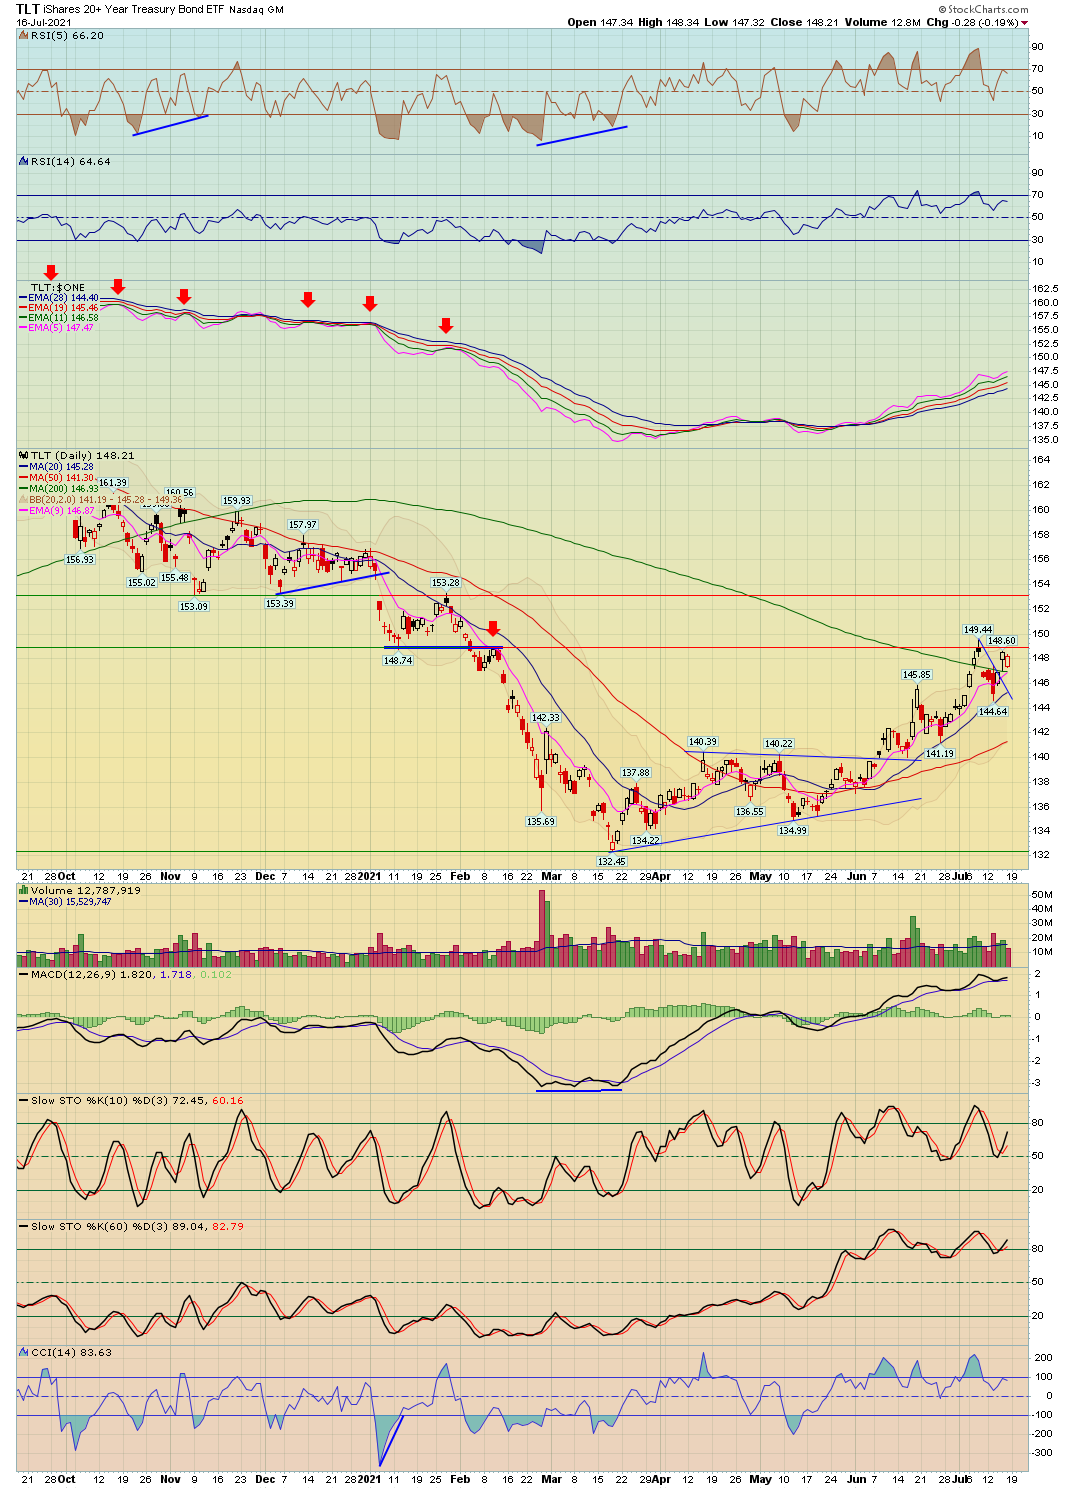
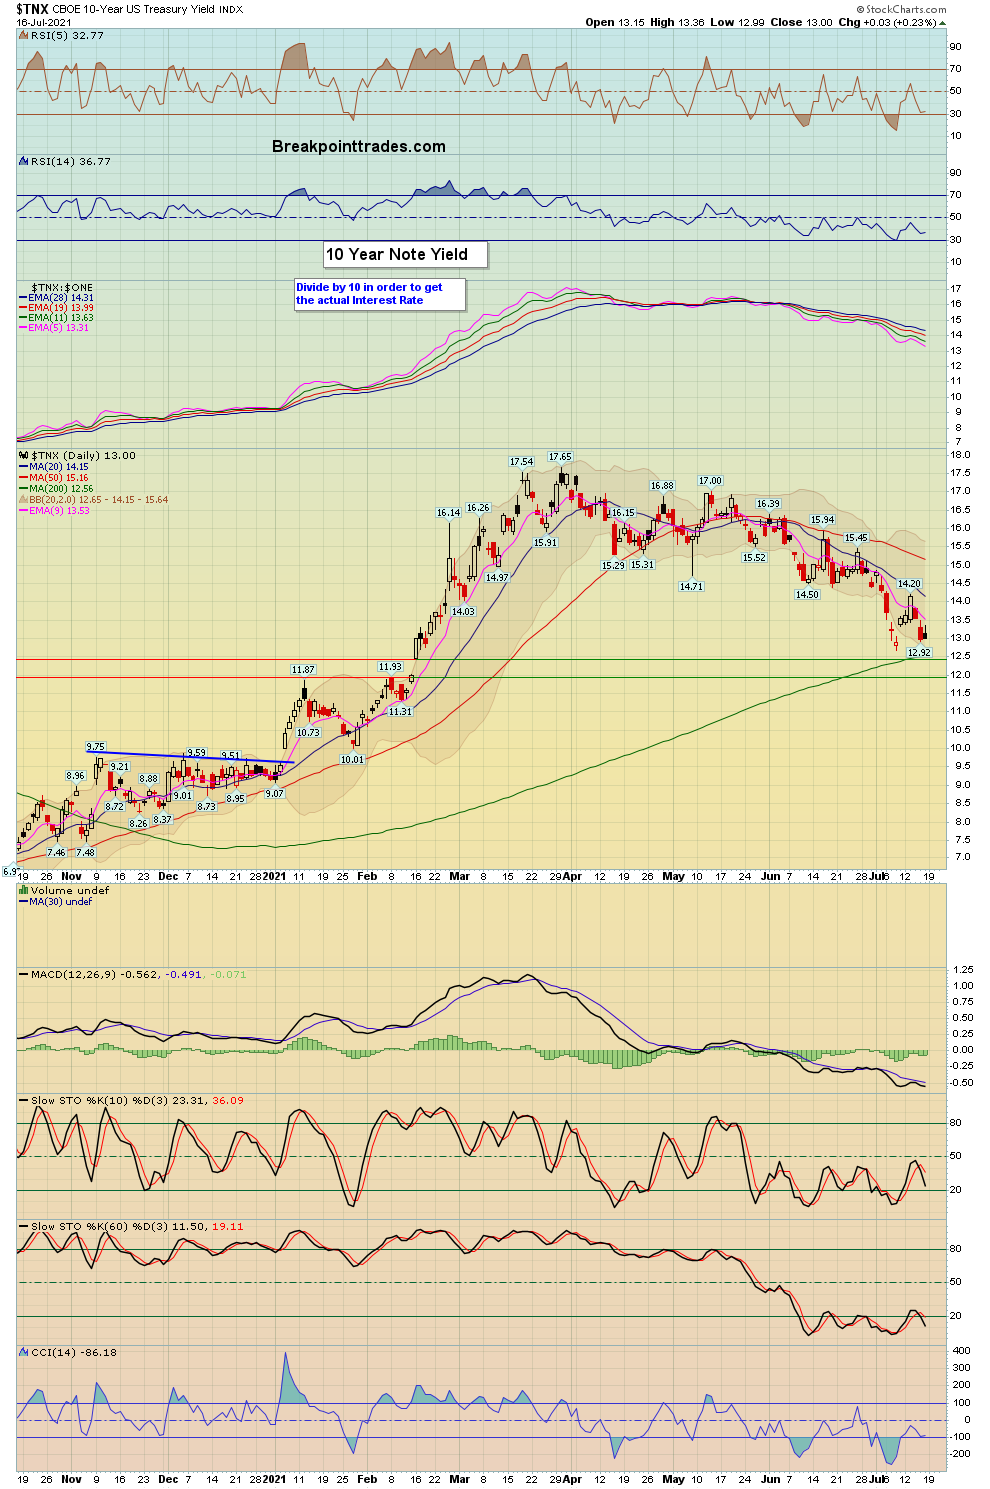
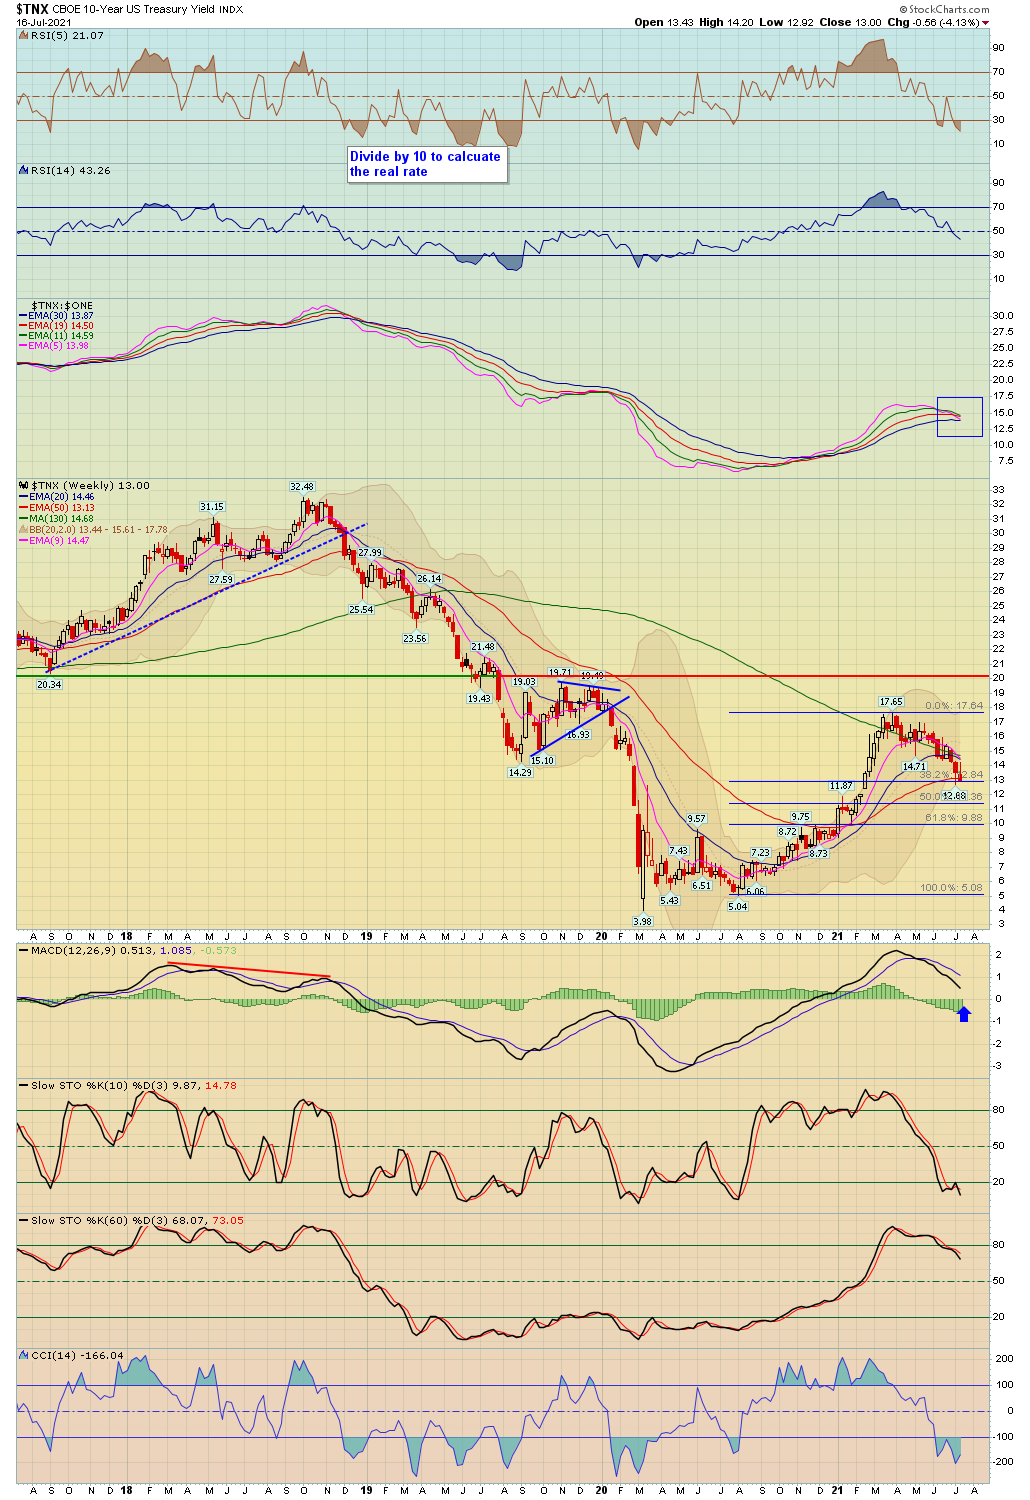
5. Overview of Bonds via TLT/JNK and 10 Year Yield
6. Examine All Sector Charts
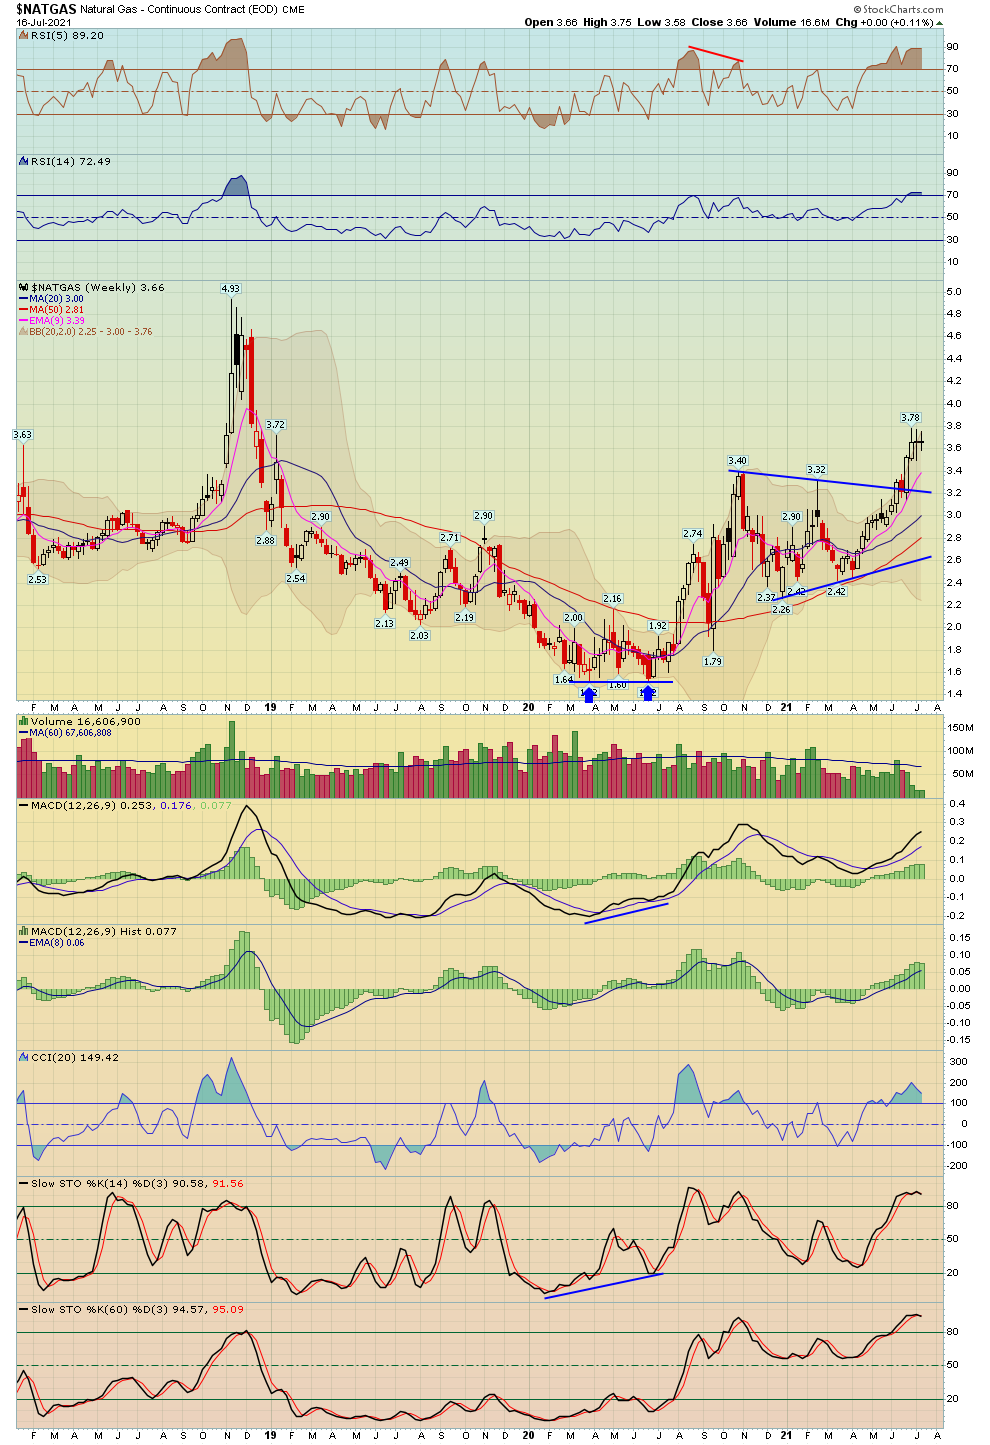
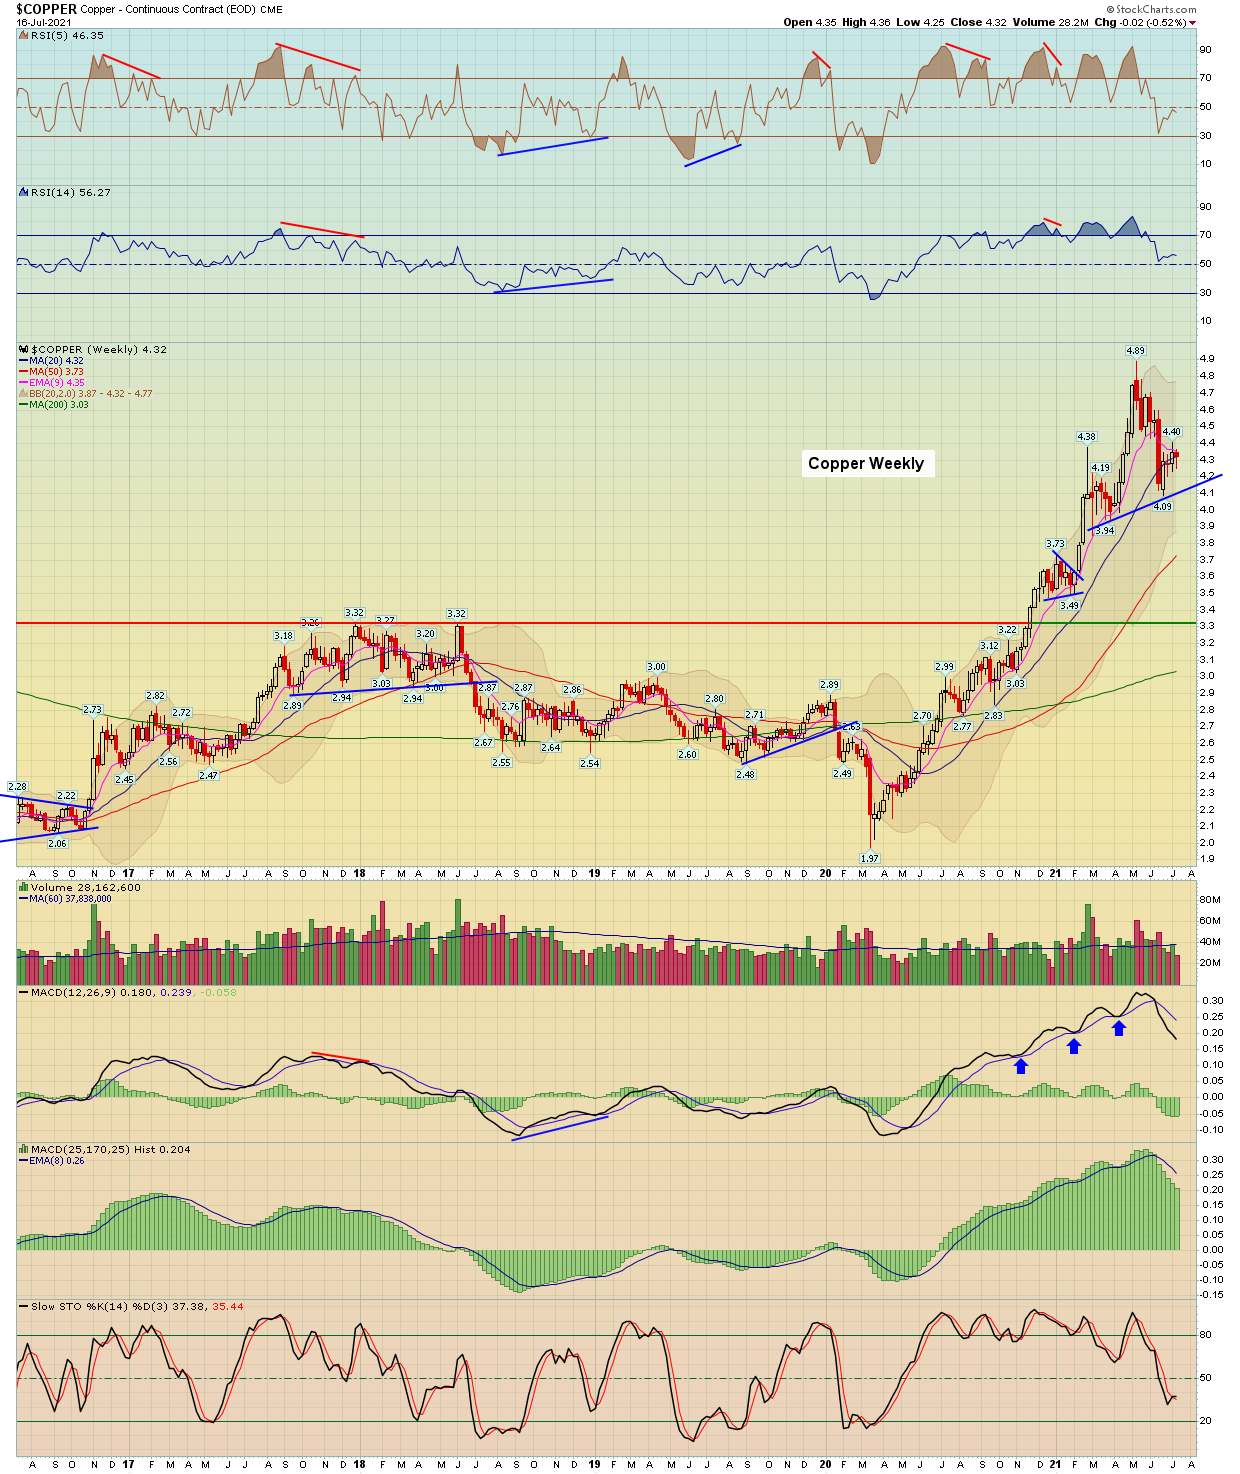
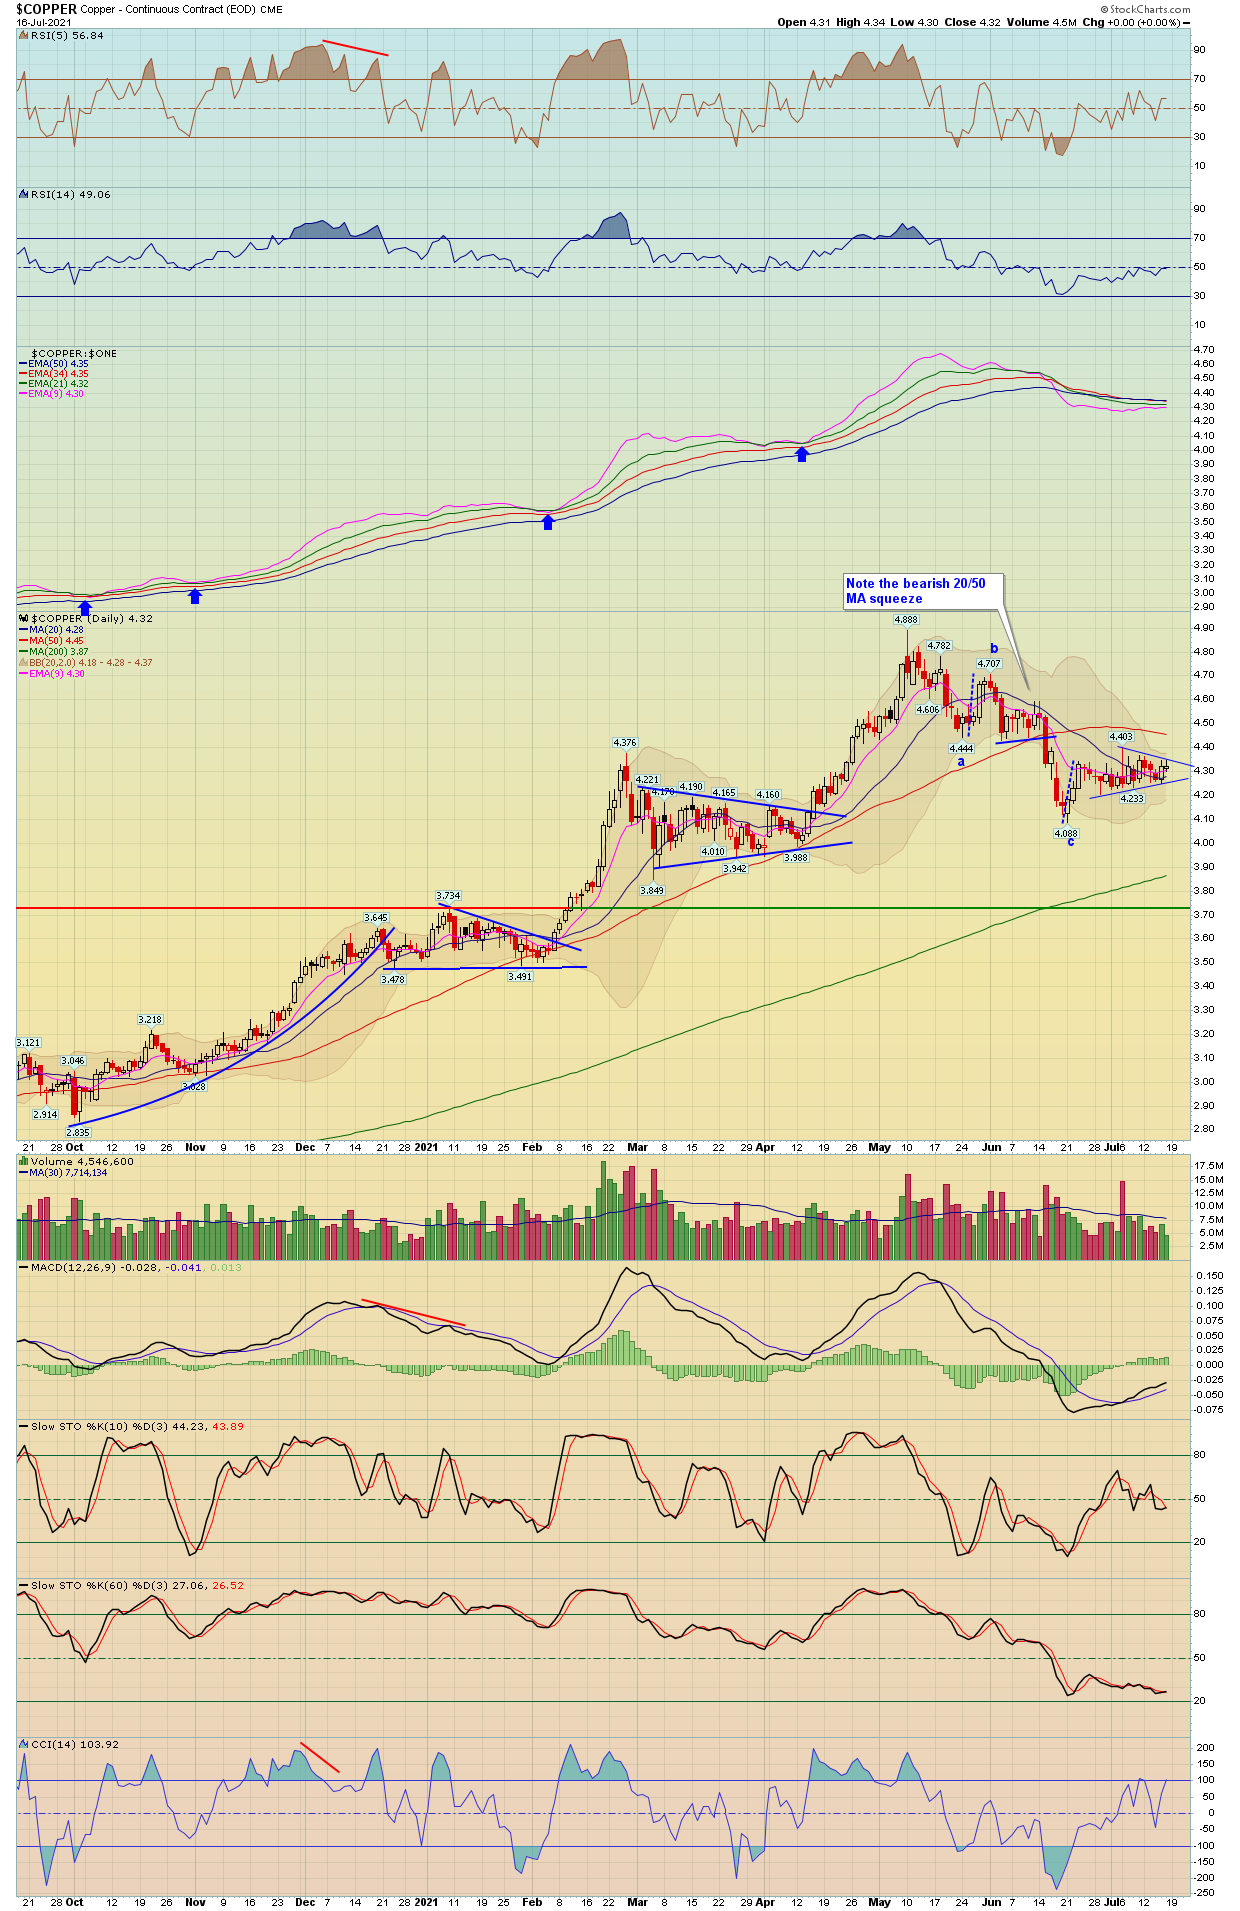
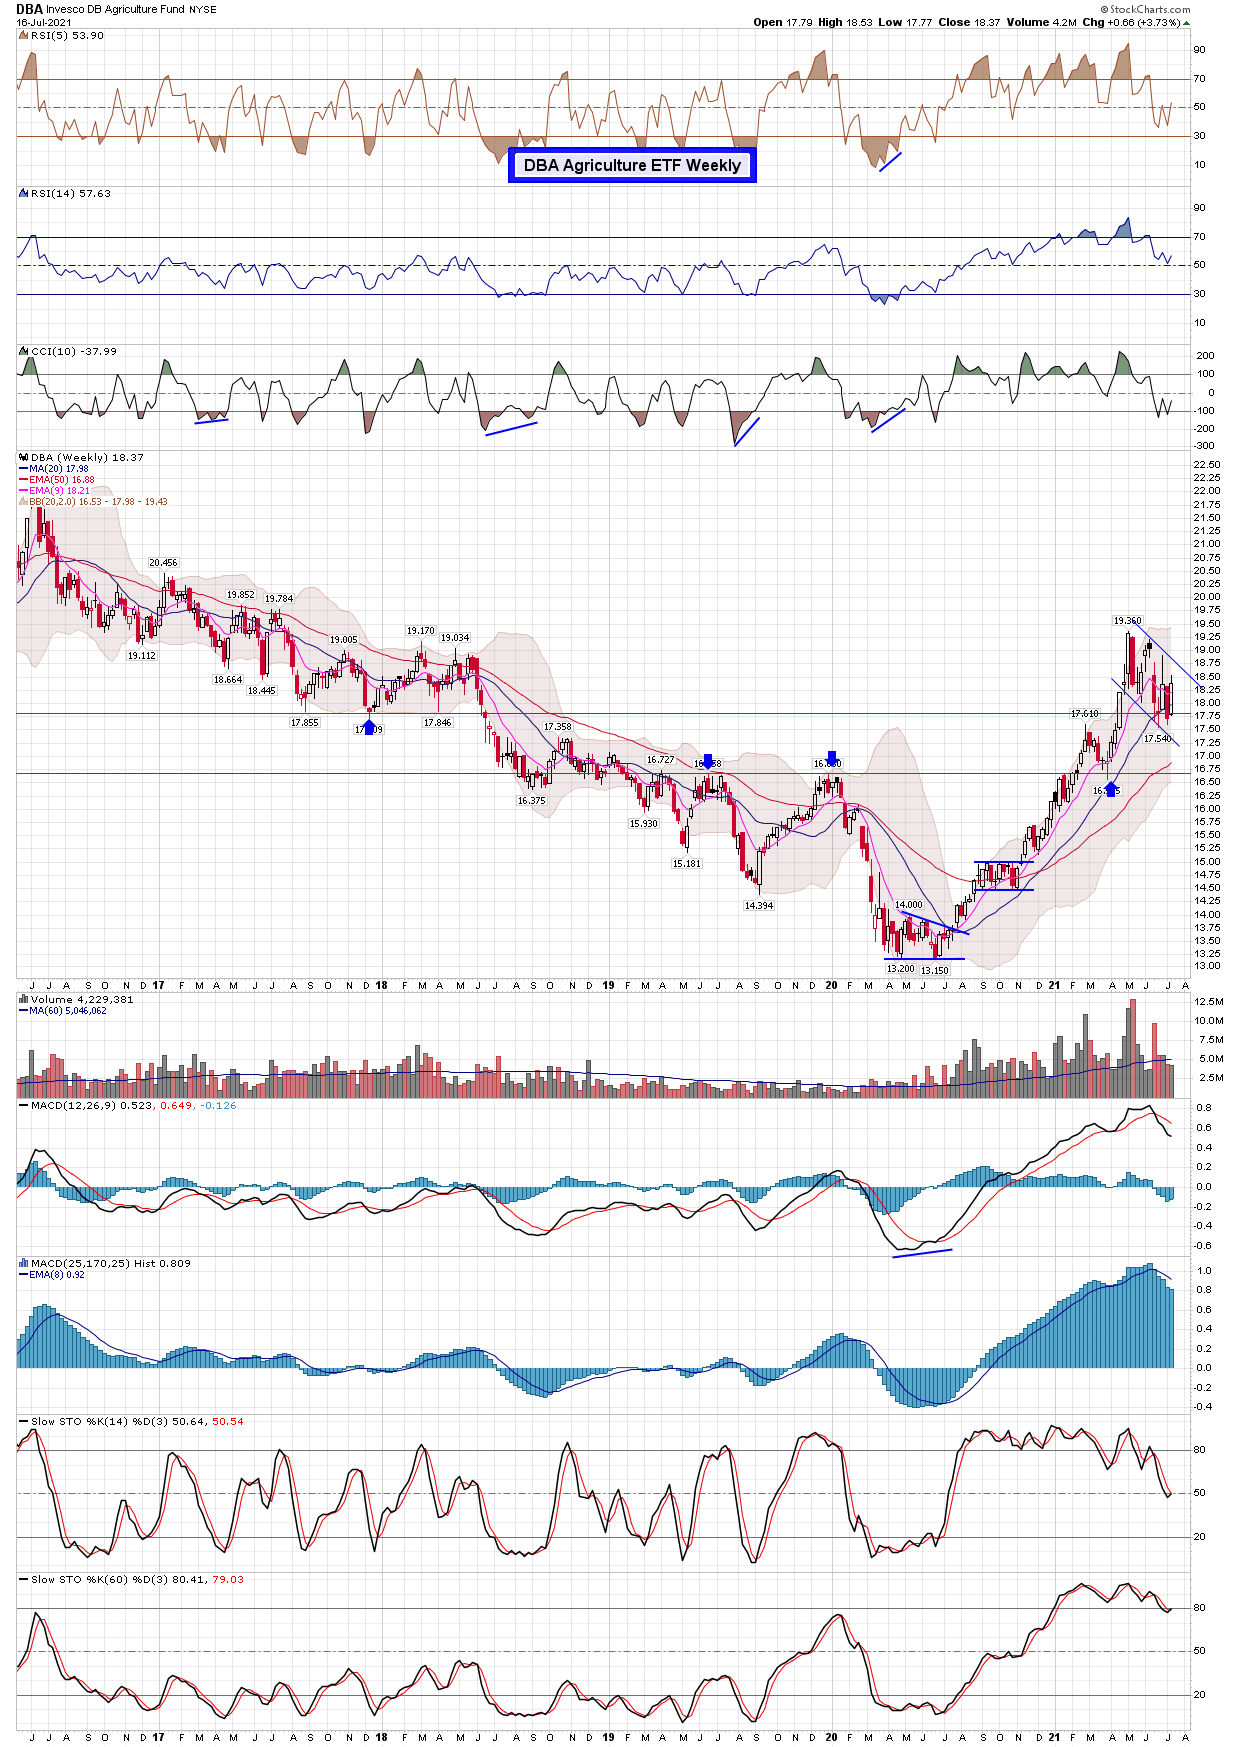
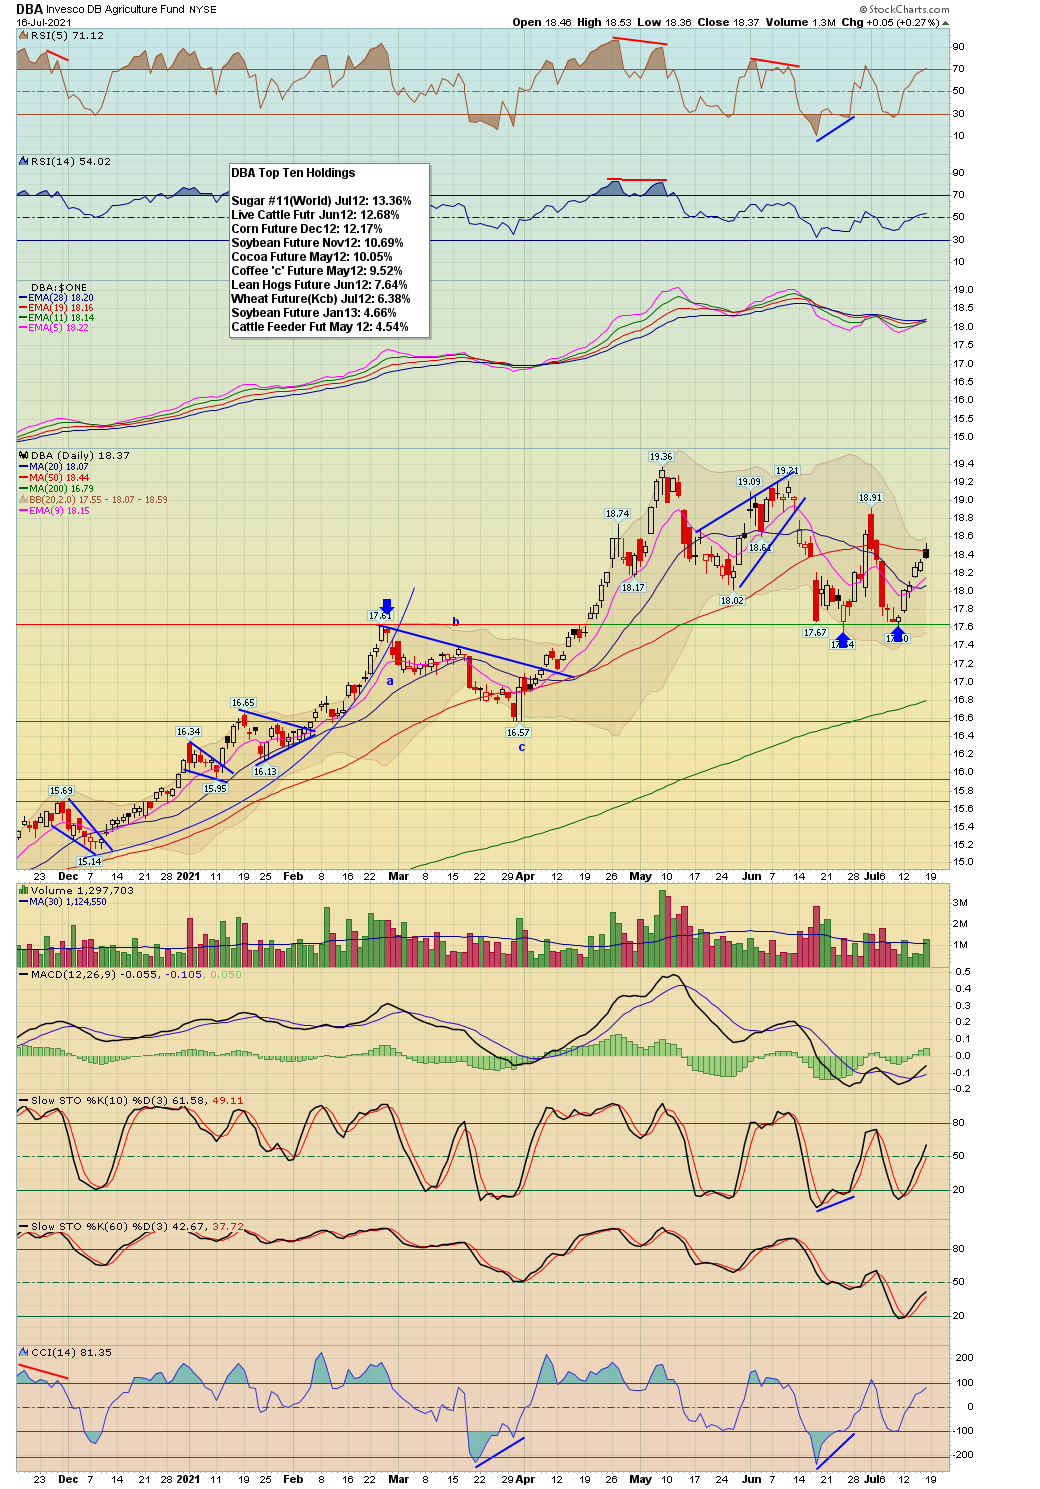
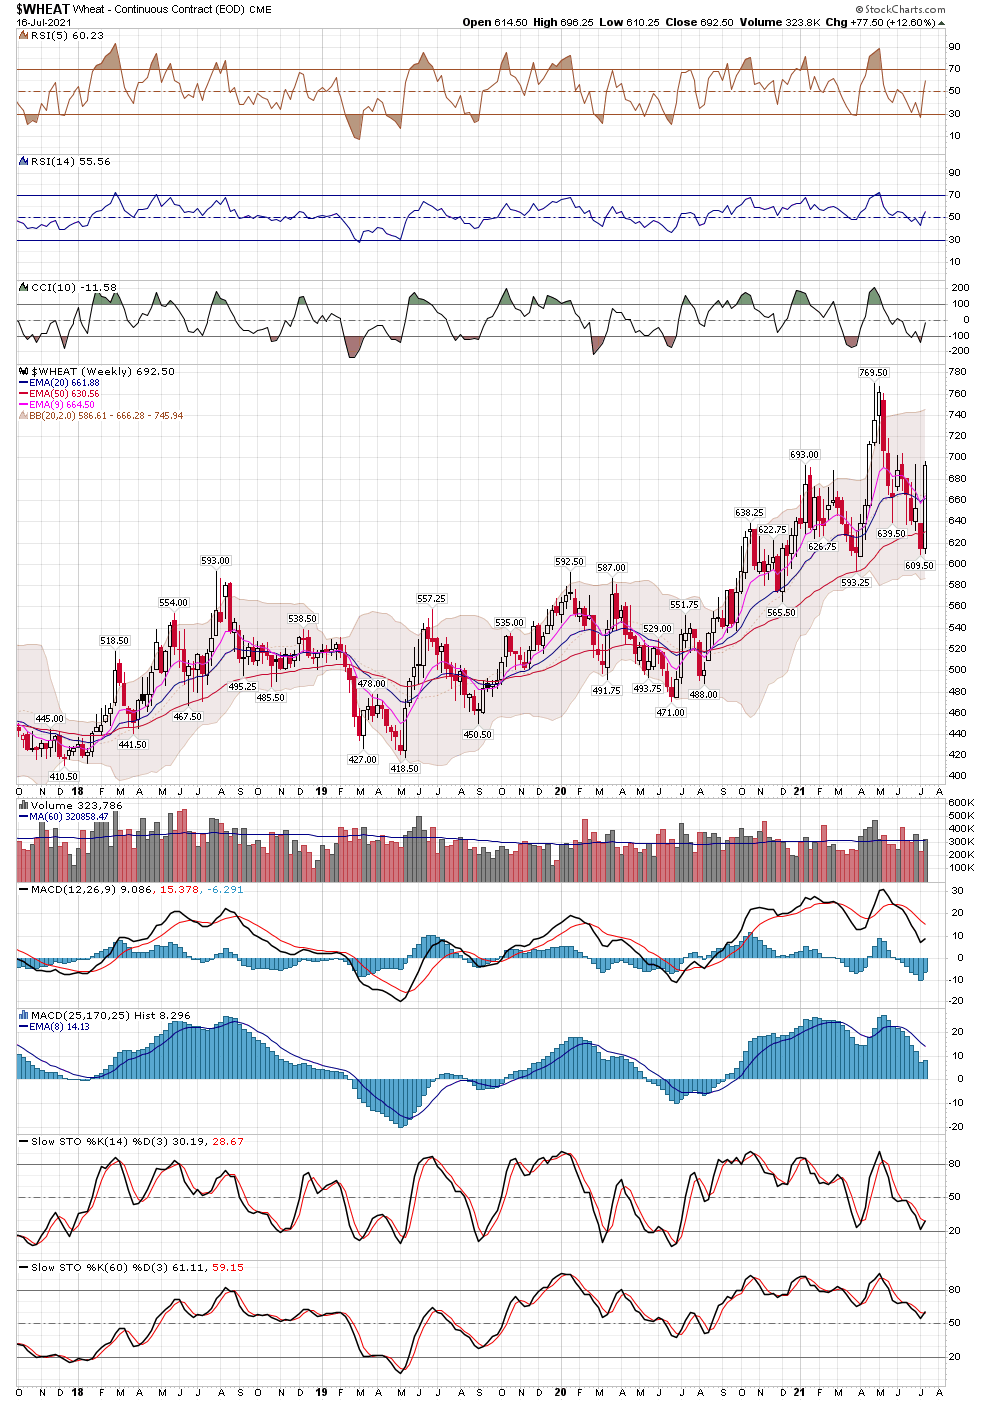
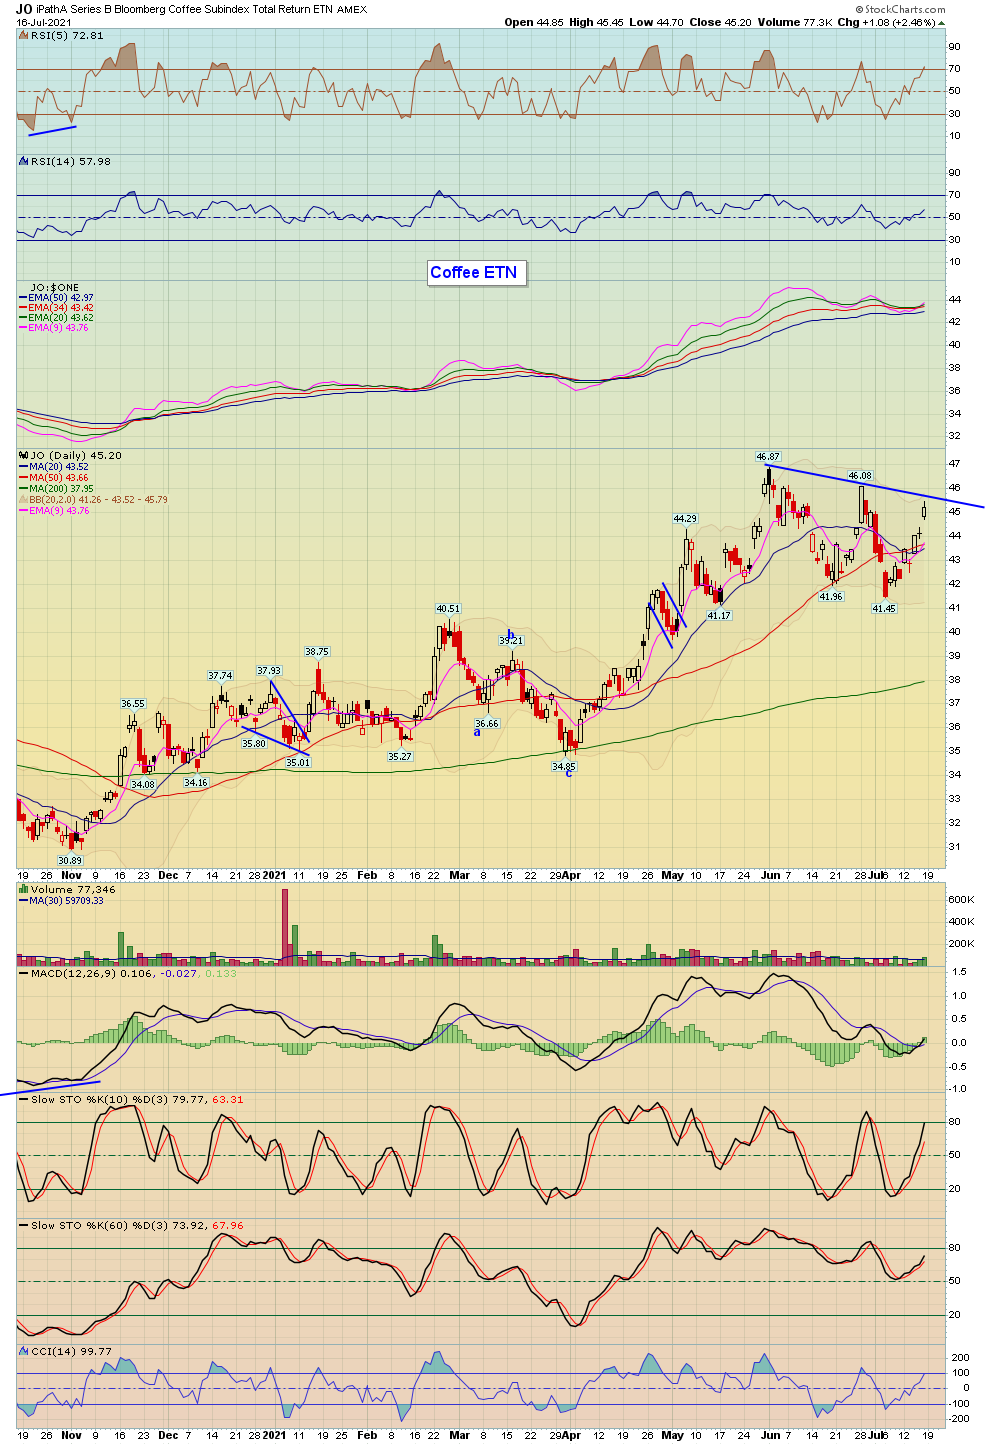
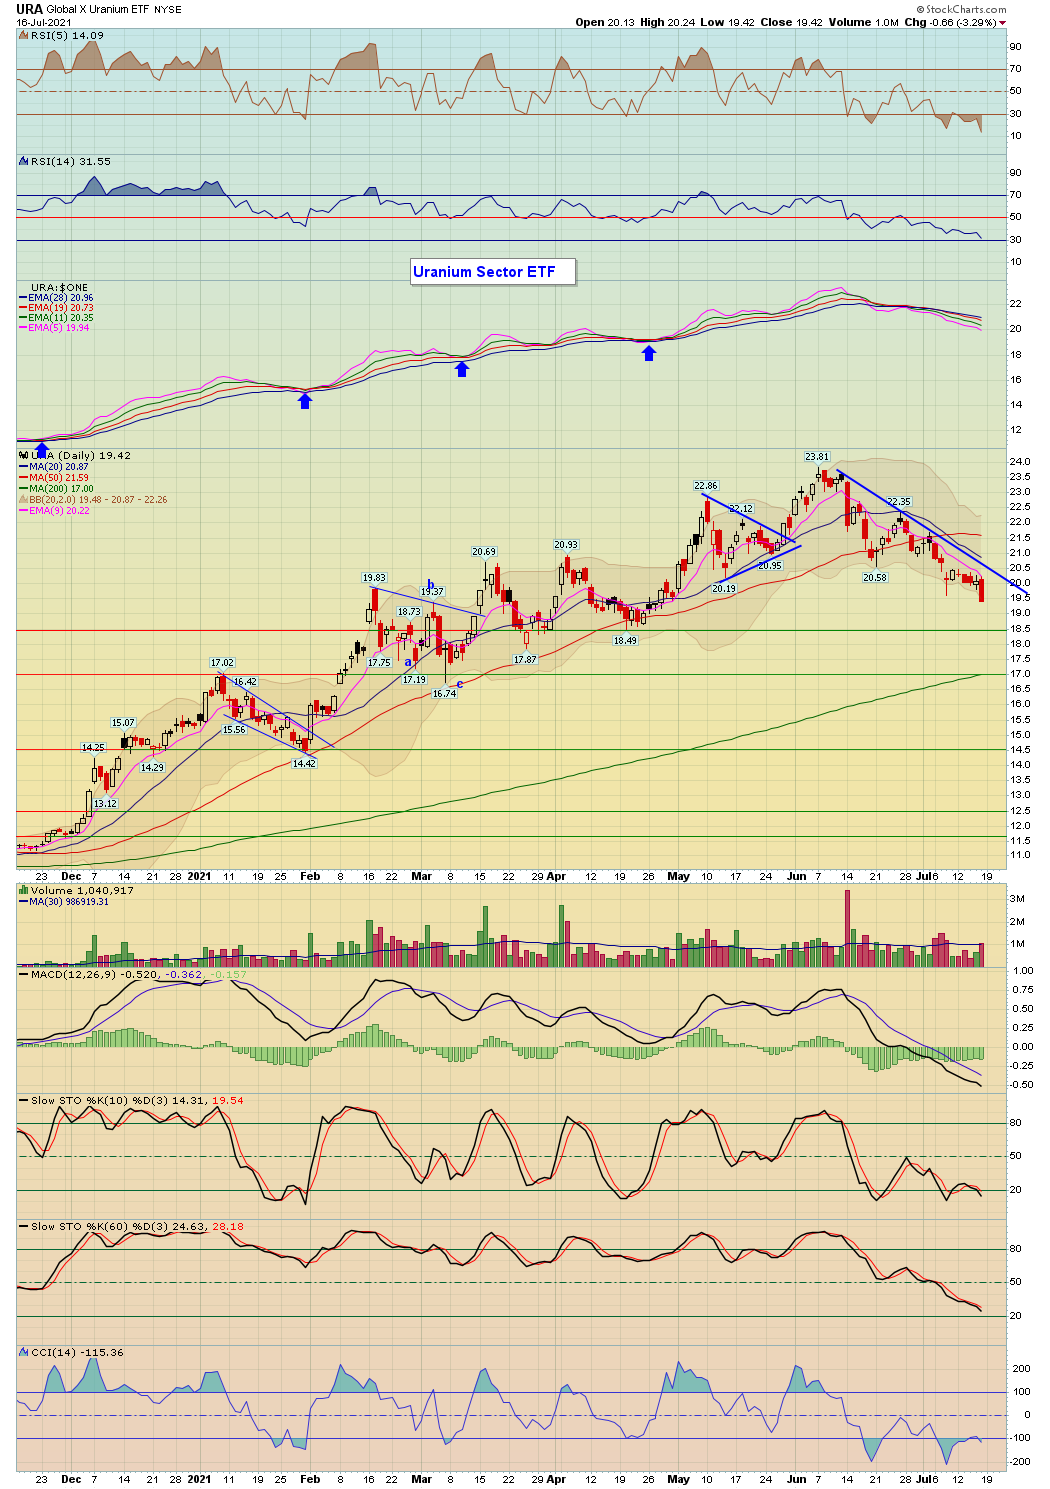
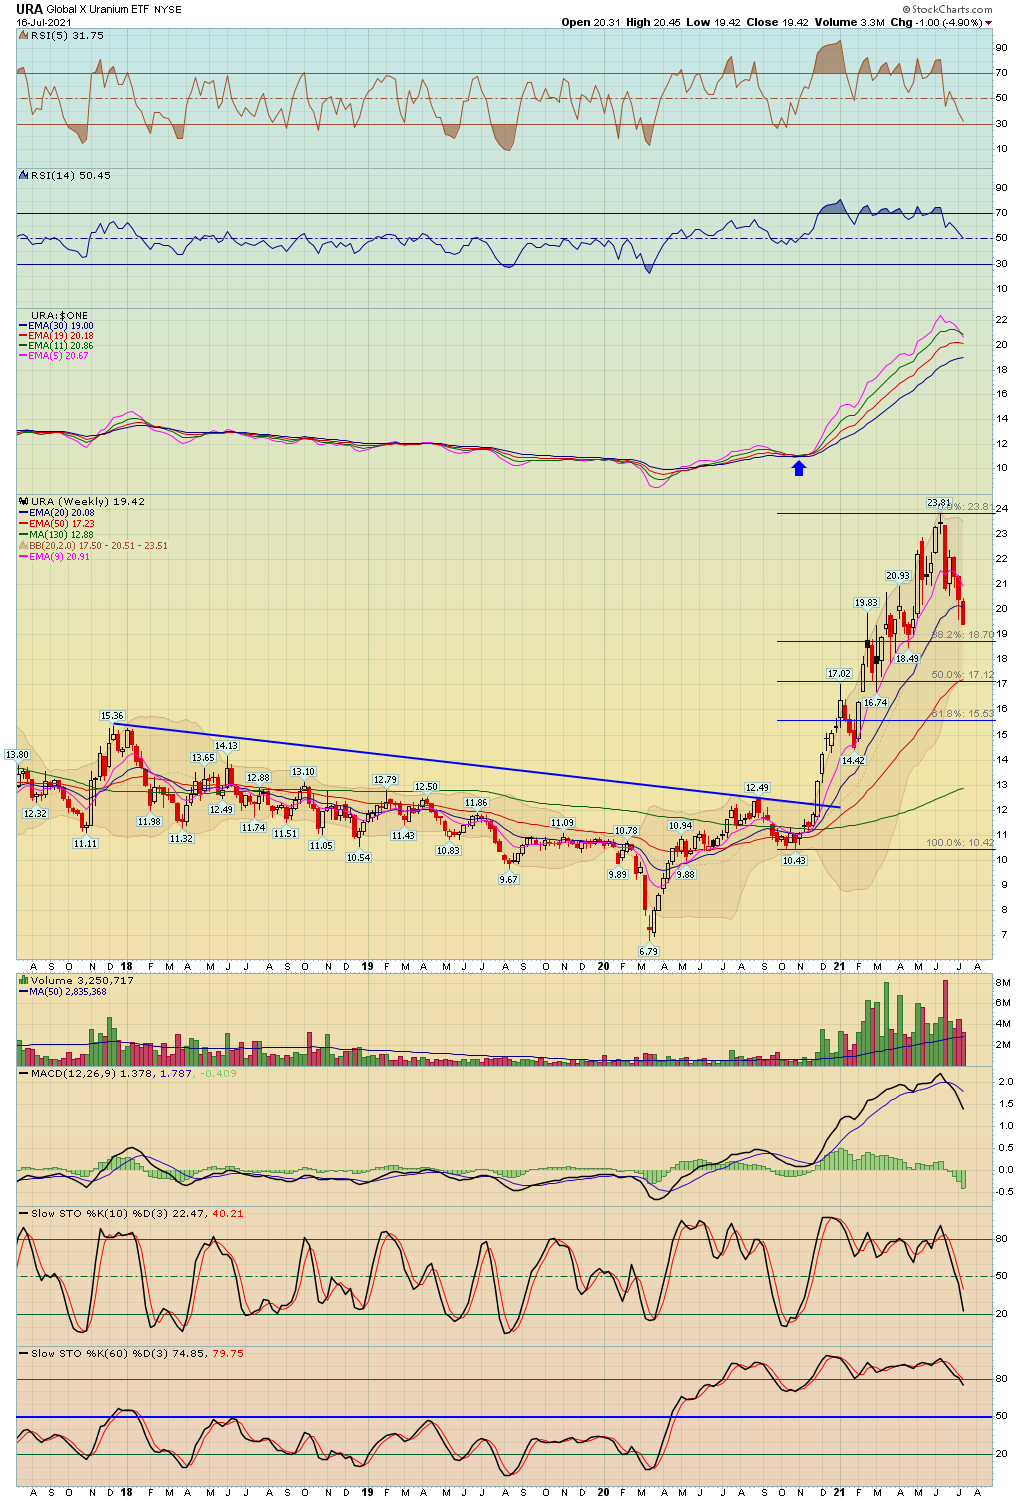
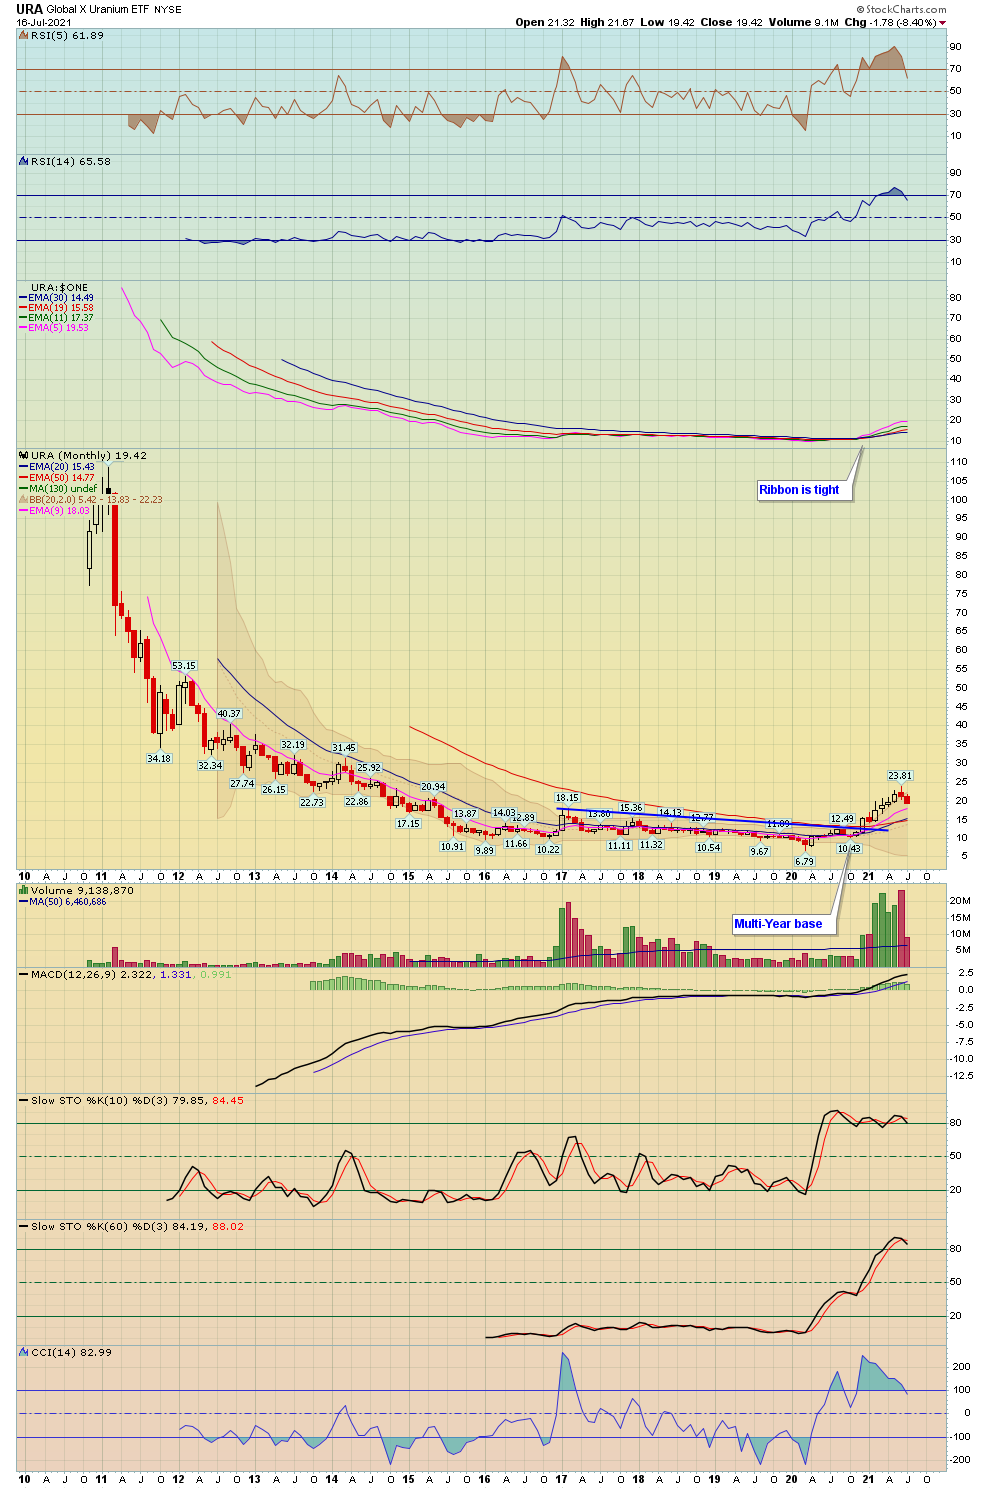
7. Commodities (Crude Oil, Natural Gas, Copper, DBA, Corn, Wheat, Coffee, Uranium)
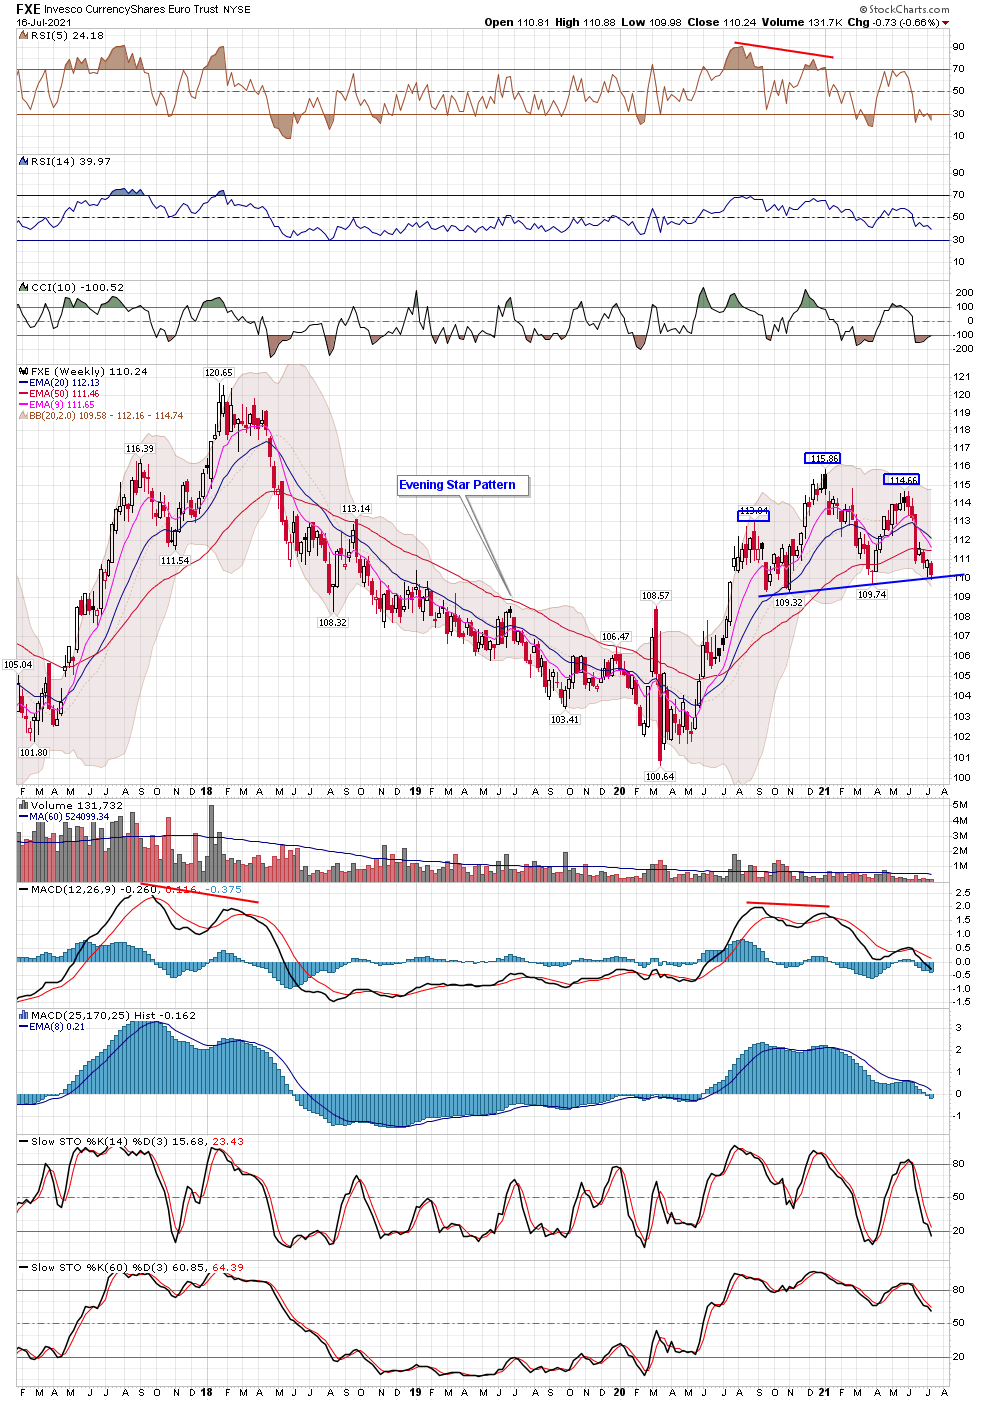
8. Currencies (US Dollar, Euro) and Bitcoin
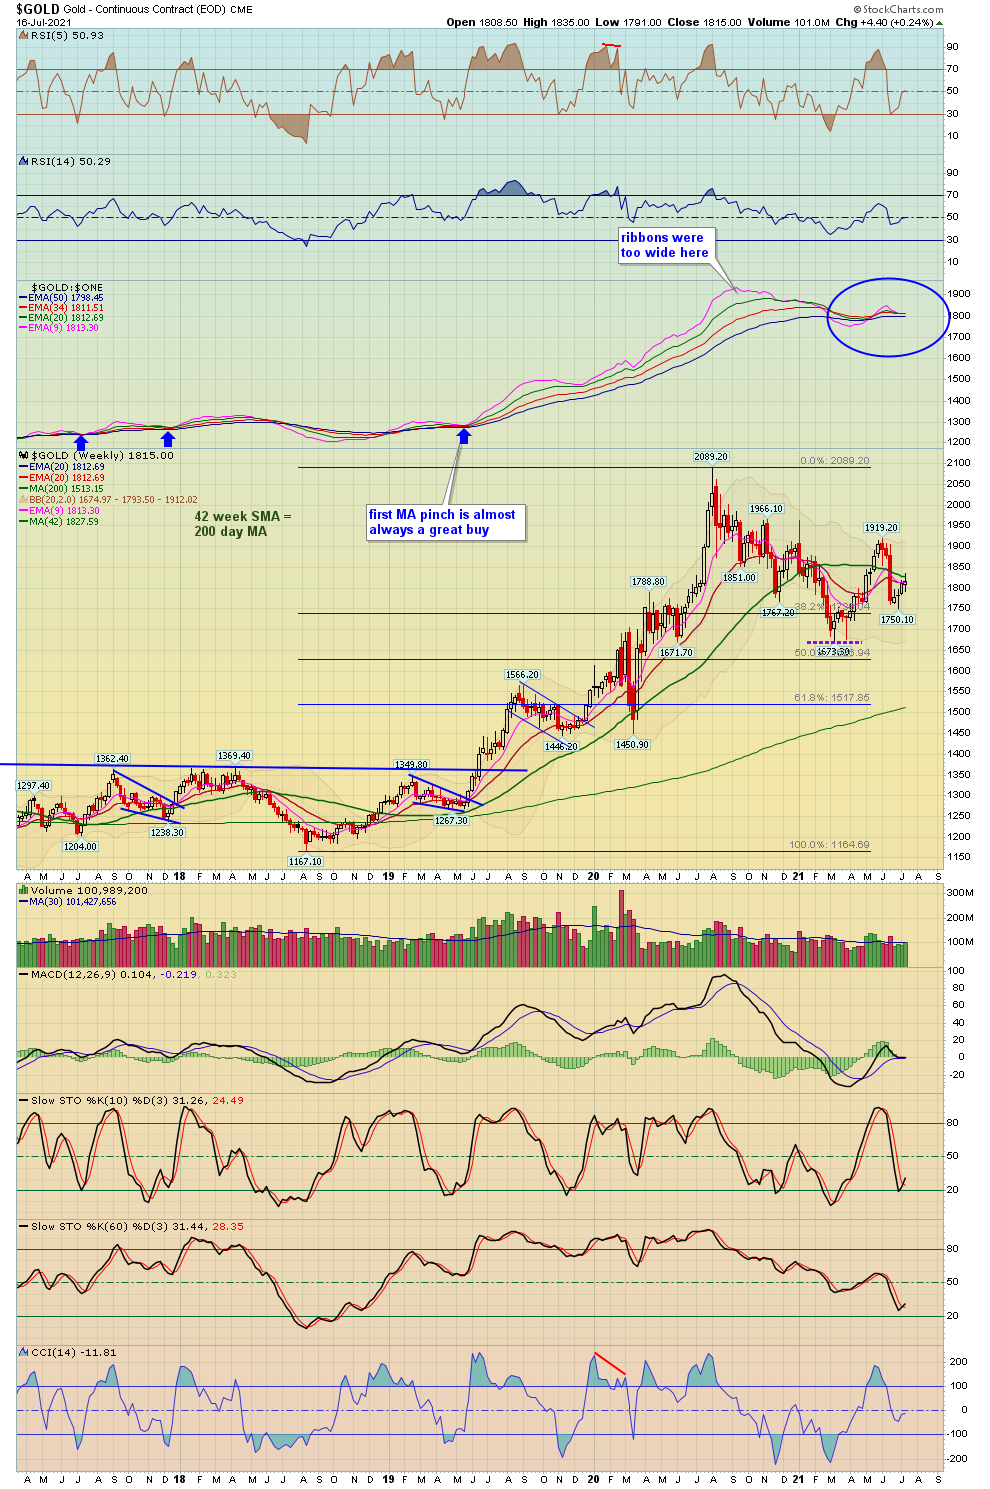
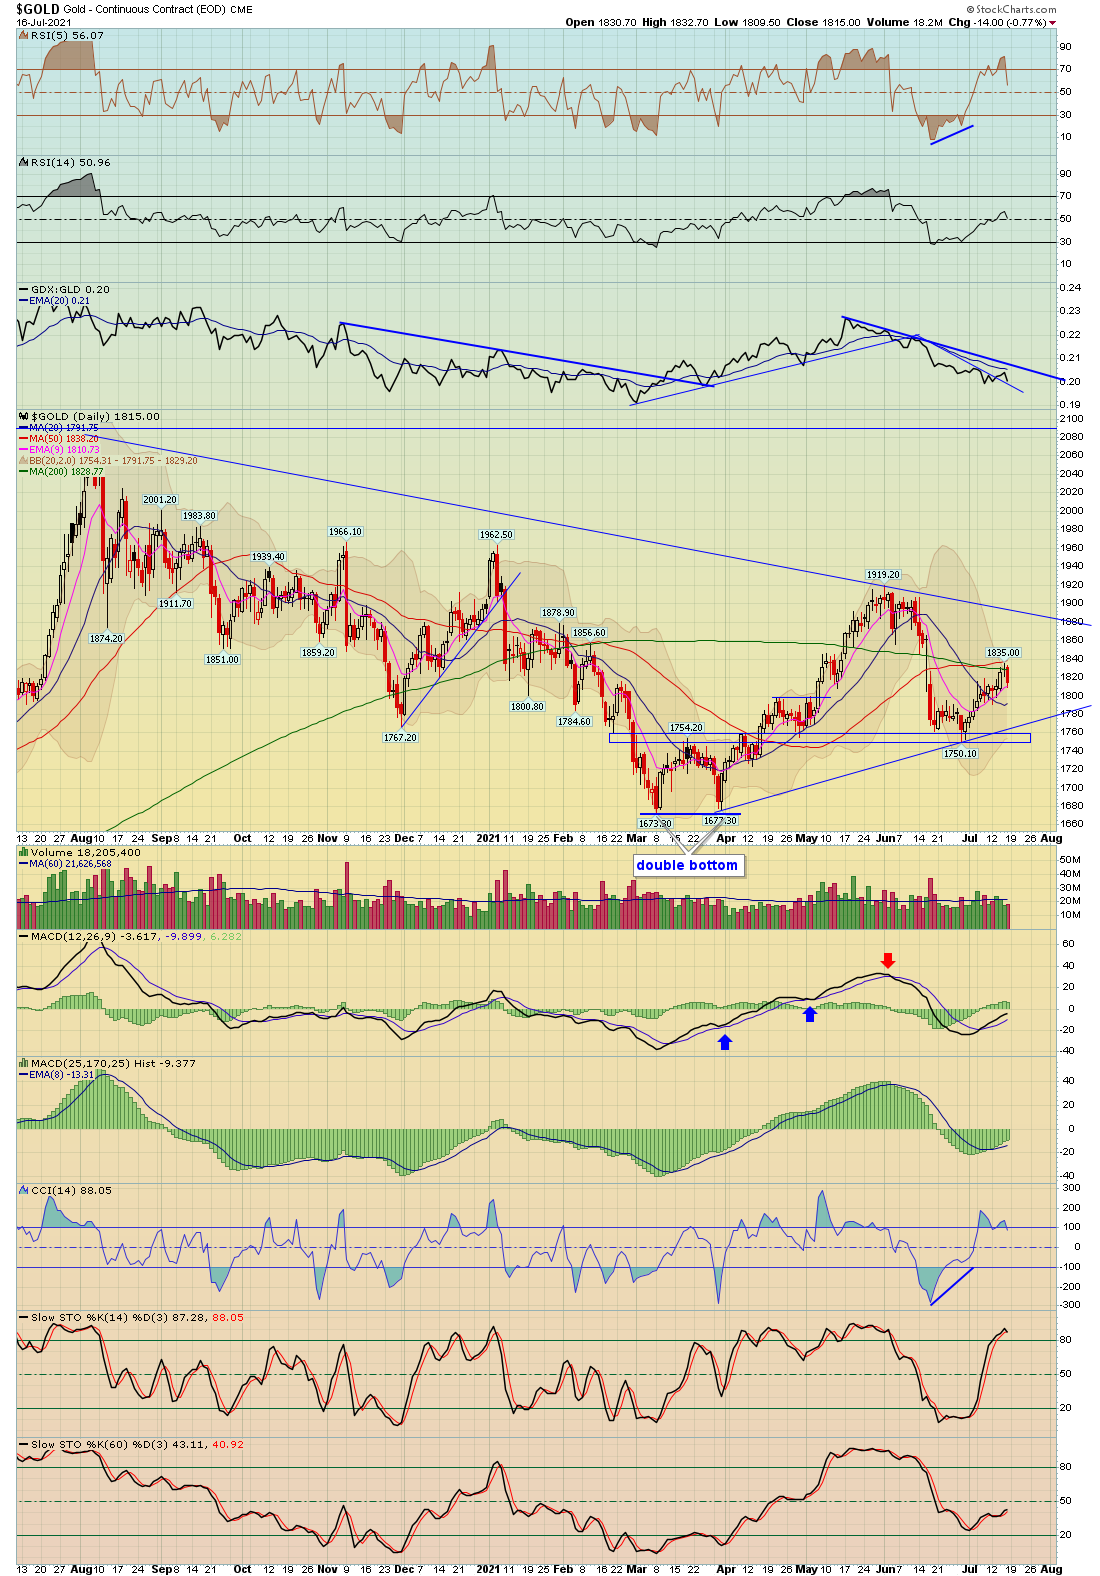
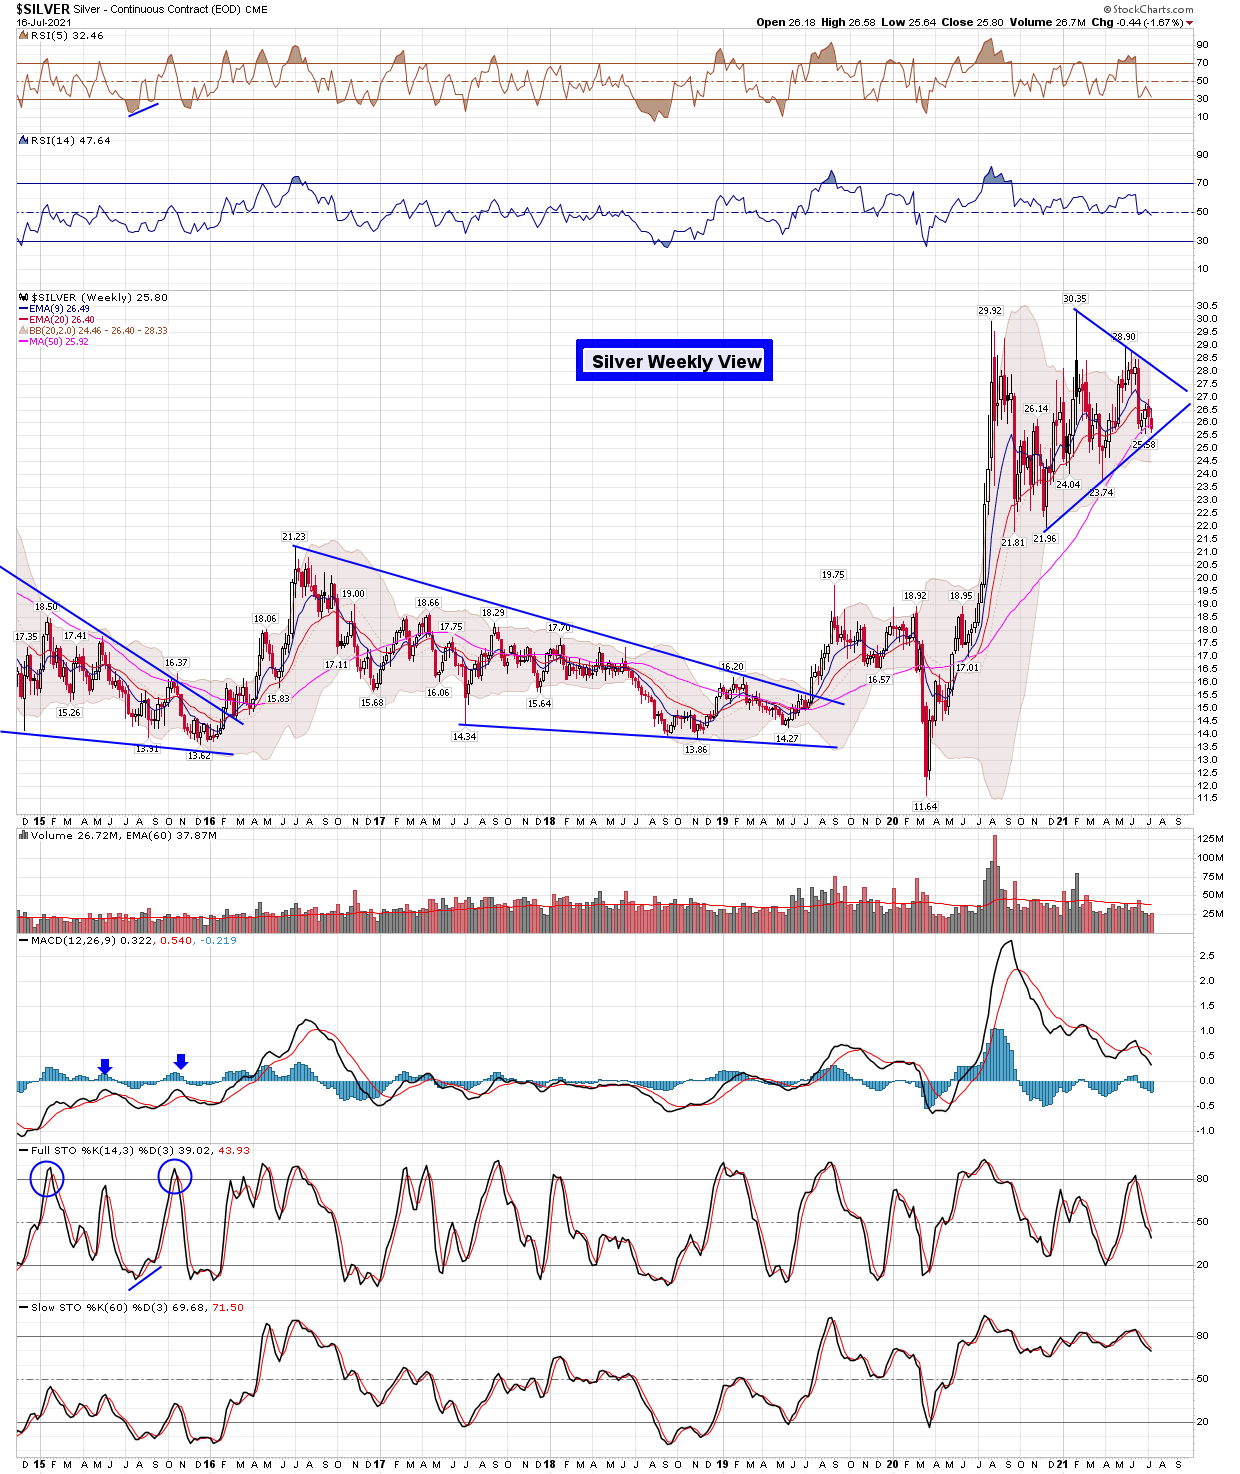
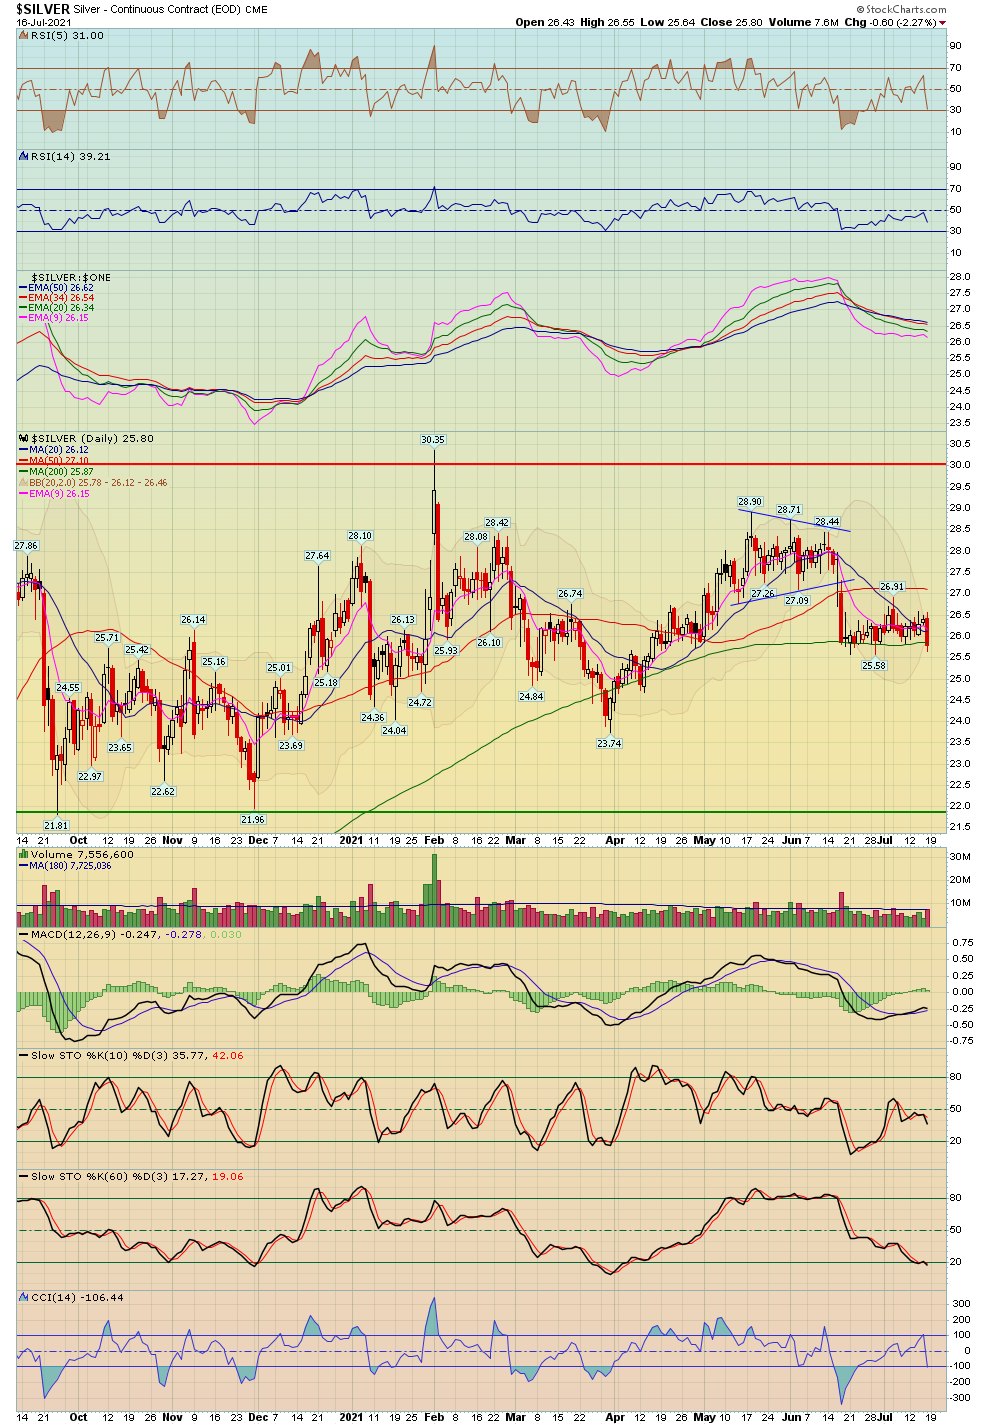
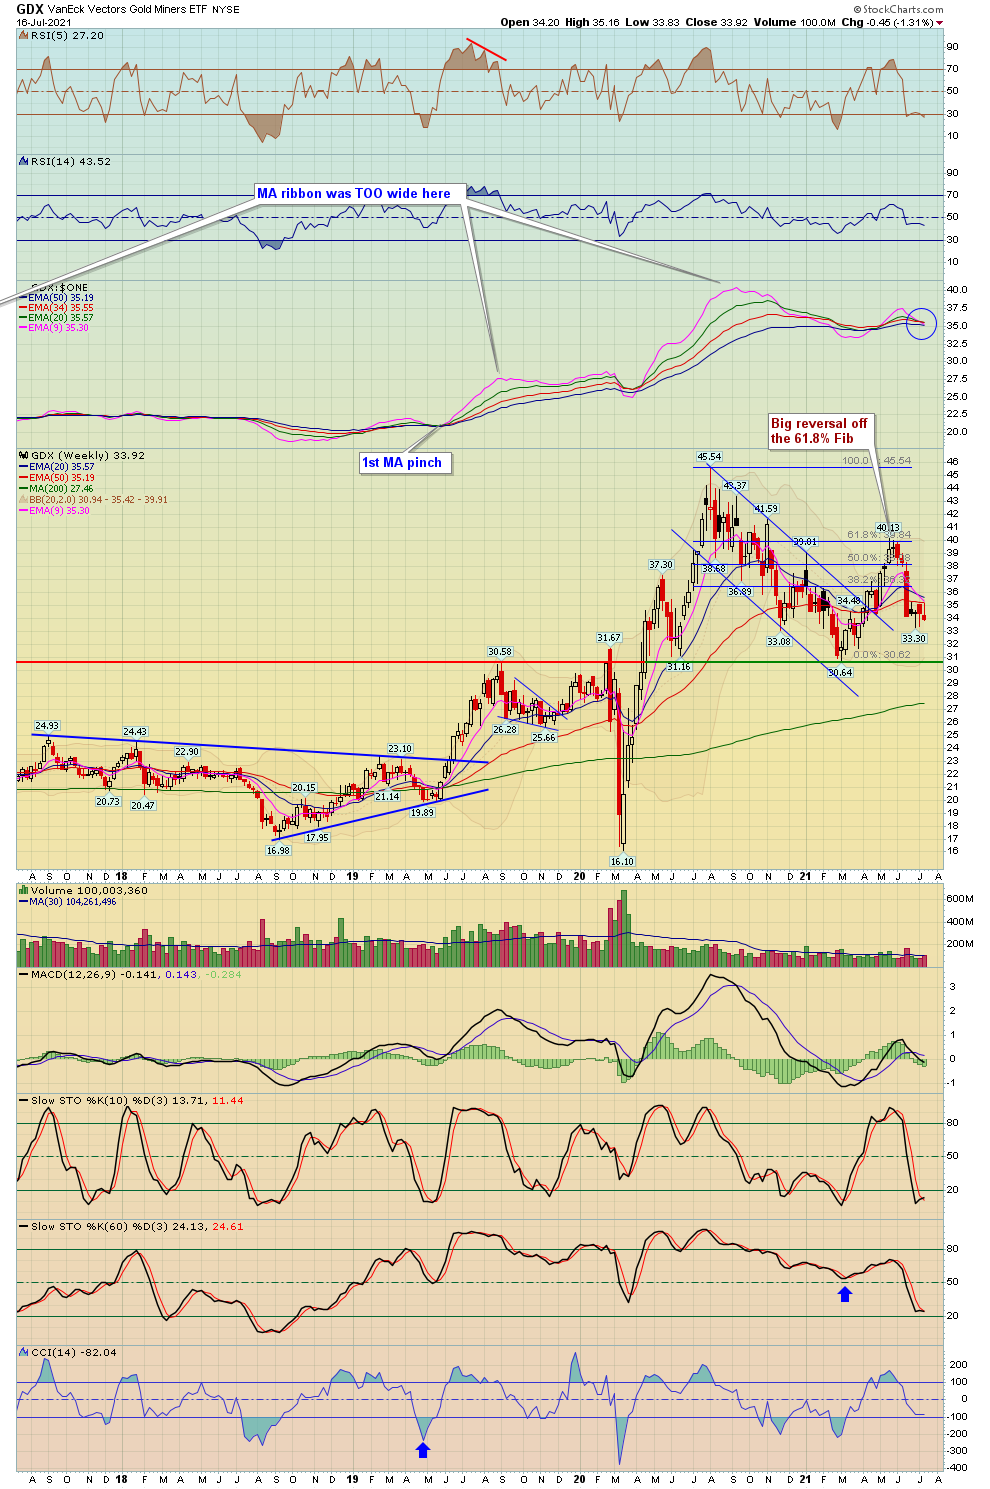
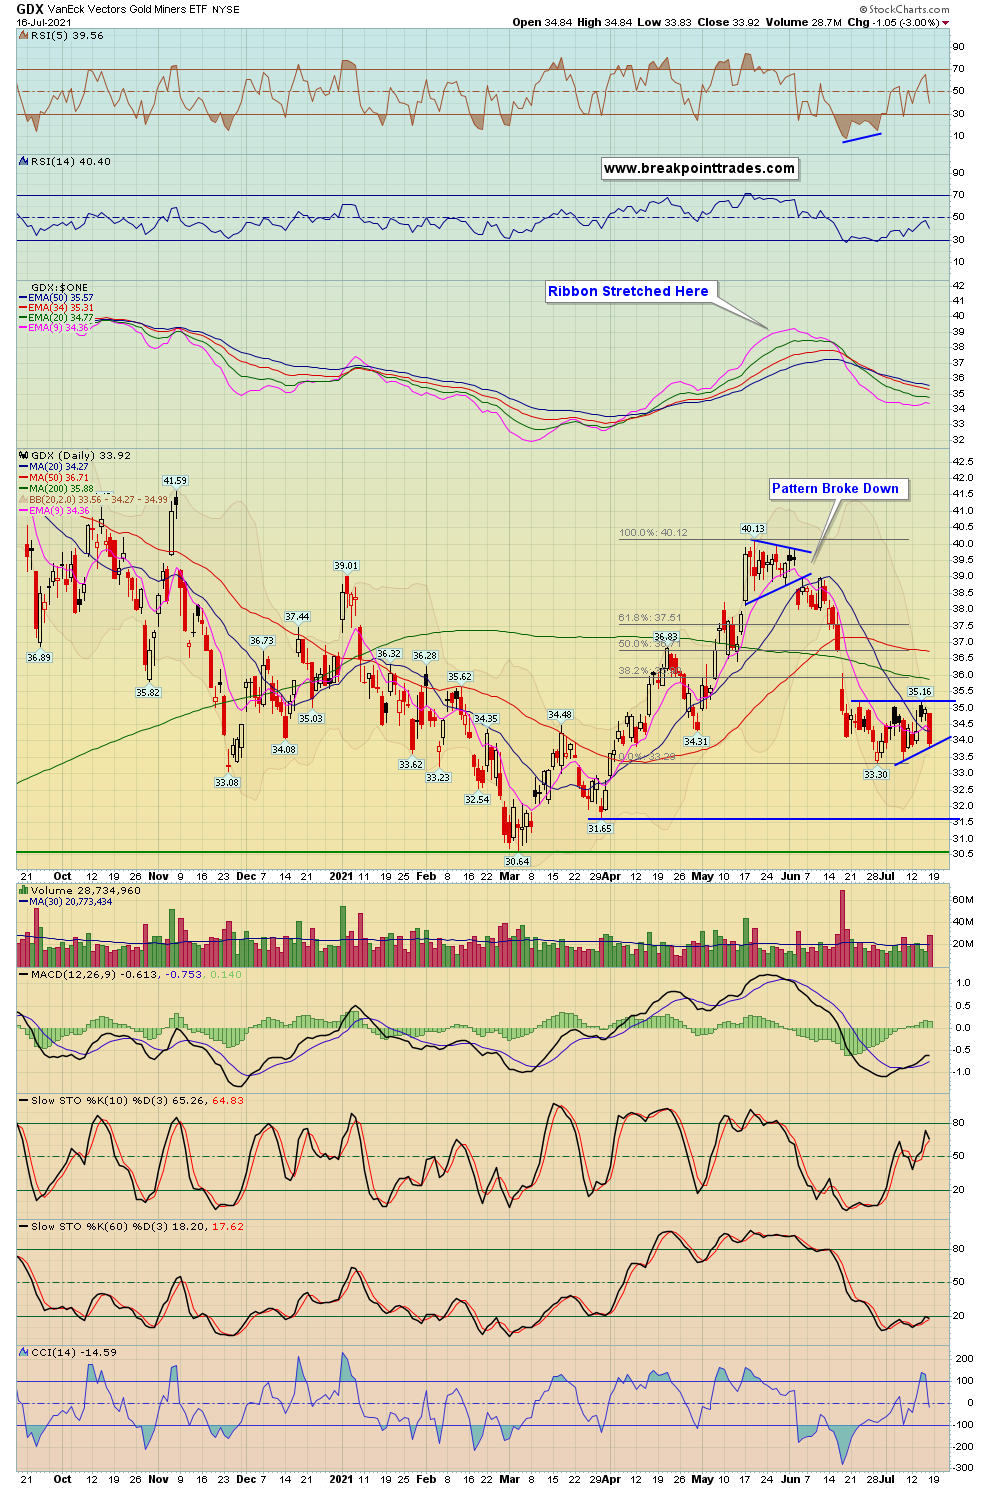
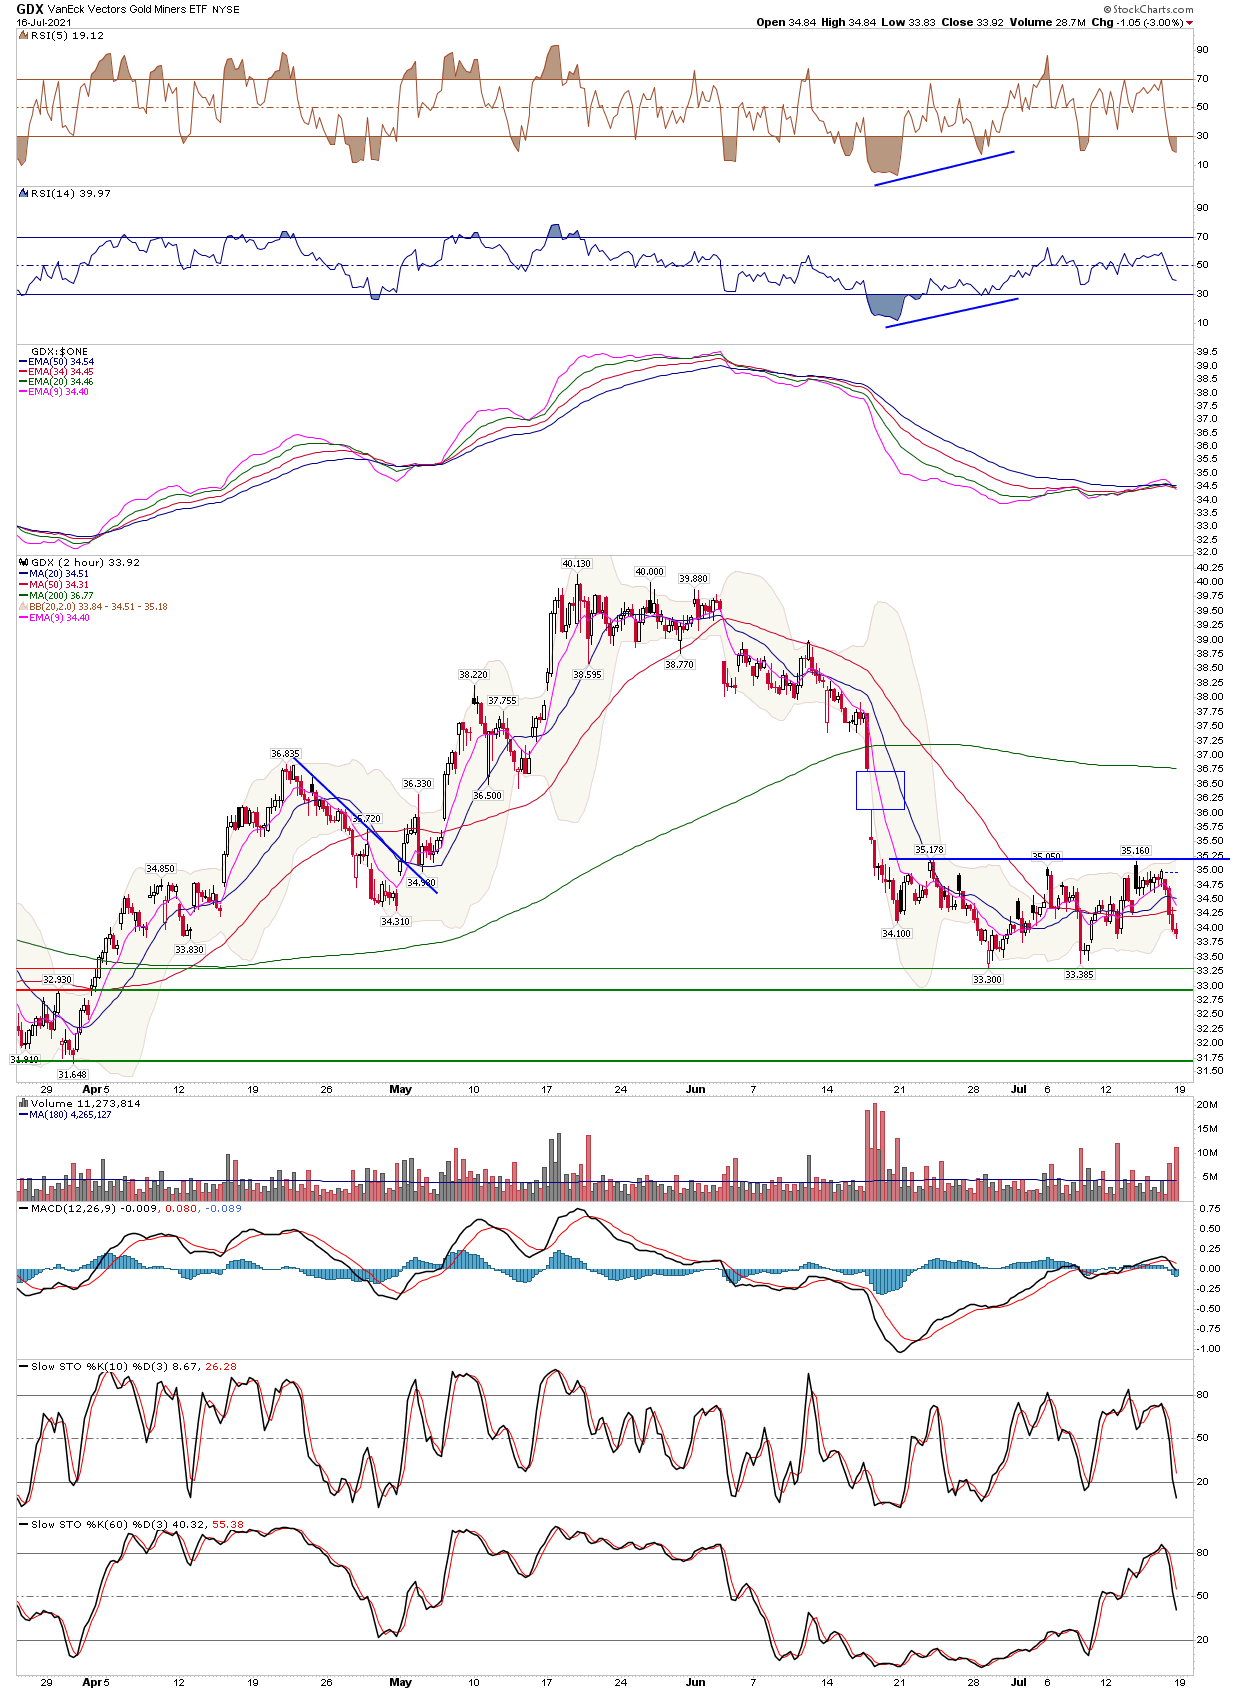
9. Precious Metals (Gold/Silver) and GDX/GDXJ
10. Following up on a few Trade ideas and added only a few new ones (as I've been saying for the last couple weeks hardly any good long setups have been showing up on my scans, which was telling and that is still the case now).
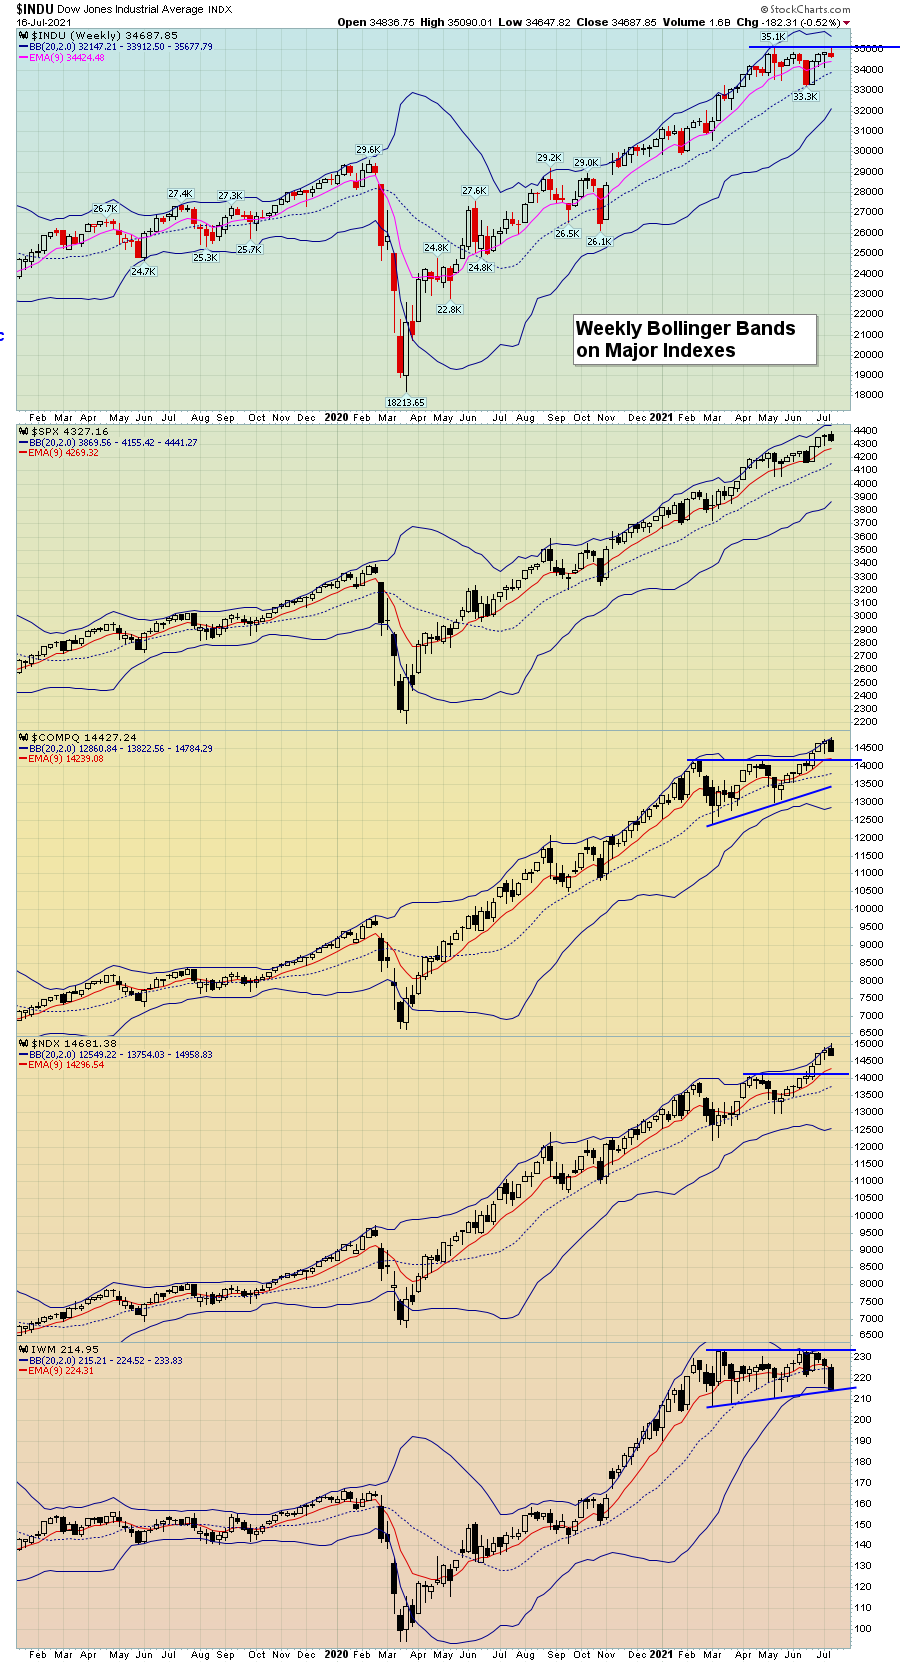
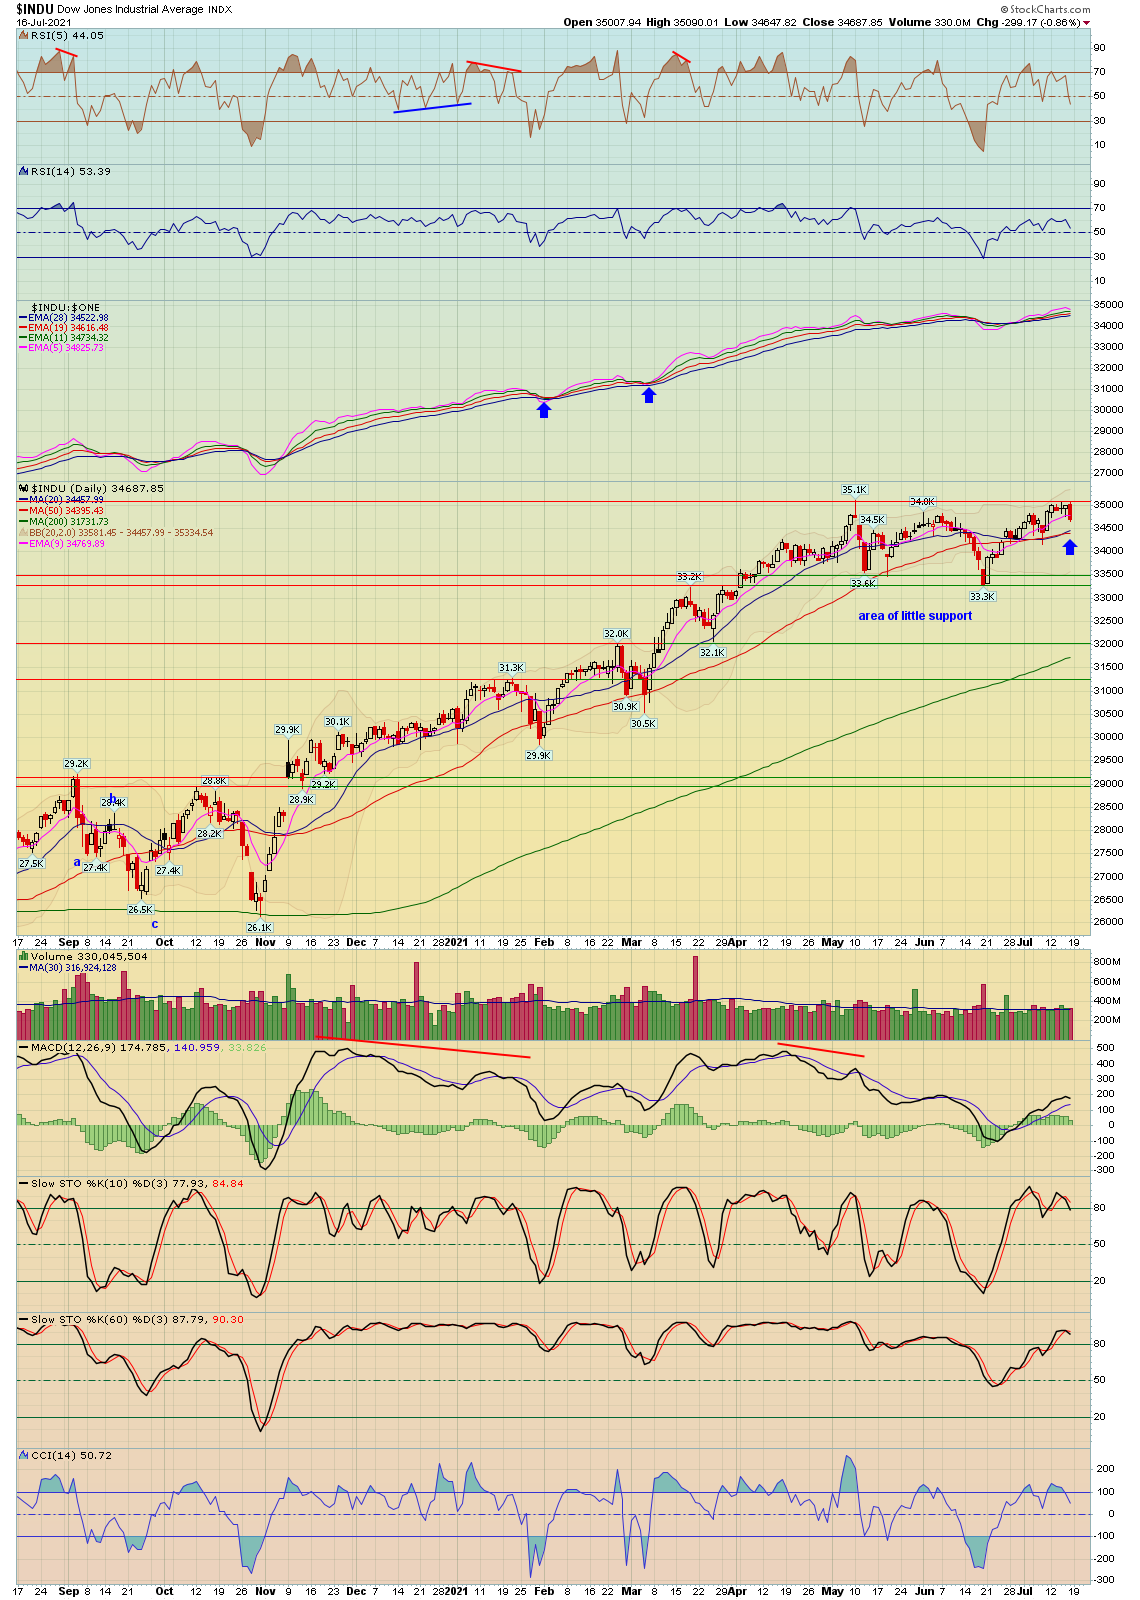
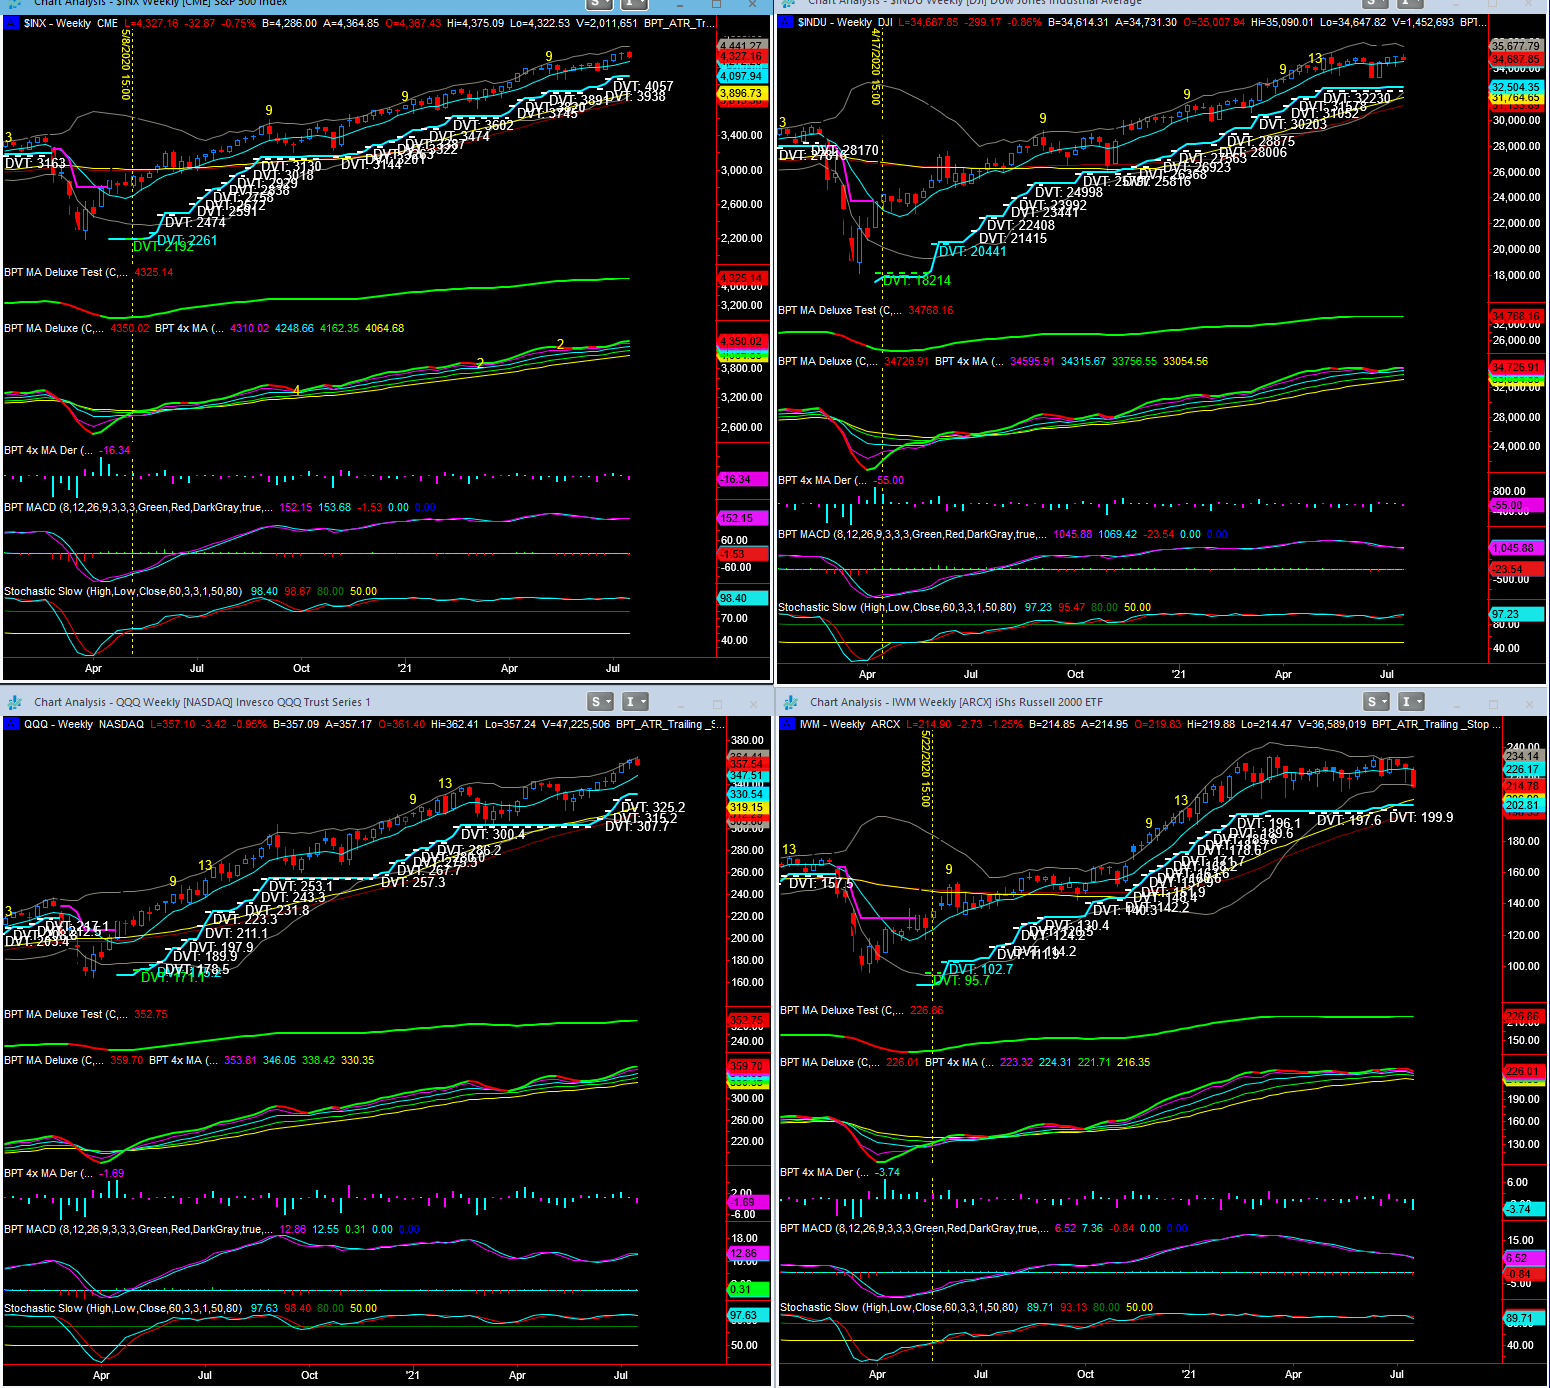
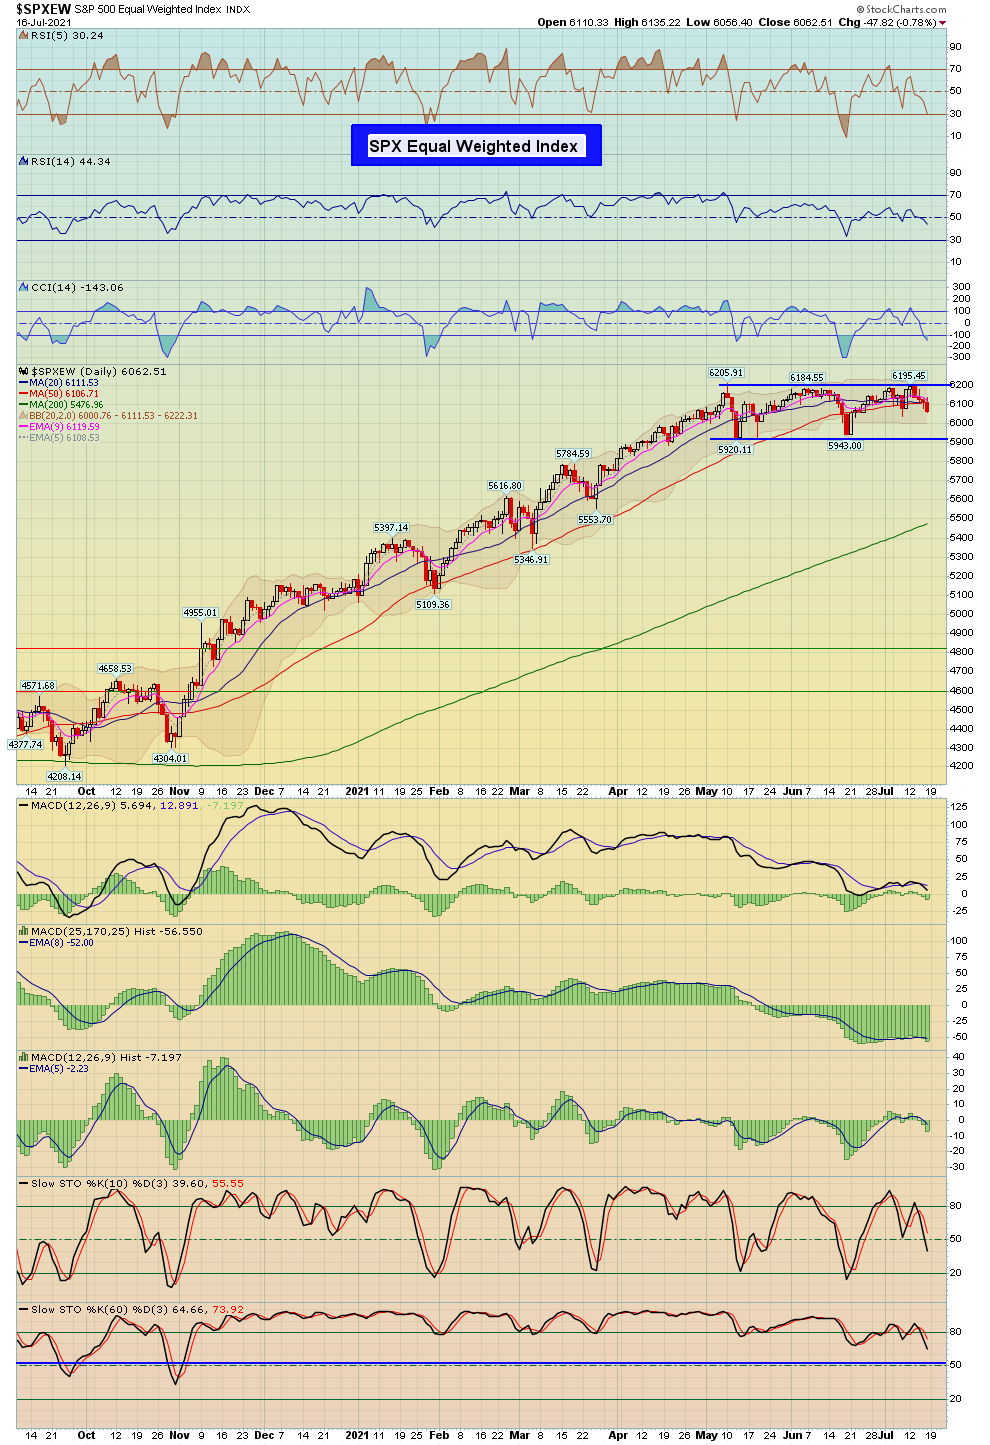
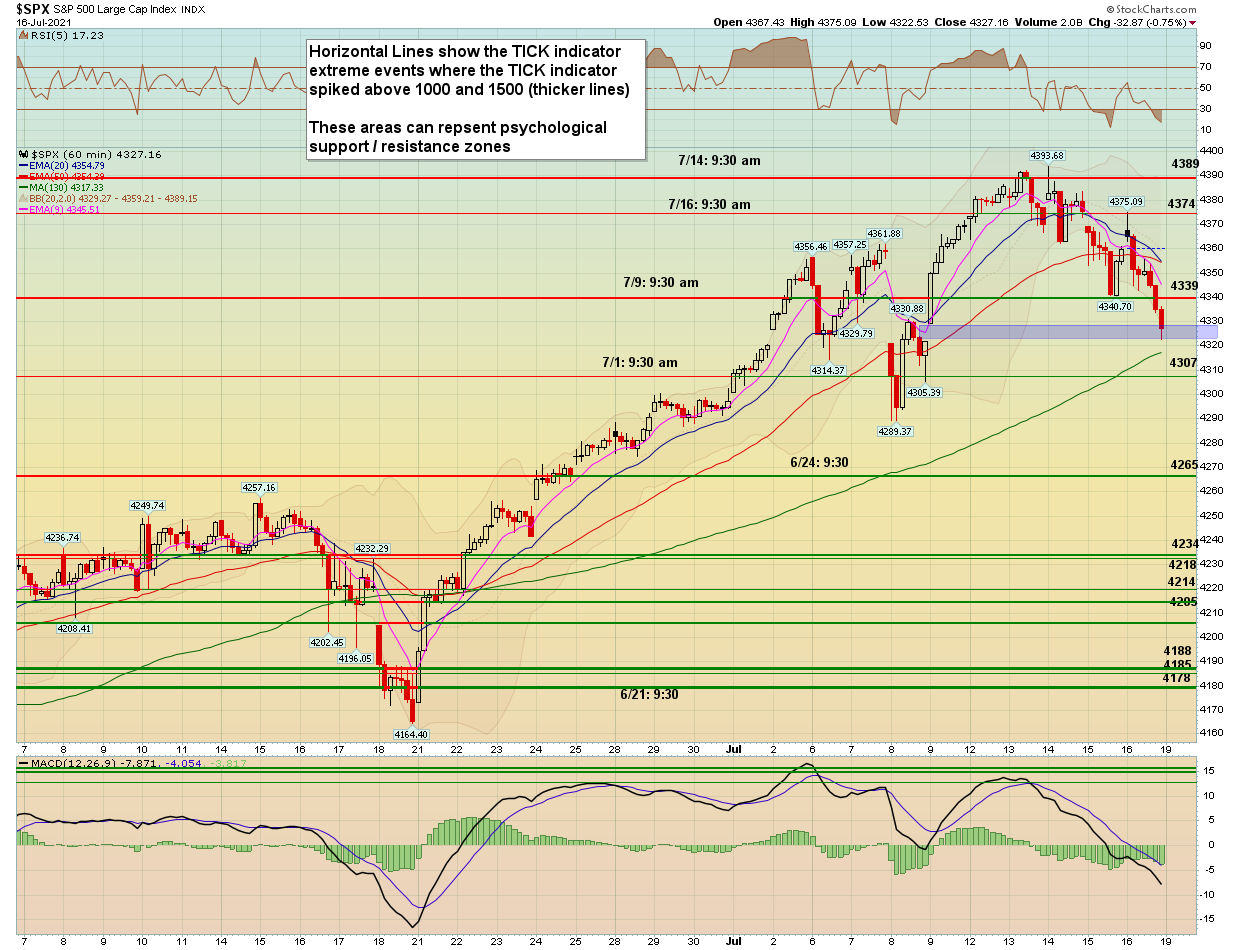
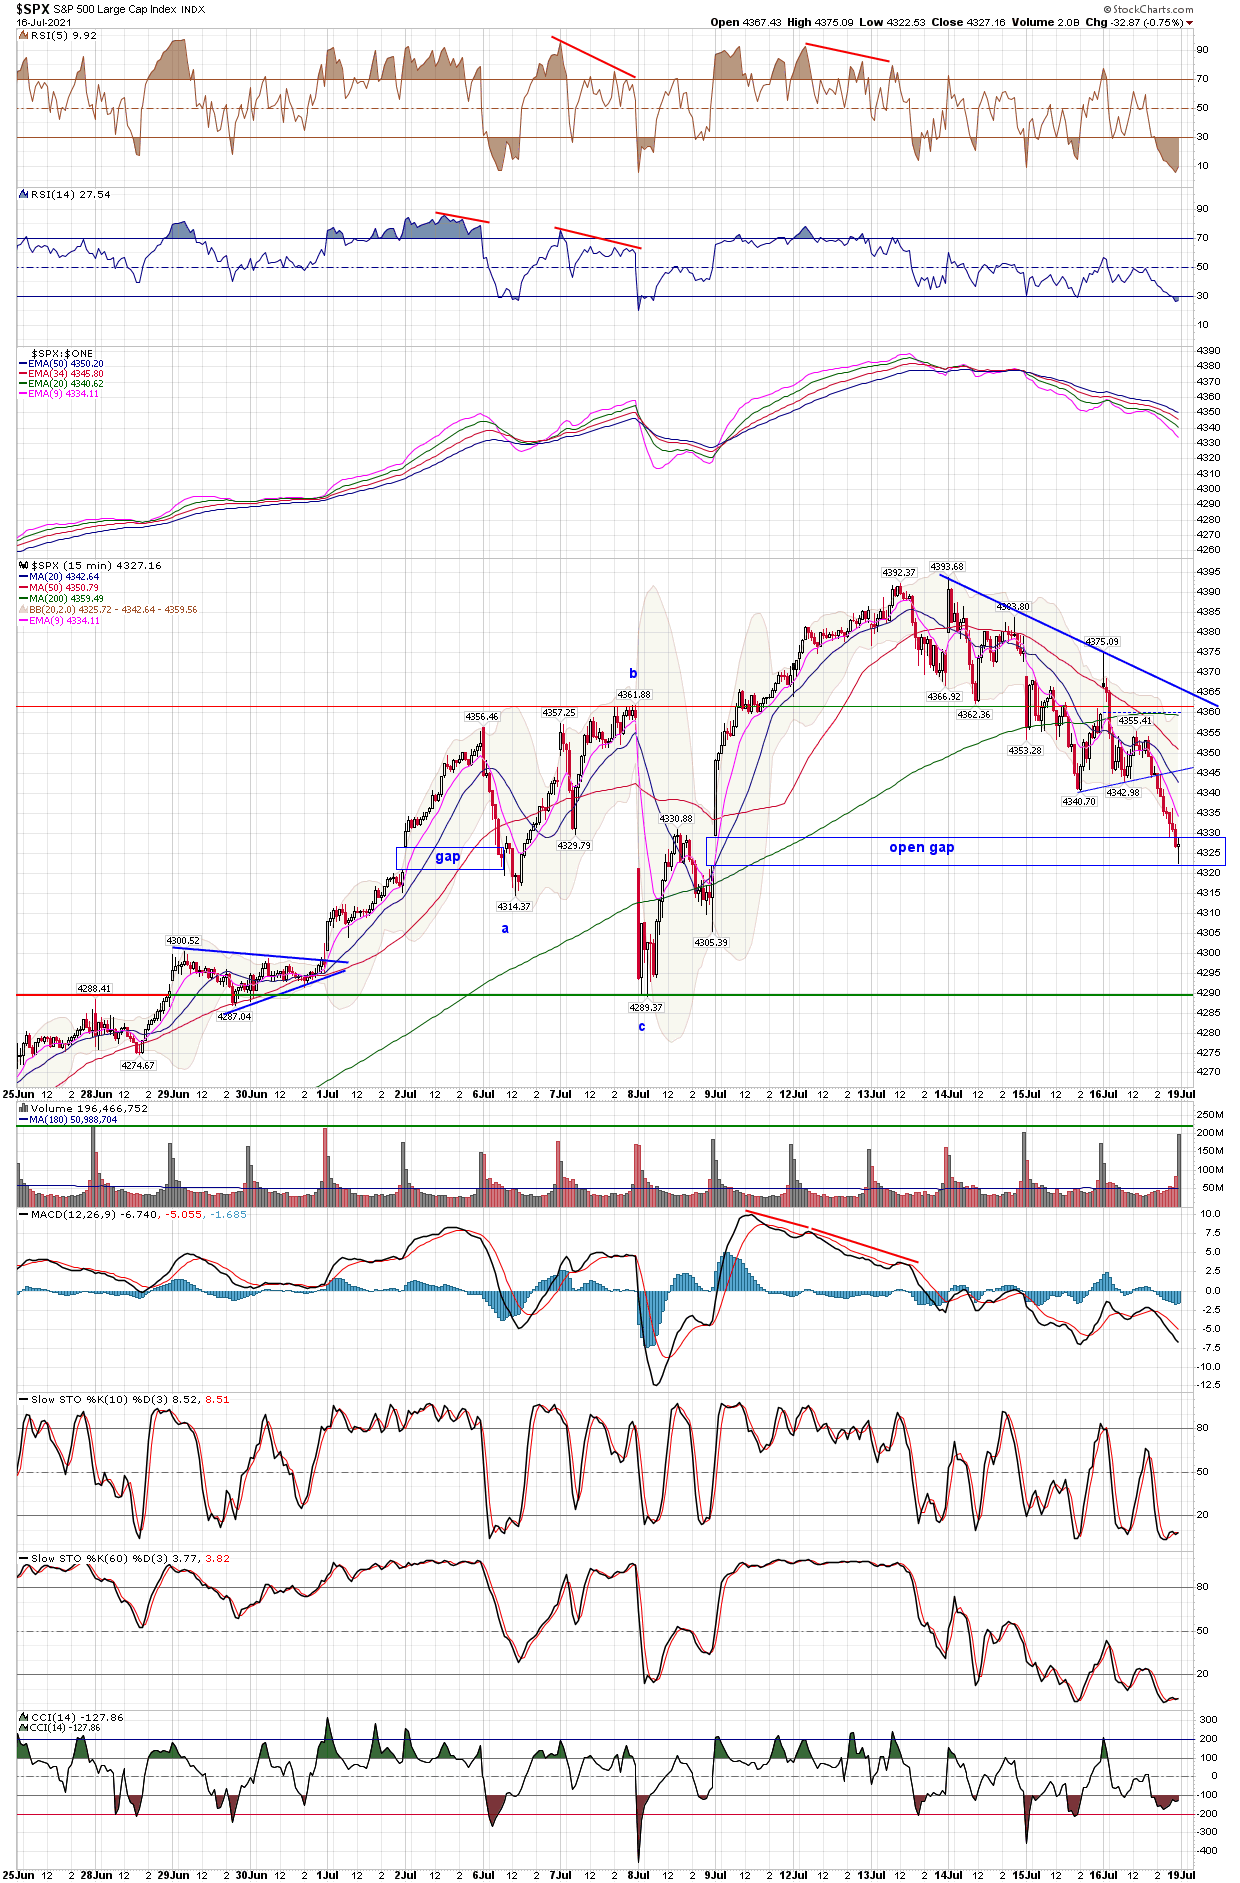
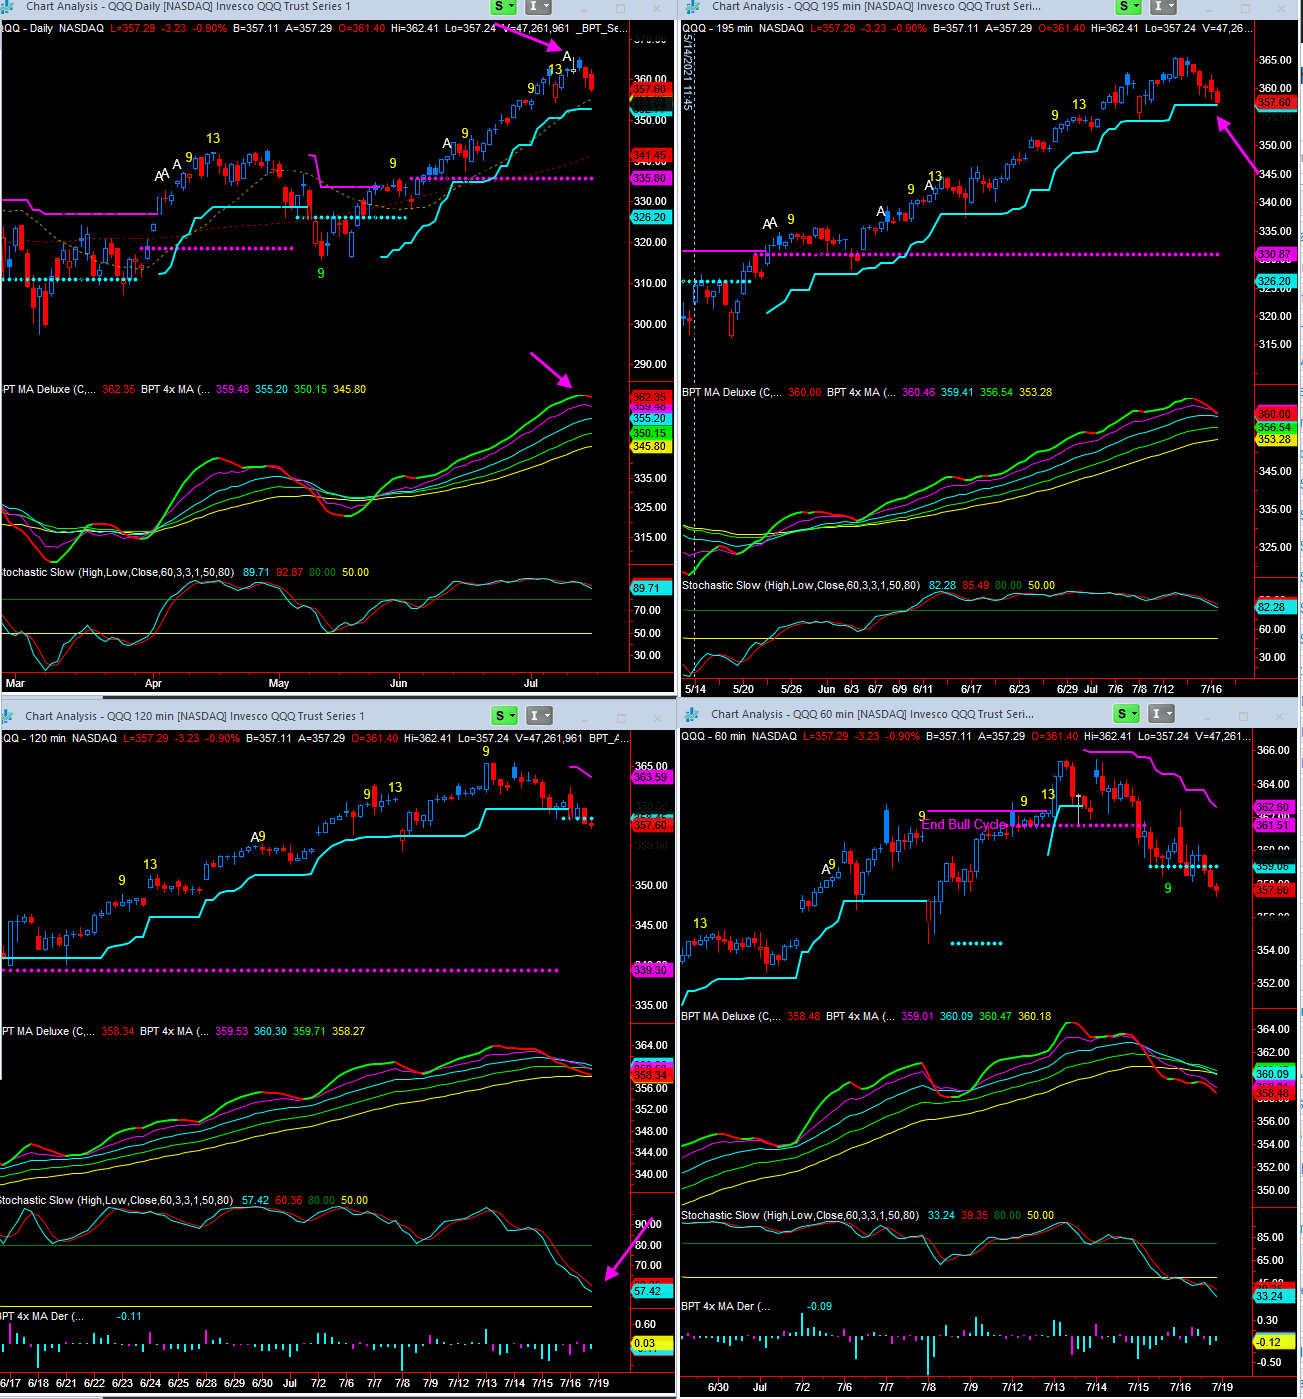
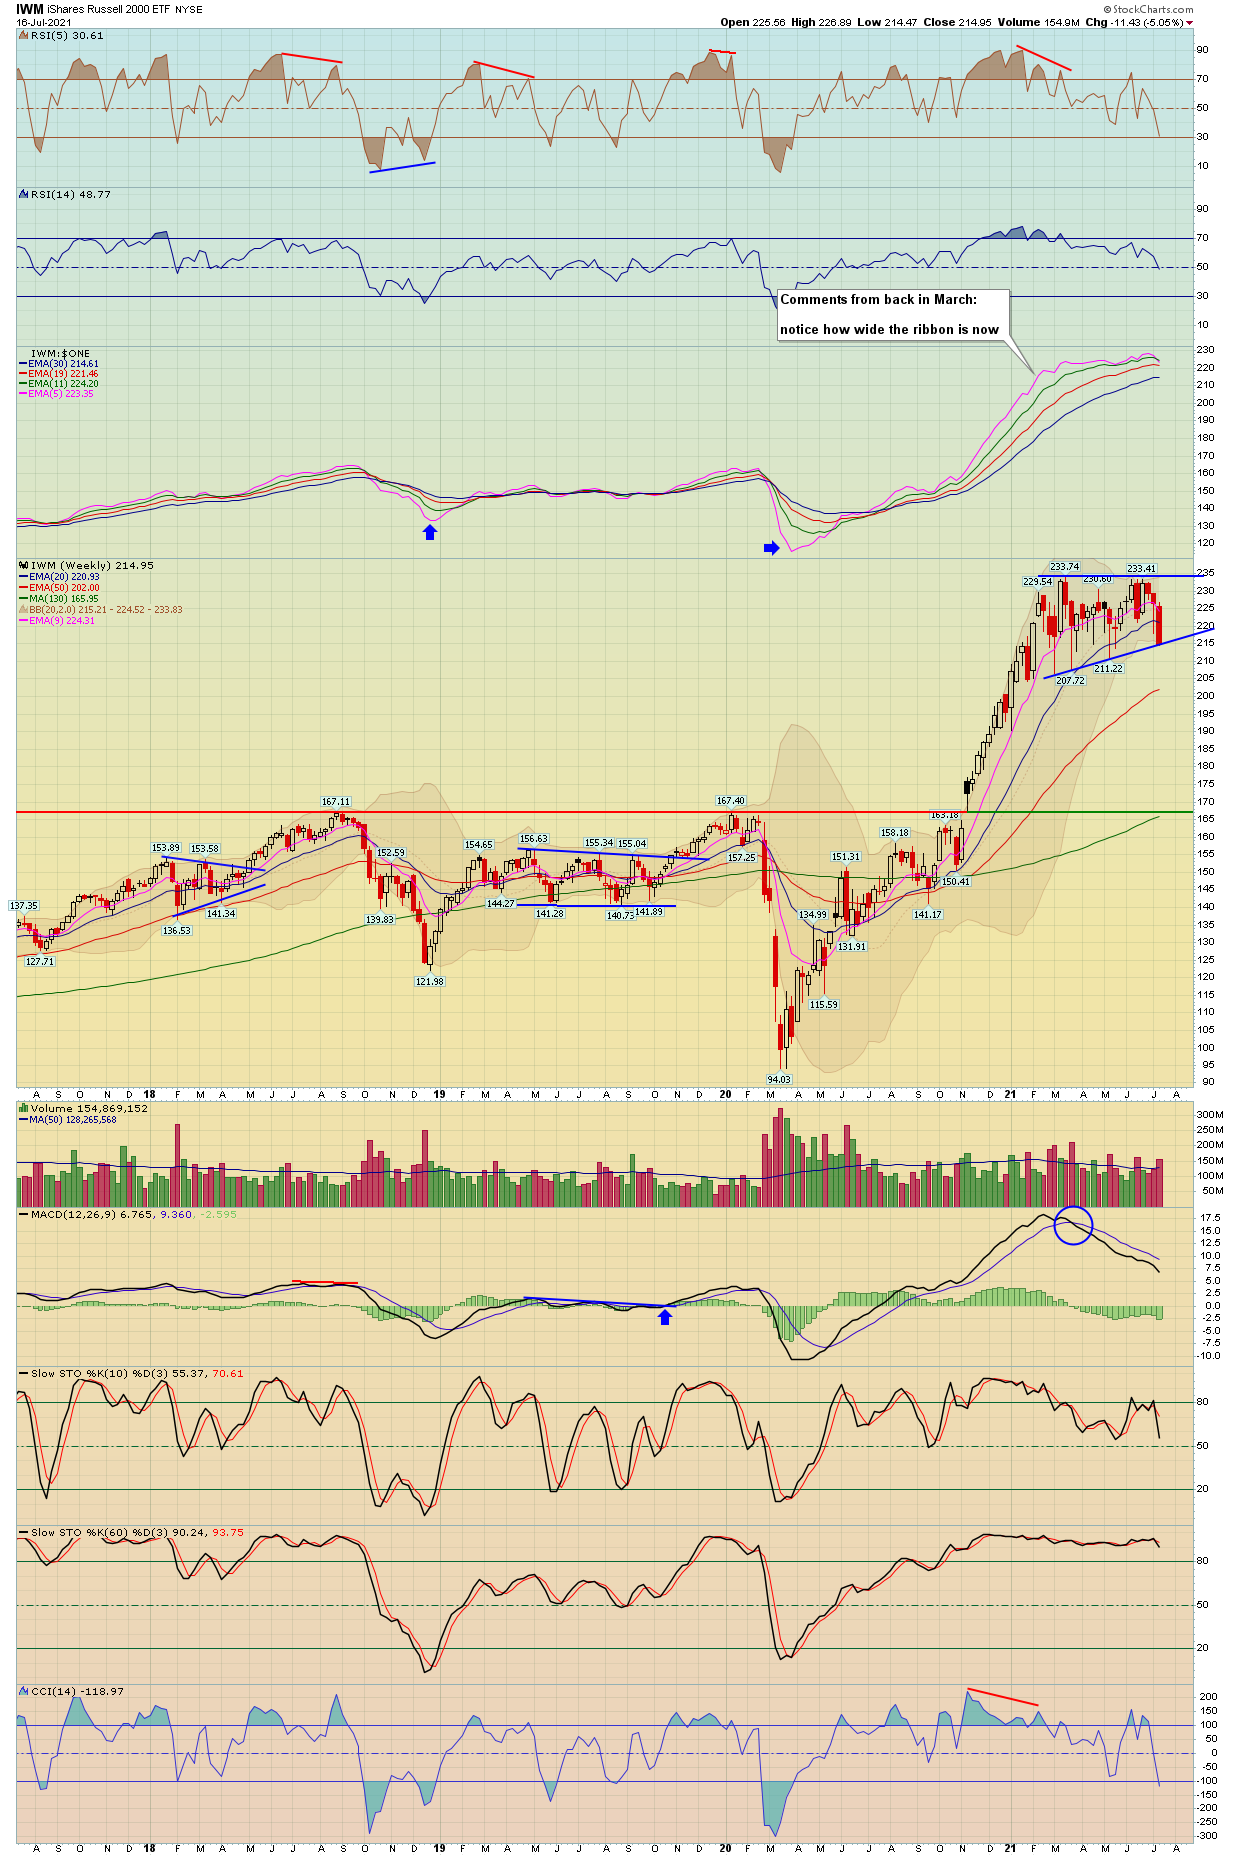
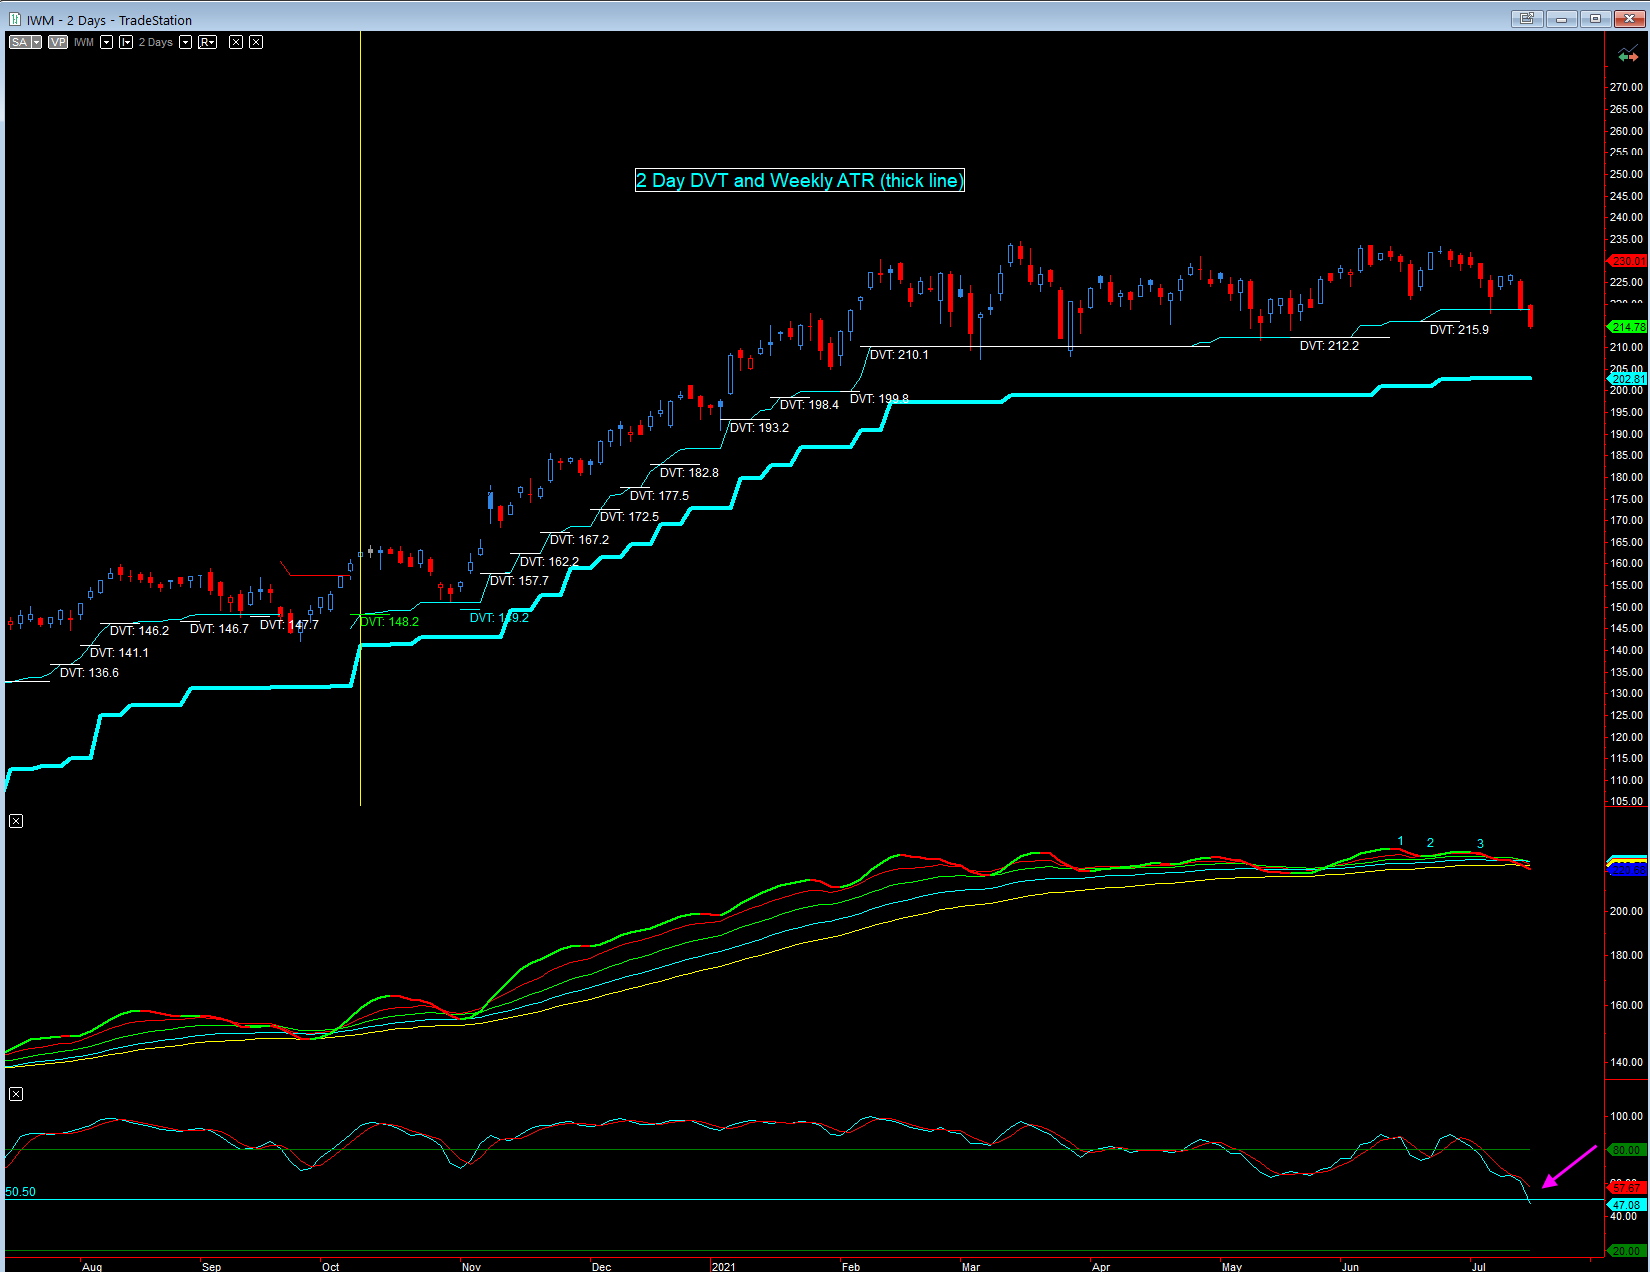
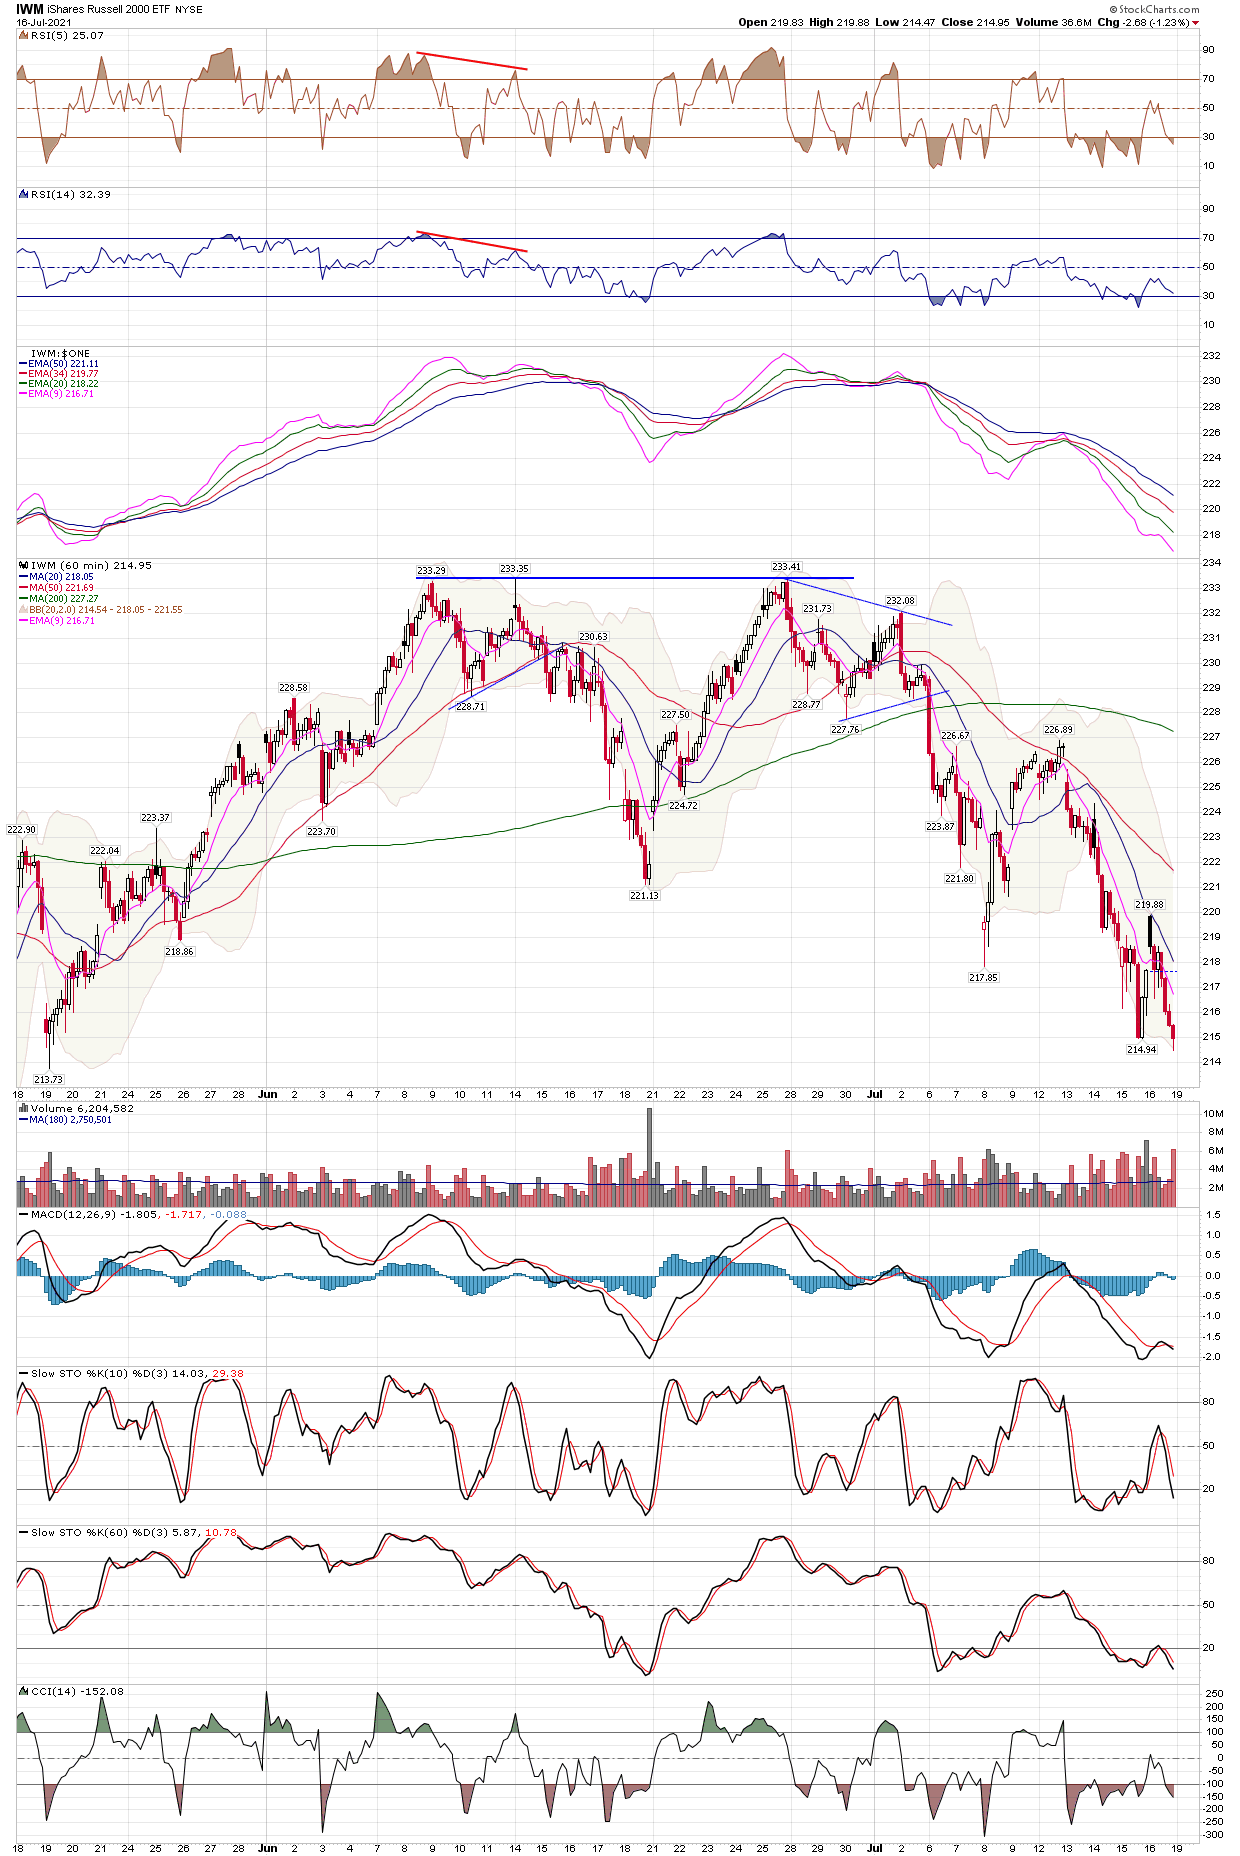
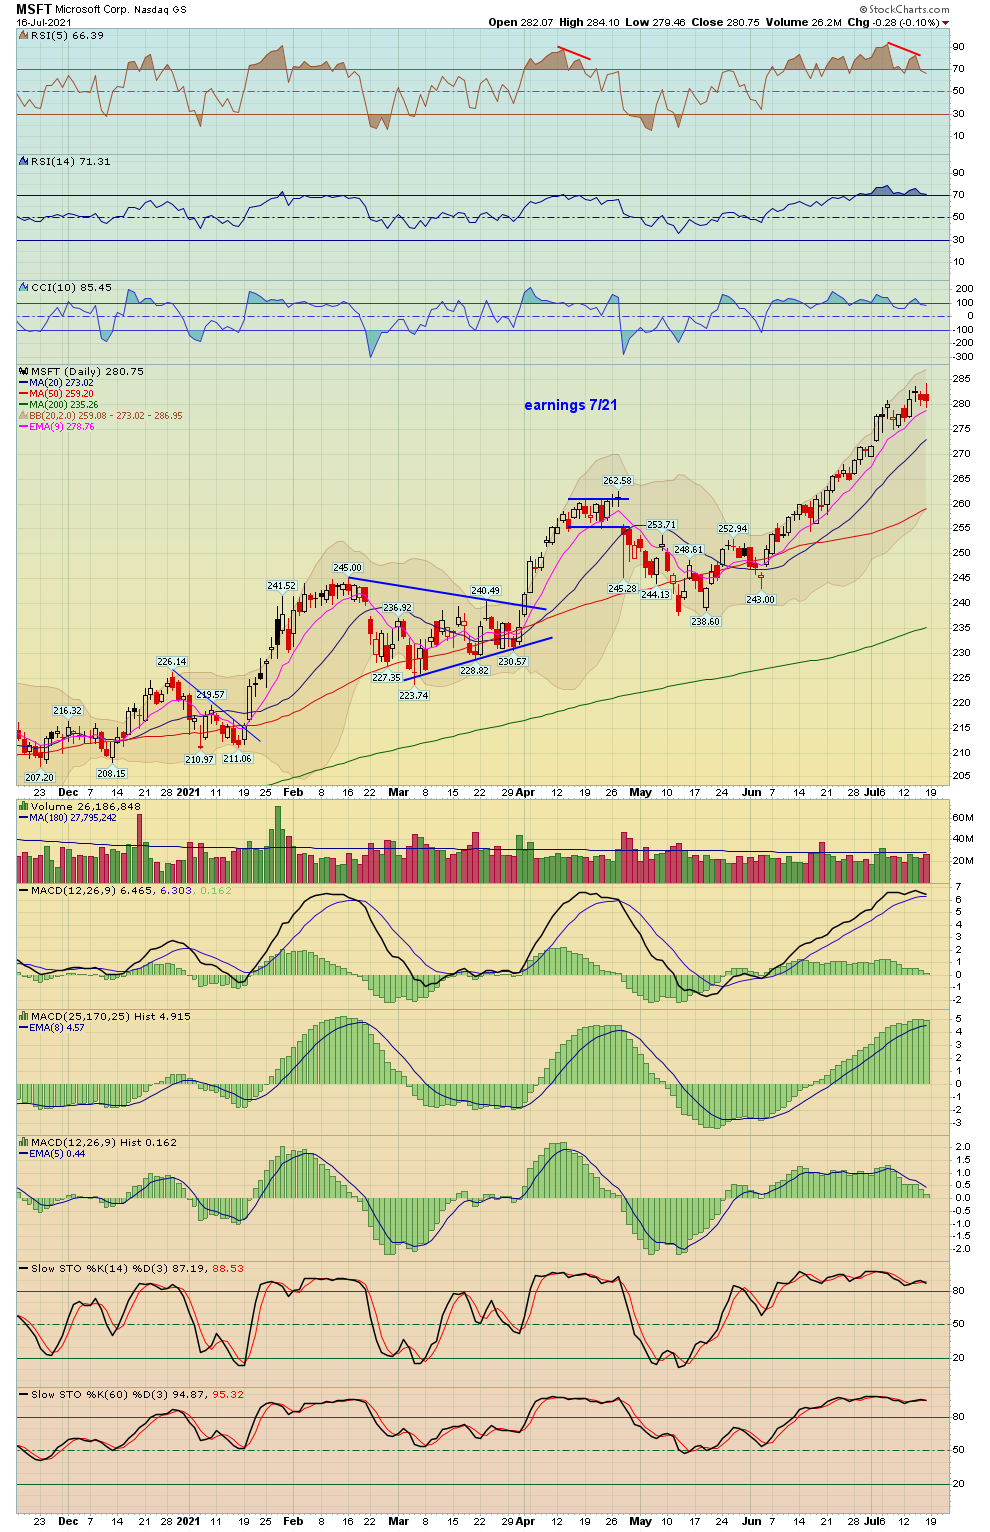
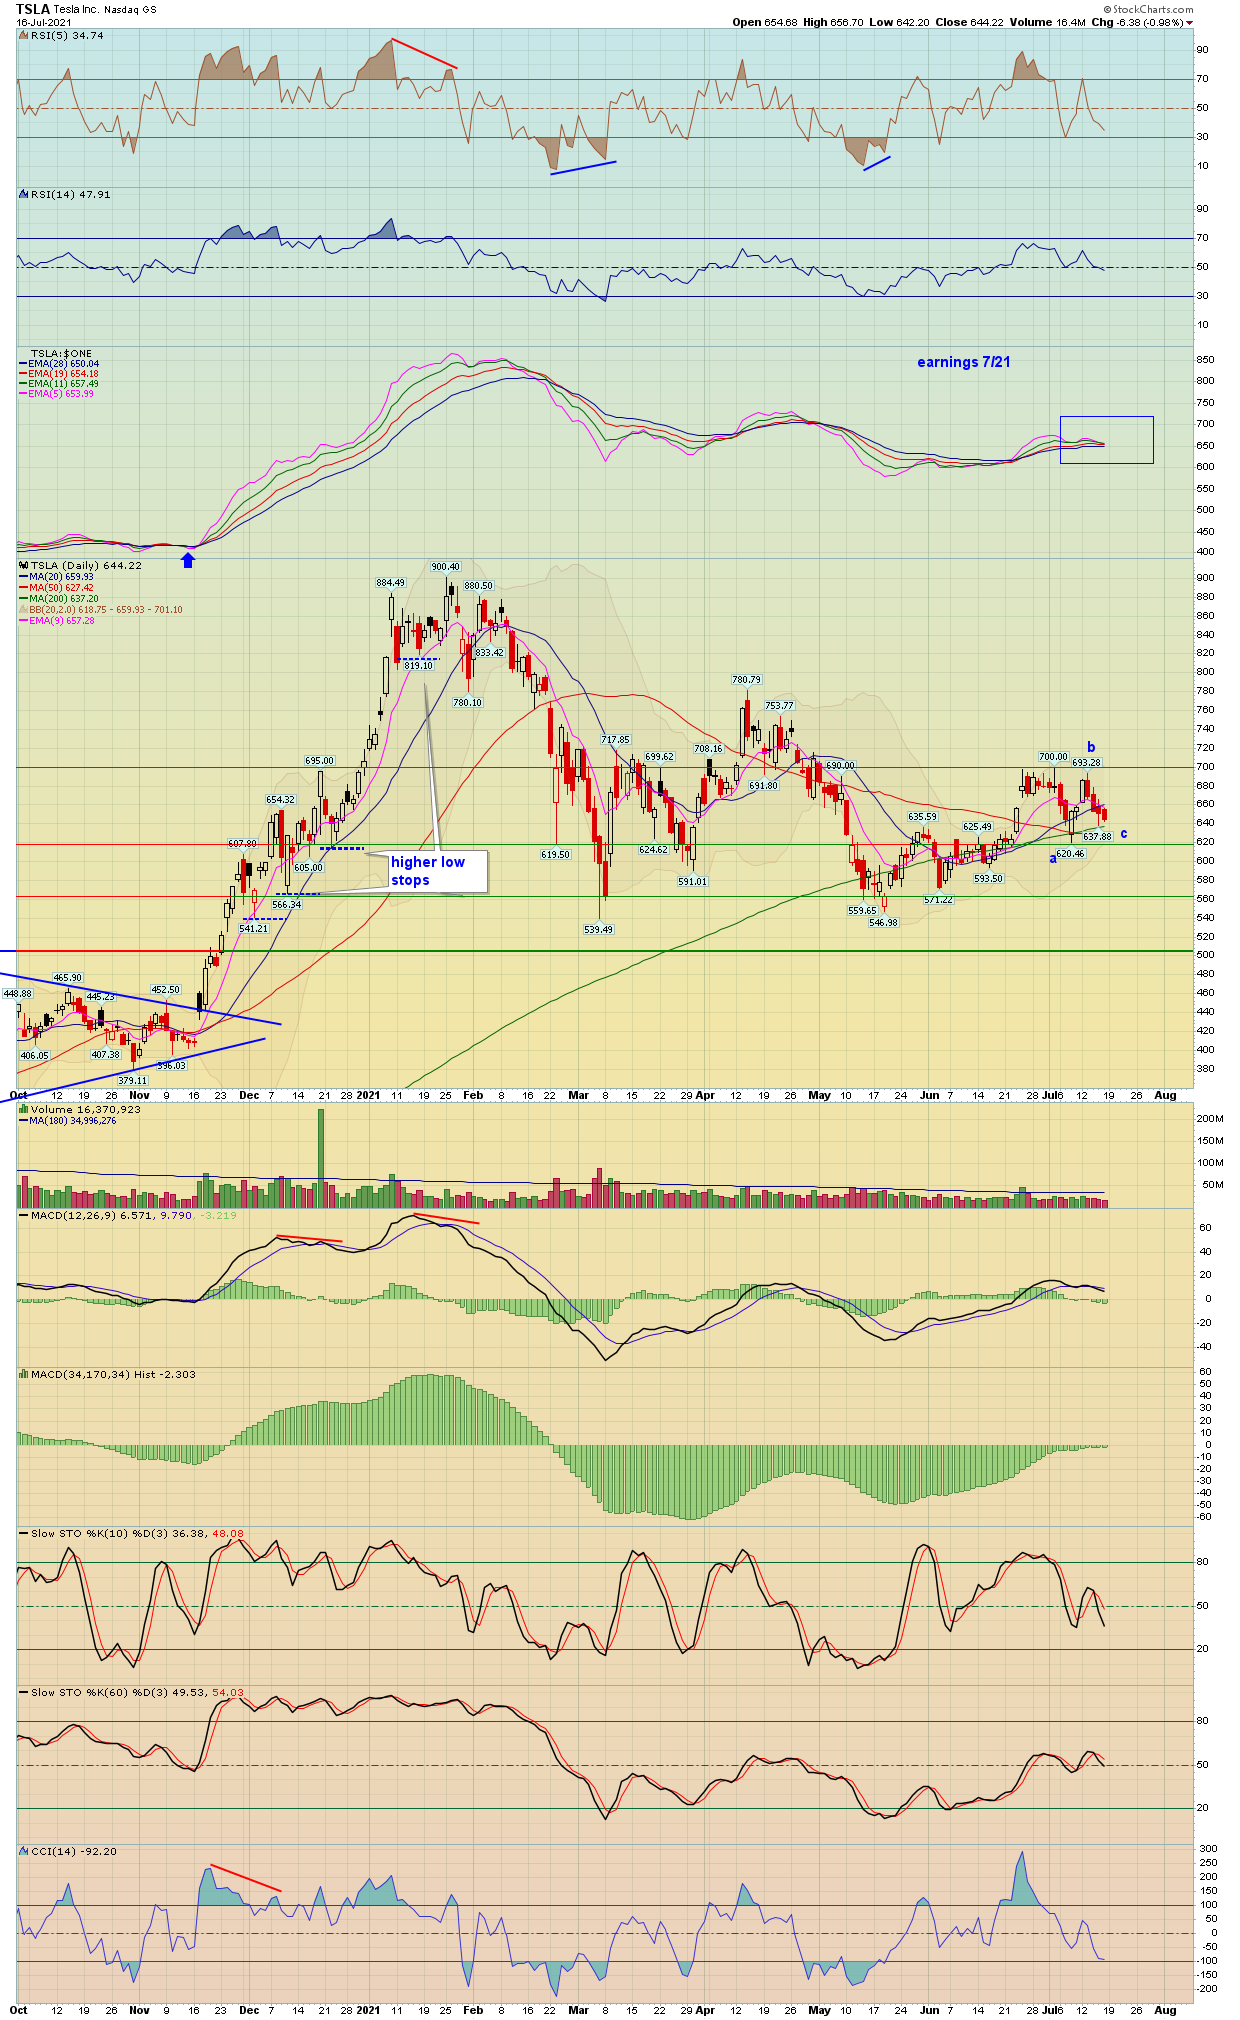
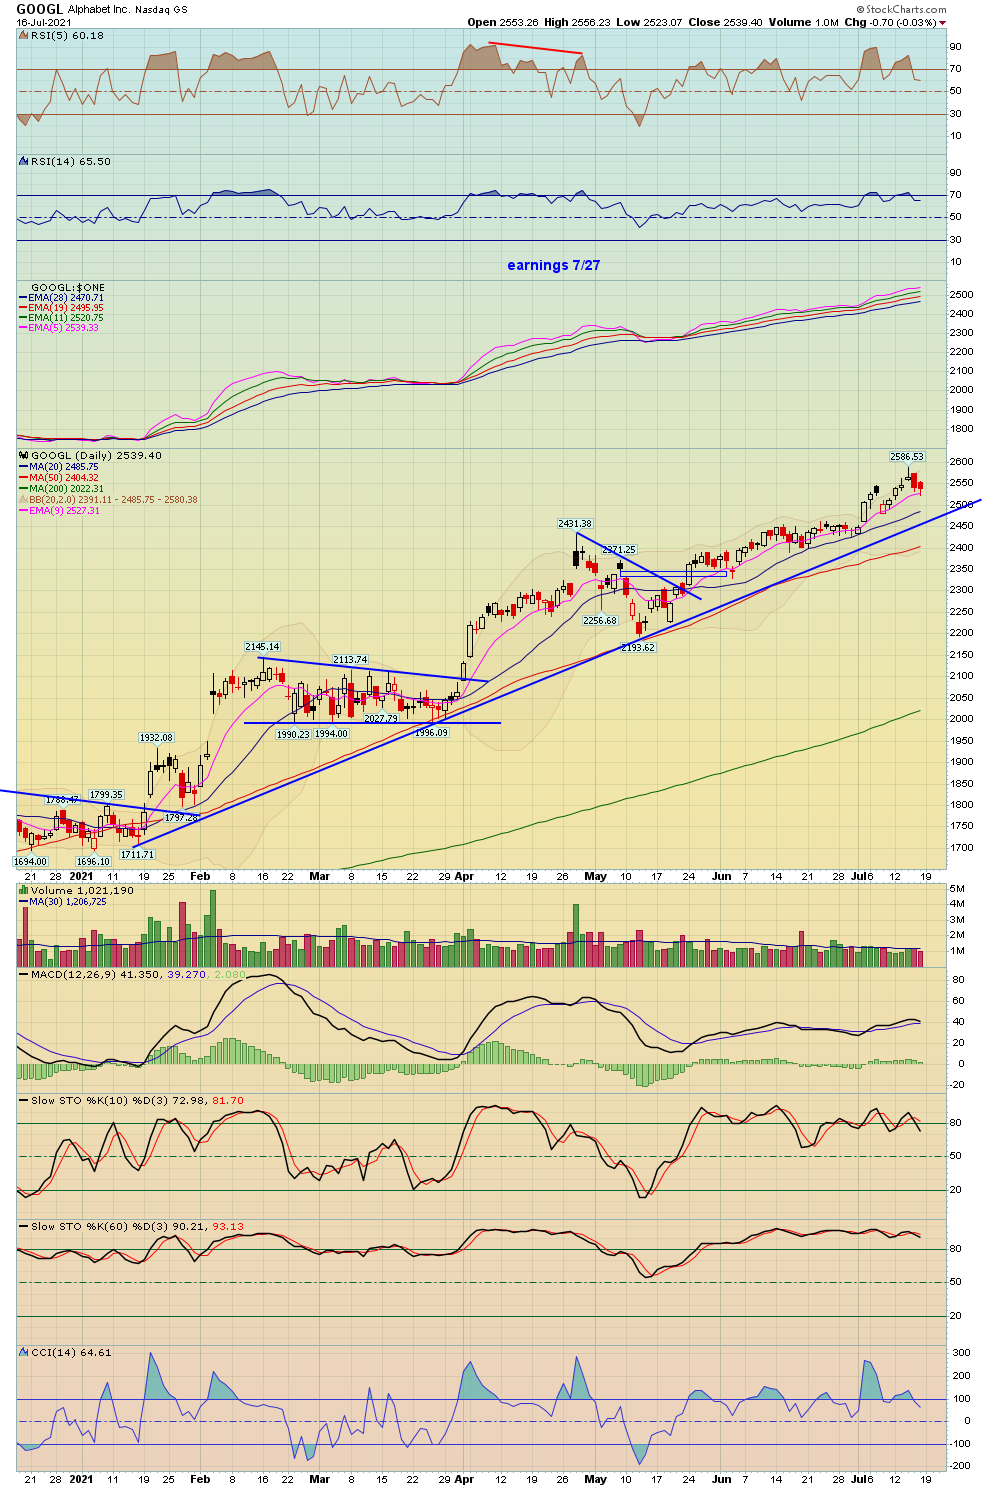
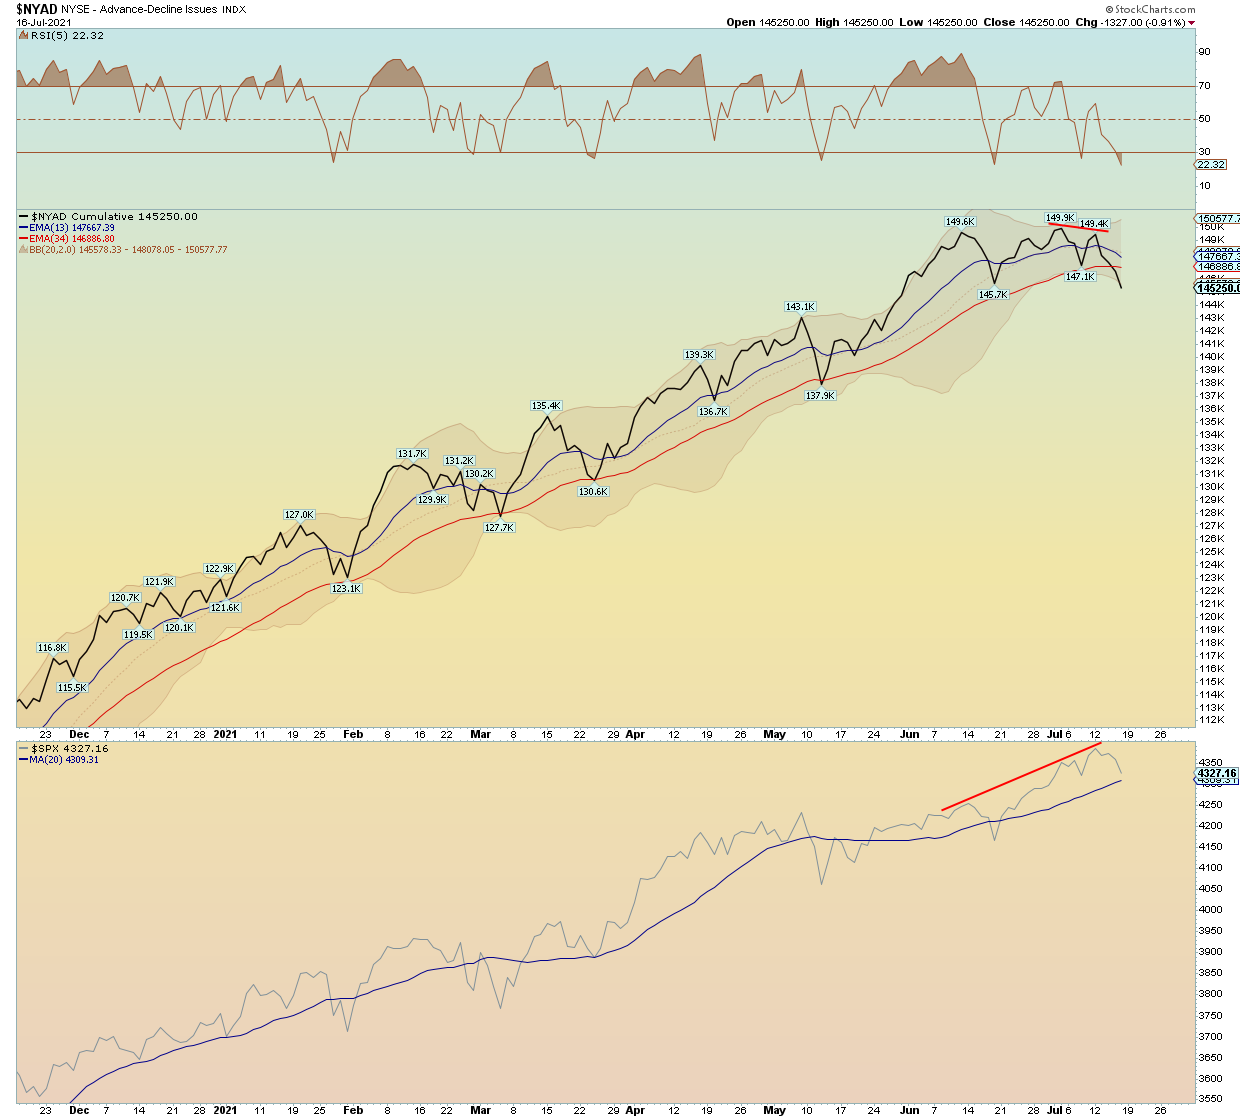
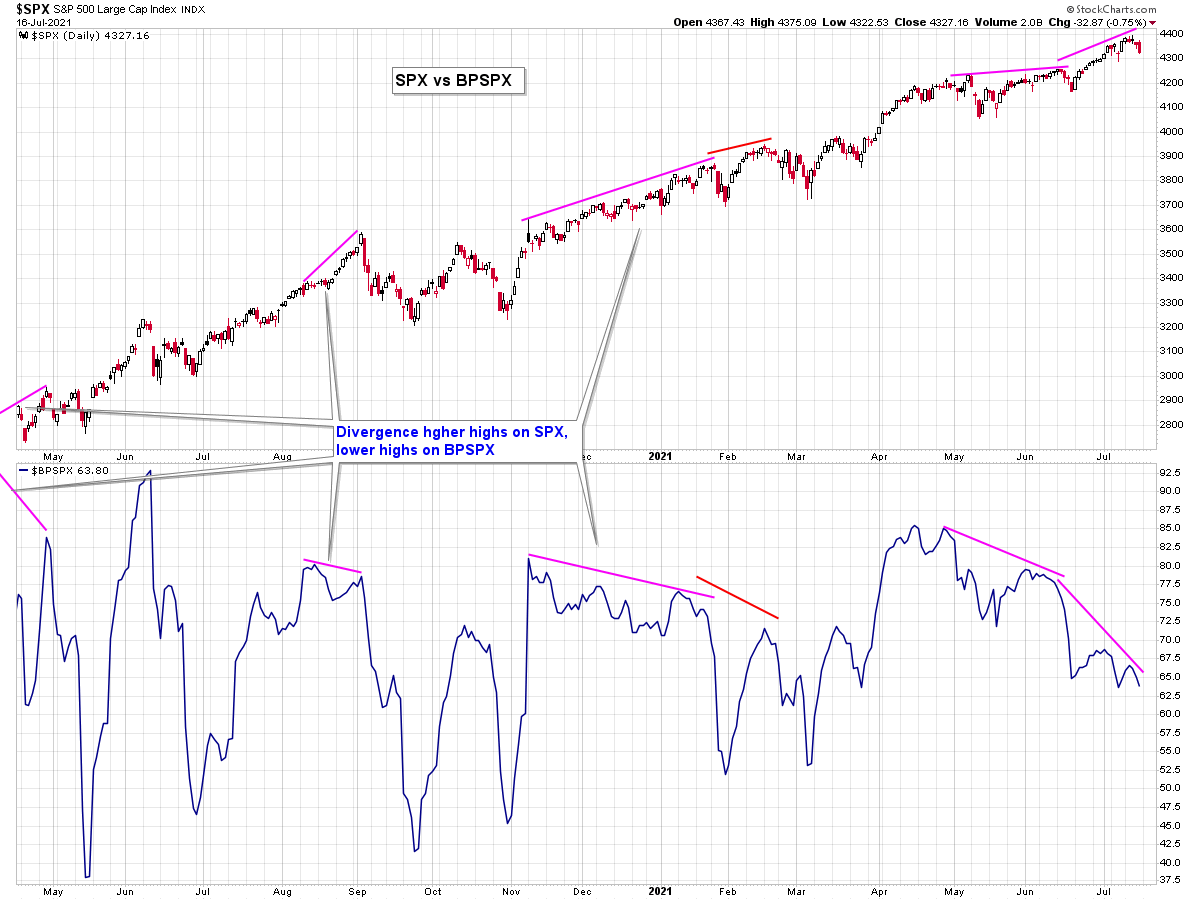
Earnings season started last week, however it's this week when the big well known names start to report and continues in earnest into August. Just to name a few: (NFLX on the 20th, MSFT and TSLA on the 21st, AAPL and GOOG on the 27th, FB on 28th, AMZN 29th). Historically the market has generally held up during earning season and quite honestly if we were not in earning season I would be saying run for the hills! From the drought of good long setups from my scans for the past 2 weeks, the negative breadth, the glaring divergences in various indicators etc it's not surprising from the lack of good long setups and our overall cautionary tone. For example, the percentage of stocks in the S&P 500 that are above their respective 50 day MA is only at 48%. Also, Tom McClellan a well known market technician recently said he's on the verge of swinging bearish (we personally use many of his McClellan type Oscillator indicators). We also continue to see increased inflation, and some recent concern about rising Covid variants and possible lockdowns again. That said, the way I discuss all these things you would think that the market indexes would be way off their highs and down trending right? That's only the case for the Russell 2000 IWM ETF, which is well below its 50 day MA now and not too far away from its 200 day MA. The Dow Jones for examples is only 1 day off its highs, and the SPX 500 and Nasdaq are still above their respective 20 day MA's.
We'll see how the market reacts this week and the next two weeks - my thought is that if the market only has a modest sideways bounce over the next two weeks, that it will setup for a possible larger sell off afterwards. If the market can have a strong positive price reaction to earnings along with positive breadth, then these divergences can be erased.
2

3
| Major Indexes | Index Symbol | ETF Symbol | % G / L Day | % G / L Week | Close |
|---|---|---|---|---|---|
| Dow Jones | INDU - W | DIA - W | -0.86% | -0.52% | 34,687.85 |
| S&P 500 | SPX - W | SPY - W | -0.75% | -0.97% | 4,327.16 |
| Wilshire 5000 | WLSH - W | -0.72% | -1.67% | 44,920.29 | |
| Nasdaq | COMPQ - W | -0.80% | -1.87% | 14,427.24 | |
| NDX 100 | NDX - W | QQQ - W | -0.77% | -0.98% | 14,681.38 |
| Russel 2000 (Small Caps) | IWM - W | -1.23% | -5.05% | 214.95 |
| Market Sectors | Index Symbol | ETF Symbol | % G / L Day | % G / L Week | Close |
|---|---|---|---|---|---|
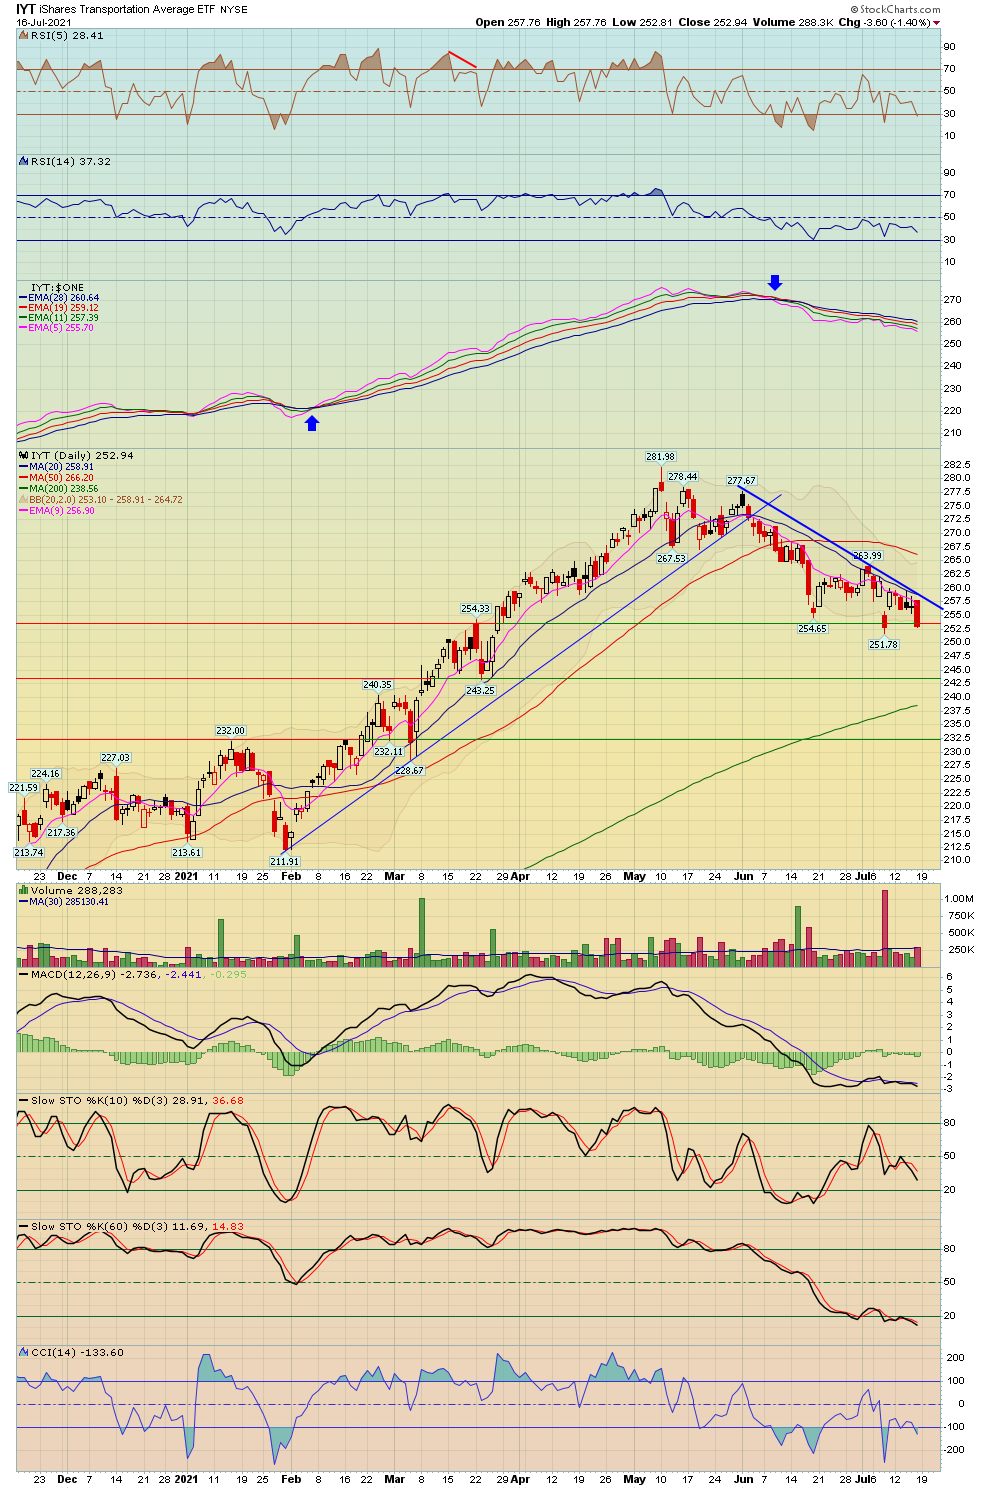
| Transports | TRAN - W | IYT - W | -1.39% | -2.36% | 14,491.91 |
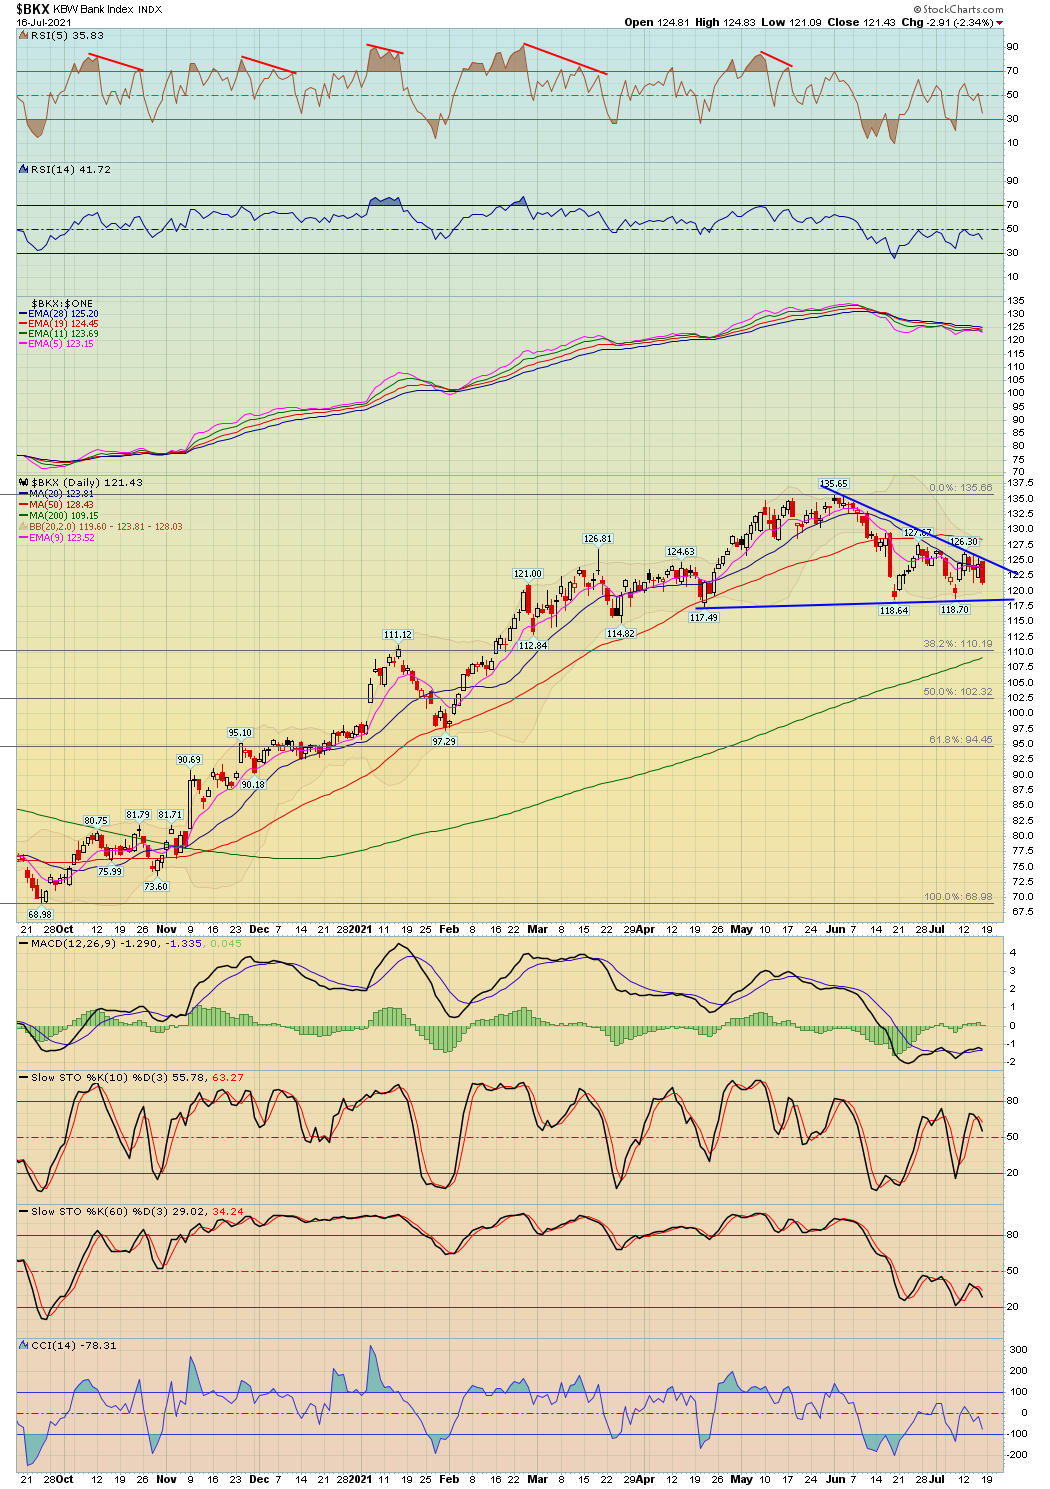
| Banks | BKX - W | -2.34% | -2.43% | 121.43 | |
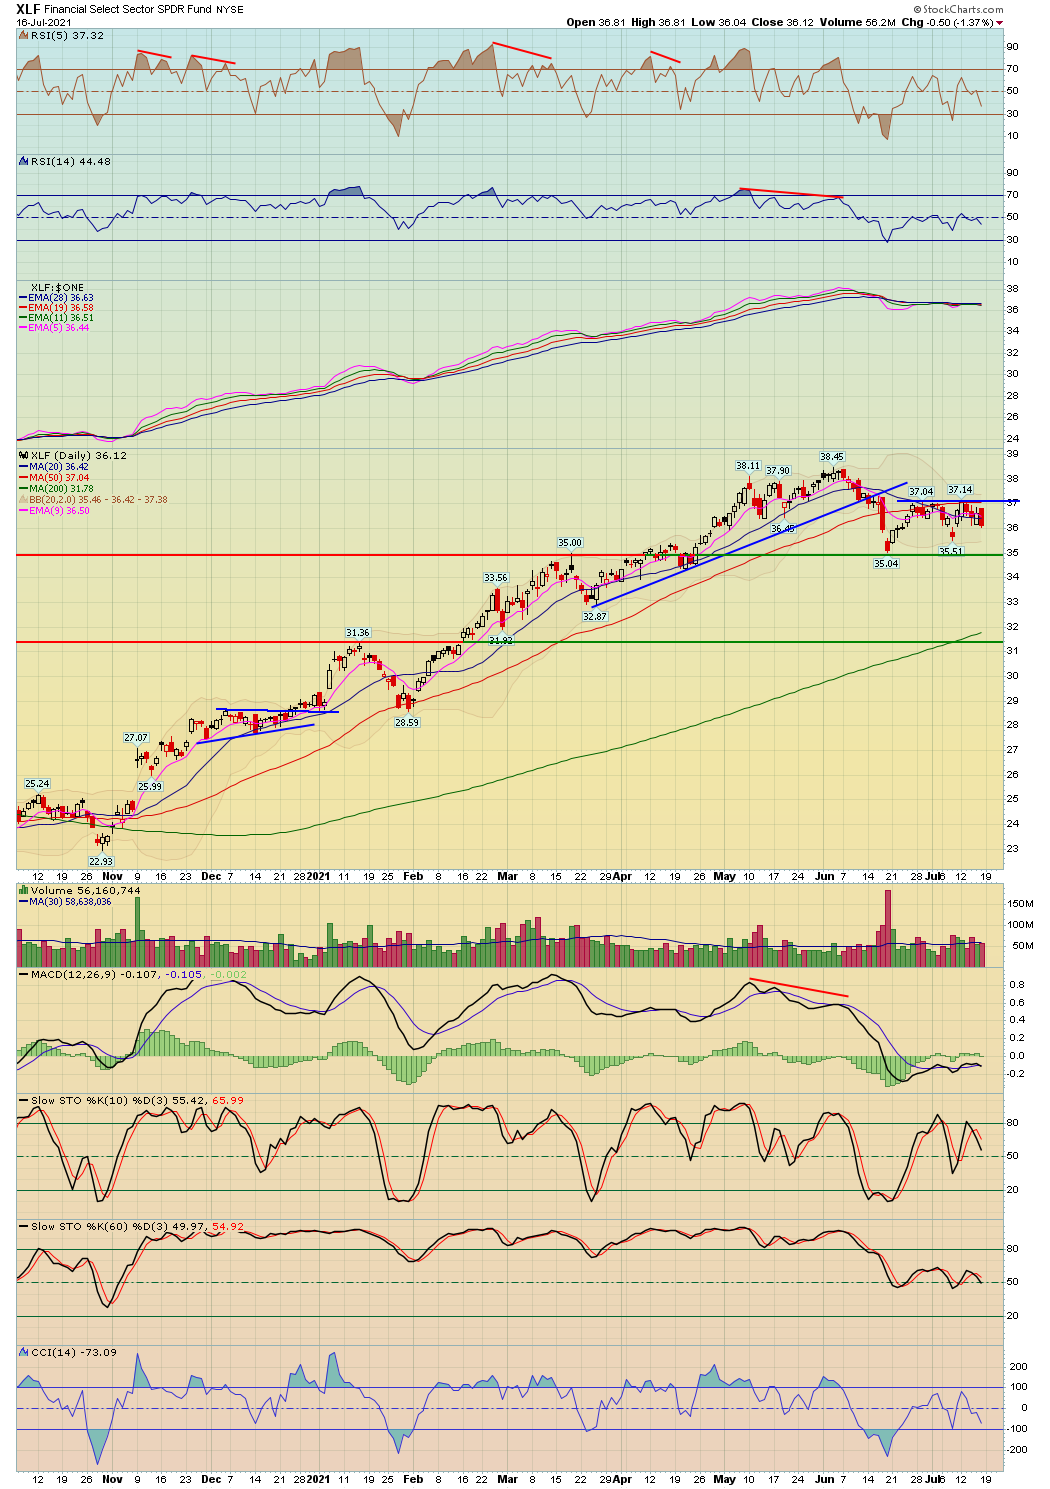
| Financials | XLF - W | -1.37% | -1.61% | 36.12 | |
| Brokers | XBD - W | -1.05% | -2.01% | 454.11 | |
| XLE (Energy Select) | XLE - W | -2.83% | -7.89% | 48.68 | |
| Oil Service Holders | OIH - W | -2.69% | -11.36% | 189.35 | |
| Technology | XLK - W | -0.99% | -0.60% | 150.30 | |
| Semiconductor | SOX - W | SMH - W | -2.25% | -4.06% | 3,145.45 |
| Communication Services | XLC - W | -0.63% | -0.96% | 80.86 | |
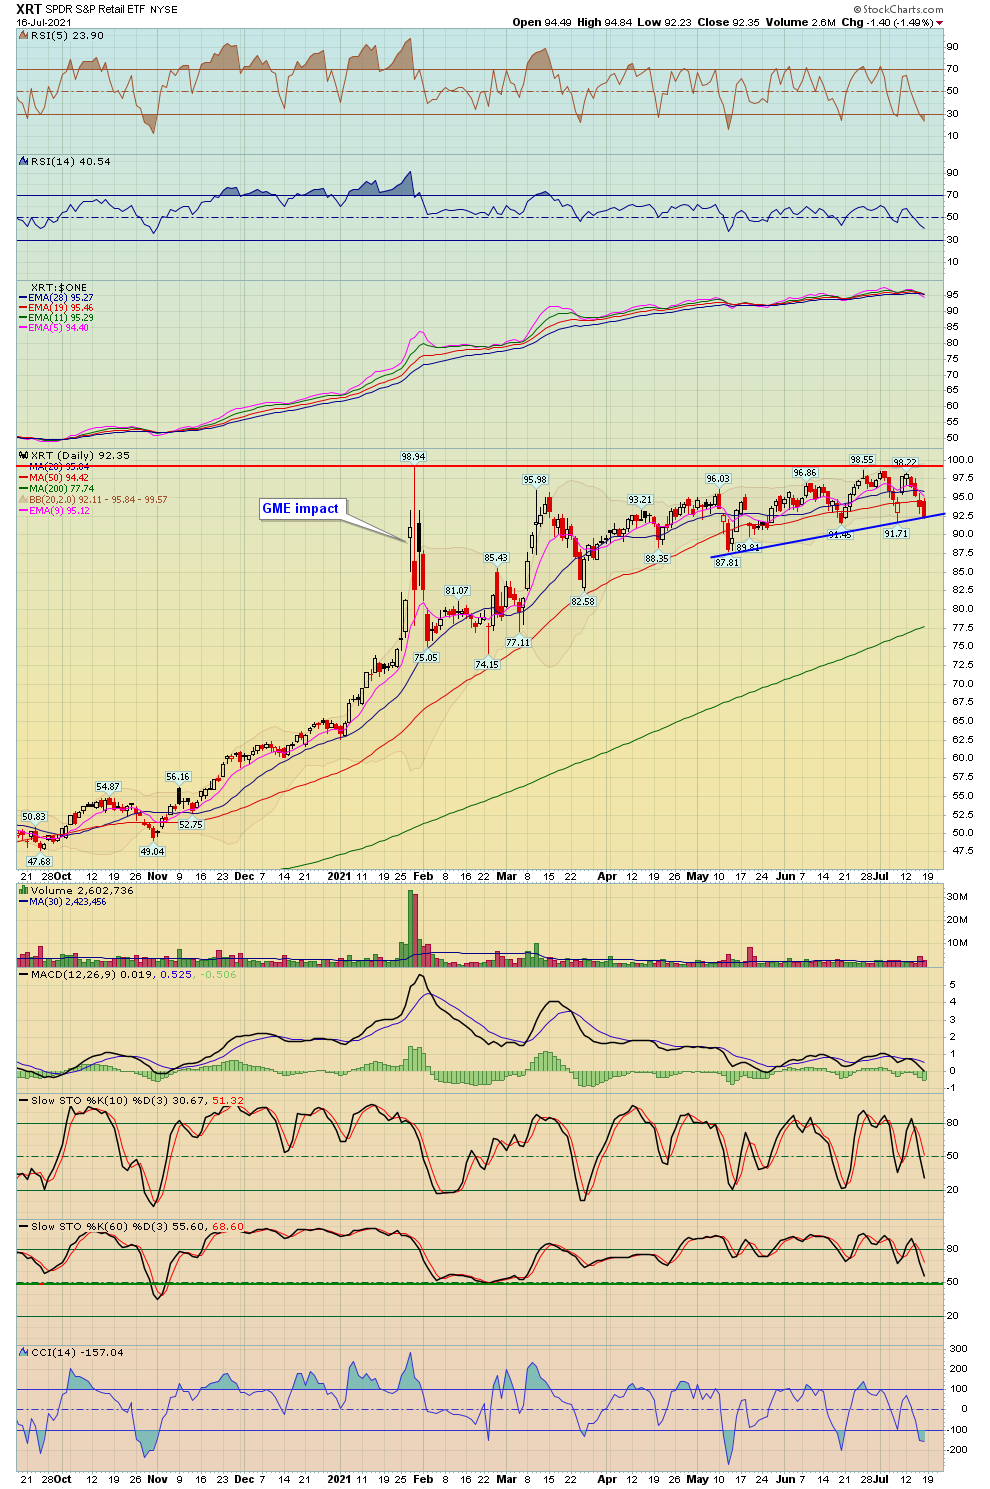
| Retail | XRT - W | -1.49% | -5.63% | 92.35 | |
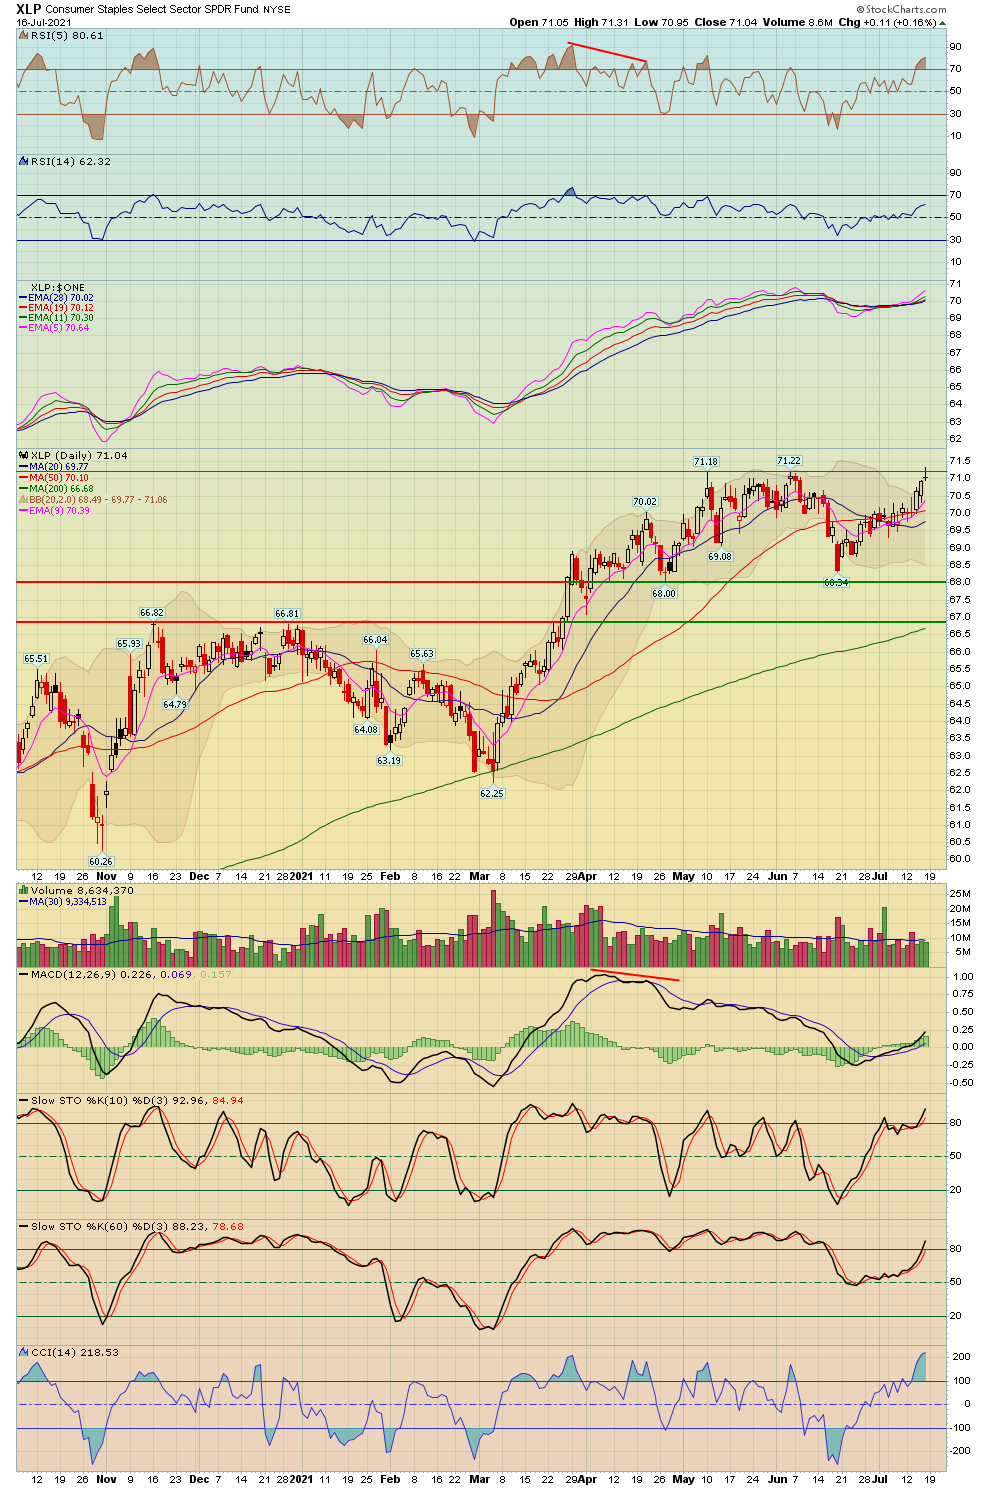
| Consumer Staples | XLP - W | 0.16% | 1.27% | 71.04 | |
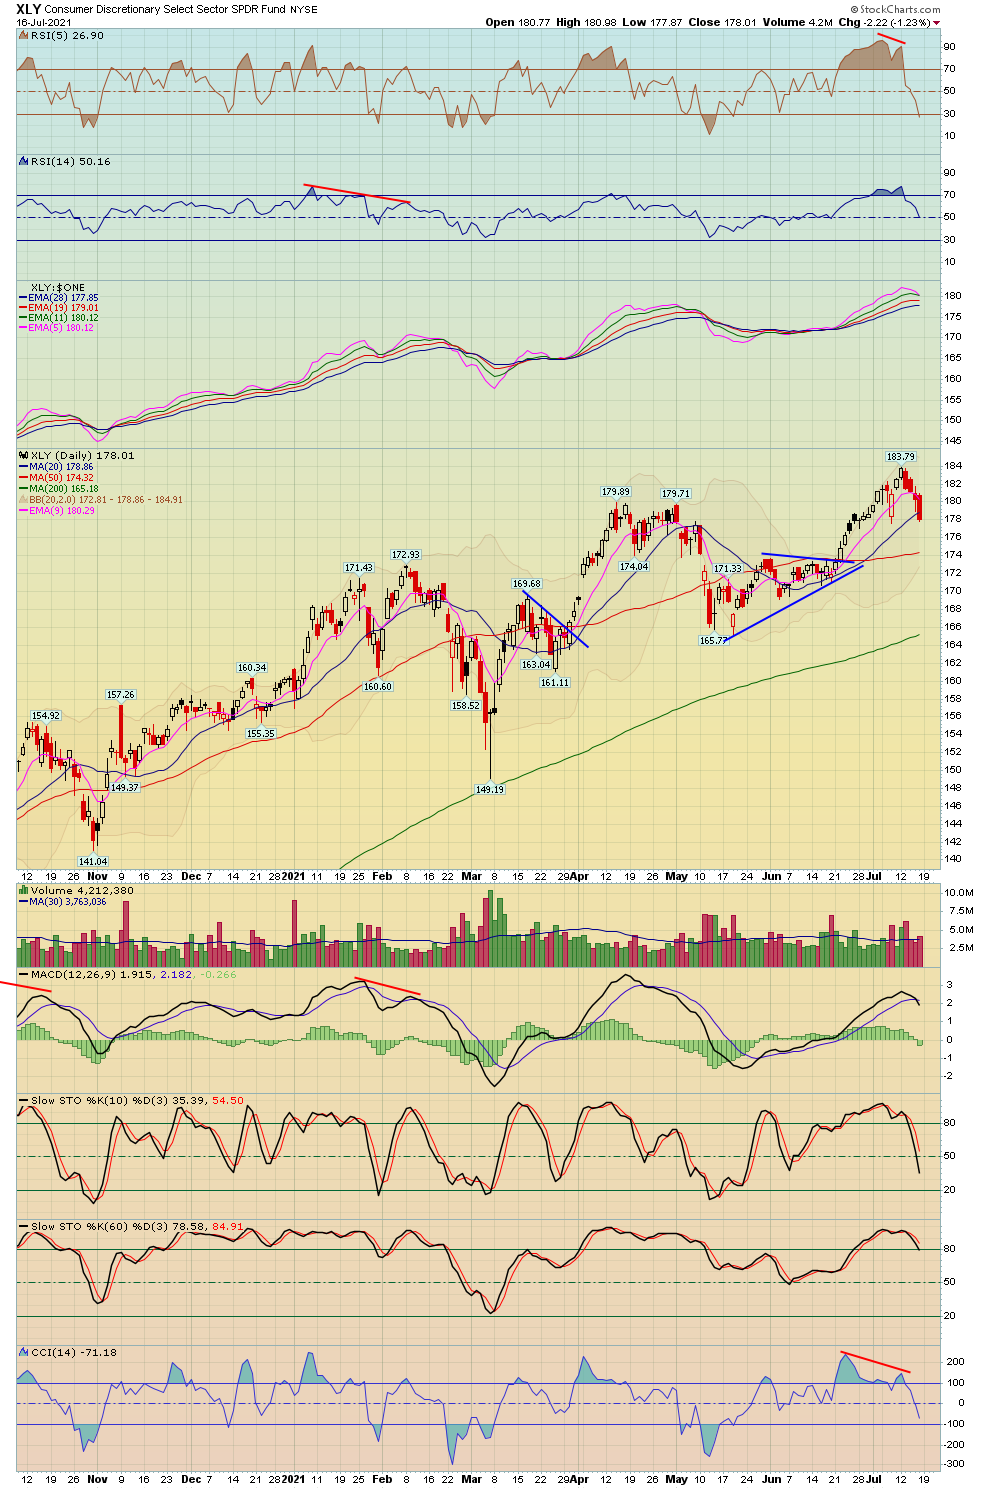
| Consumer Discretionary | XLY - W | -1.23% | -2.45% | 178.01 | |
| Industrials | XLI - W | -0.89% | -1.53% | 101.91 | |
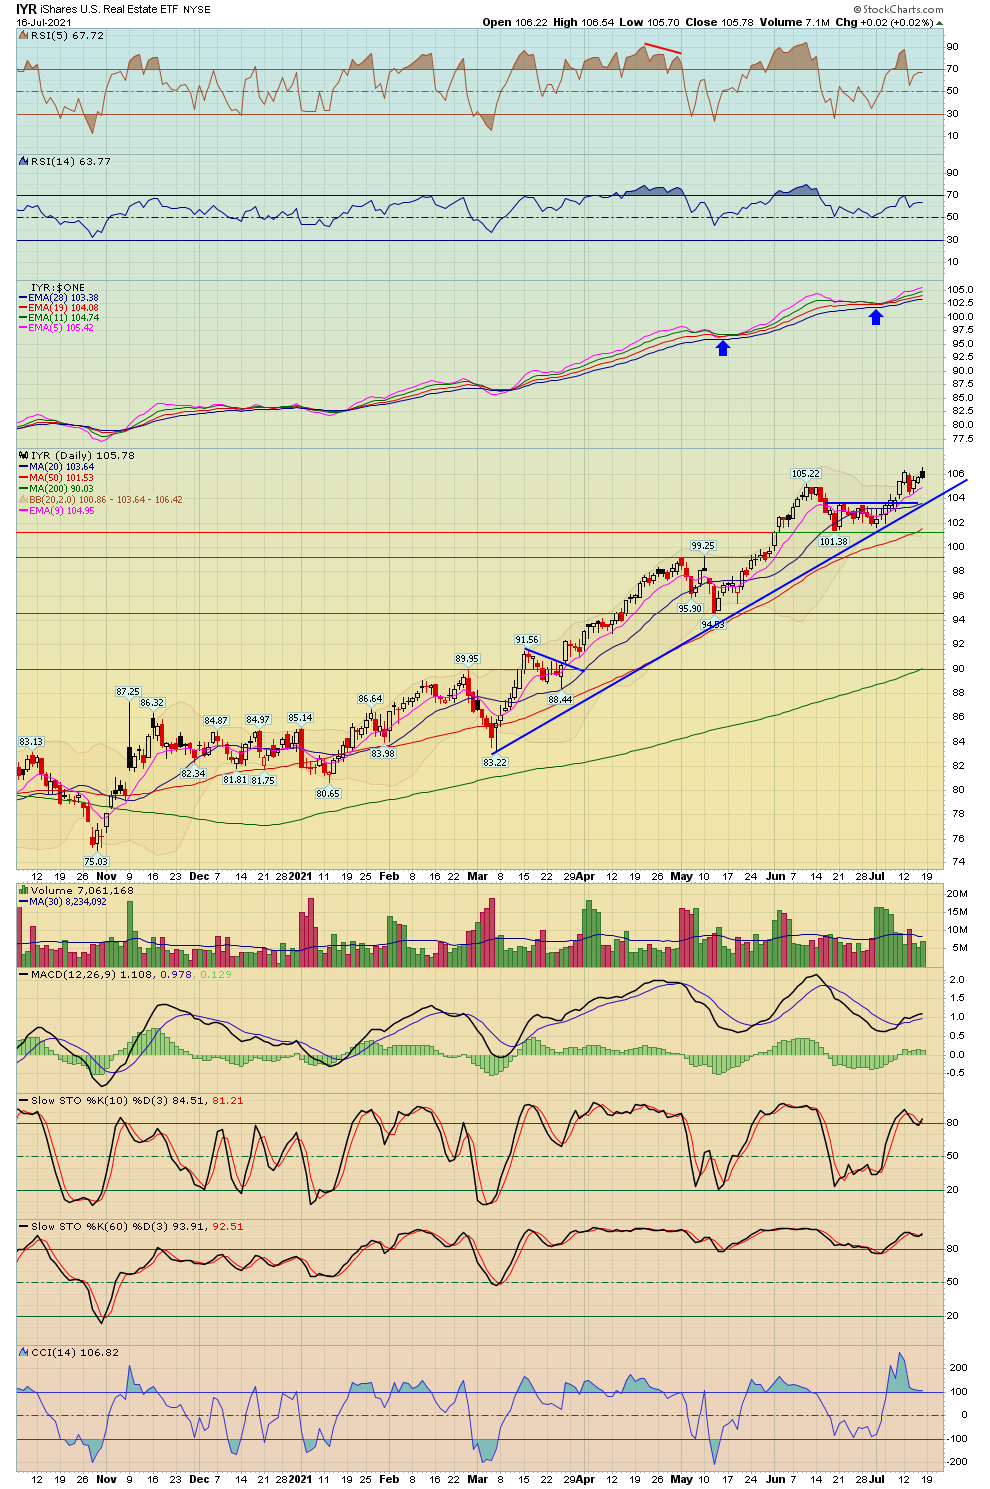
| Real Estate | IYR - W | 0.02% | 0.36% | 105.78 | |
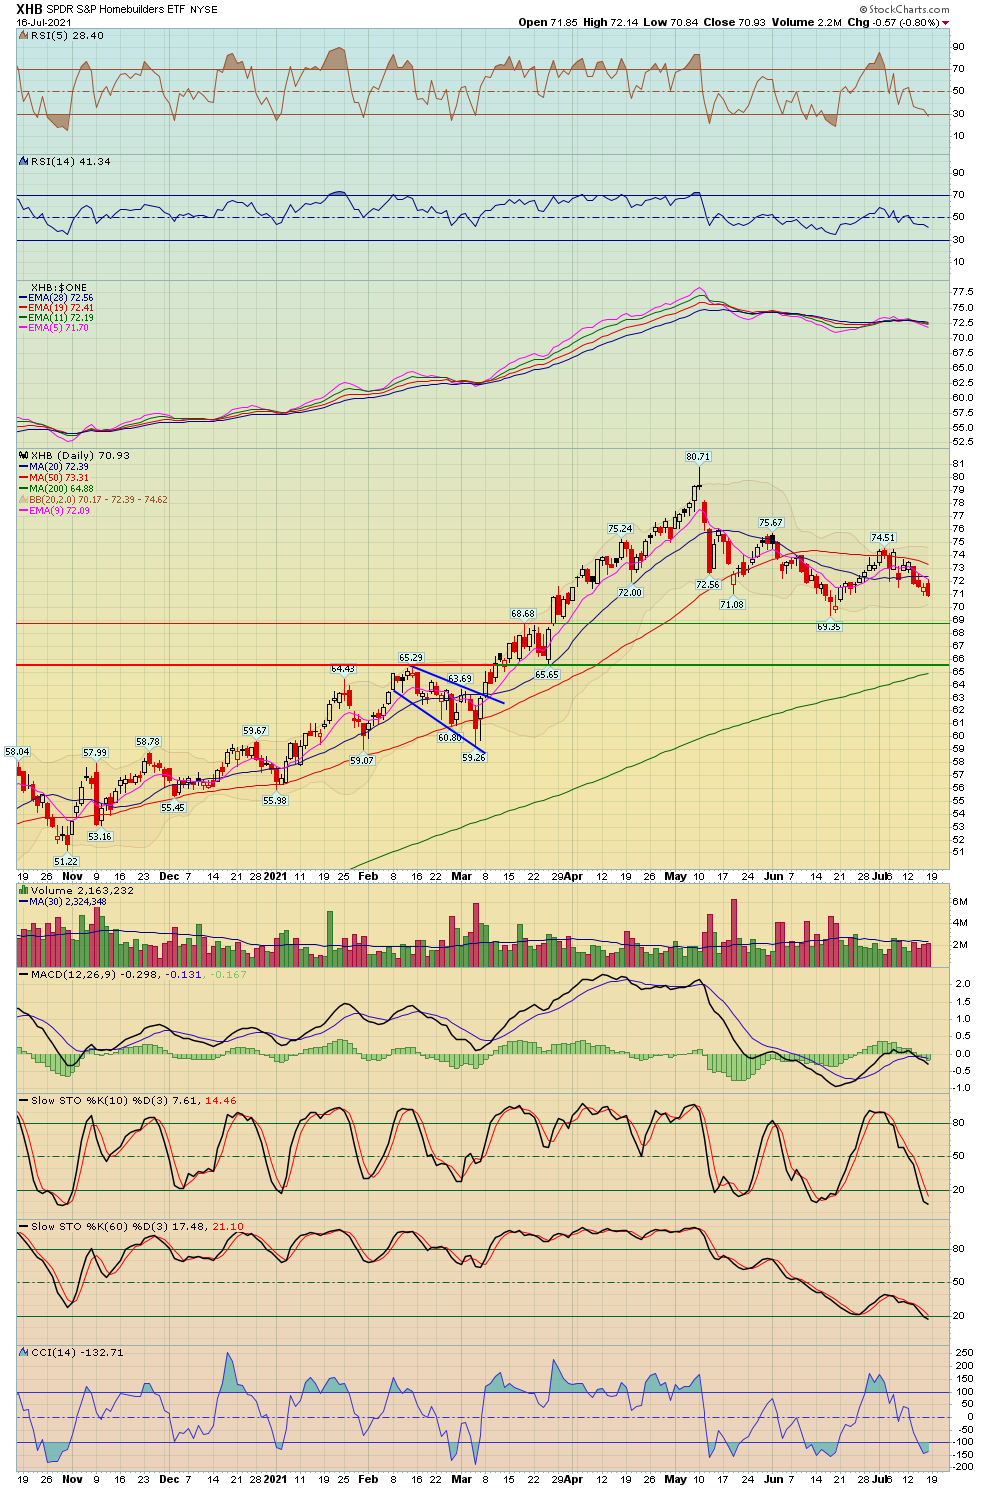
| Homebuilders | HGX - W | XHB - W | -0.86% | -3.39% | 453.77 |
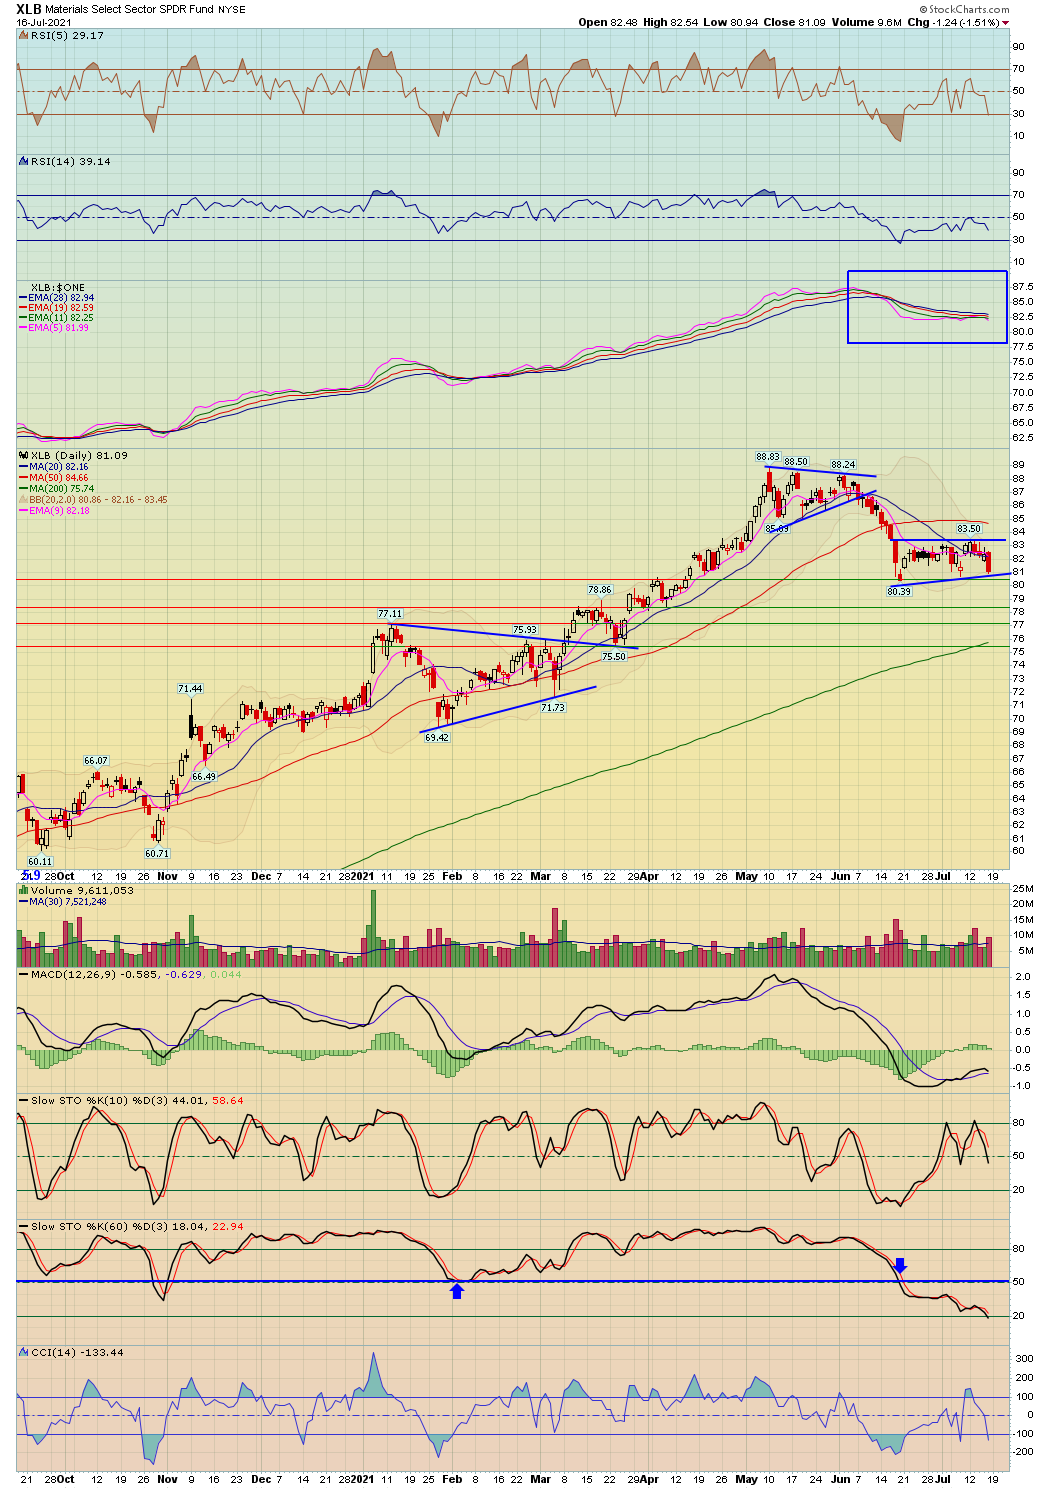
| Materials | XLB - W | -1.51% | -2.28% | 81.09 | |
| Metals And Mining | XME - W | -3.80% | -6.62% | 40.76 | |
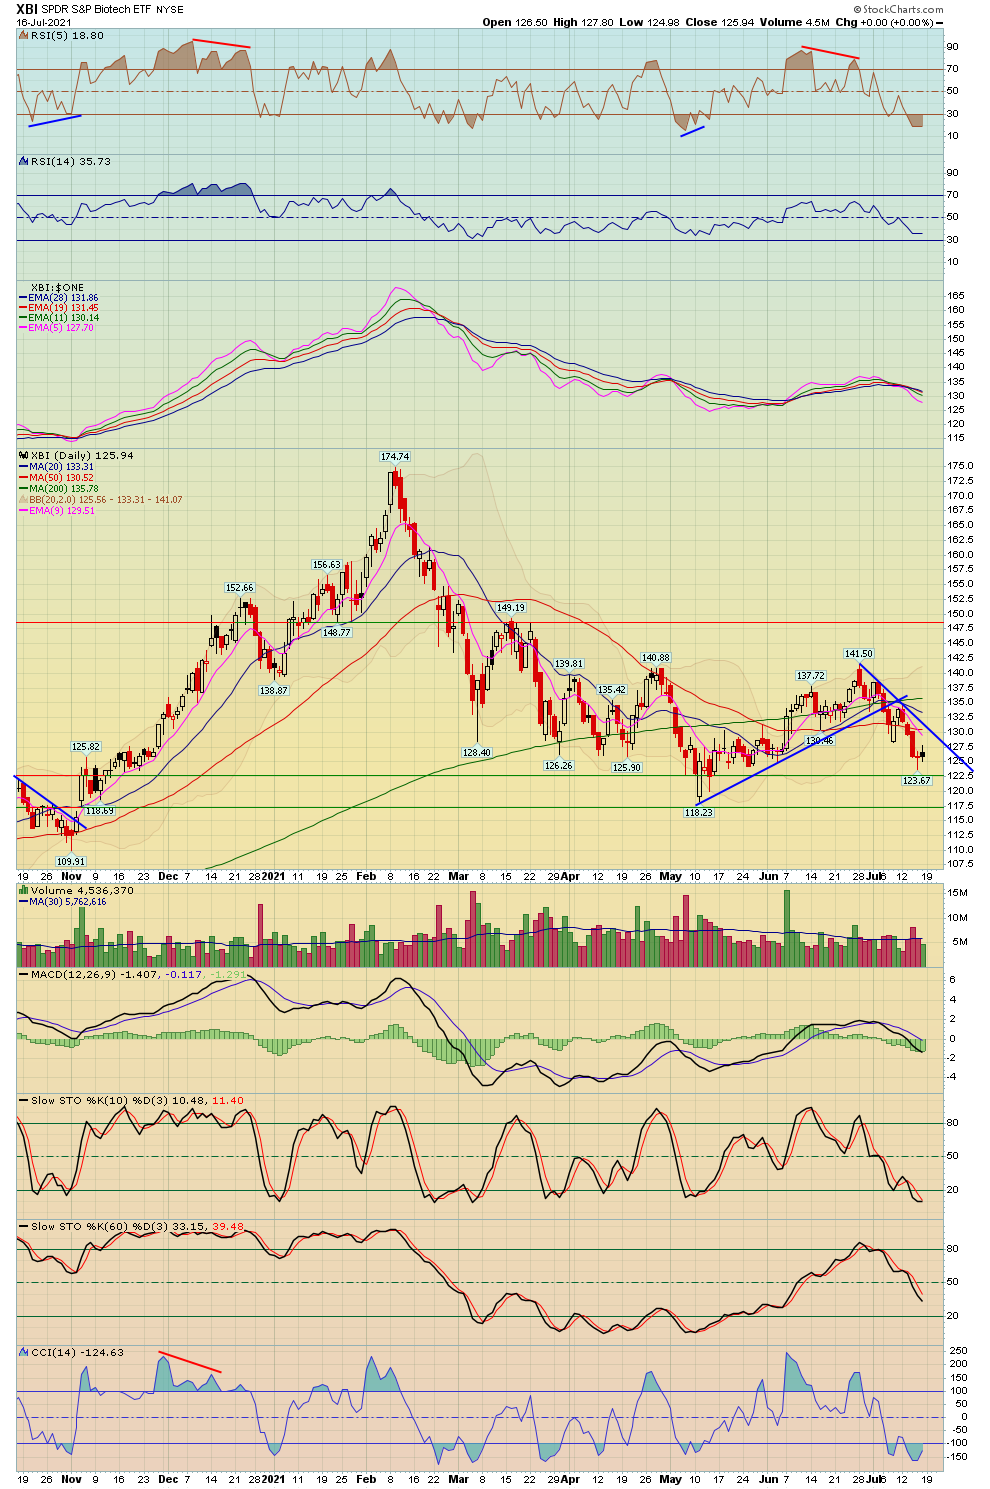
| Biotechnology | BTK - W | XBI - W | -1.12% | -4.29% | 5,658.75 |
| Healthcare | XLV - W | 0.27% | -0.07% | 128.62 | |
| Drugs | DRG - W | 0.25% | -0.51% | 753.40 | |
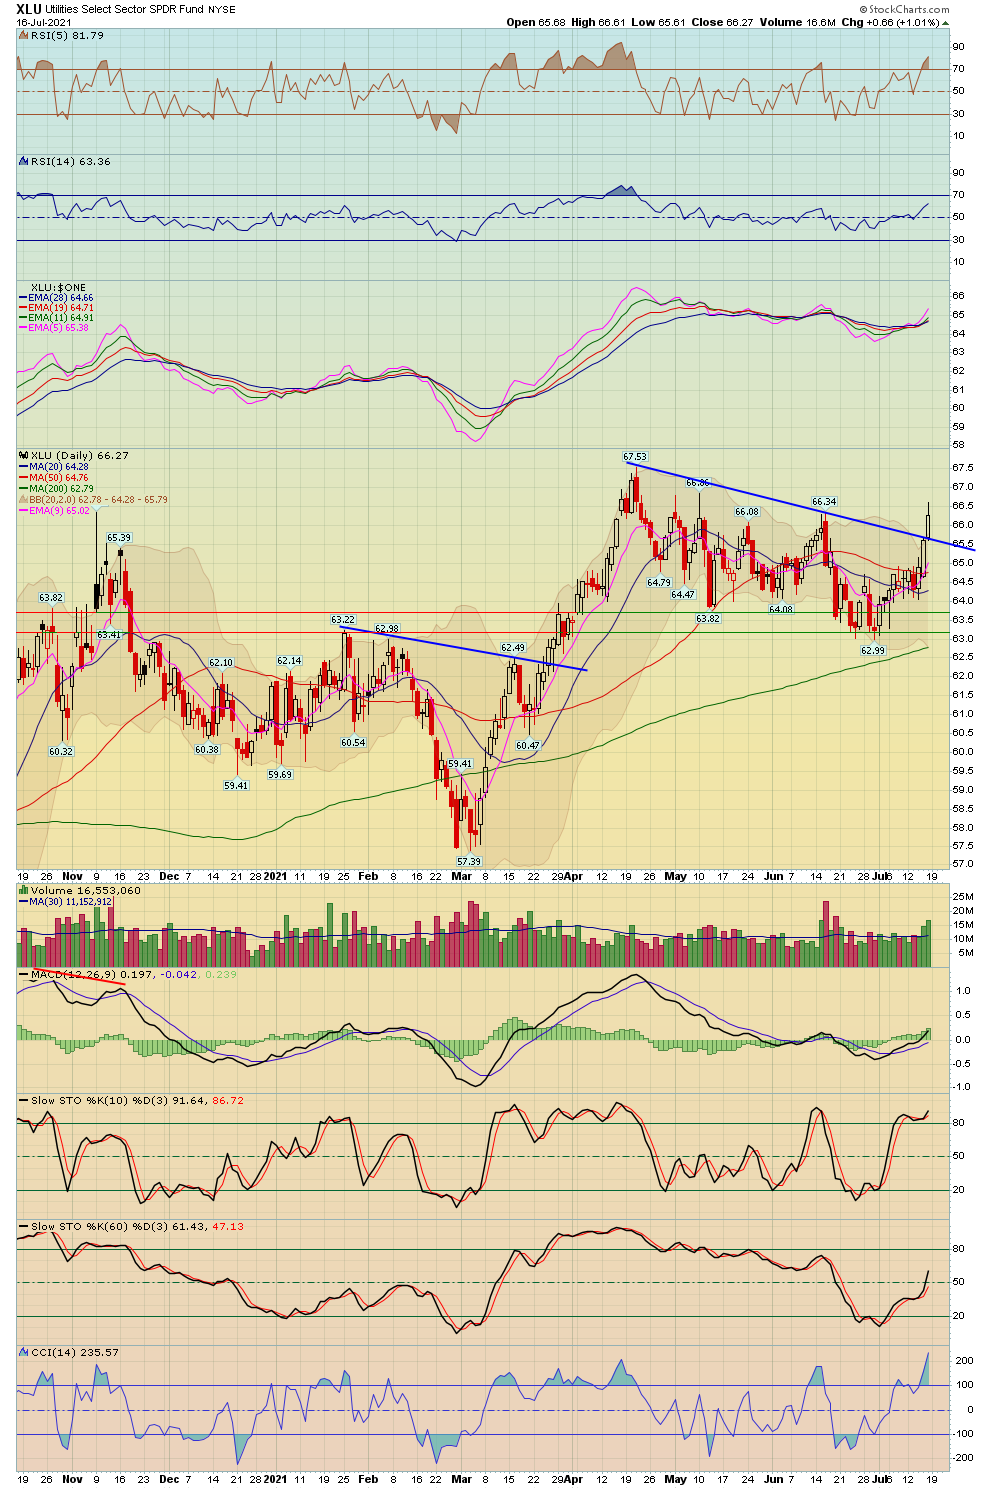
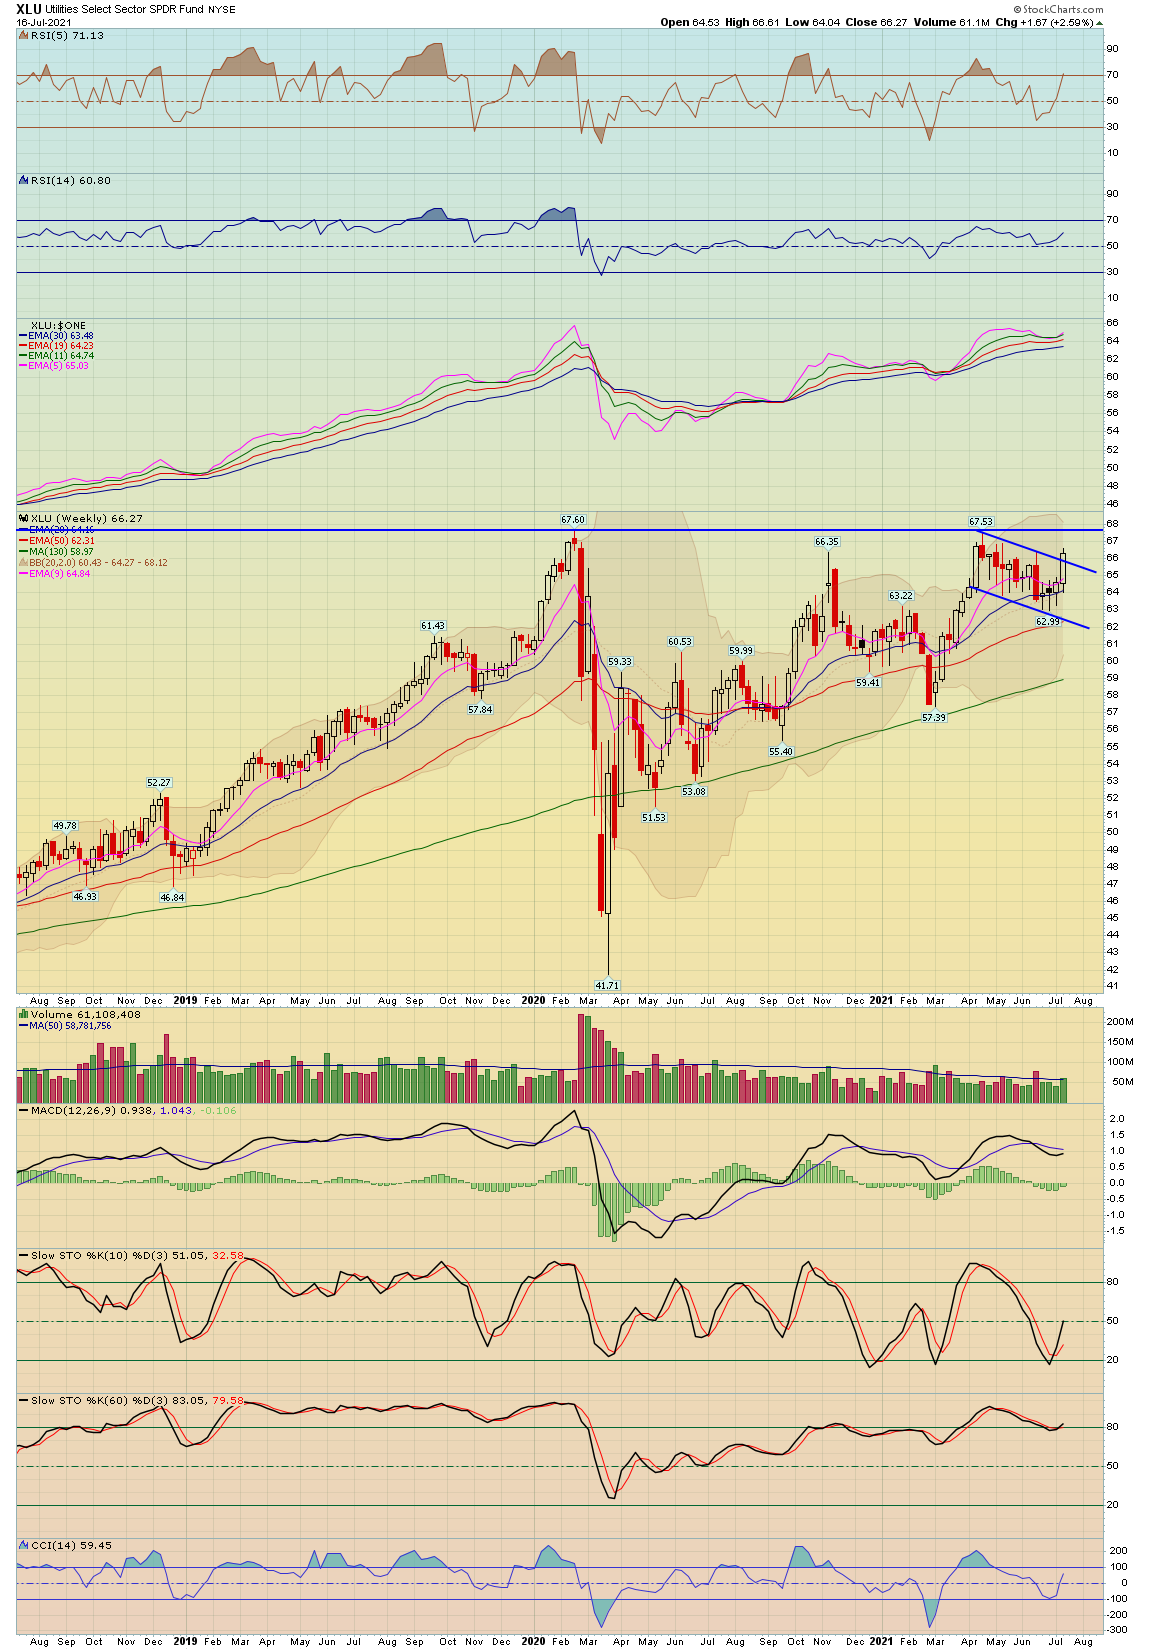
| Utilities | UTIL - W | XLU - W | 0.87% | 2.28% | 914.61 |
| Currencies | Index Symbol | ETF Symbol | % G / L Day | % G / L Week | Close |
|---|---|---|---|---|---|
| US Dollar | UUP - W | 0.12% | 0.65% | 24.93 | |
| Euro | XEU - W | FXE - W | -0.08% | -0.65% | 118.05 |
| Yen | XJY - W | FXY - W | -0.19% | 0.03% | 90.85 |
| Australian | XAD - W | FXA - W | -0.36% | -1.20% | 74.01 |
| British Pound | XBP - W | FXB - W | -0.48% | -1.10% | 137.63 |
| Chinese Yuan | CYB - W | -0.18% | 0.31% | 27.74 | |
| Canadian Dollar | CDW - W | FXC - W | -0.19% | -1.35% | 79.27 |
| Swiss Franc | XSF - W | FXF - W | -0.18% | -0.61% | 108.77 |
| Commodities | Index Symbol | ETF Symbol | % G / L Day | % G / L Week | Close |
|---|---|---|---|---|---|
| Bitcoin | BTCUSD - W | 0.30% | -7.11% | 31,814.01 | |
| Bitcoin Cash | BCHUSD - W | -1.97% | -10.99% | 443.26 | |
| Etherium | ETHUSD - W | -0.82% | -11.25% | 1,899.70 | |
| Monero | XMRUSD - W | 1.15% | -8.02% | 194.72 | |
| Litecoin | LTCUSD - W | -1.48% | -7.91% | 123.57 | |
| Ripple | XRPUSD - W | -0.73% | -6.26% | 0.60 |
| Precious Metals | Index Symbol | ETF Symbol | % G / L Day | % G / L Week | Close |
|---|---|---|---|---|---|
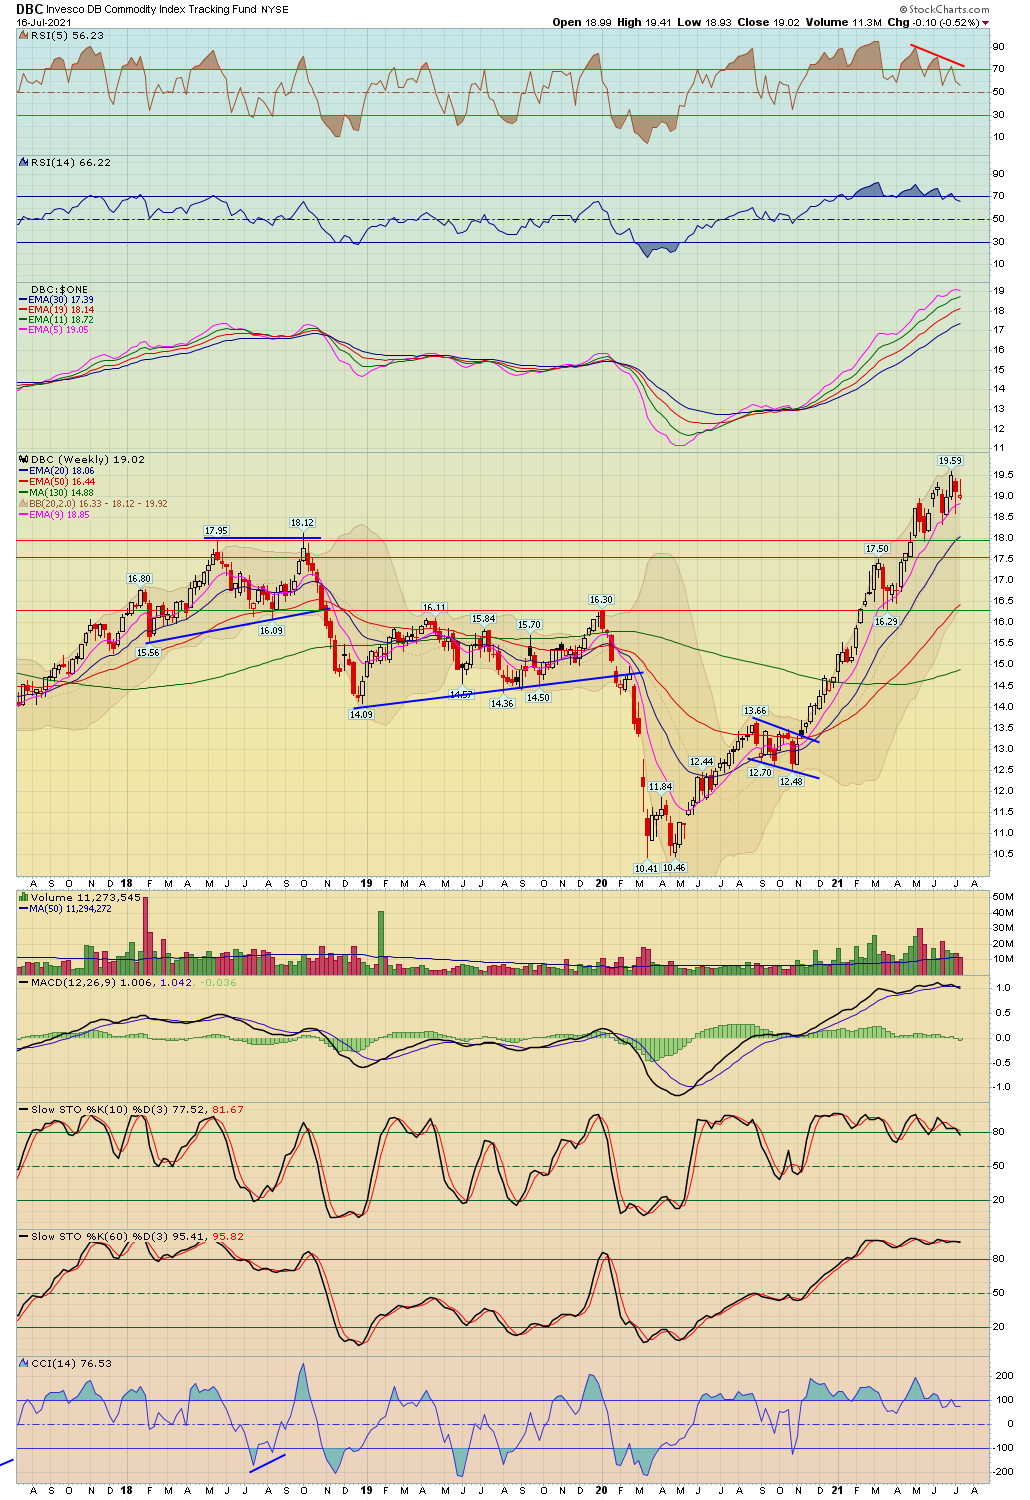
| Commodities | DBC - W | 0.00% | -0.52% | 19.02 | |
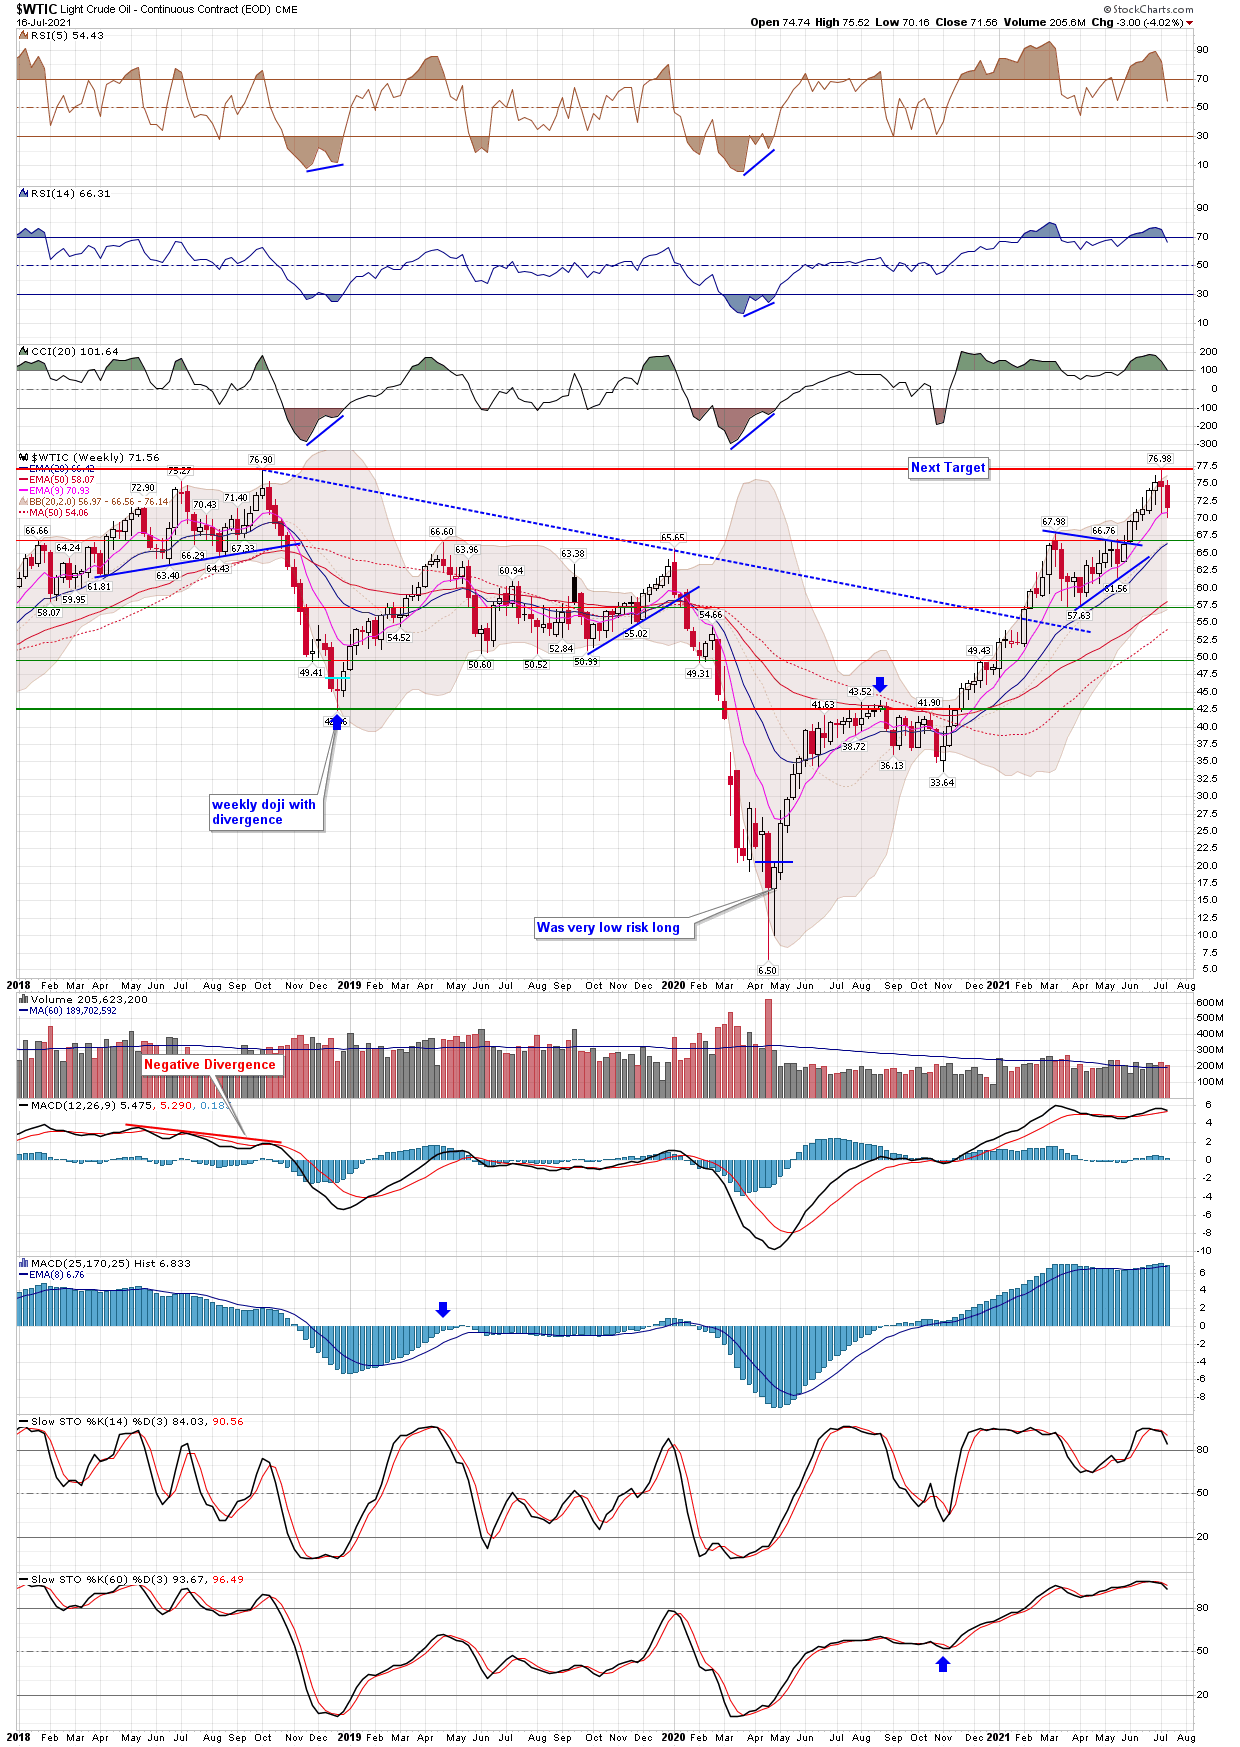
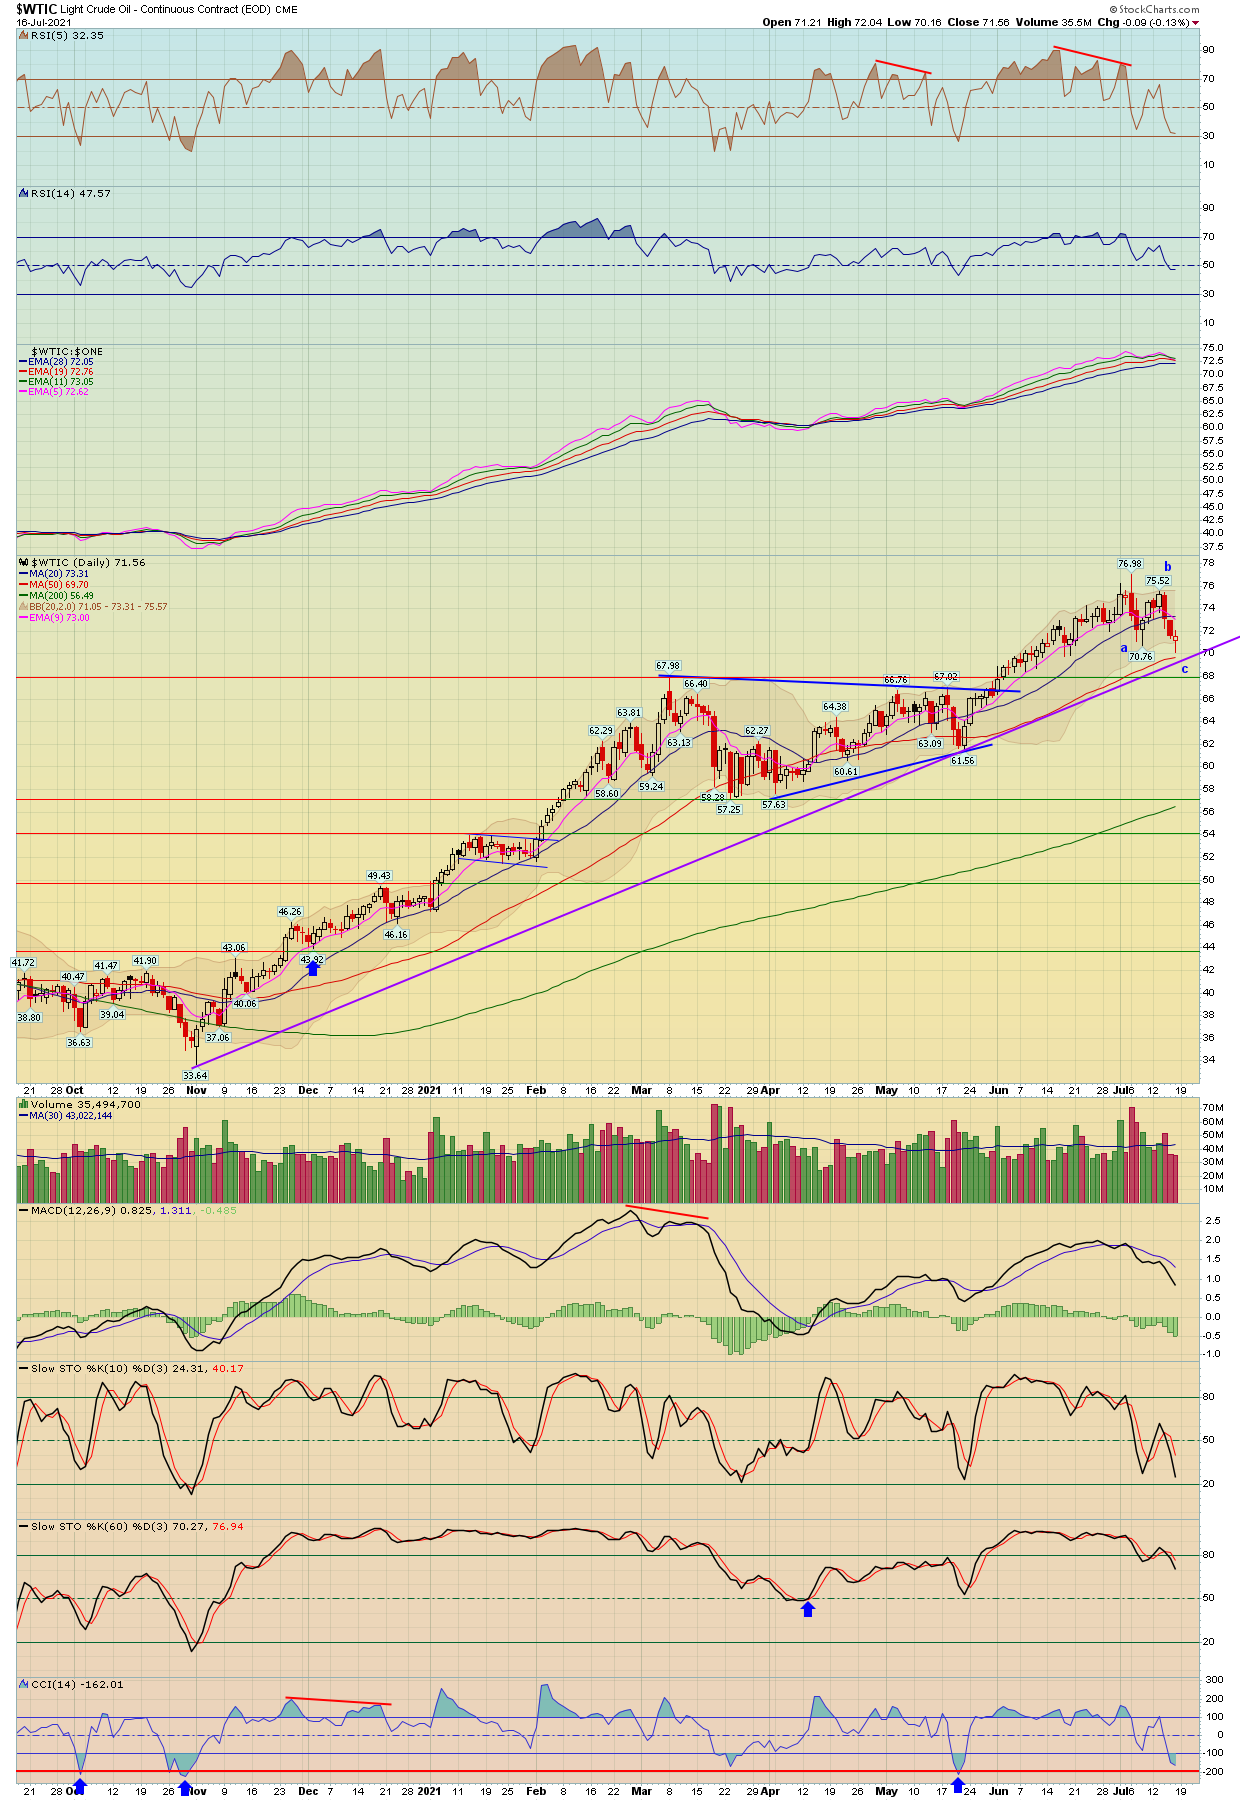
| Crude Oil | WTIC - W | USO - W | -0.13% | -4.02% | 71.56 |
| Gasoline | GASO - W | 0.12% | -2.51% | 2.23 | |
| Natural Gas | NATGAS - W | UNG - W | 1.50% | 0.11% | 3.66 |
| Copper | COPPER - W | JJCB - W | 0.00% | -0.52% | 4.32 |
| Agriculture | DBA - W | 0.27% | 3.73% | 18.37 | |
| Corn | CORN - W | CORN - W | -0.76% | 6.77% | 552.00 |
| Wheat | WHEAT - W | WEAT - W | 3.05% | 12.60% | 692.50 |
| Coffee | JO - W | 2.46% | 7.03% | 45.20 | |
| Sugar | CANE - W | 0.89% | 1.49% | 8.46 |
| Precious Metals | Index Symbol | ETF Symbol | % G / L Day | % G / L Week | Close |
|---|---|---|---|---|---|
| Gold Metal | GLD - W | -0.97% | 0.12% | 169.41 | |
| Silver | SLV - W | -2.50% | -1.74% | 23.77 | |
| Platinum | PPLT - W | -3.66% | -0.24% | 102.51 | |
| Palladium | PALL - W | -4.08% | -6.84% | 244.88 | |
| GDX Gold Miners ETF | GDX - W | -3.00% | -1.31% | 33.92 |
| Bonds | Index Symbol | ETF Symbol | % G / L Day | % G / L Week | Close |
|---|---|---|---|---|---|
| High Yield Corporate Bond | HYG - W | -0.14% | -0.37% | 87.67 | |
| TLT 20 Year Bond ETF | TLT - W | -0.19% | 1.15% | 148.21 | |
| 10 Year Treasury Yield | TNX - W | 0.23% | -4.13% | 13.00 | |
| 30 Year Treasury Yield | TYX - W | 0.57% | -2.57% | 19.31 |
4
| Release | ET | For | Trading Impact | Forecast | Consensus | Prior |
|---|---|---|---|---|---|---|
| Jul 19 | ||||||
| NAHB Housing Market Index | 10:00 | Jul | Medium | 80 | 82 | 81 |
| Jul 20 | ||||||
| Housing Starts | 08:30 | Jun | High | 1580K | 1600K | 1572K |
| Building Permits | 08:30 | Jun | High | 1690K | 1700K | 1681K |
| Jul 21 | ||||||
| MBA Mortgage Applications Index | 07:00 | 07/17 | Low | NA | NA | 16.0% |
| EIA Crude Oil Inventories | 10:30 | 07/17 | High | NA | NA | -7.90M |
| Jul 22 | ||||||
| Initial Claims | 08:30 | 07/17 | High | 355K | 360K | 360K |
| Continuing Claims | 08:30 | 07/10 | High | NA | NA | 3.241M |
| Existing Home Sales | 10:00 | Jun | High | 5.90M | 5.90M | 5.80M |
| Leading Indicators | 10:00 | Jun | Low | 1.0% | 0.9% | 1.3% |
| EIA Natural Gas Inventories | 10:30 | 07/17 | Low | NA | NA | +55 bcf |
| Jul 23 | ||||||
| IHS Markit Manufacturing - Prelim | 09:45 | Jul | Low | NA | NA | 62.1 |
| IHS Markit Services PMI - Prelim | 09:45 | Jul | Low | NA | NA | 64.6 |
Stock Earnings Calender:
Click here for a list of Stocks that are reporting Earnings
**Generally we never hold a position into earnings since the risk/reward is too great
5 - View Live Chart

6 - View Live Chart
7 - View Live Chart

8 - View Live Chart
9 - View Live Chart

10 - View Live Chart

11 - View Live Chart

12
13
14 - View Live Chart

15 - View Live Chart
16 - View Live Chart

17
18
19
20 - View Live Chart

21 - View Live Chart

22 - View Live Chart
23 - View Live Chart
24 - View Live Chart

25 - View Live Chart

26 - View Live Chart
27 - View Live Chart

28

29
30
31
32 - View Live Chart
33
34 - View Live Chart

35 - View Live Chart
36 - View Live Chart

37 - View Live Chart

38 - View Live Chart
39 - View Live Chart
40 - View Live Chart

41 - View Live Chart

42 - View Live Chart
43 - View Live Chart

44 - View Live Chart
45 - View Live Chart
46 - View Live Chart
47 - View Live Chart

48 - View Live Chart

49 - View Live Chart

50 - View Live Chart
51 - View Live Chart
52 - View Live Chart

53 - View Live Chart
54 - View Live Chart
55 - View Live Chart
56 - View Live Chart
57 - View Live Chart

58 - View Live Chart
59 - View Live Chart
60 - View Live Chart
61 - View Live Chart

62 - View Live Chart

63 - View Live Chart
64 - View Live Chart

65 - View Live Chart

66 - View Live Chart
67 - View Live Chart
68 - View Live Chart
69 - View Live Chart
70 - View Live Chart
71 - View Live Chart
72 - View Live Chart
73 - View Live Chart
74 - View Live Chart

75 - View Live Chart

76 - View Live Chart
77 - View Live Chart

78 - View Live Chart
79 - View Live Chart
80 - View Live Chart
81 - View Live Chart

82 - View Live Chart
83 - View Live Chart
84 - View Live Chart
85 - View Live Chart
86 - View Live Chart

87 - View Live Chart
88 - View Live Chart

89 - View Live Chart
90 - View Live Chart

91 - View Live Chart
92 - View Live Chart
93 - View Live Chart
94 - View Live Chart
95 - View Live Chart

96 - View Live Chart
97 - View Live Chart
98 - View Live Chart
99 - View Live Chart
100 - View Live Chart
101 - View Live Chart
102 - View Live Chart
103 - View Live Chart
104 - View Live Chart

105 - View Live Chart
106 - View Live Chart
107 - View Live Chart
108 - View Live Chart
109 - View Live Chart
110 - View Live Chart
111 - View Live Chart
112 - View Live Chart

113 - View Live Chart
114 - View Live Chart
115 - View Live Chart

116 - View Live Chart

117 - View Live Chart

118 - View Live Chart

119 - View Live Chart
120 - View Live Chart
121 - View Live Chart

122 - View Live Chart
123 - View Live Chart
124 - View Live Chart
125 - View Live Chart
126 - View Live Chart
- Hide Player Link to Newsletter Audio
- Hide Player Link to Newsletter Audio
- Hide Player Link to Newsletter Audio