BPT Weekend Newsletter for Sunday April 11th, 2021 - free
Disclaimer: Intraday Chart Links will show up as daily charts unless you have an active stockcharts.com membership and are signed in, you can sign up here.
1
Table of Contents:
First off I hope everyone had a nice weekend so far and is having a good Sunday afternoon.
This is an audio based newsletter, therefore please listen to my comments and observations during my audio discussion, therefore I'll keep my written commentary fairly brief. Please listen to the newsletter audio for my complete thoughts.
Otherwise here's a index summary table
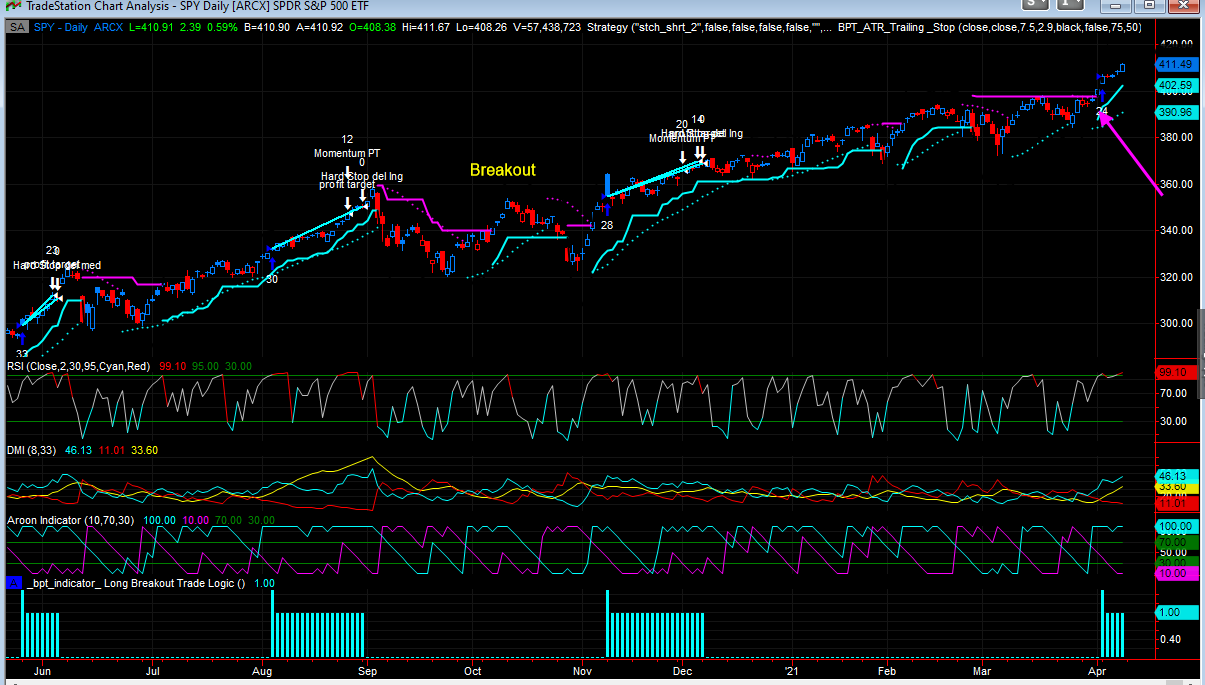
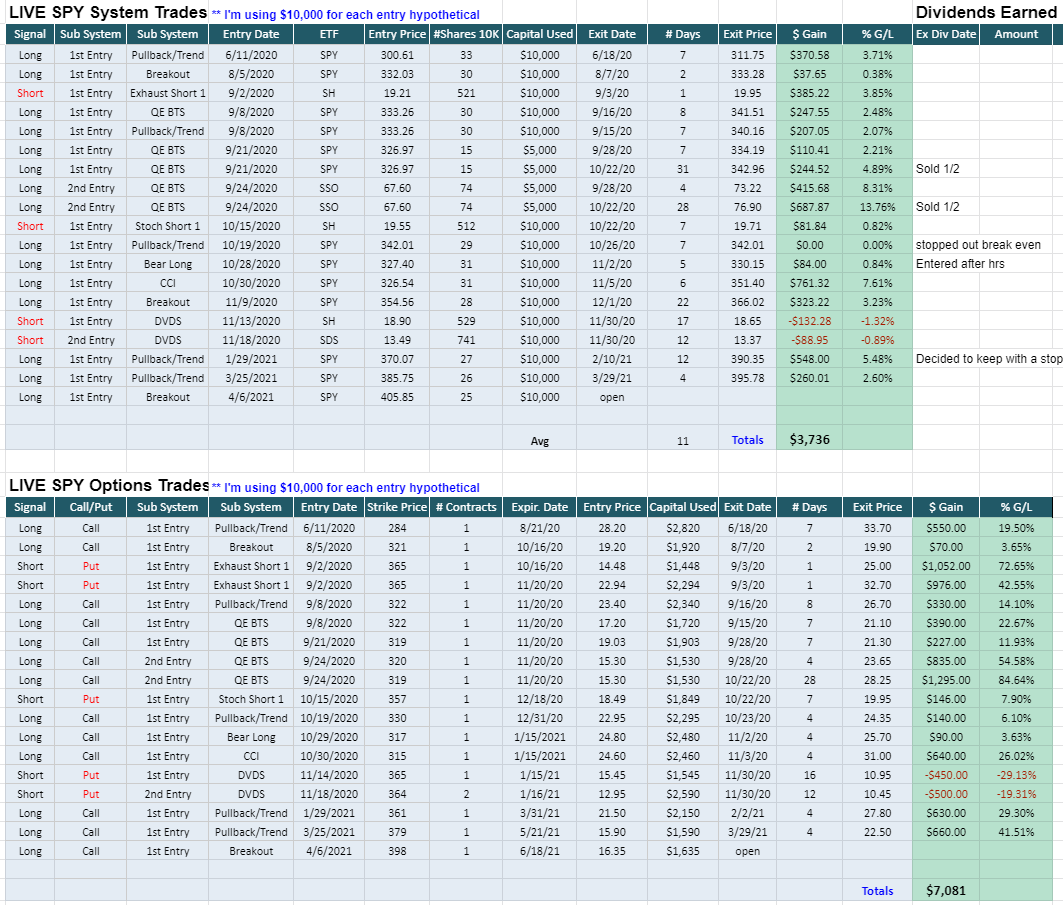
- SPY System Breakout Trade Discussion
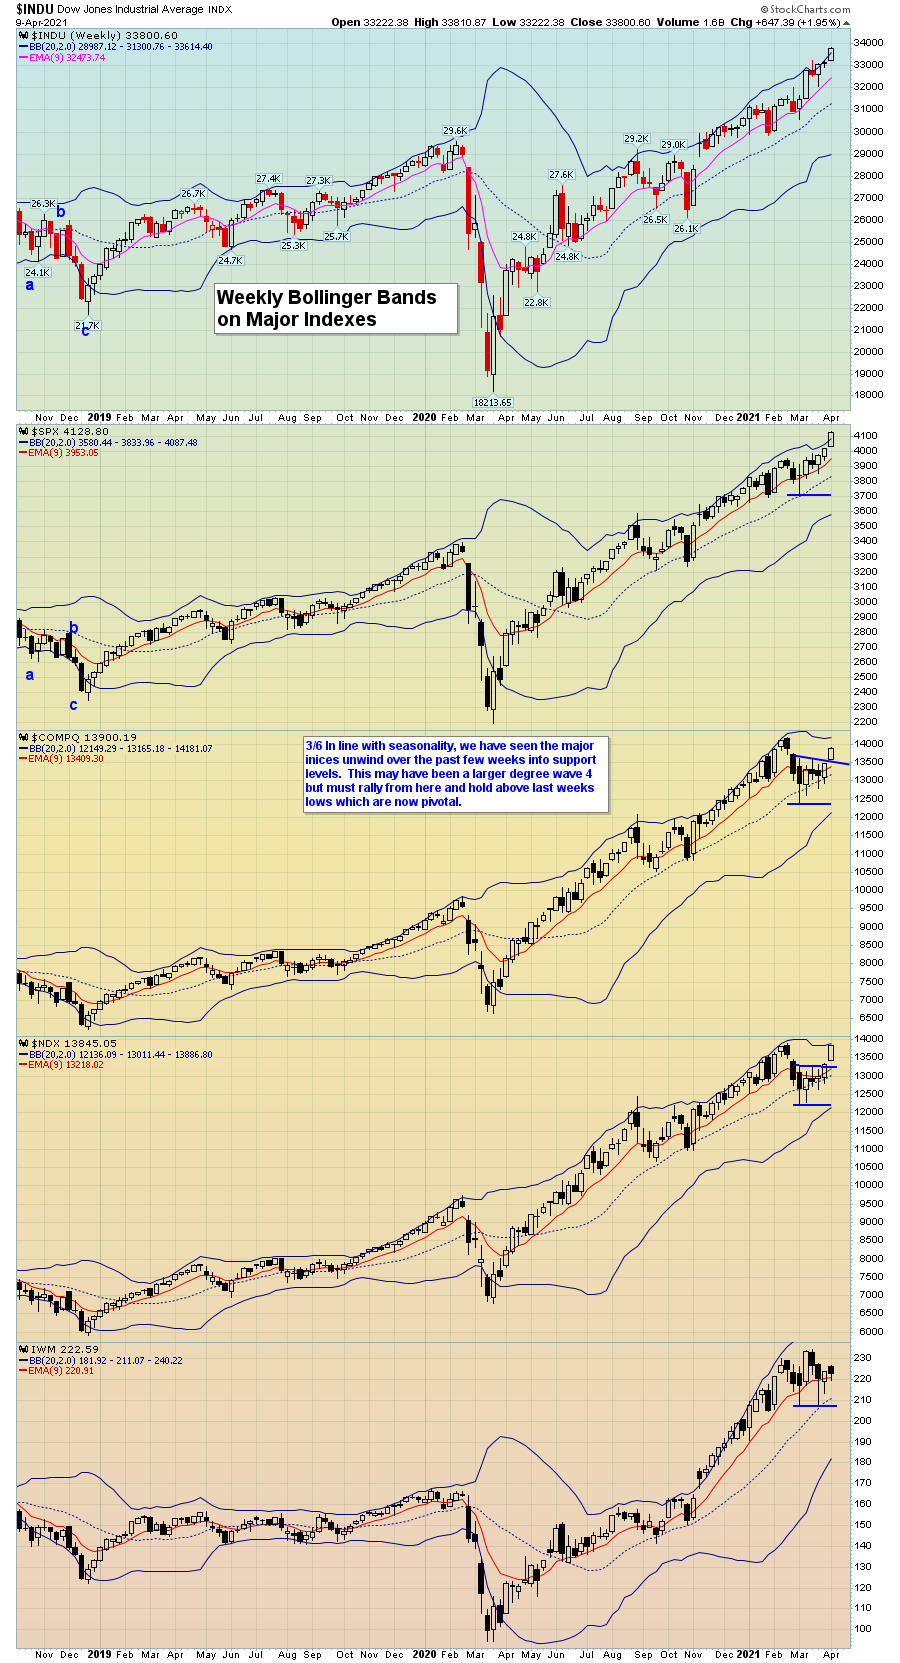
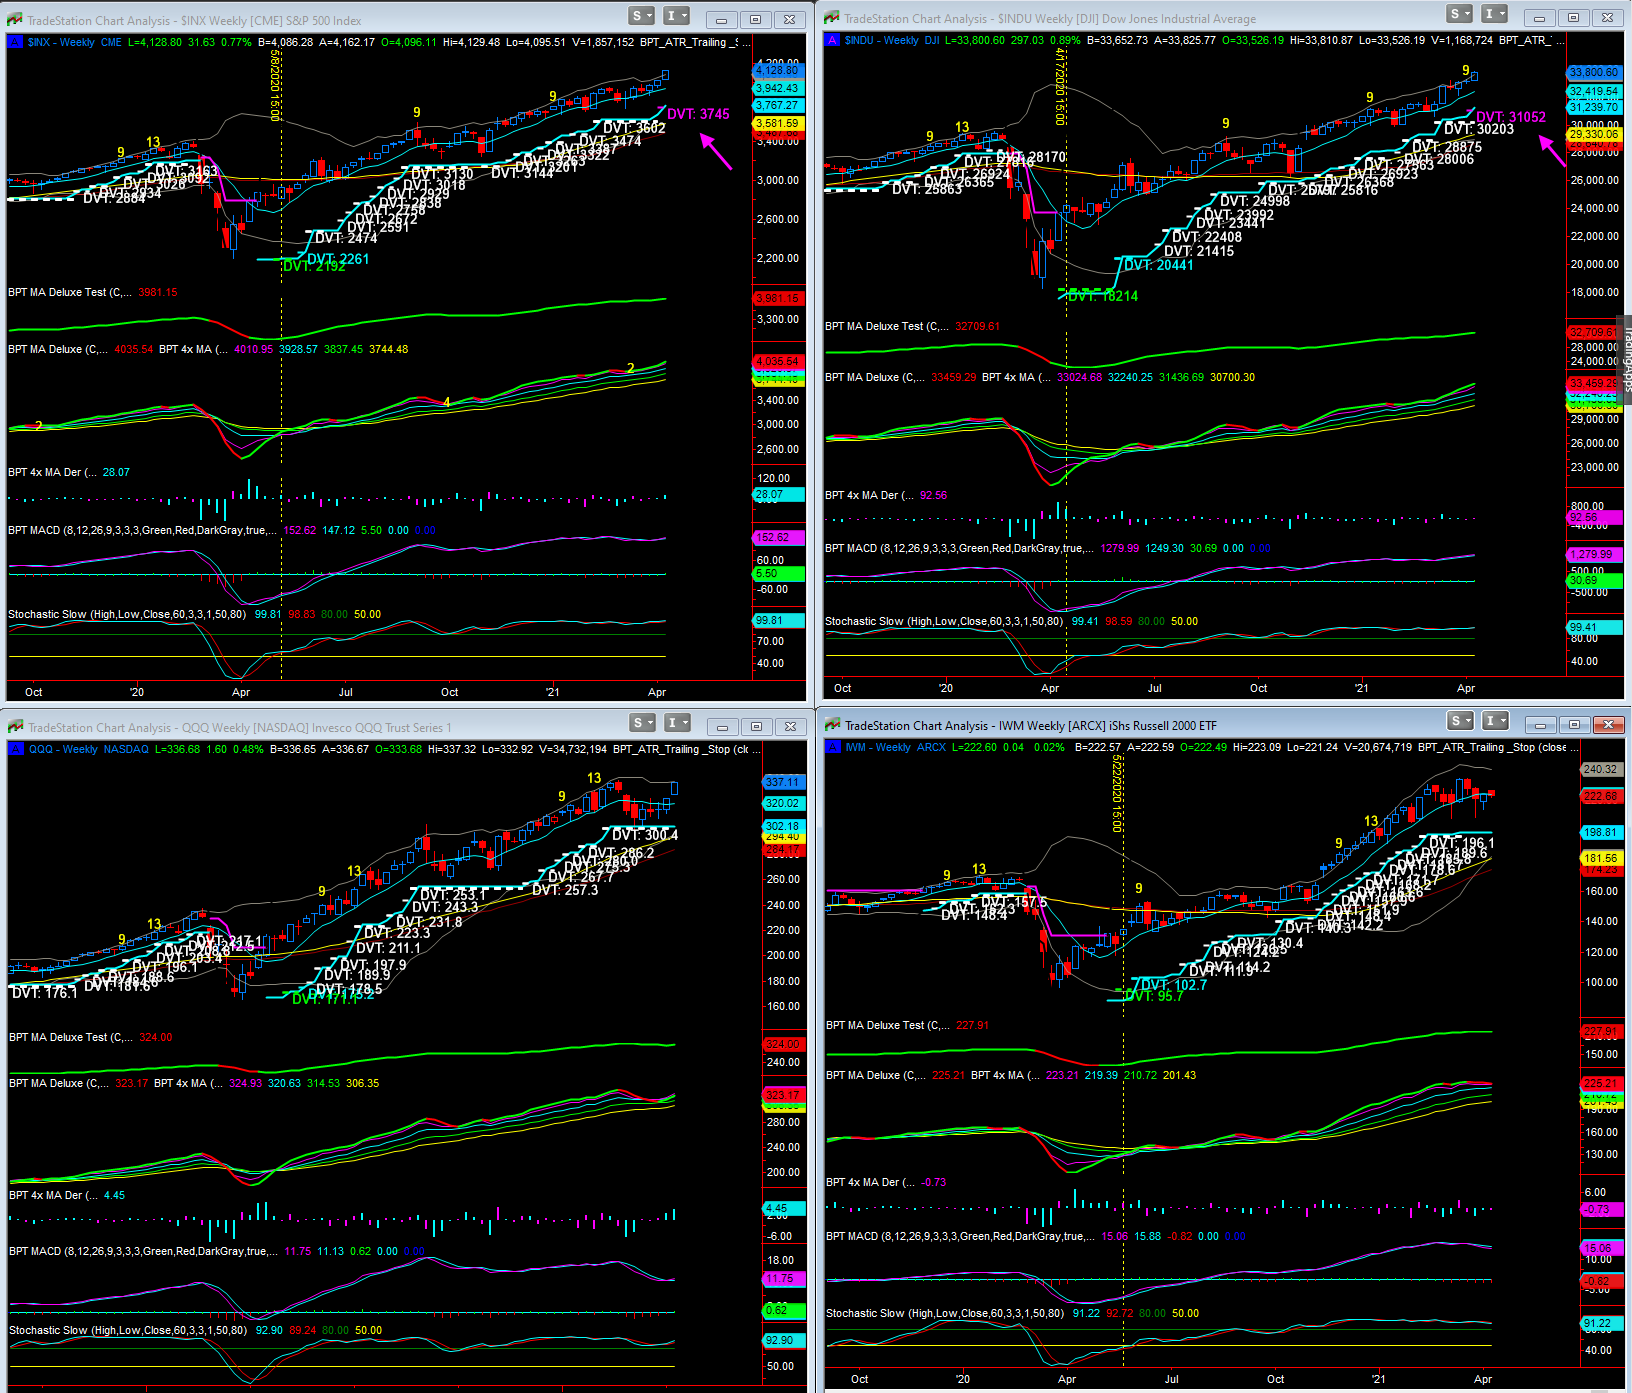
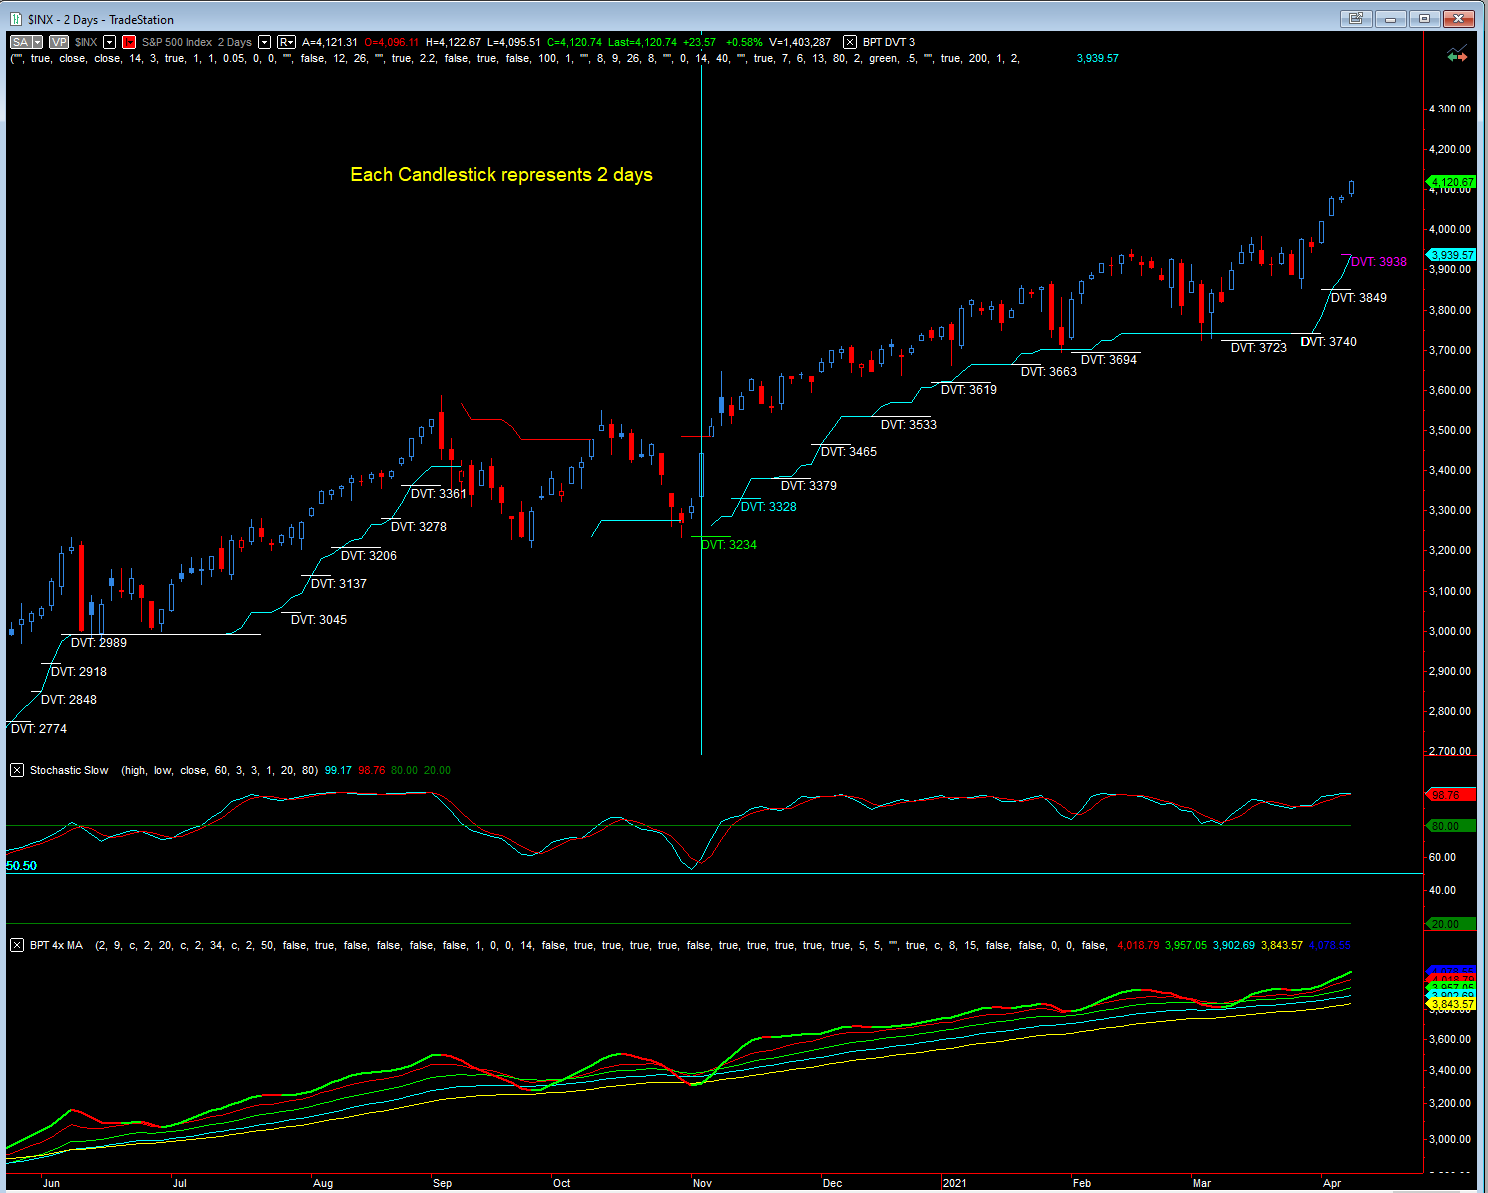
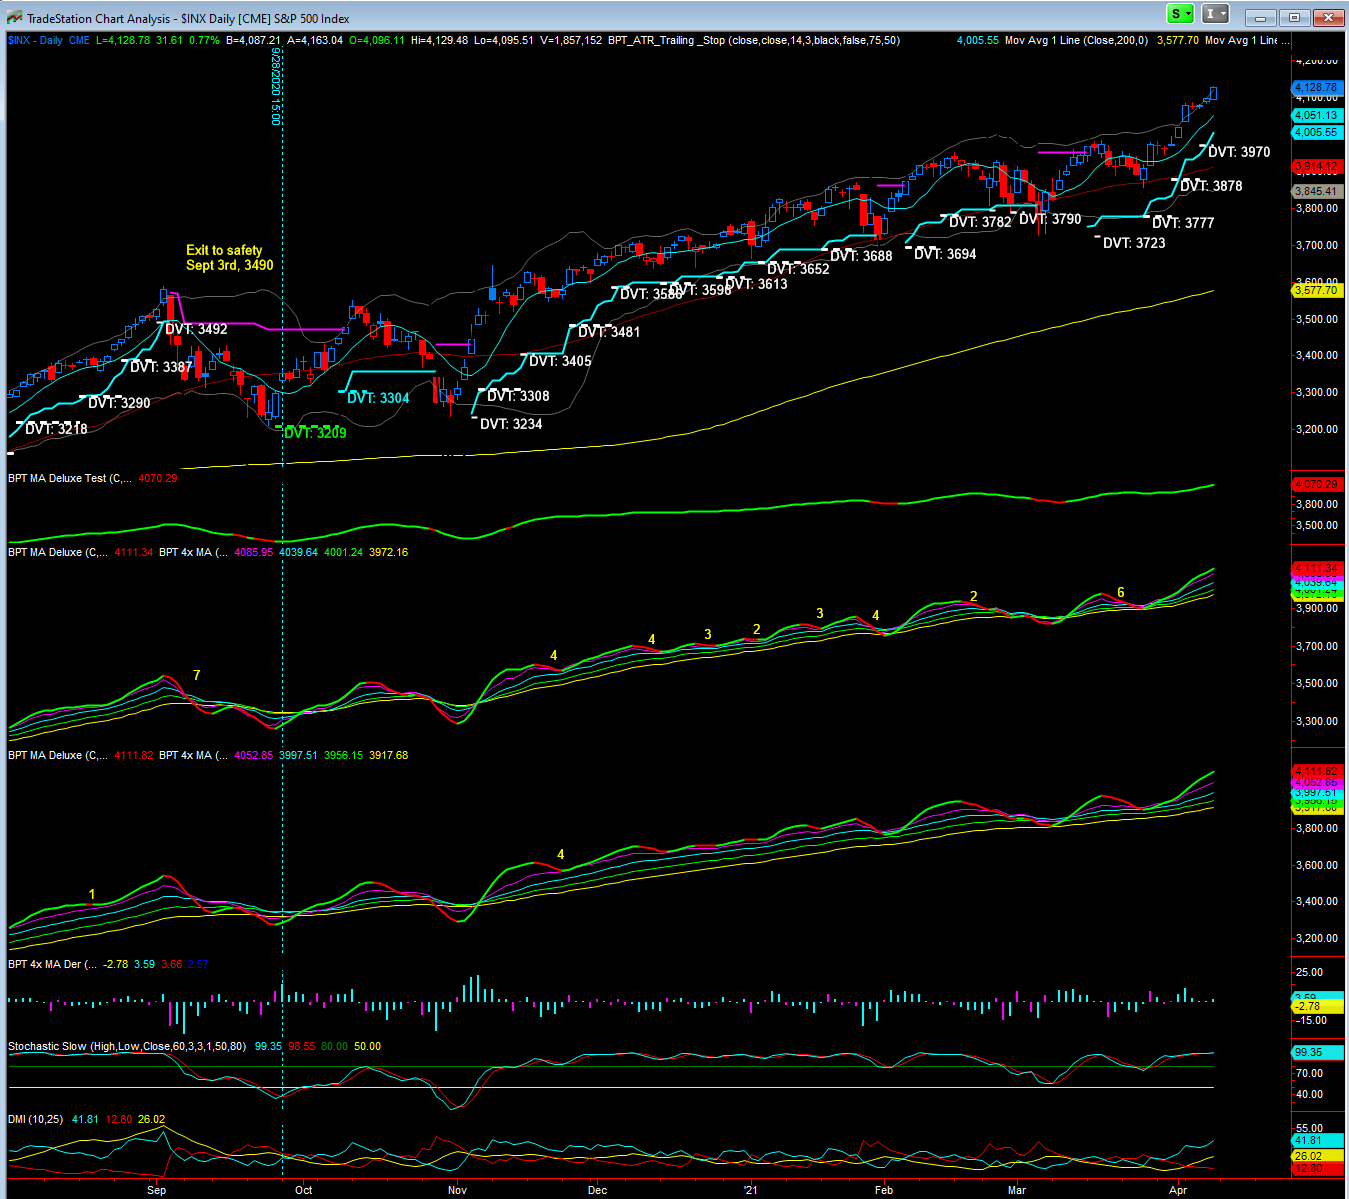
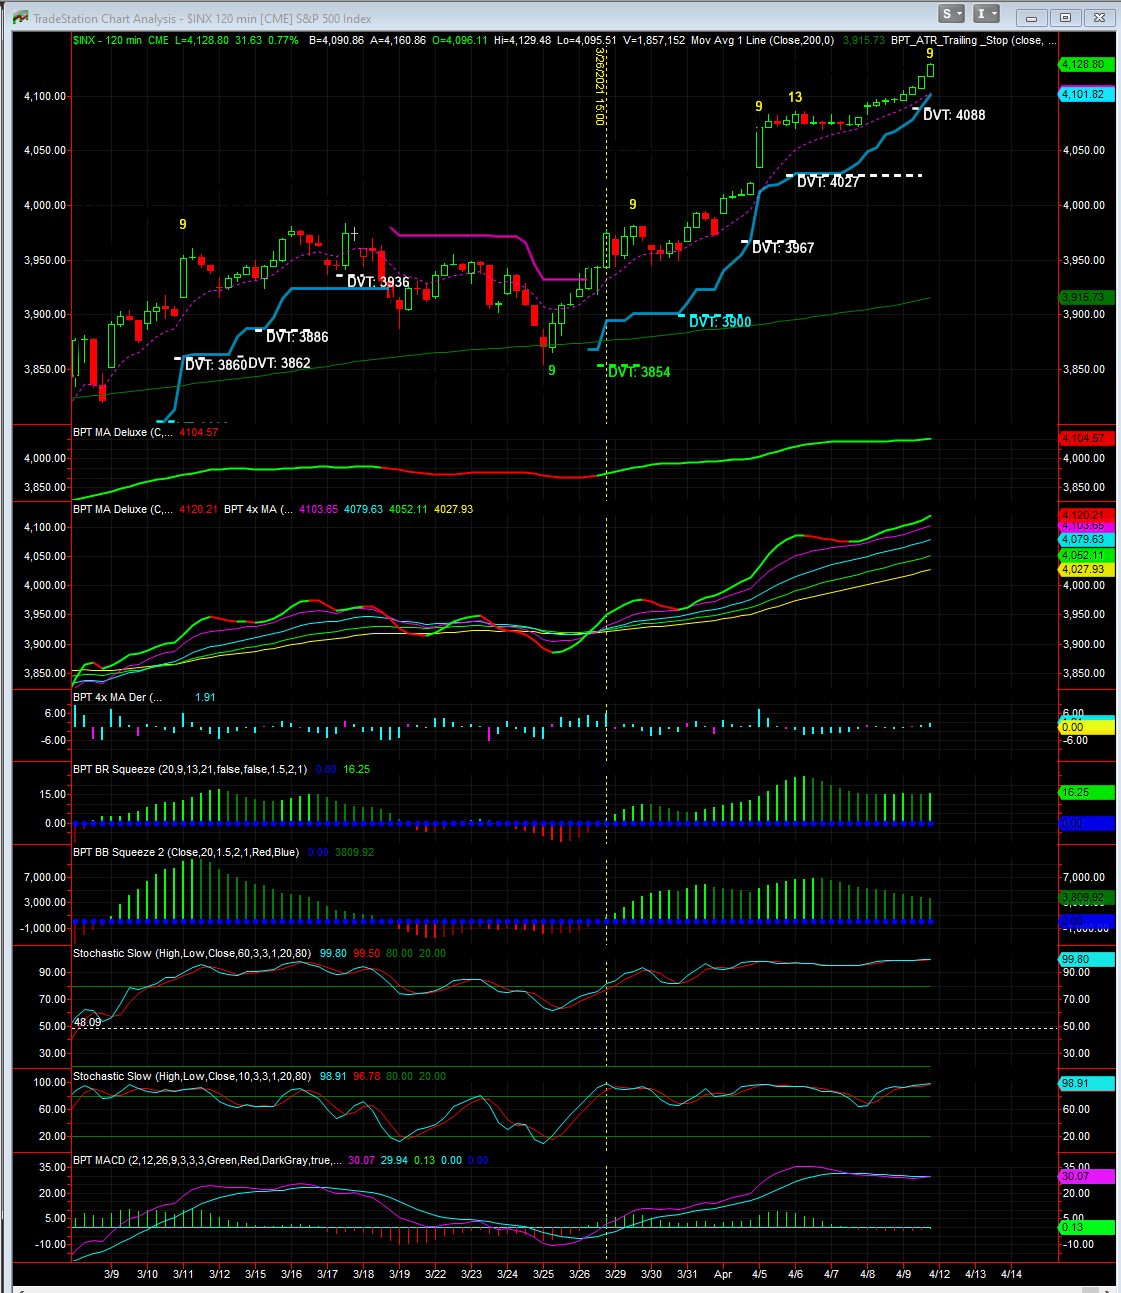
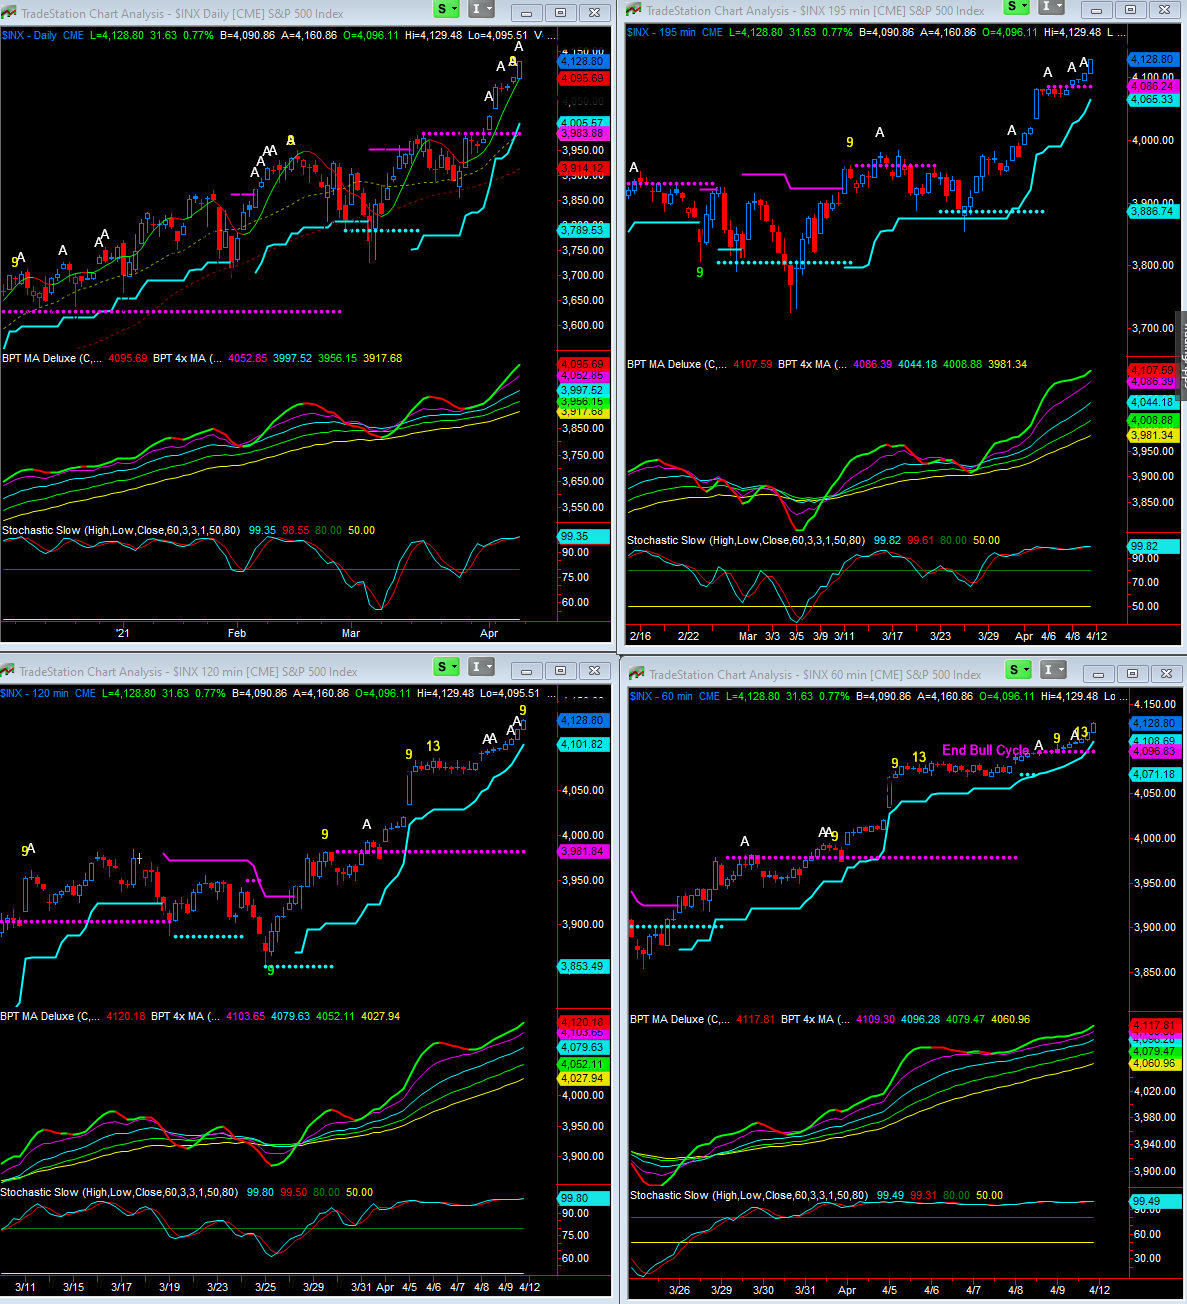
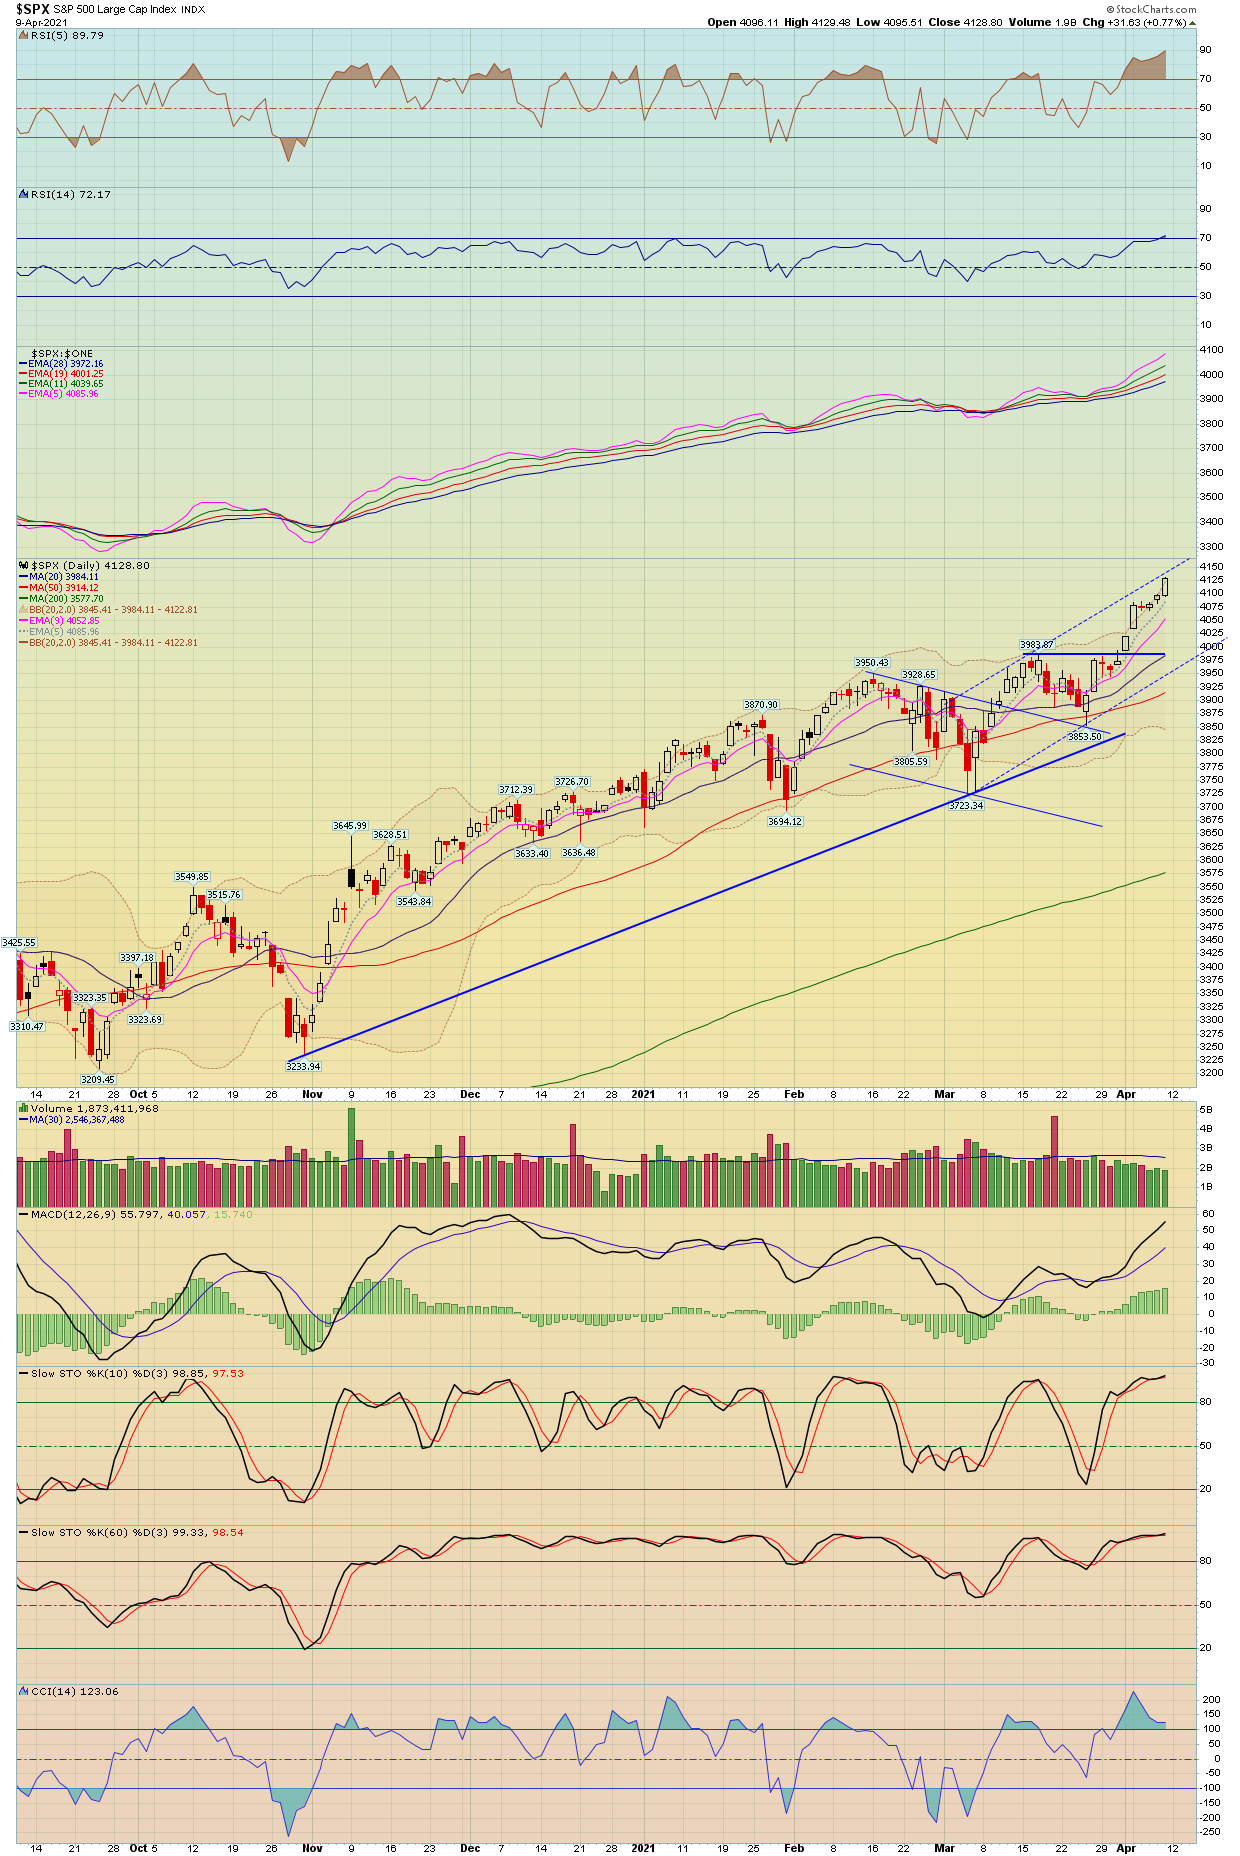
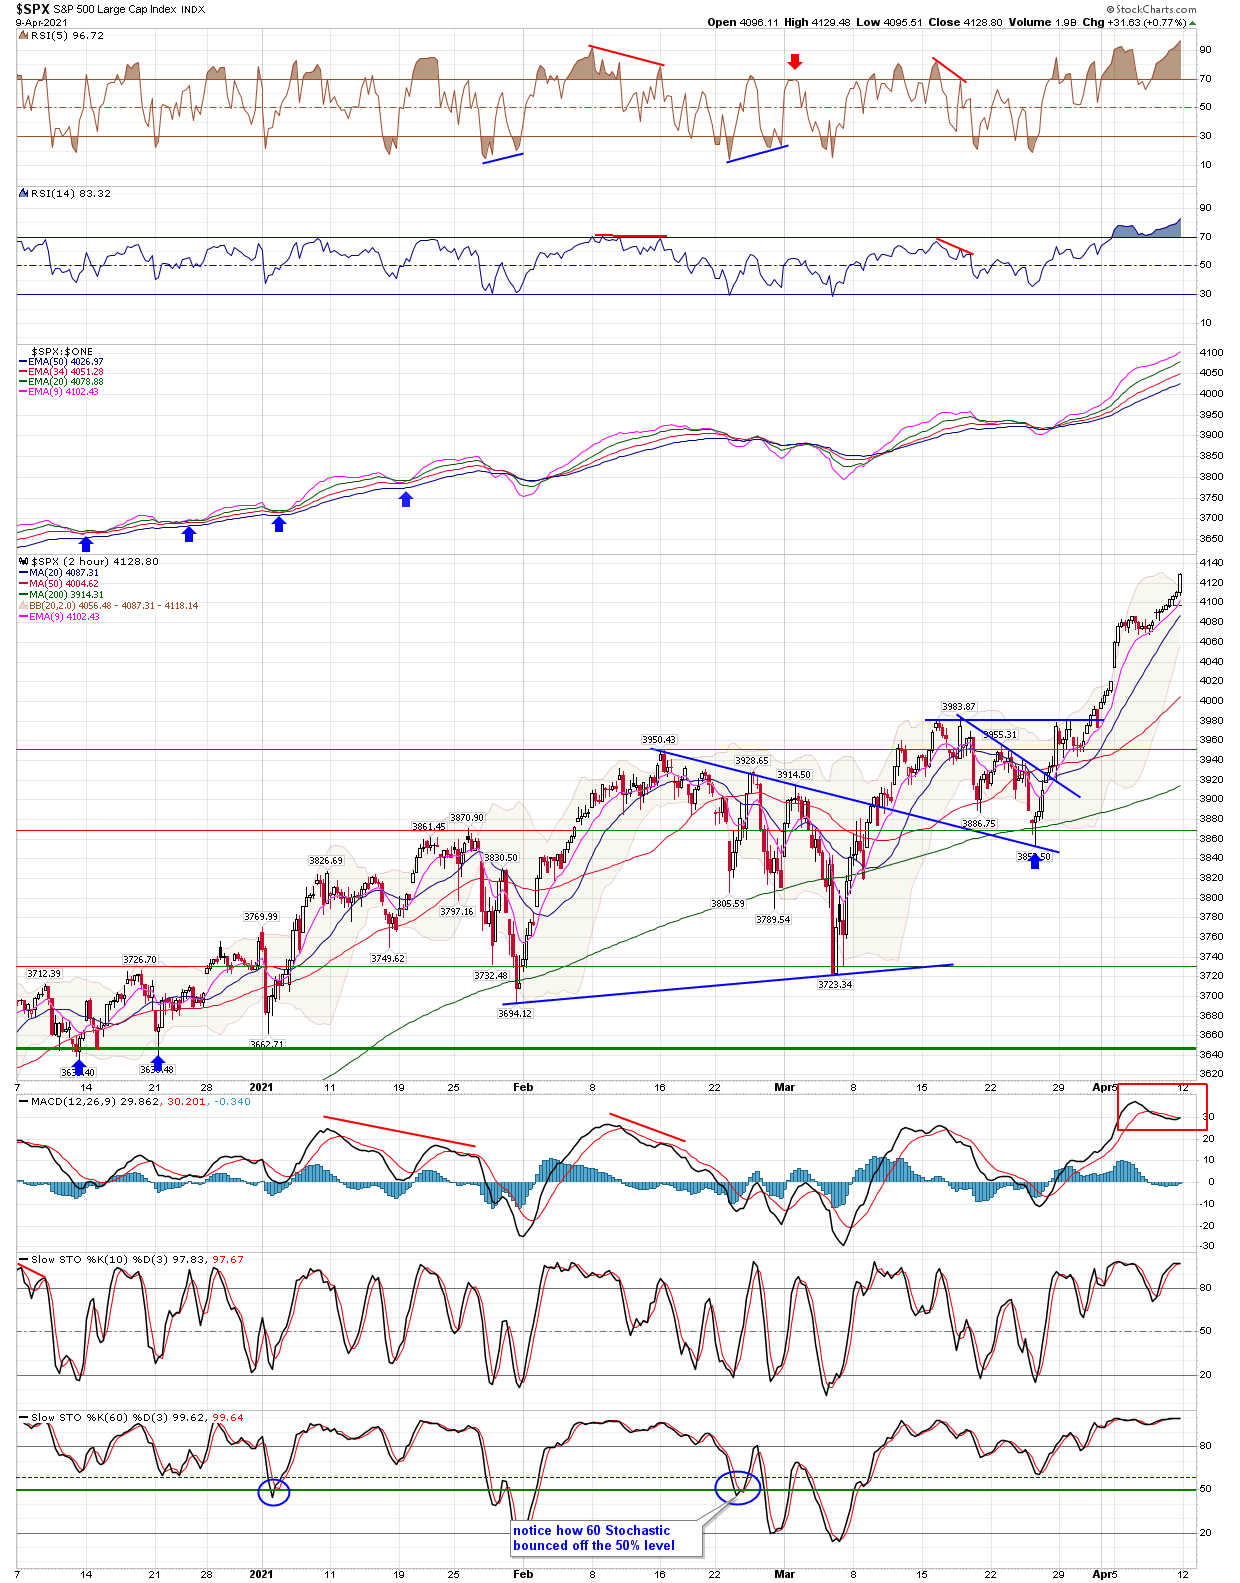
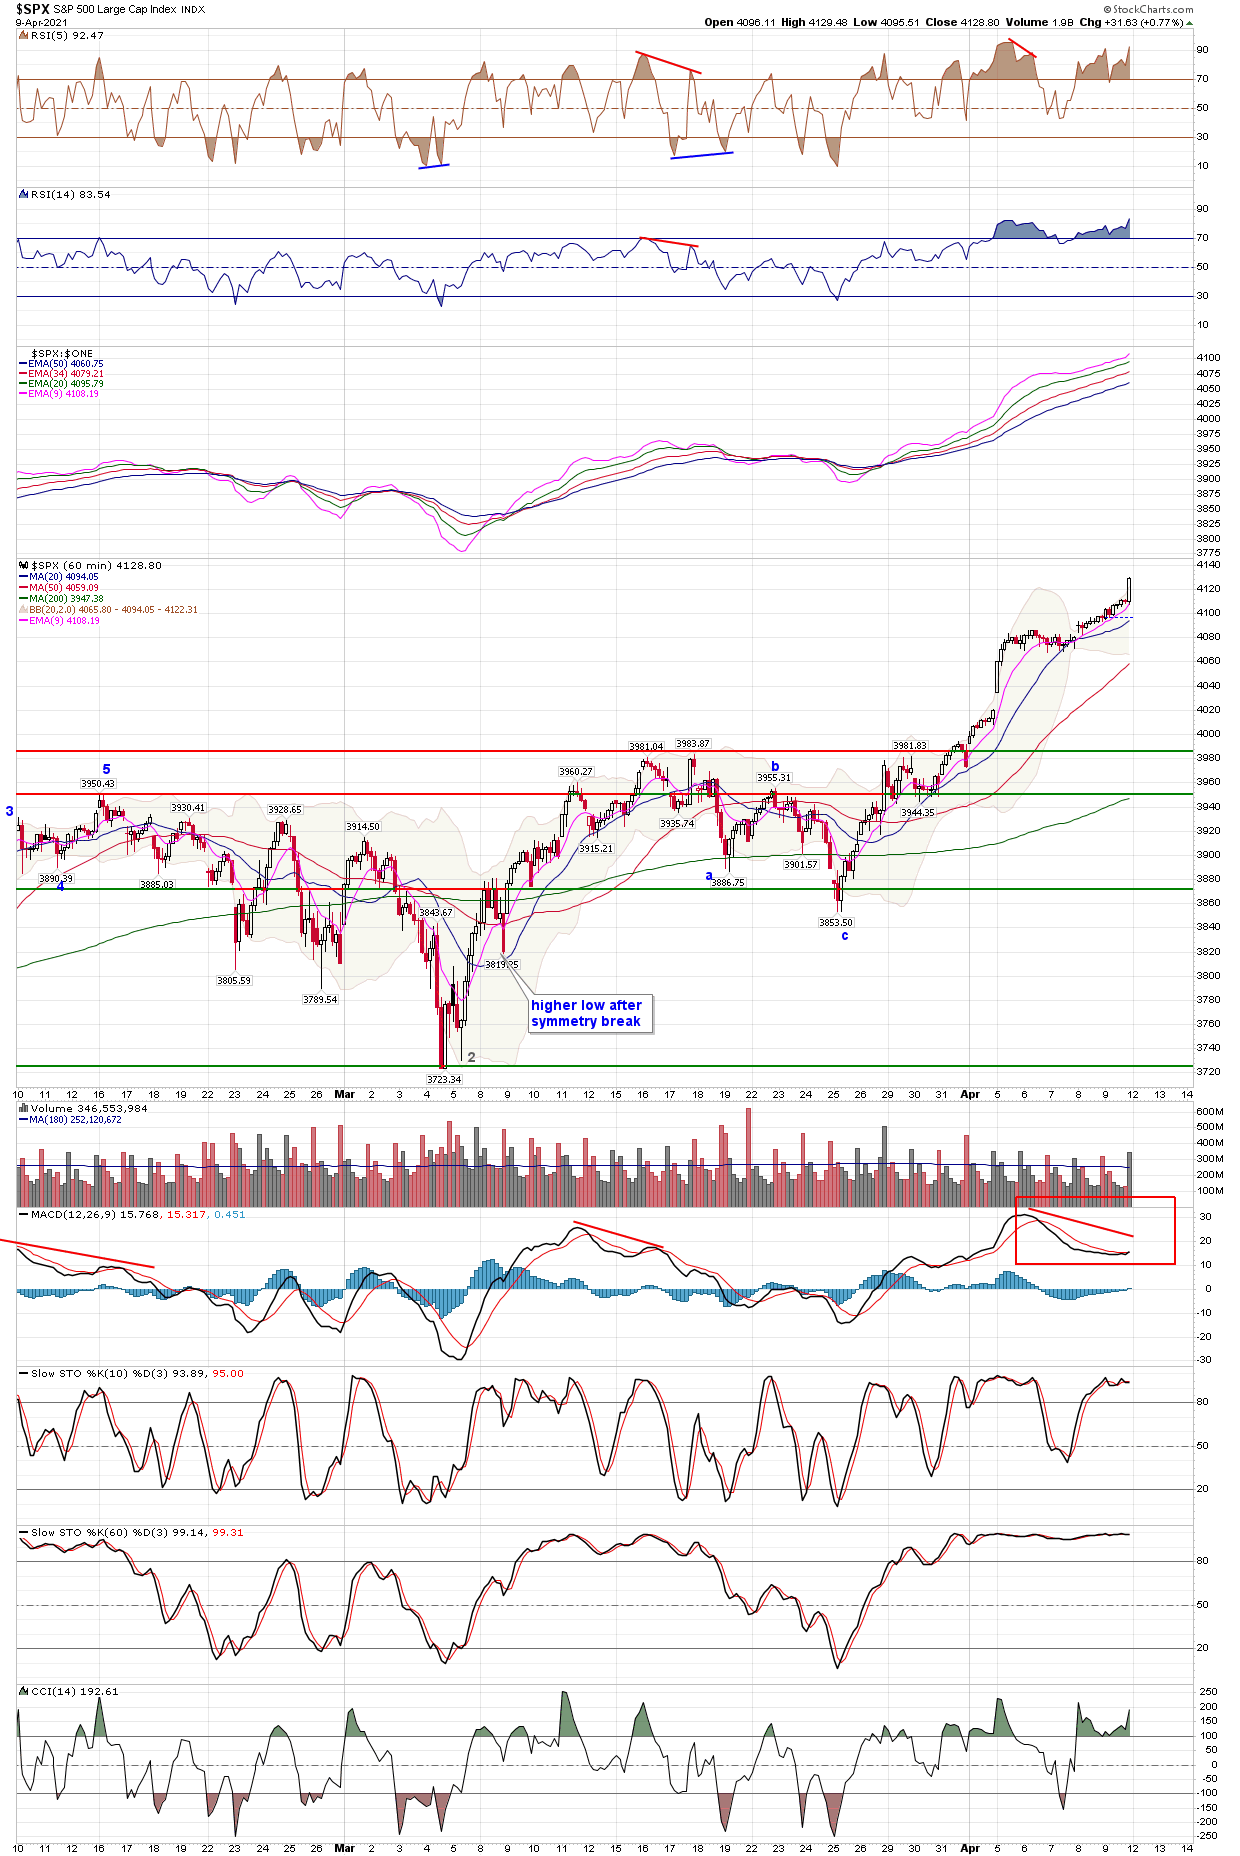
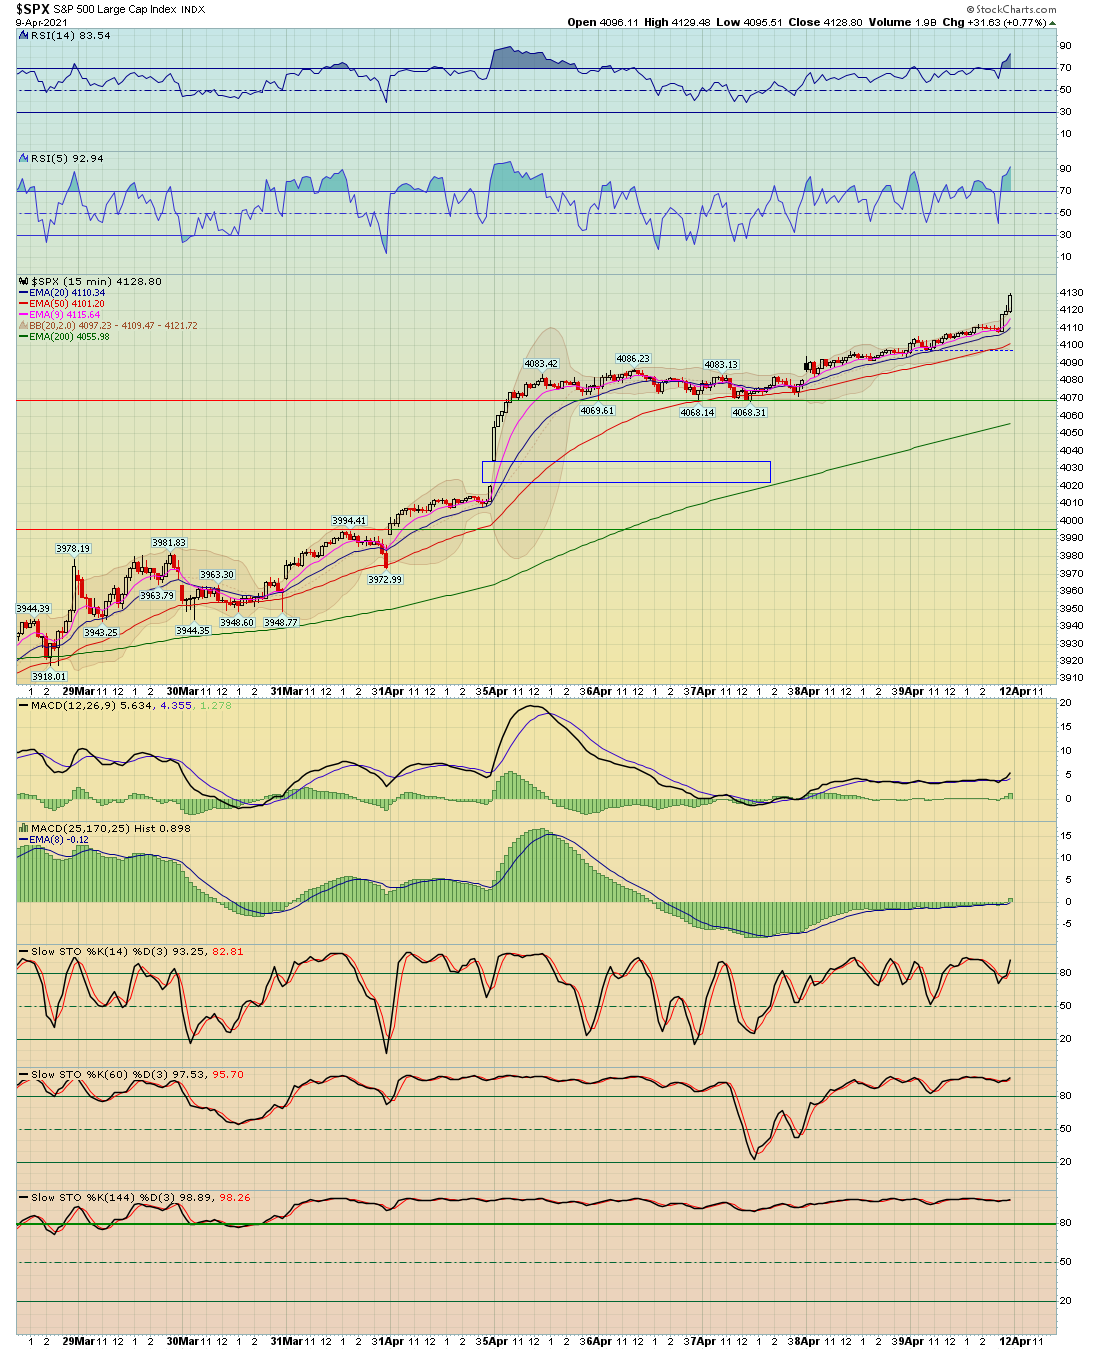
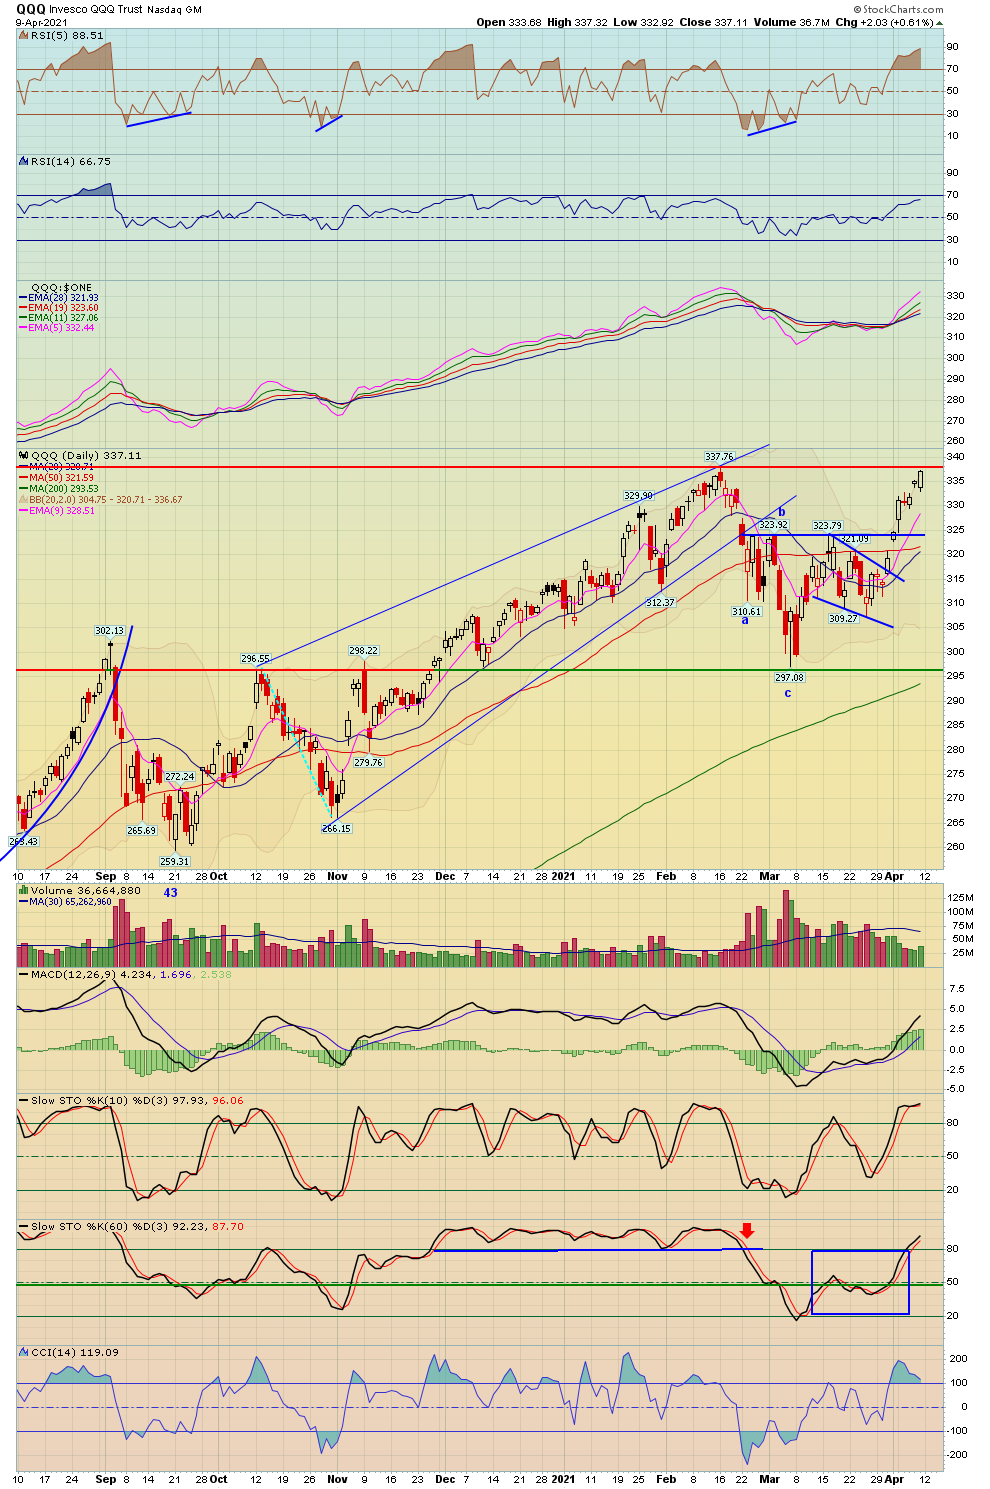
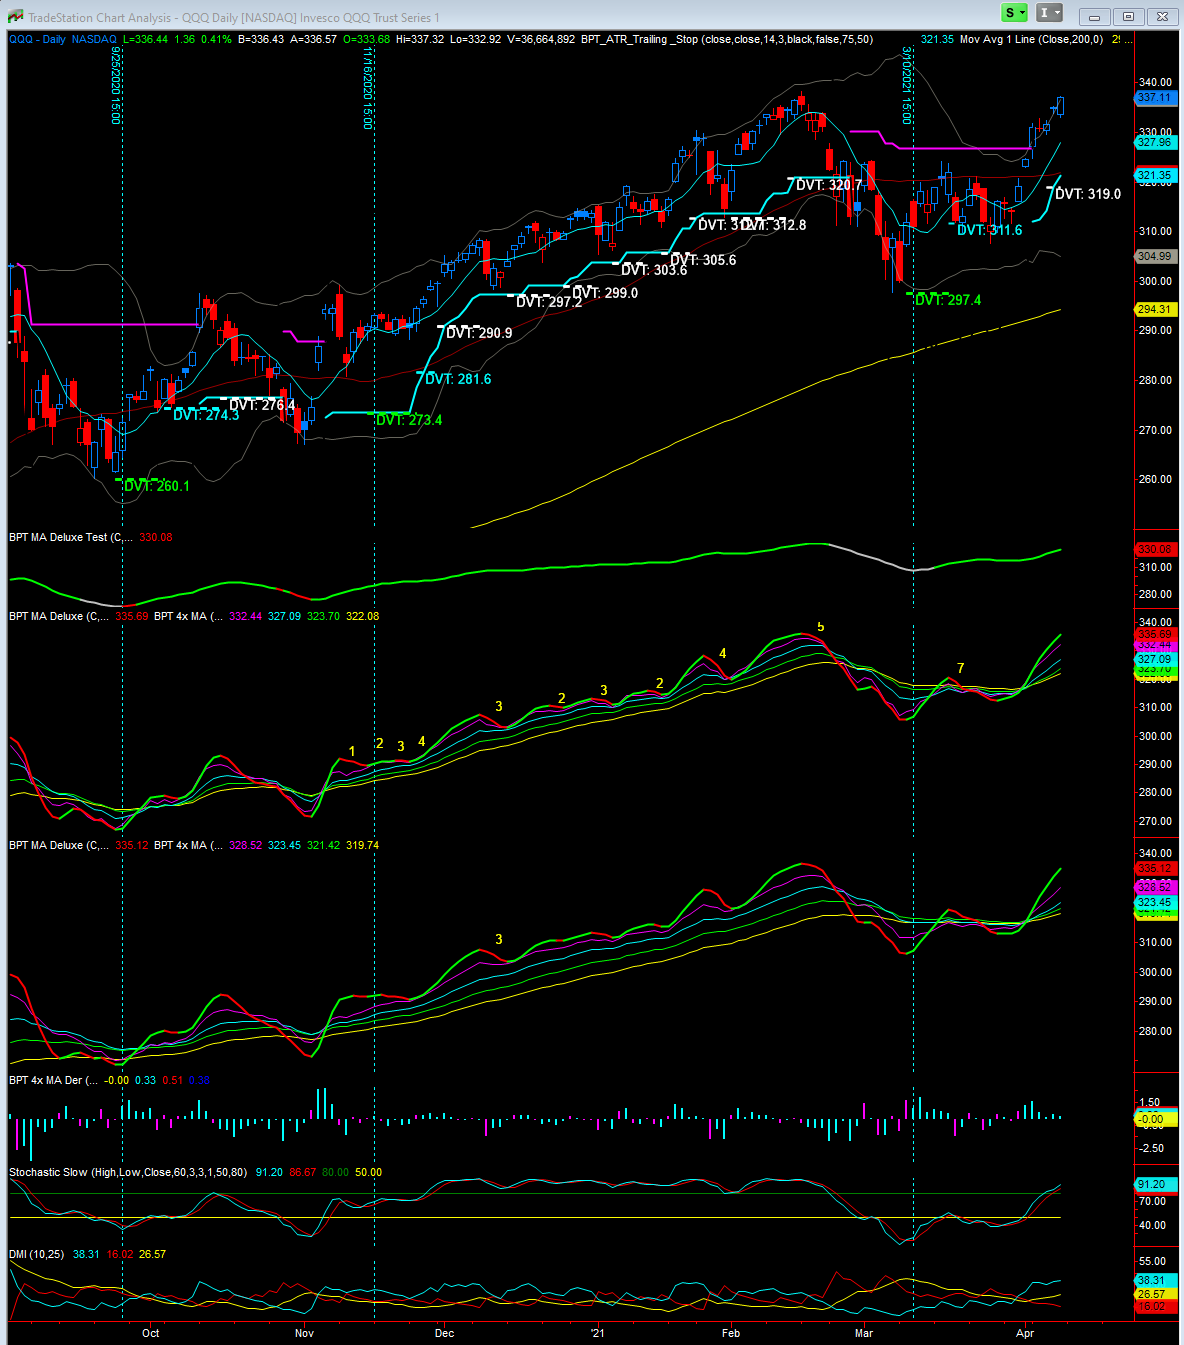
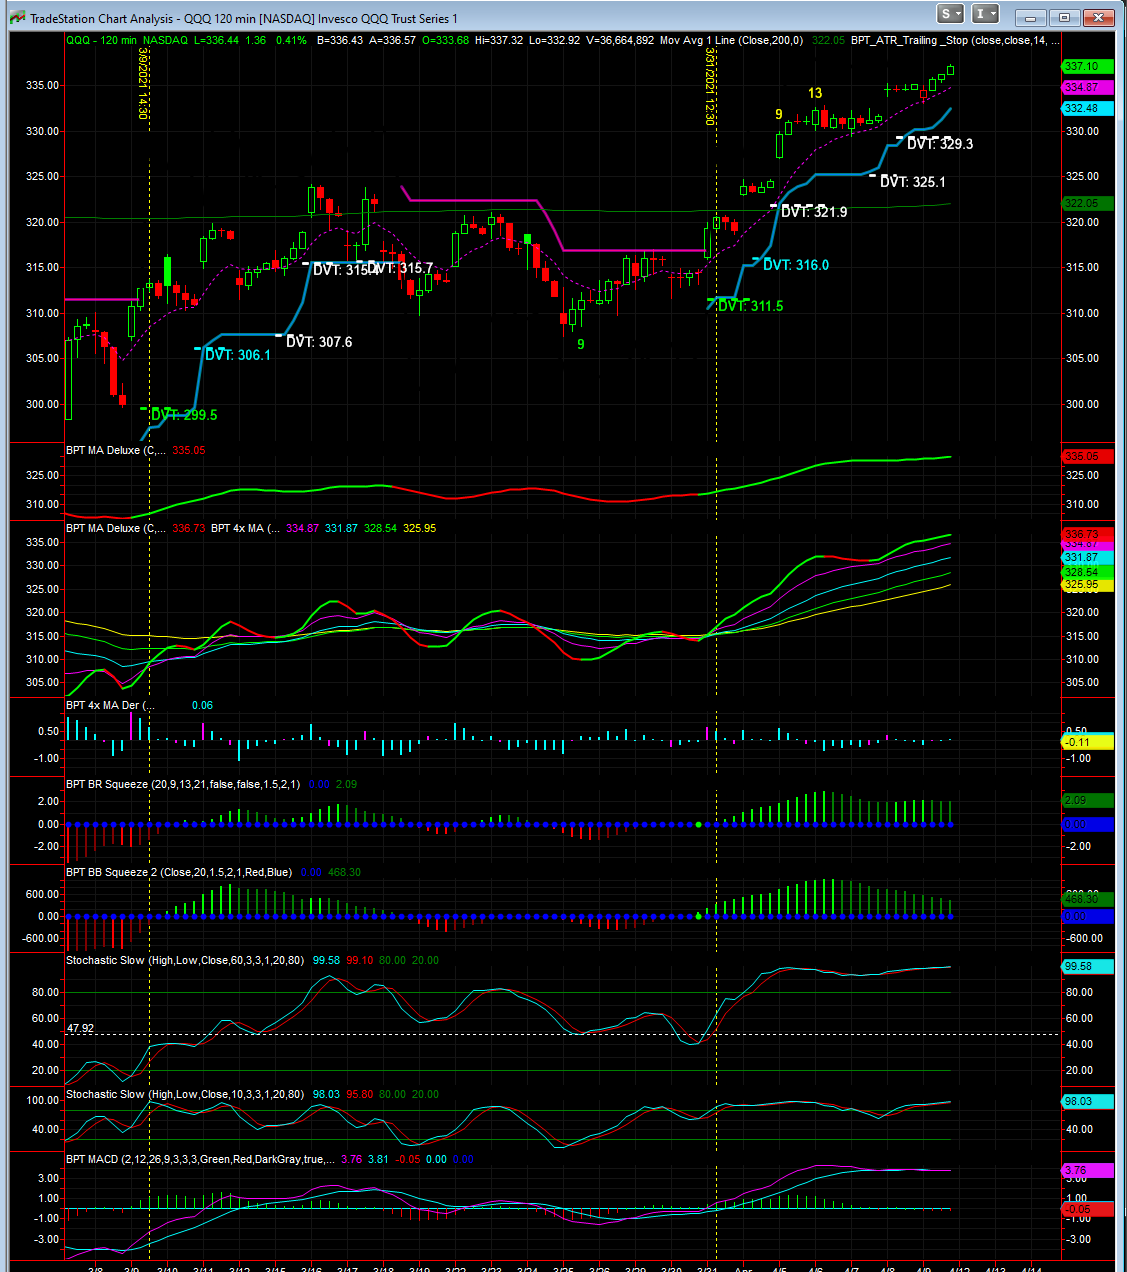
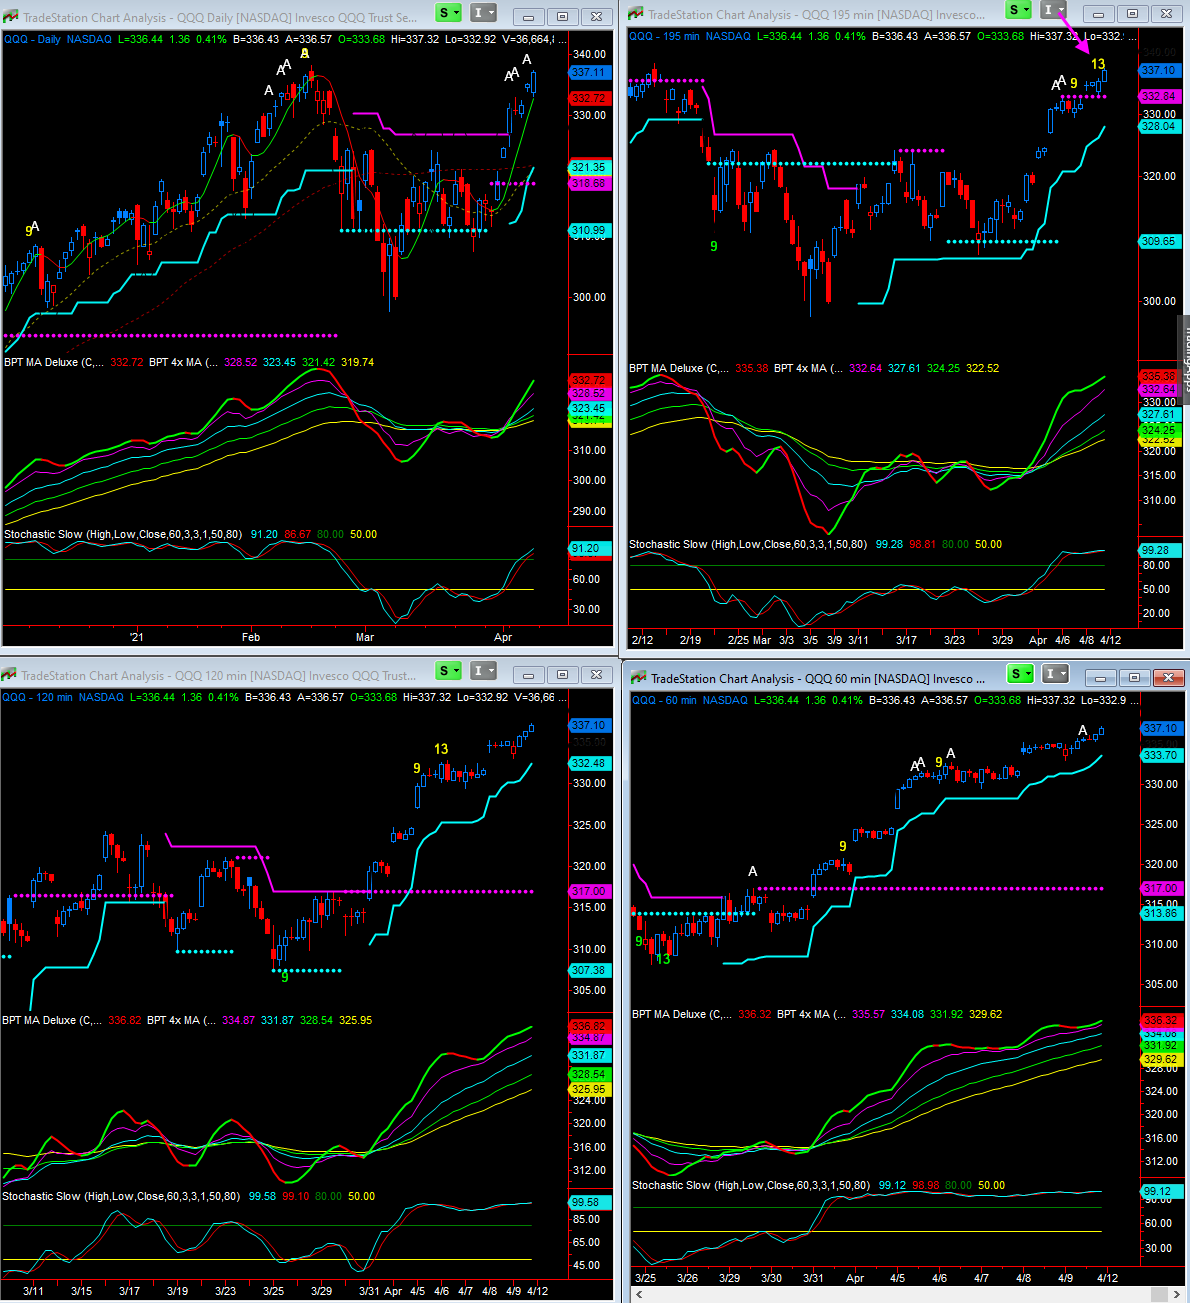
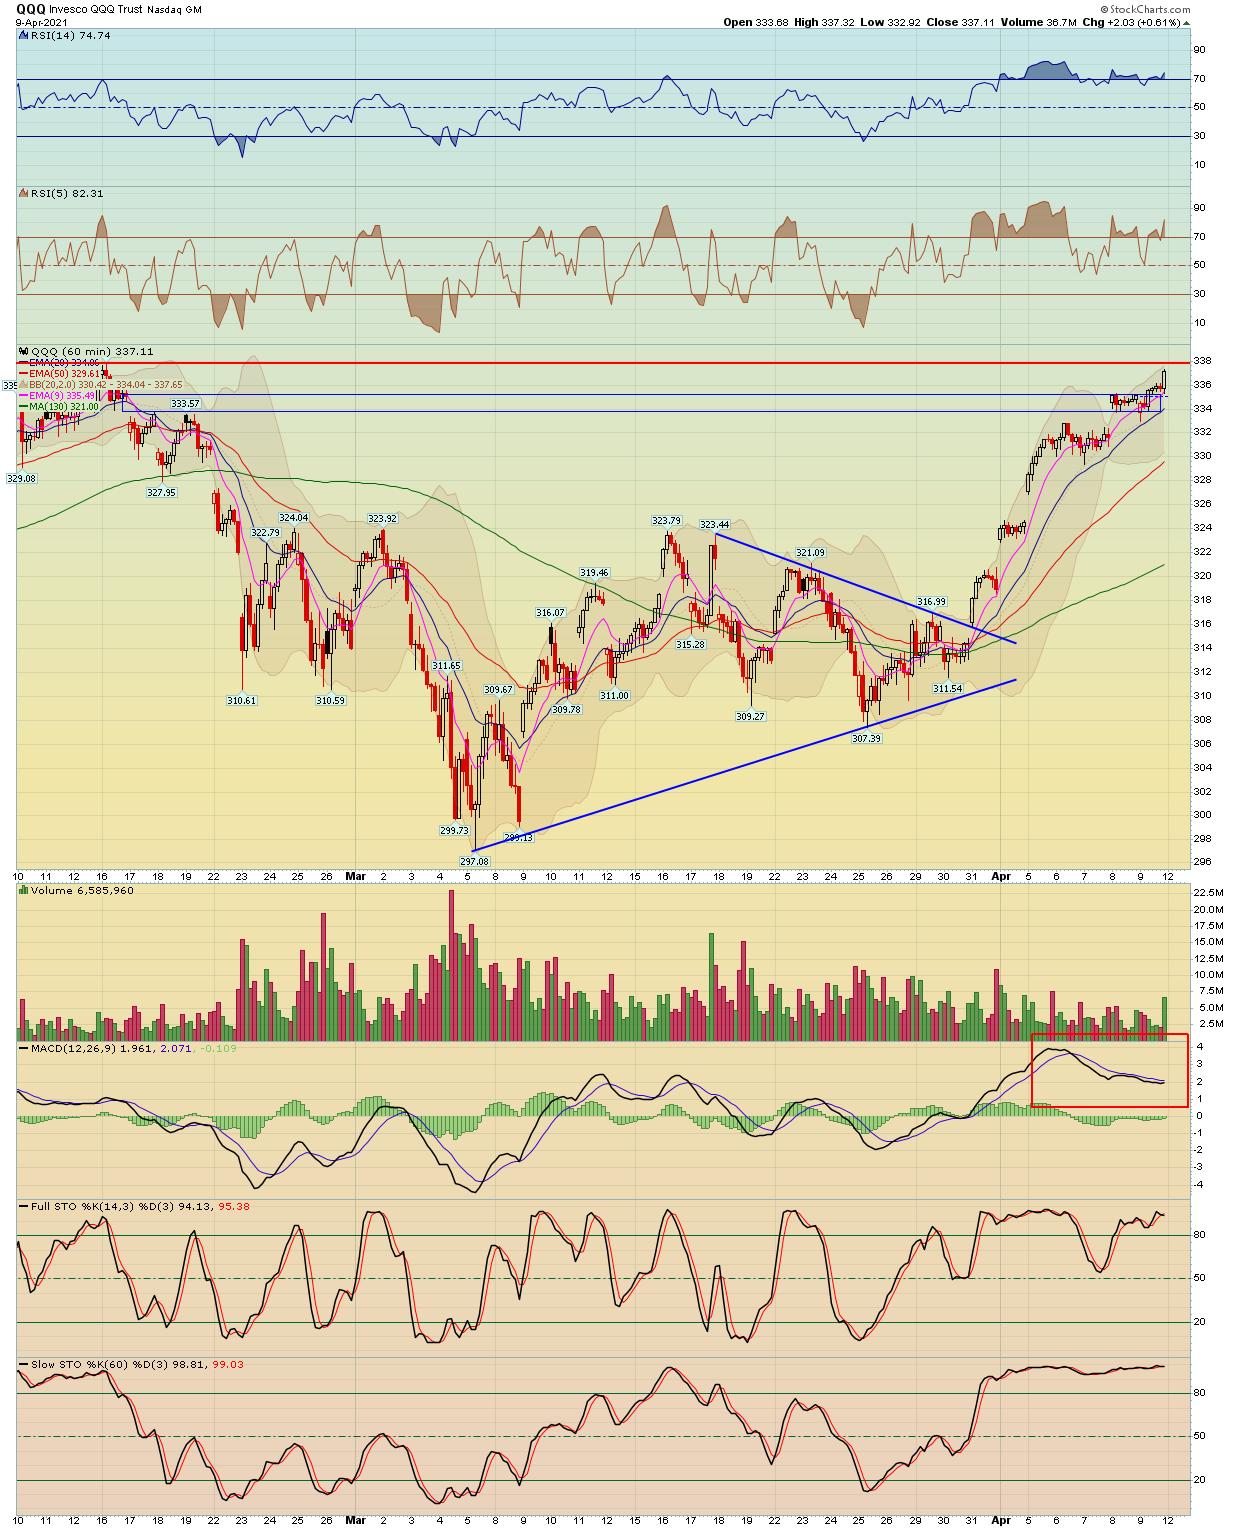
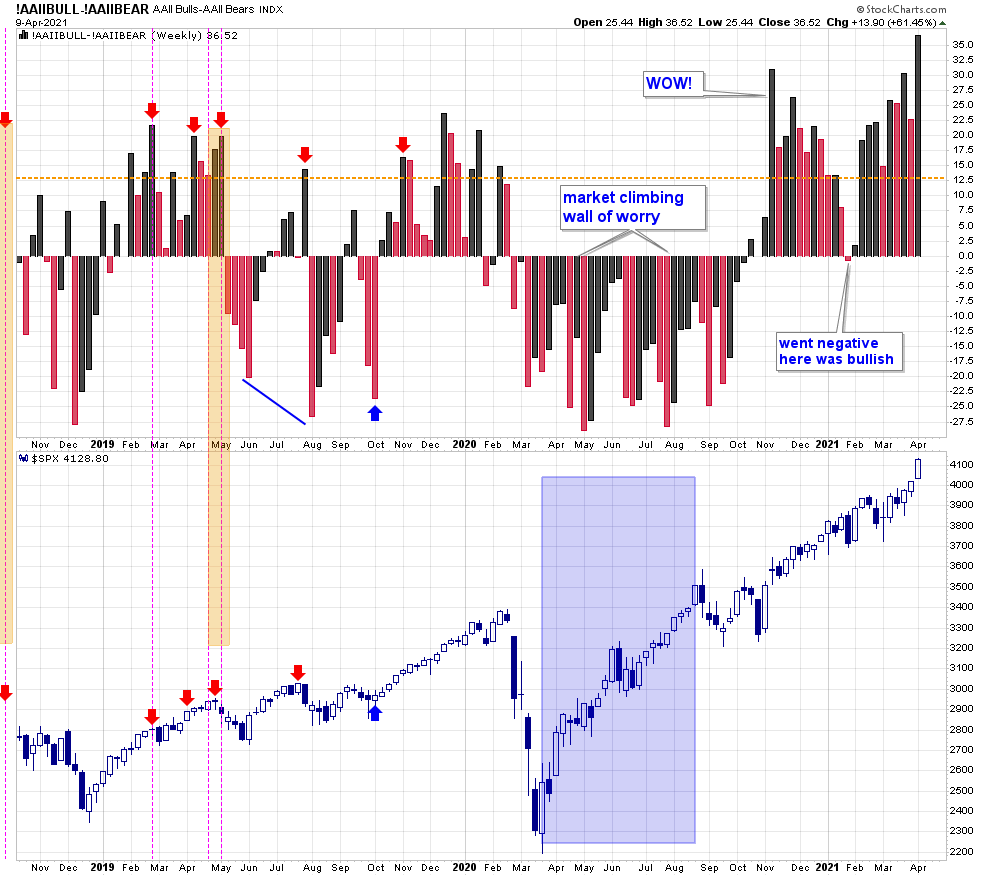
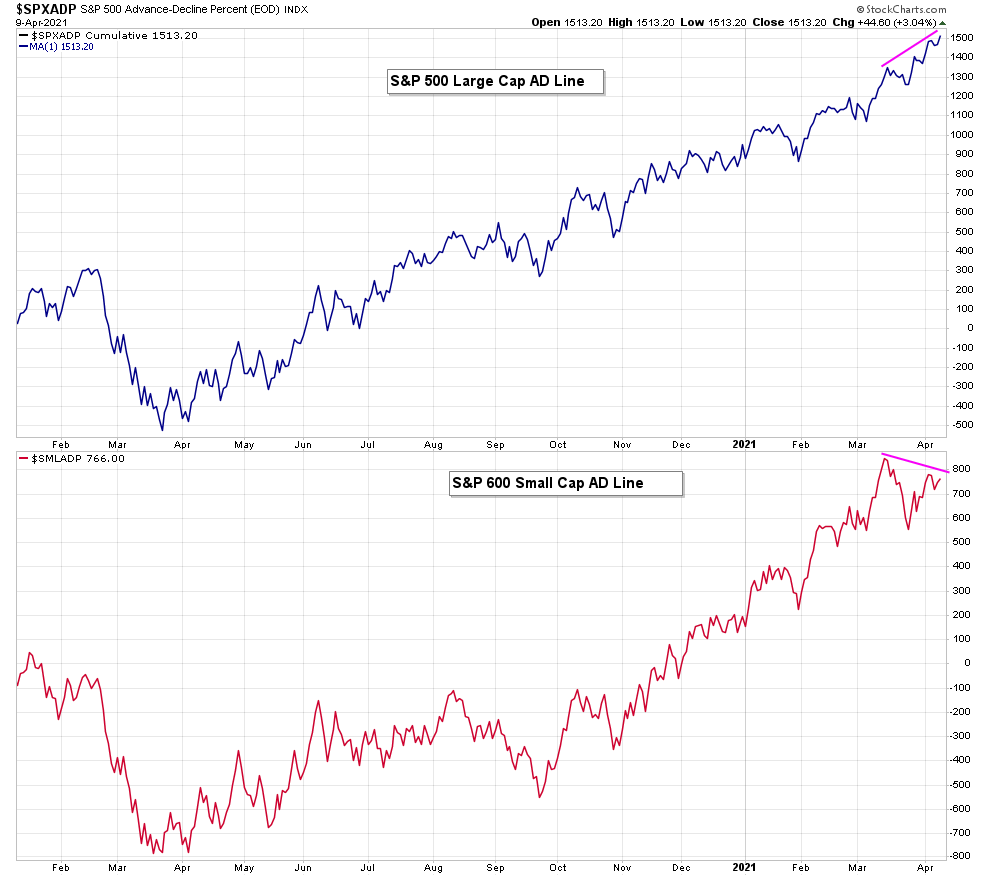
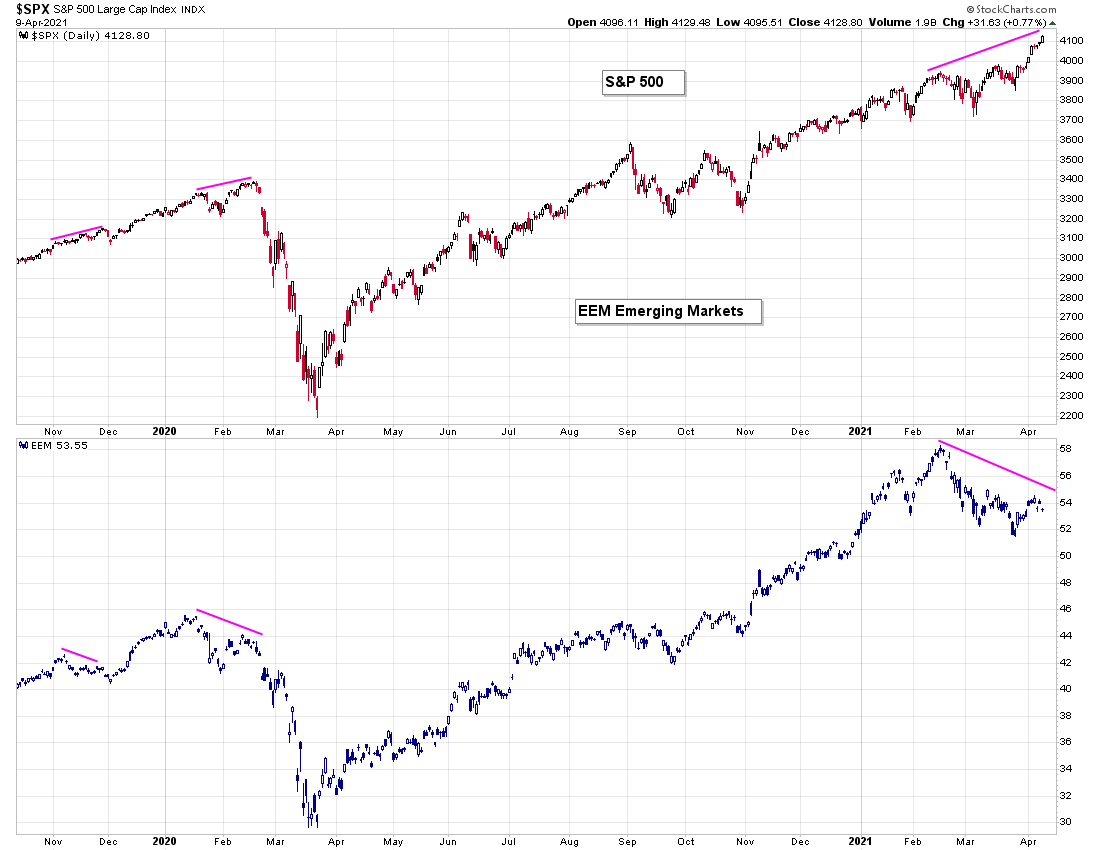
- General Market Analysis: SPX and Other Major Indices, KISS system charts. Short term what stands out to me is some MACD divergence showing up on the intra day time frames and we are quite stretched/overbought short term.
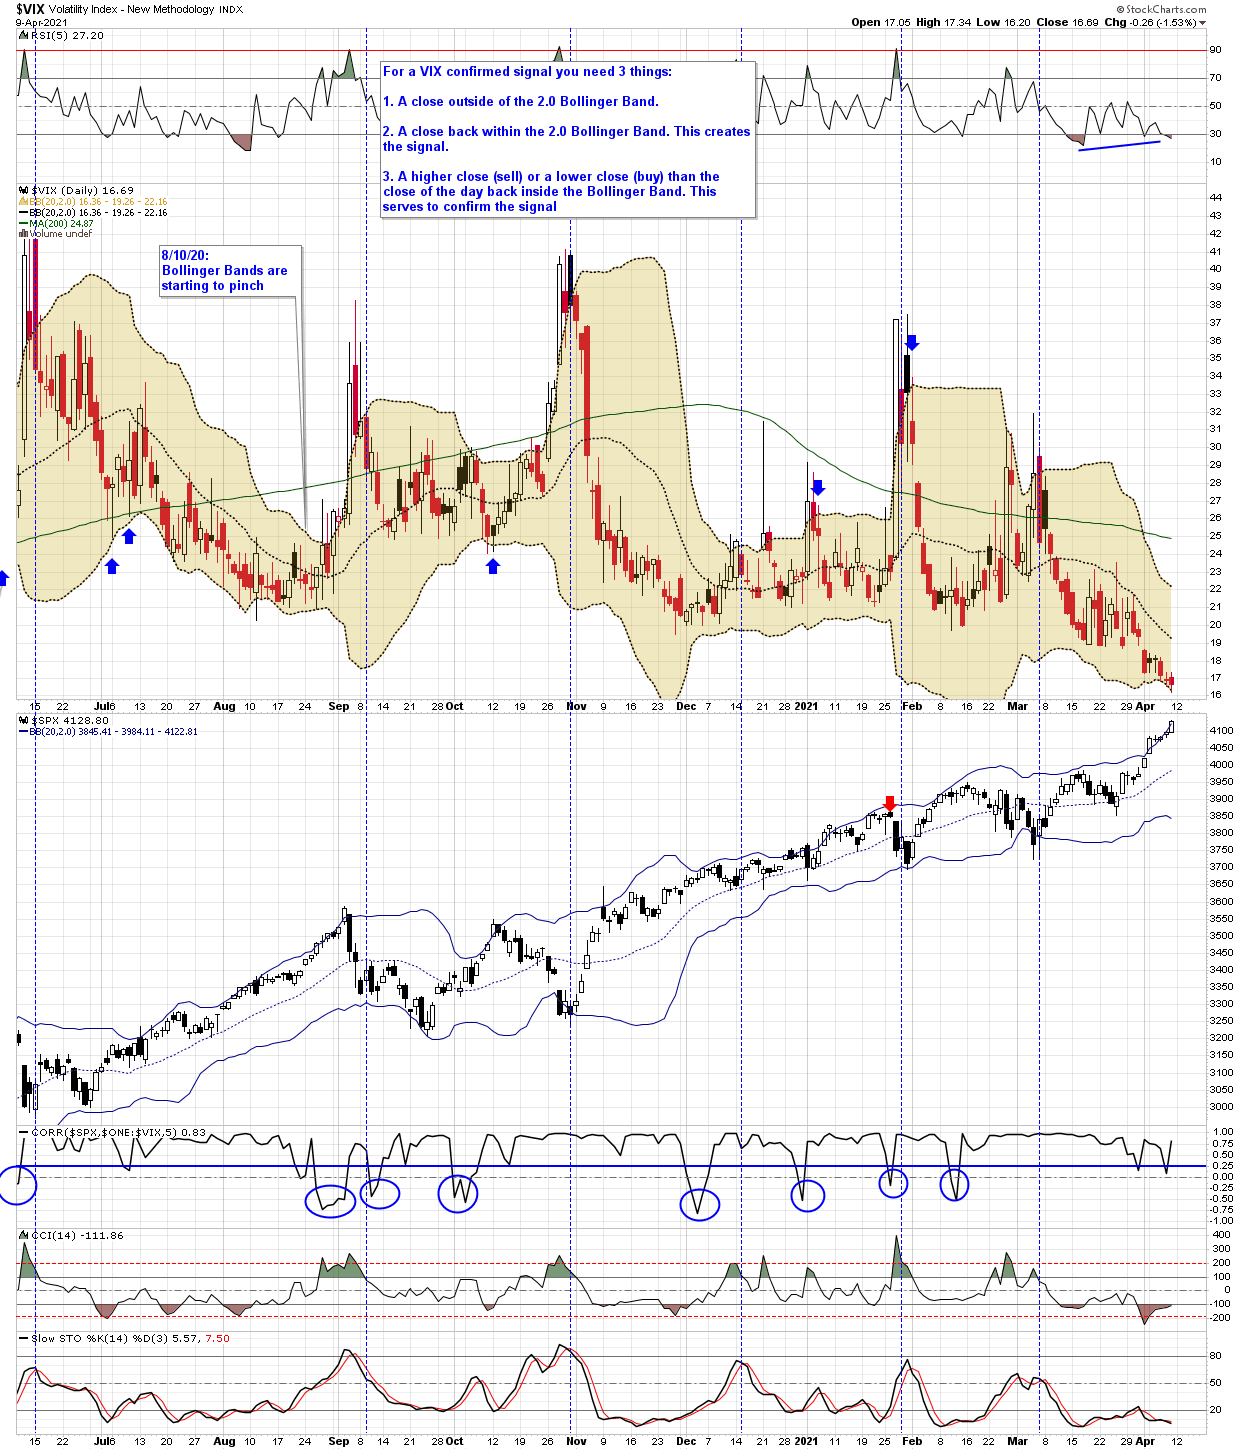
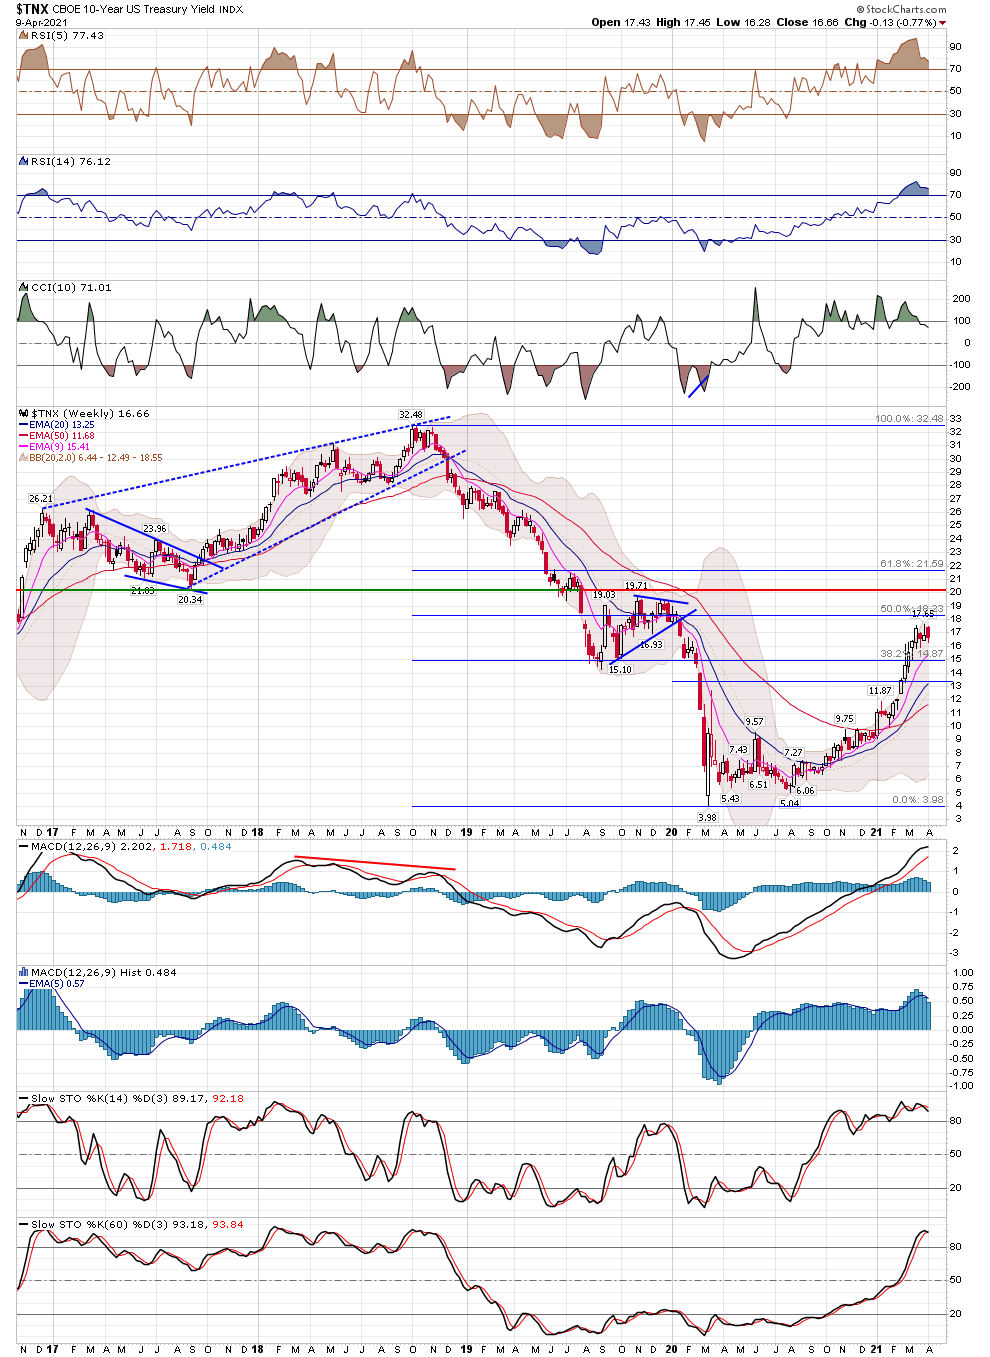
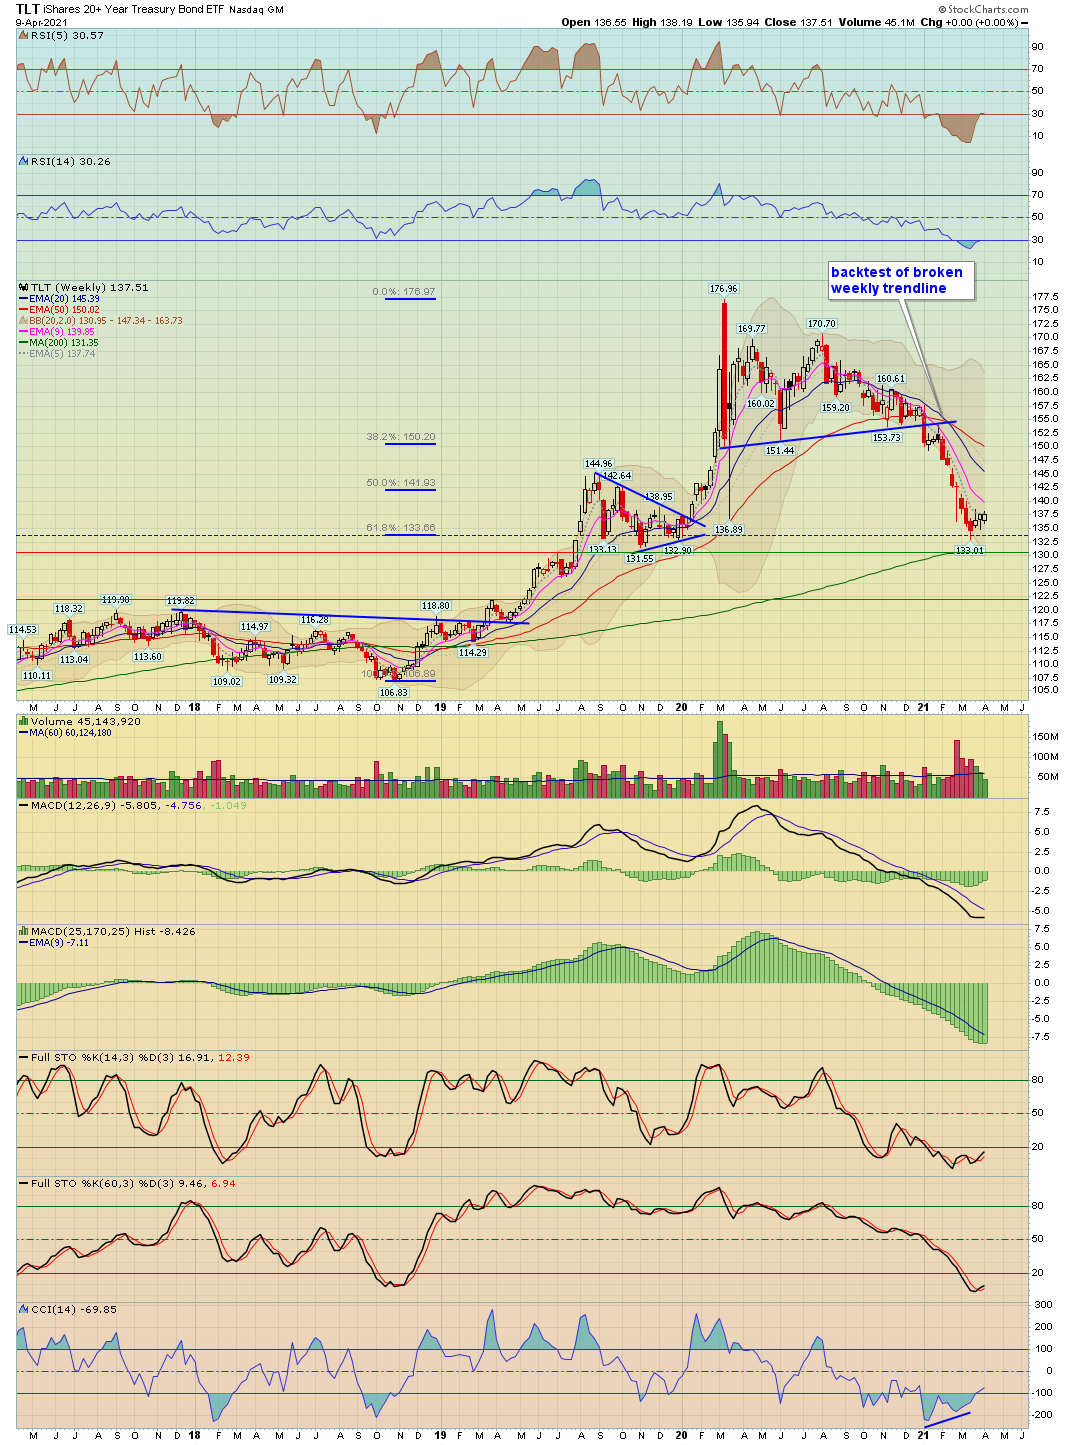
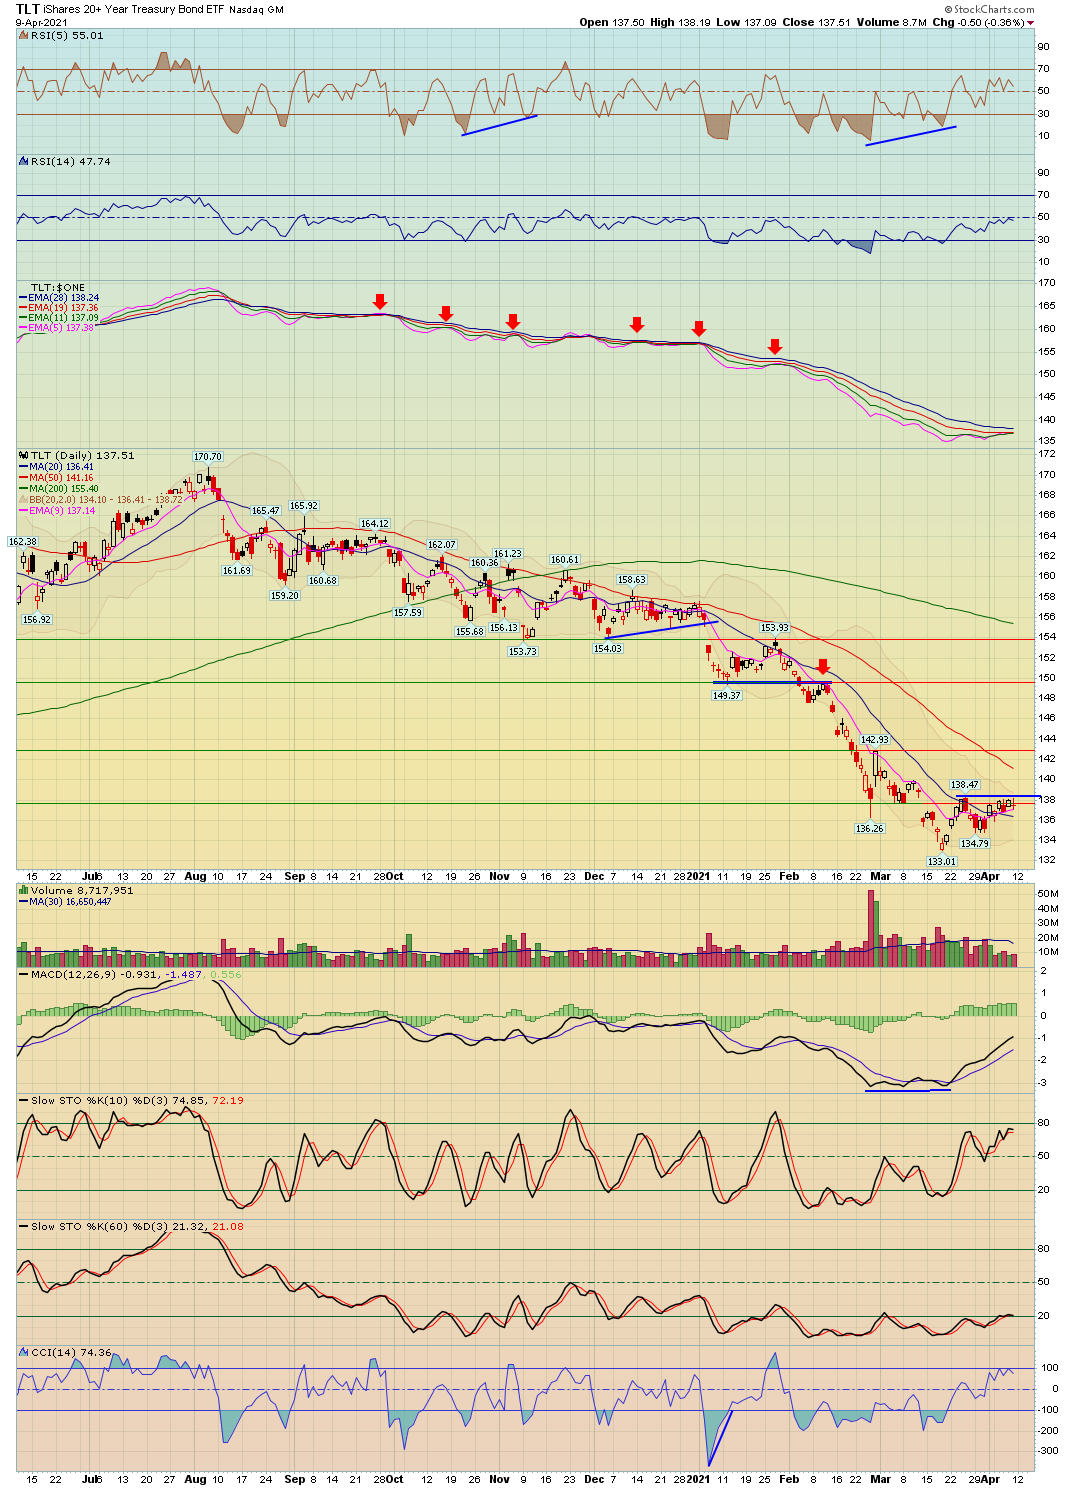
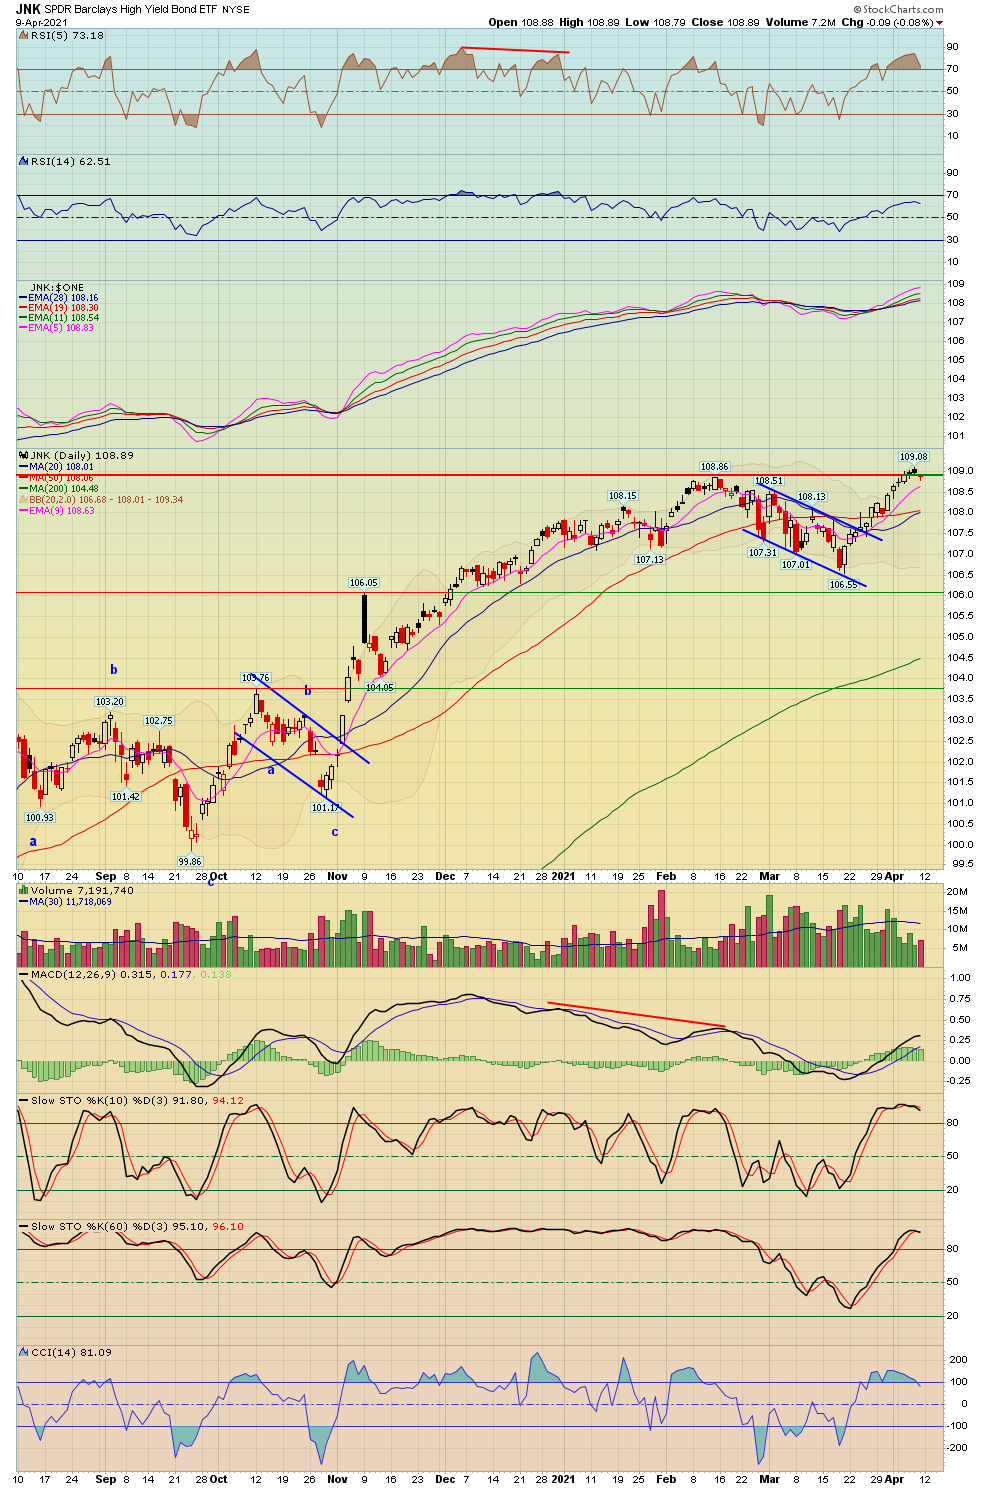
- Indicators and Bonds (TLT/JNK)
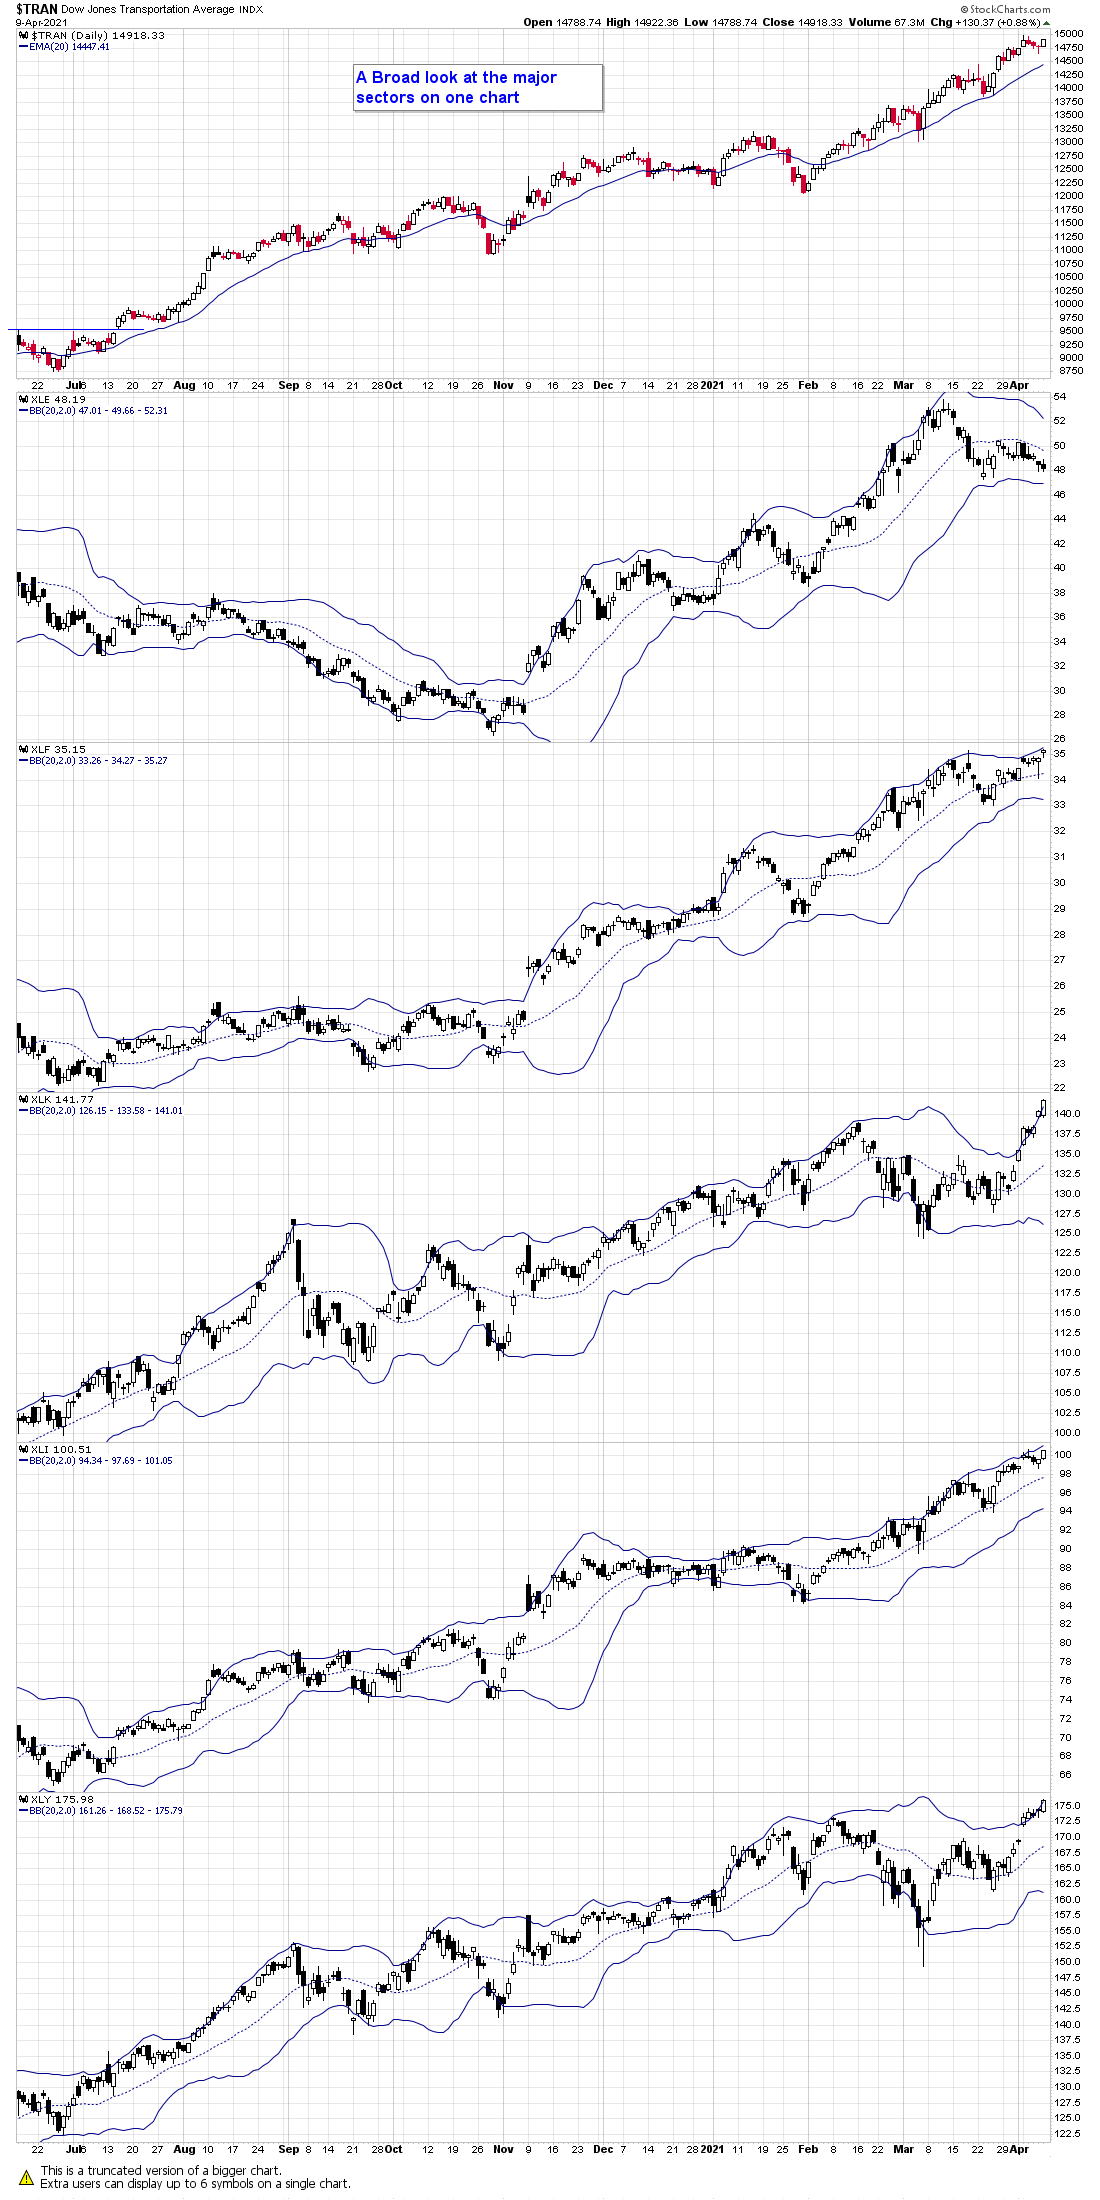
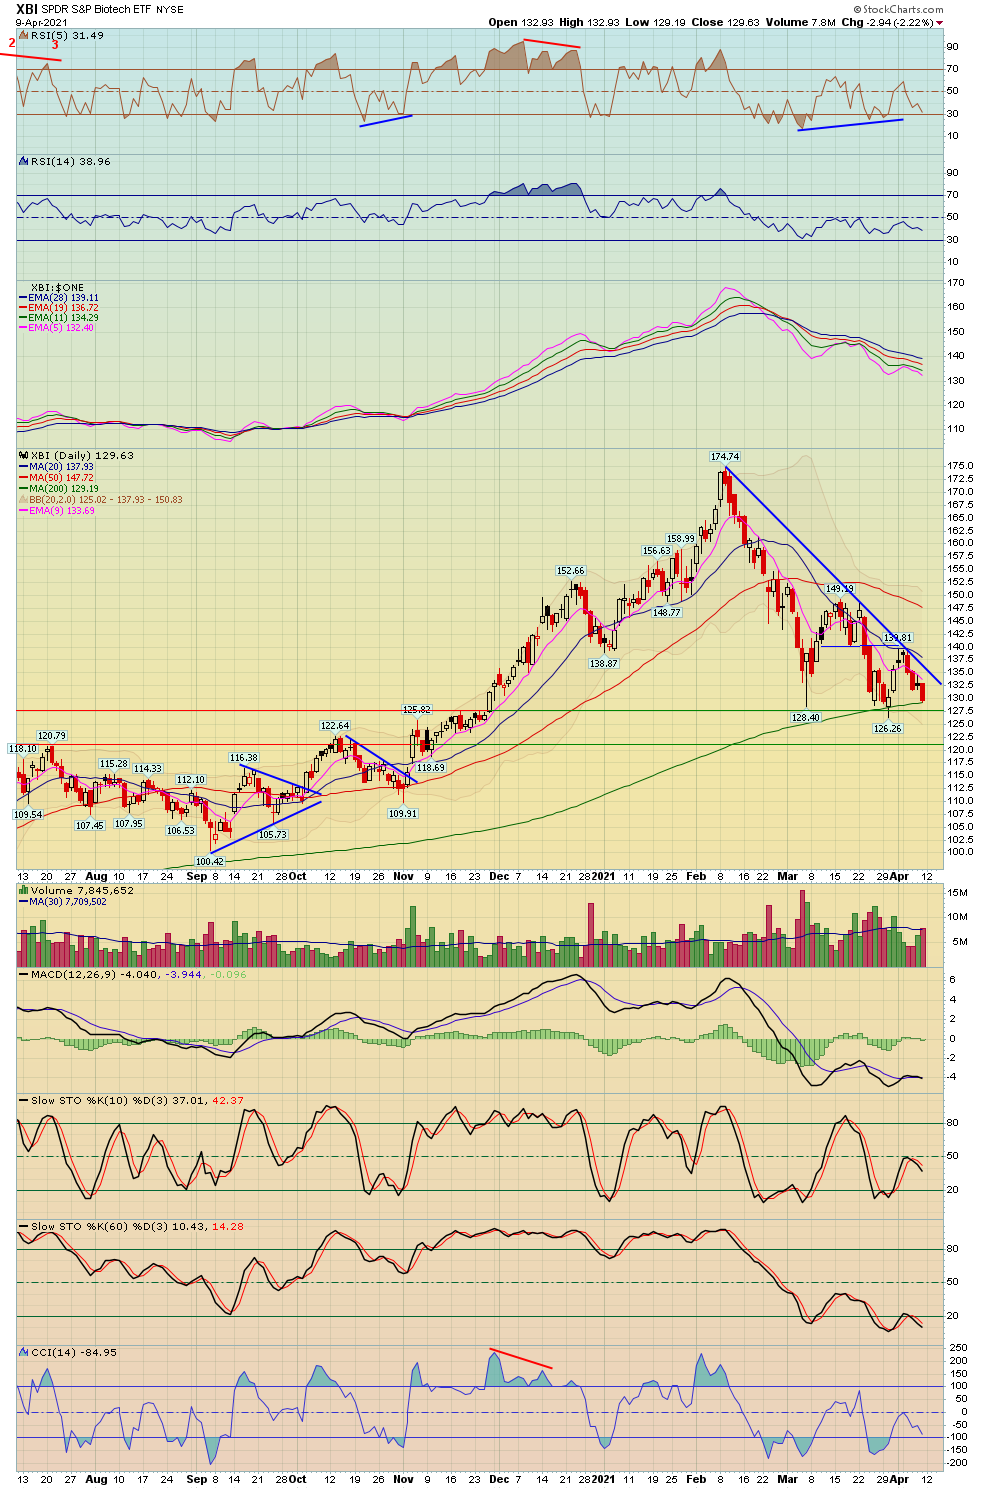
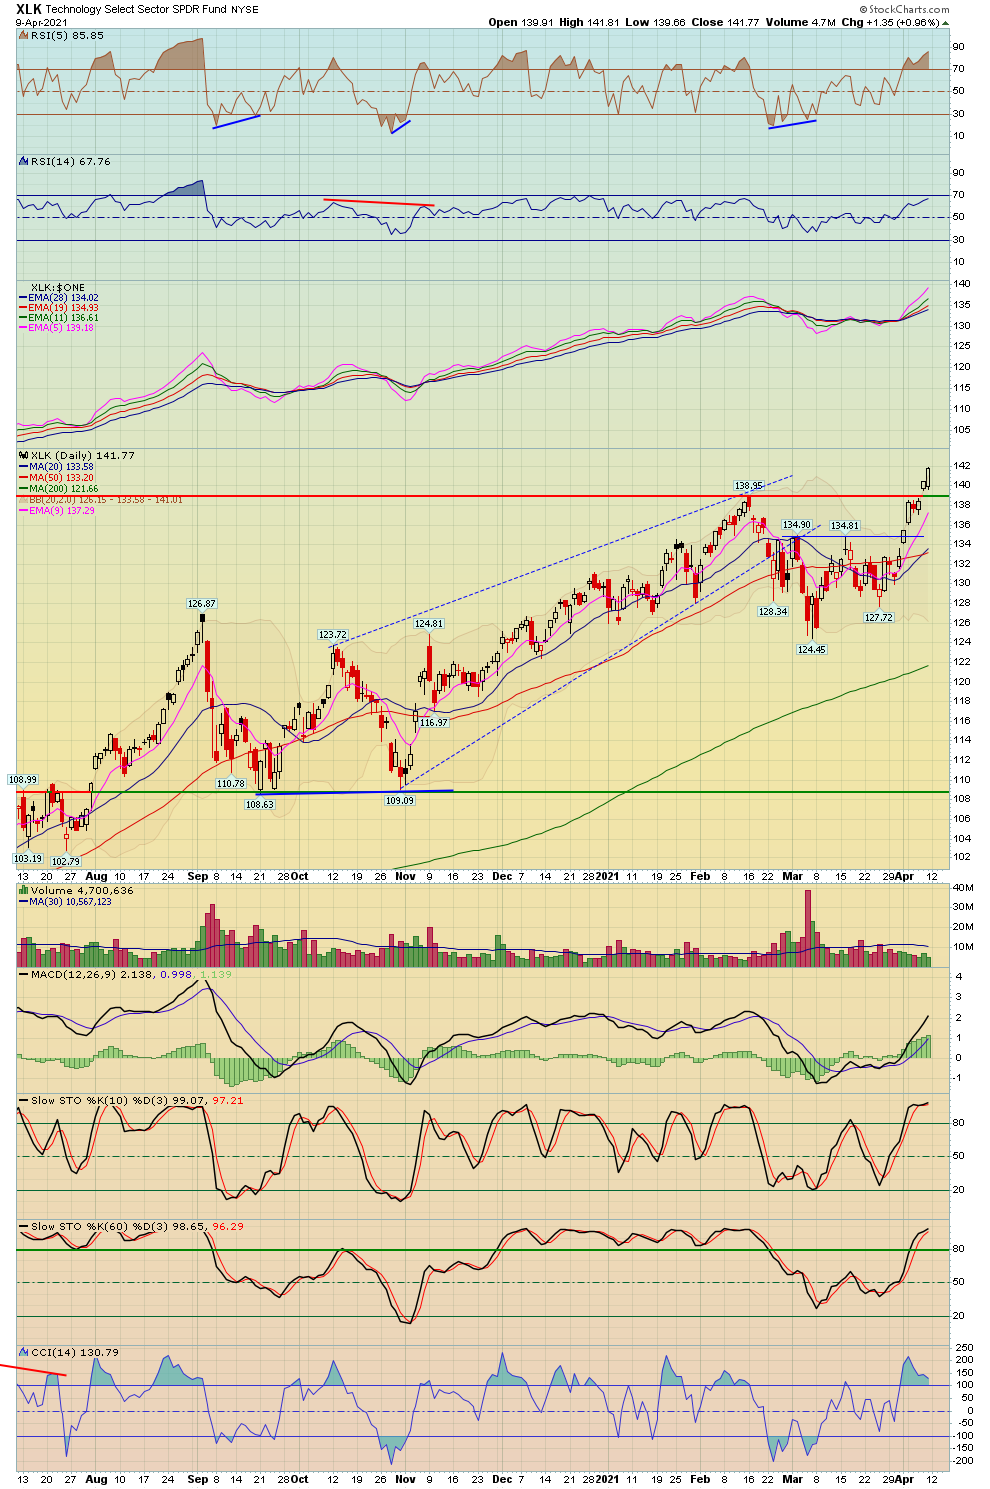
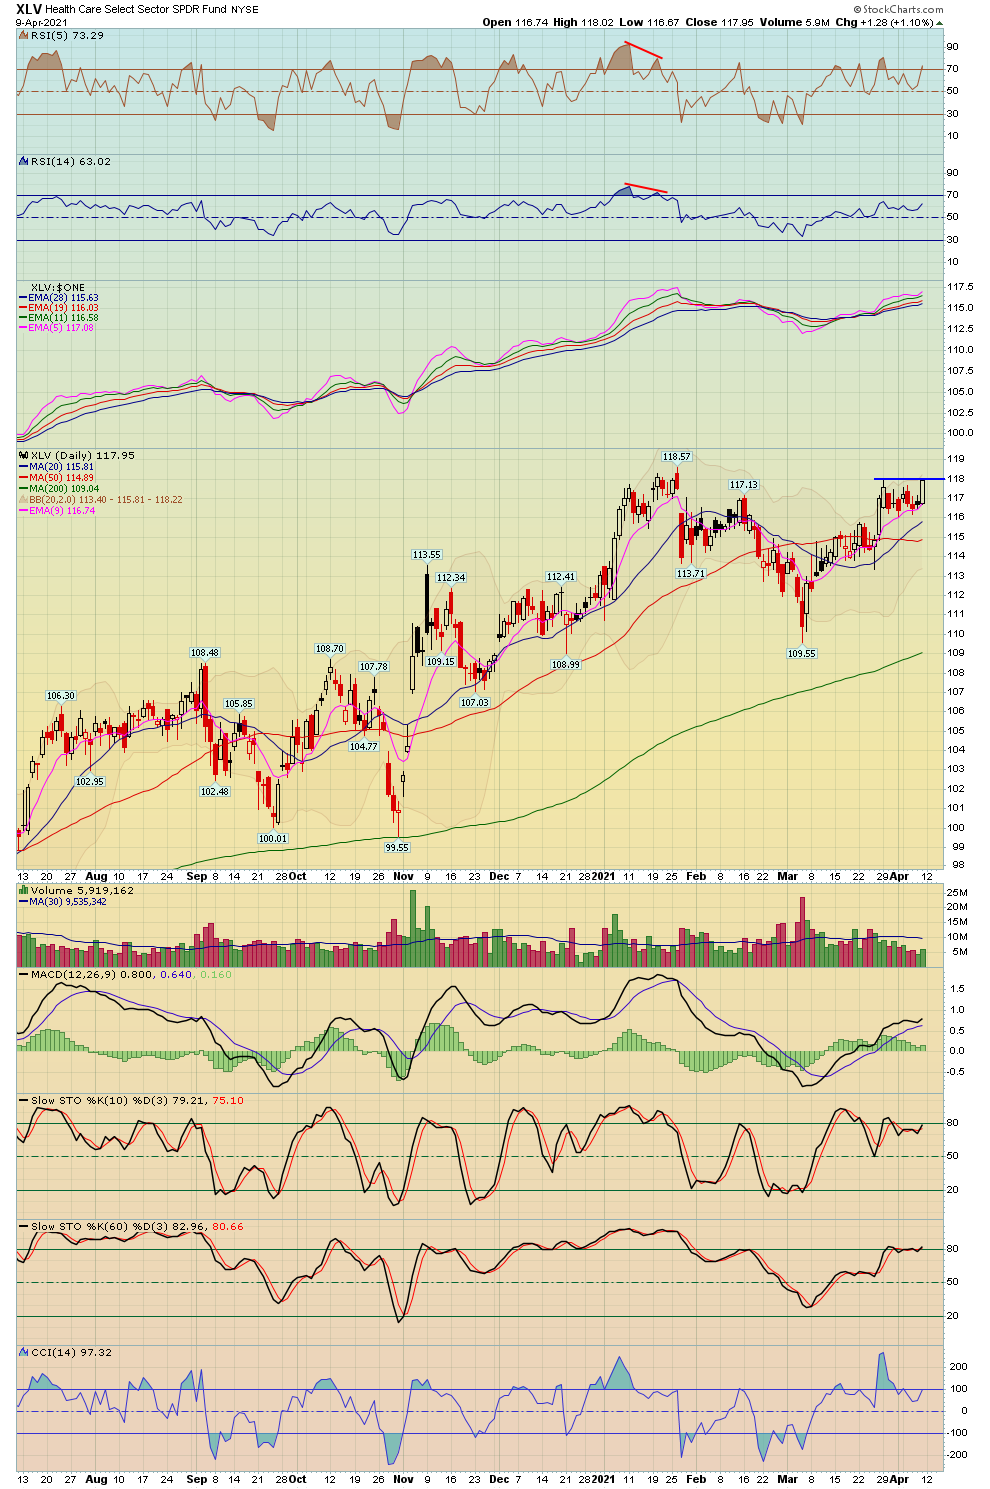
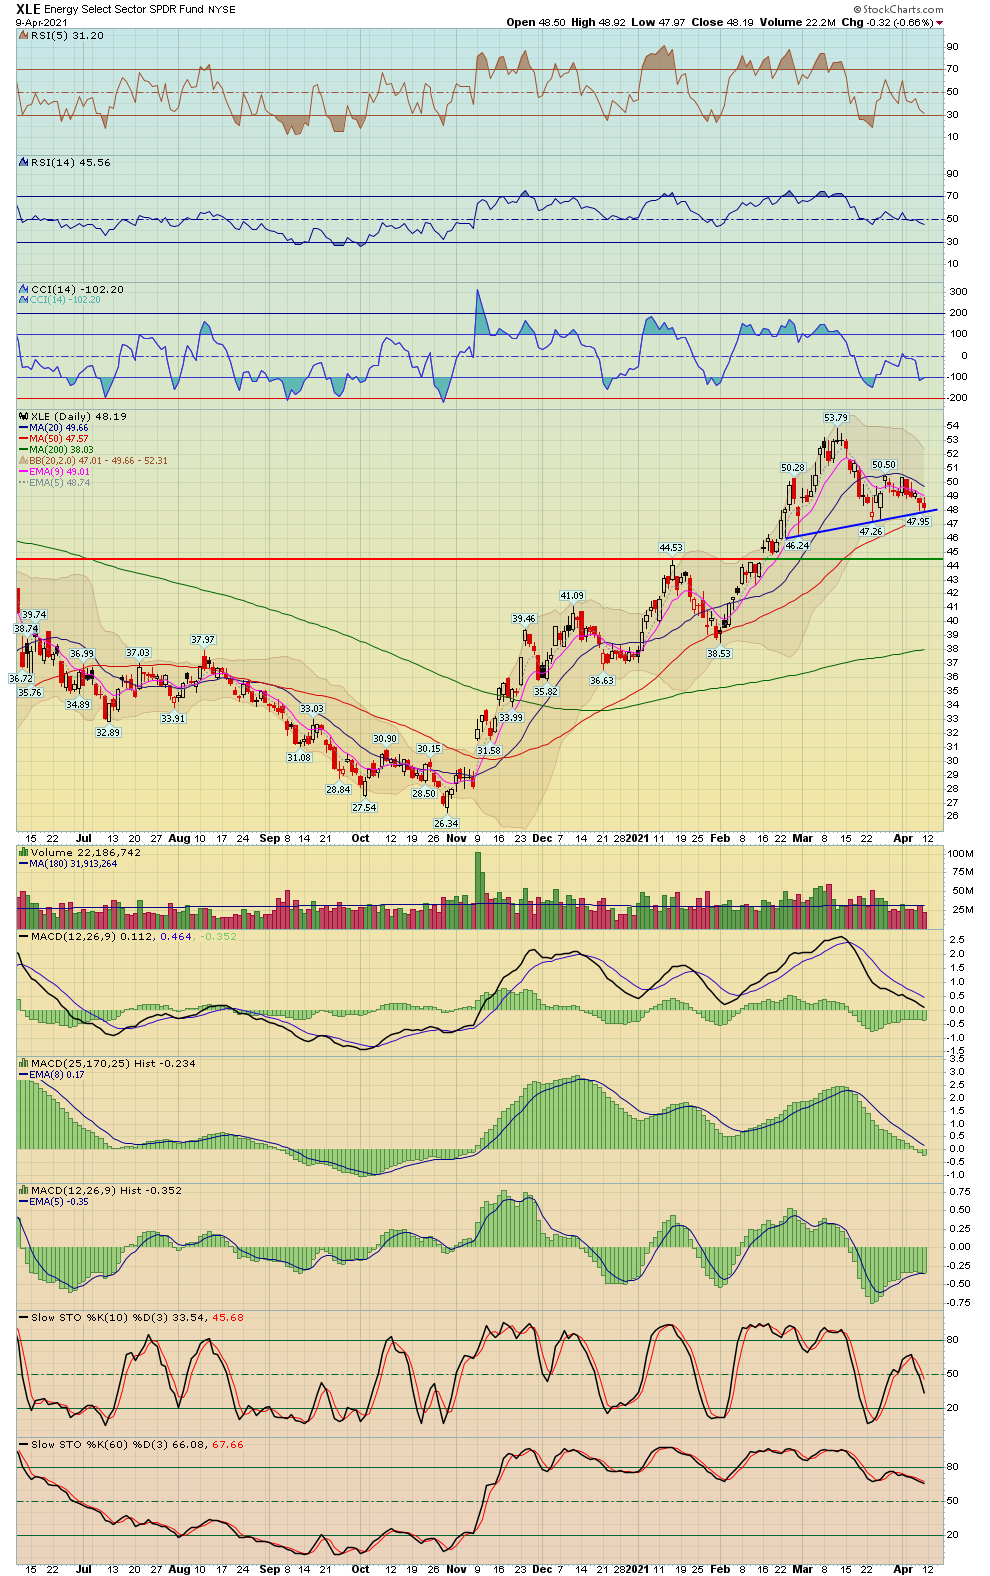
- Major Sectors
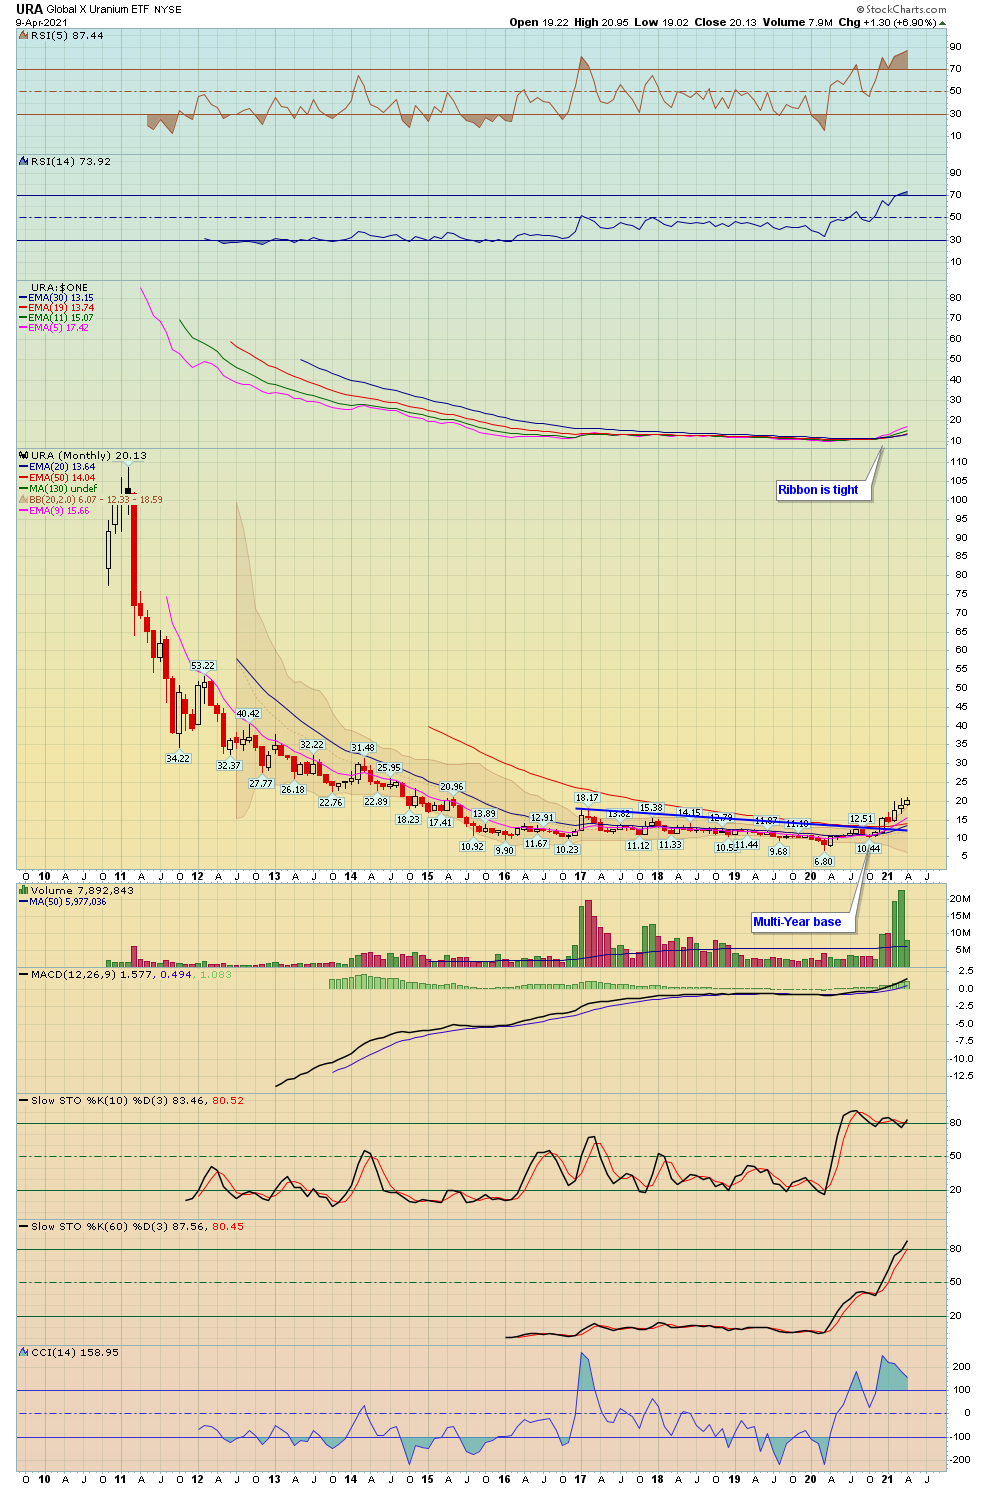
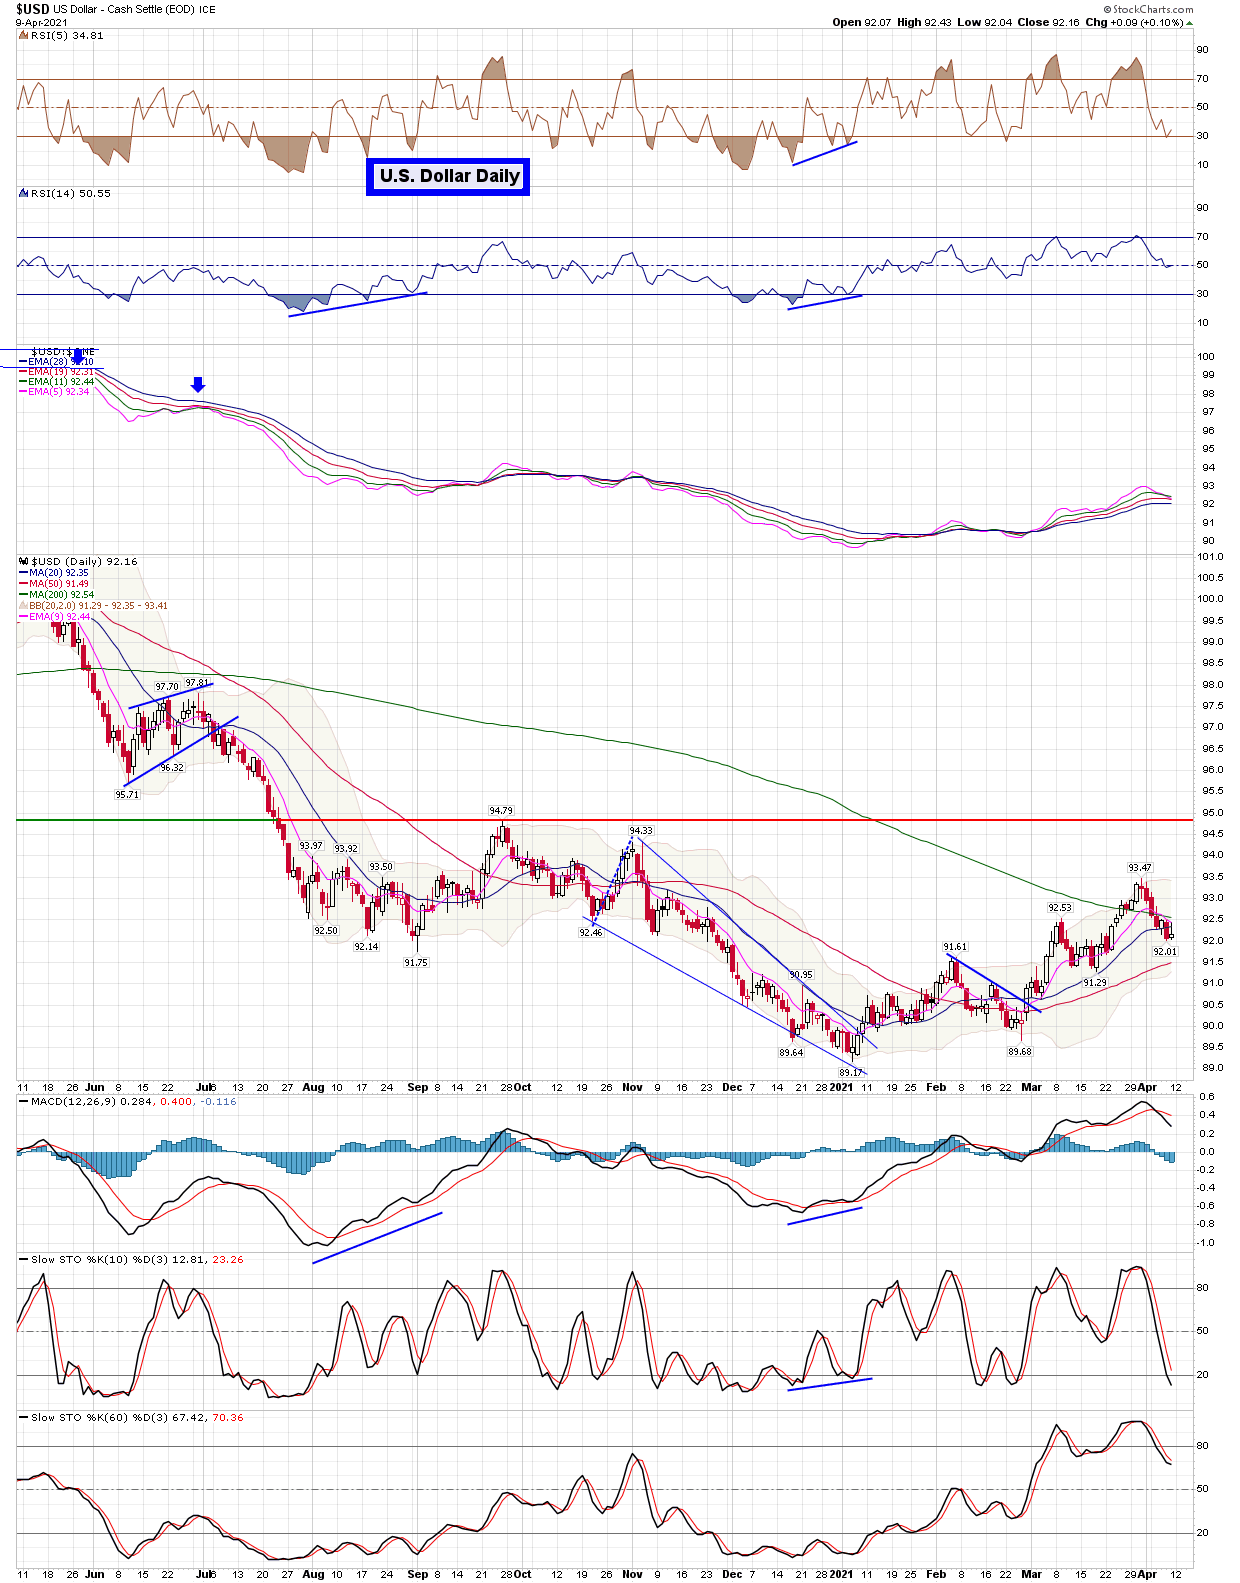
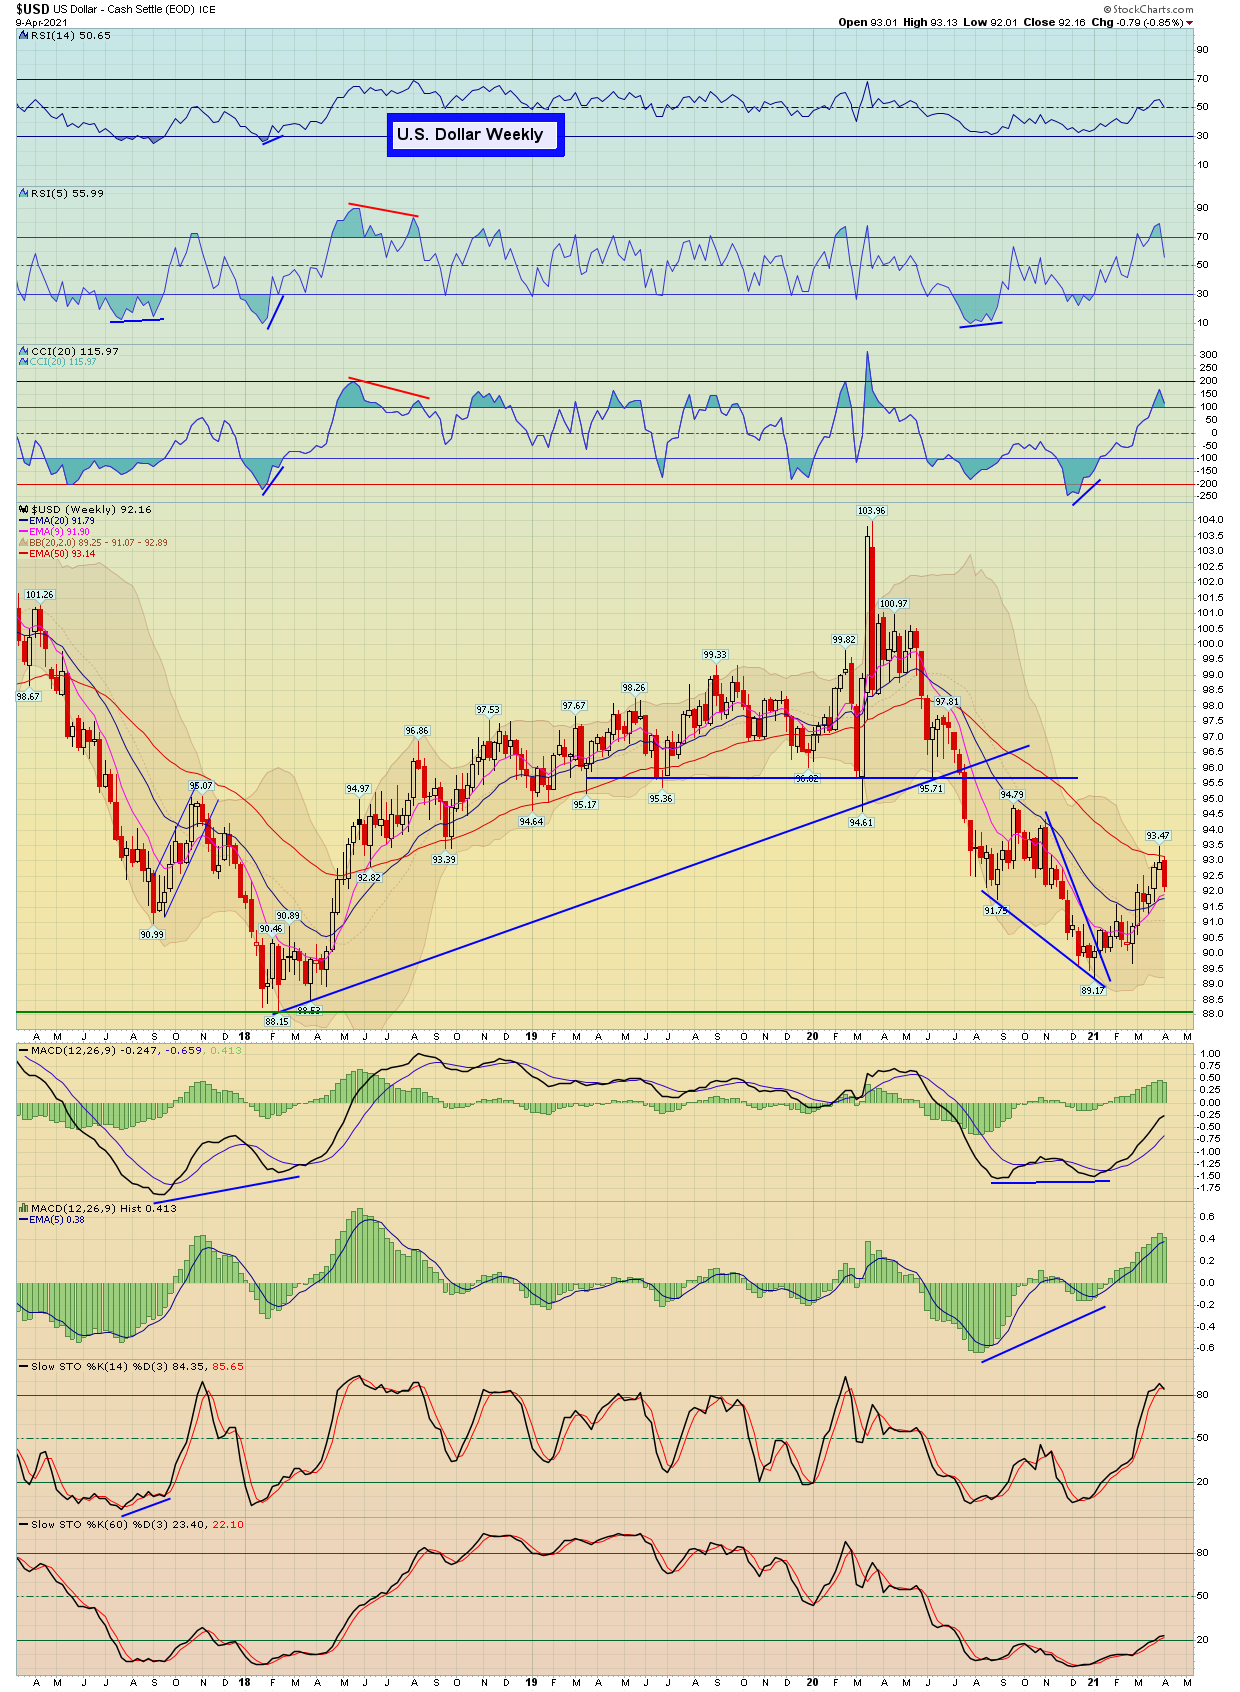
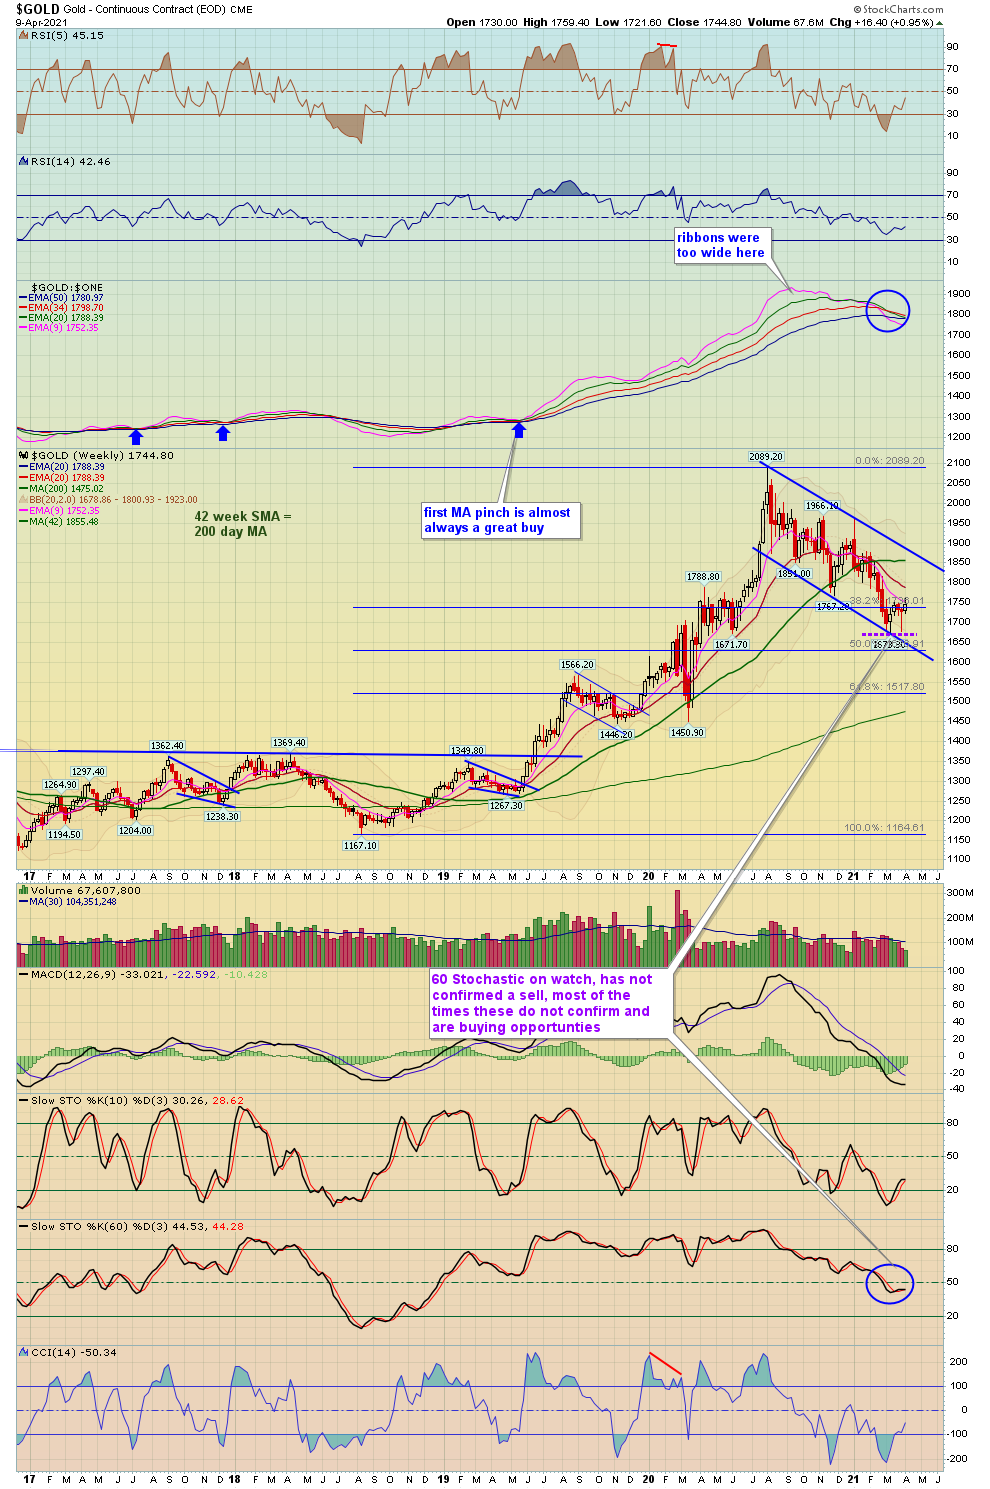
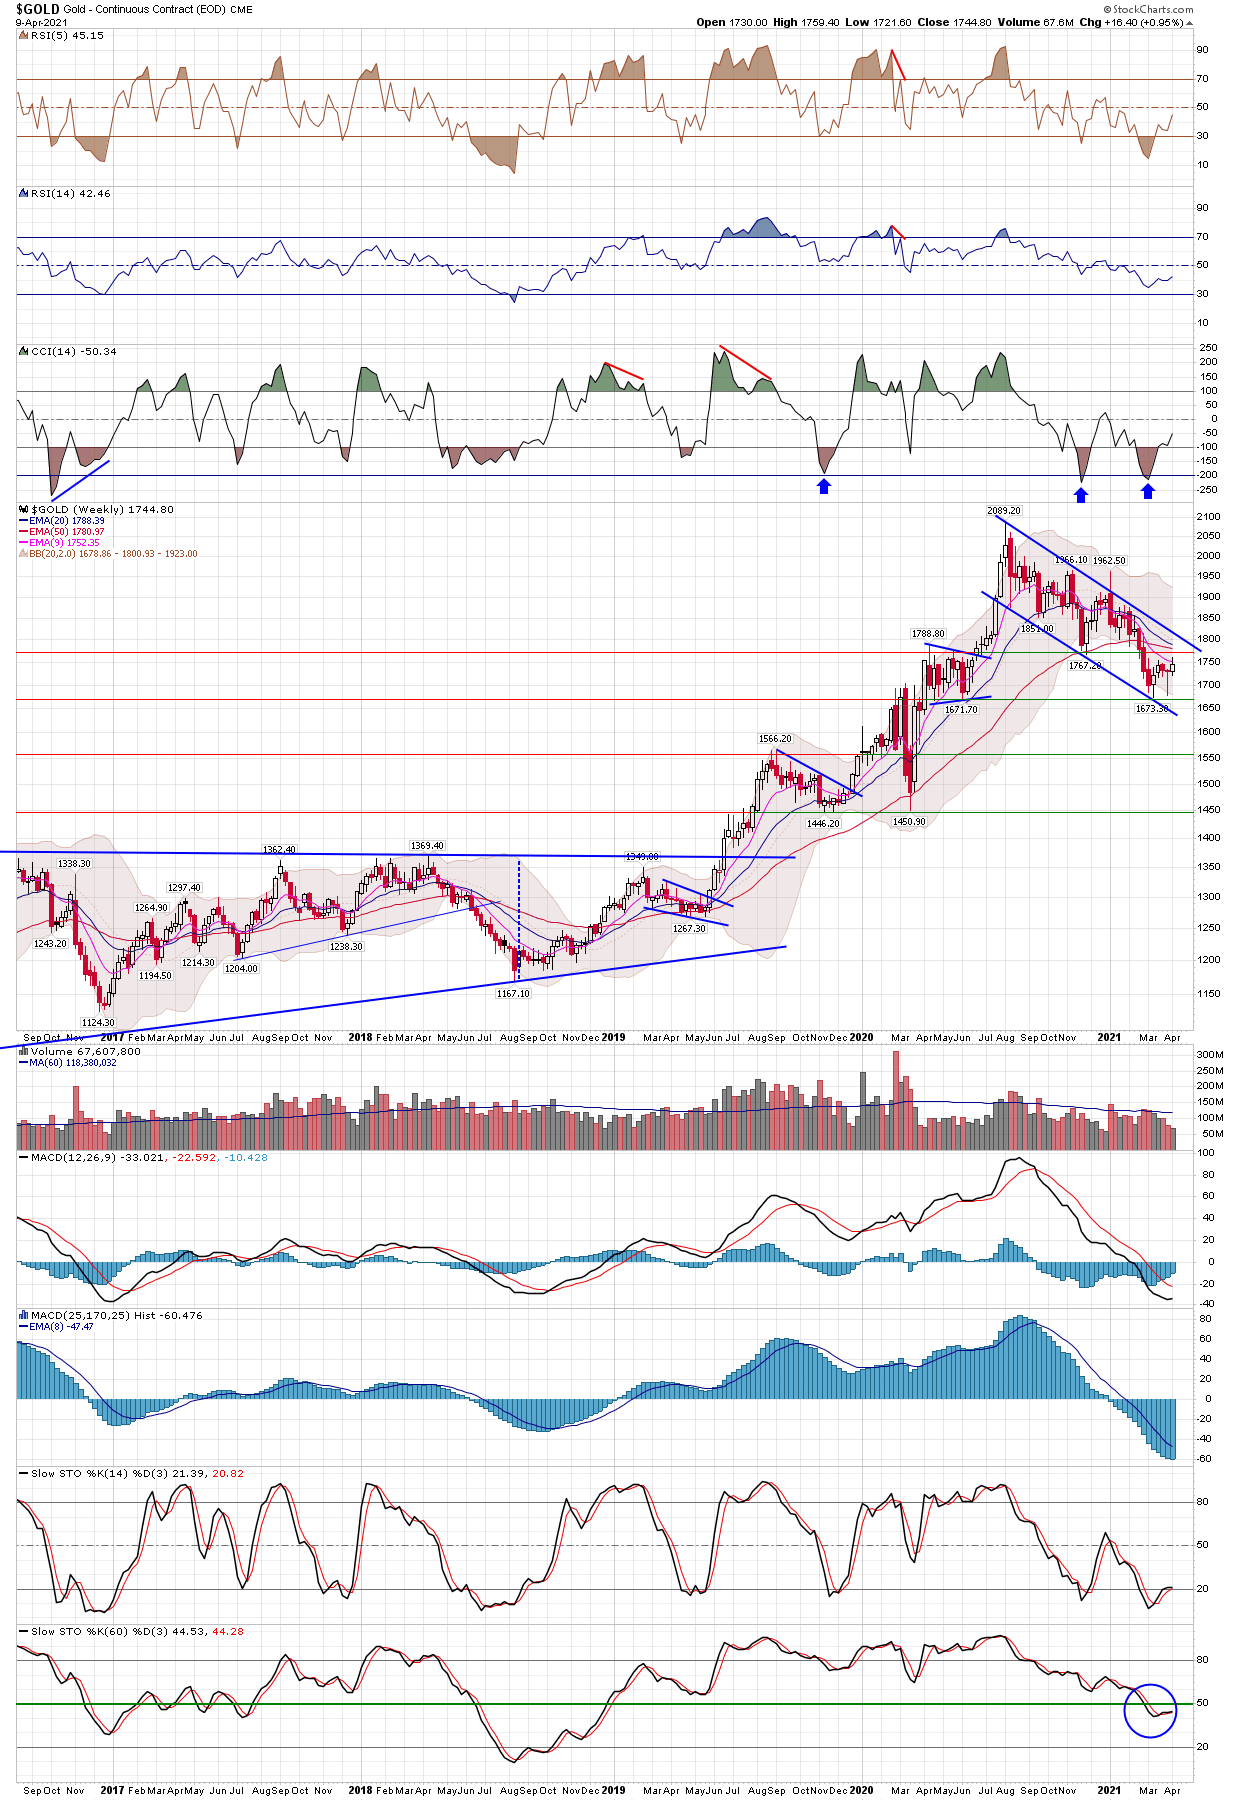
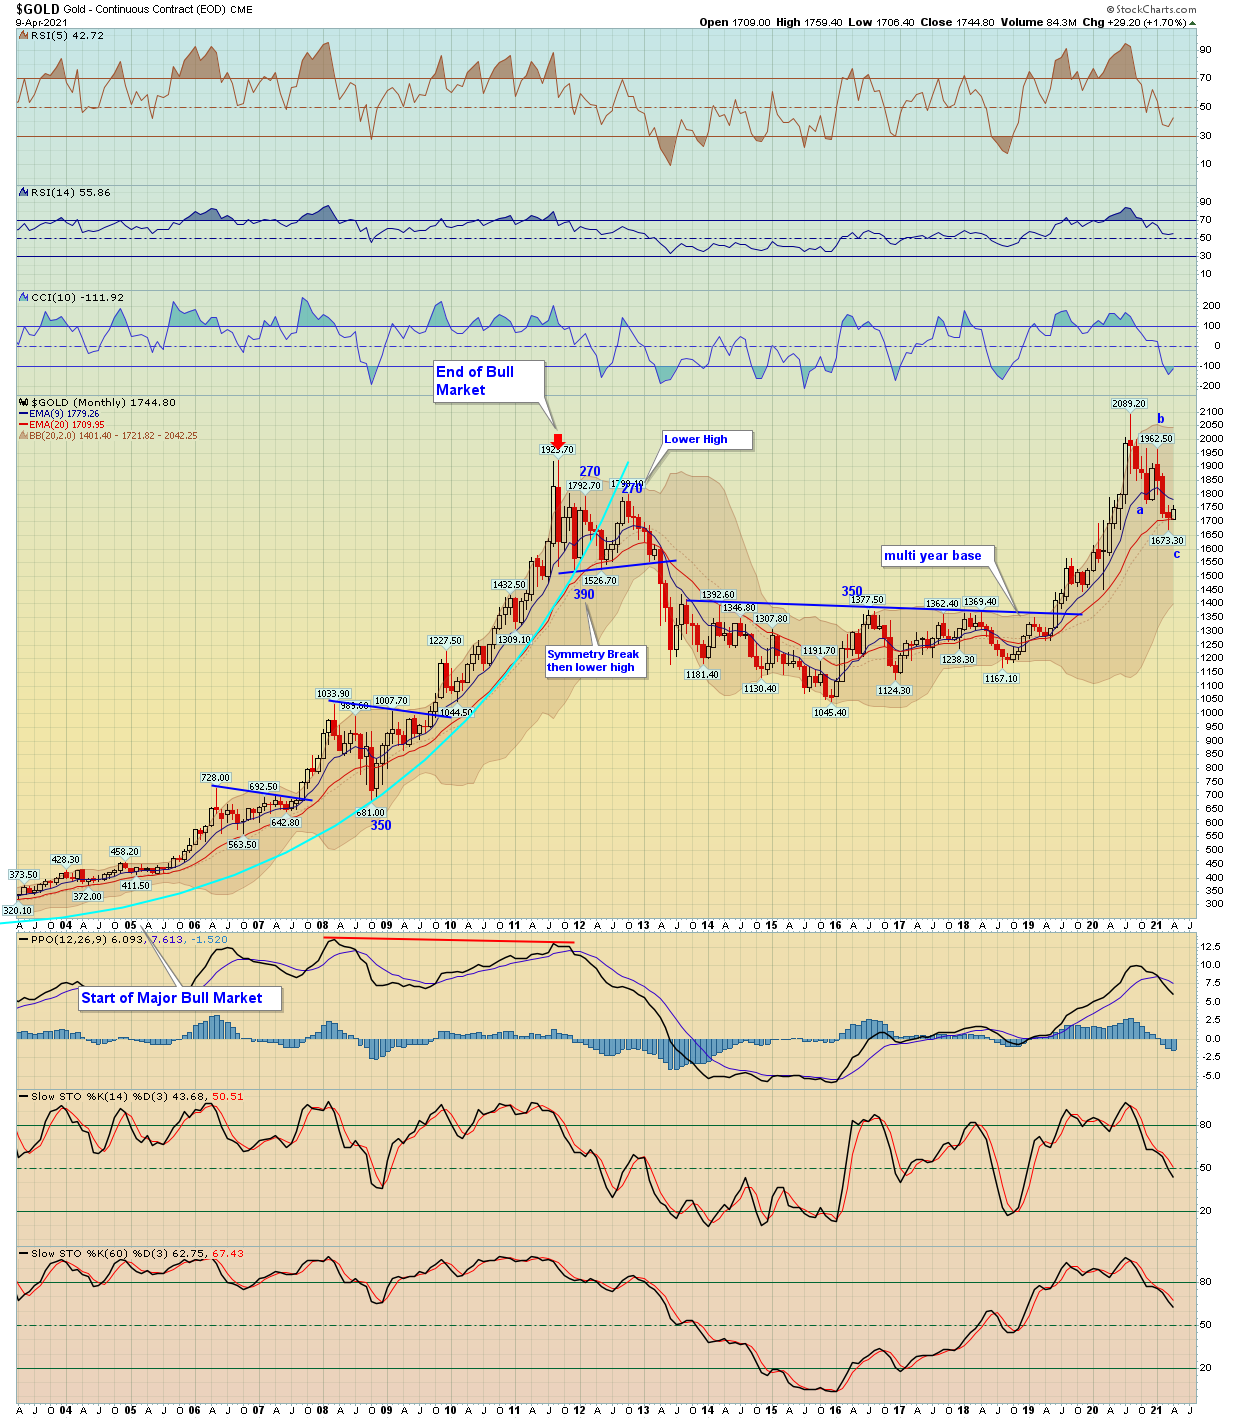
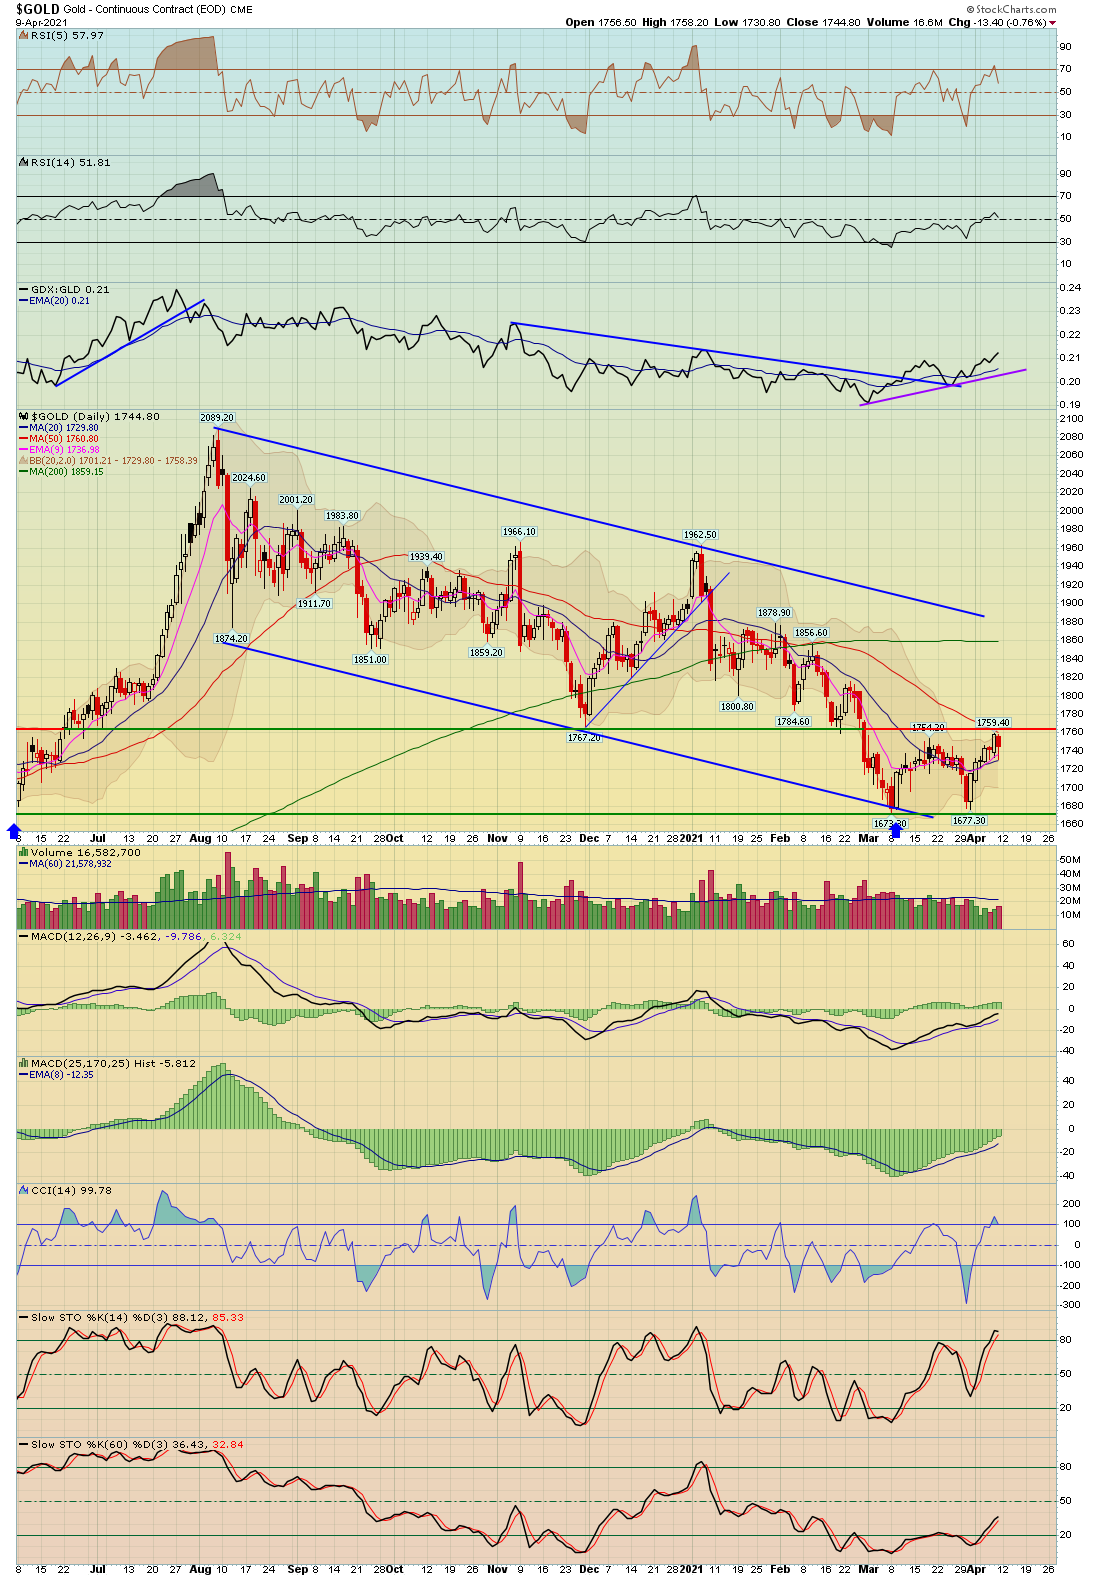
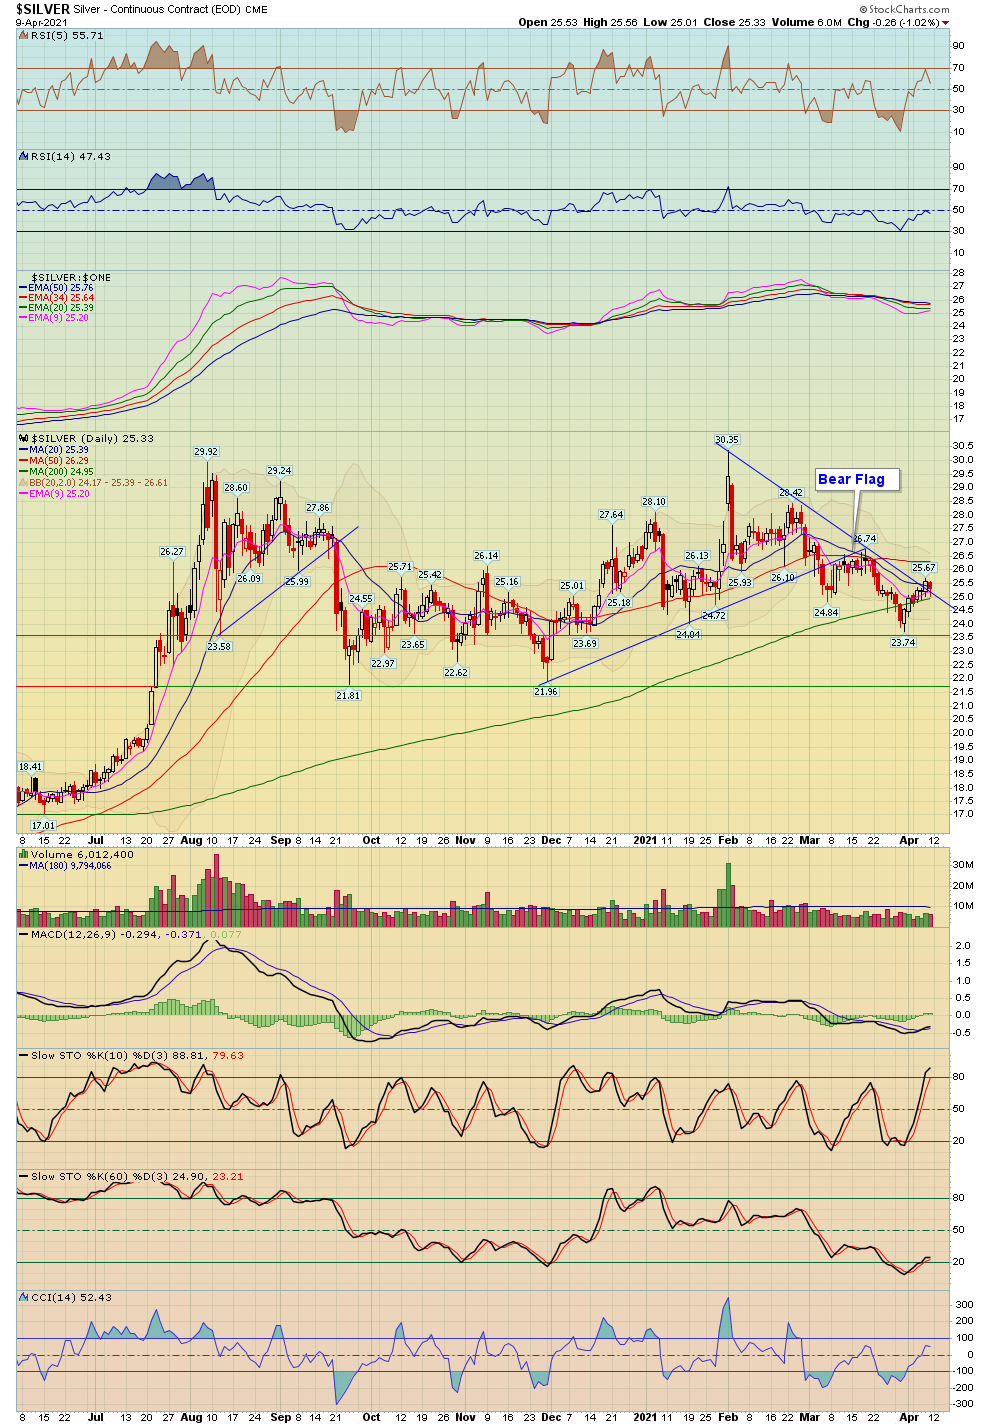
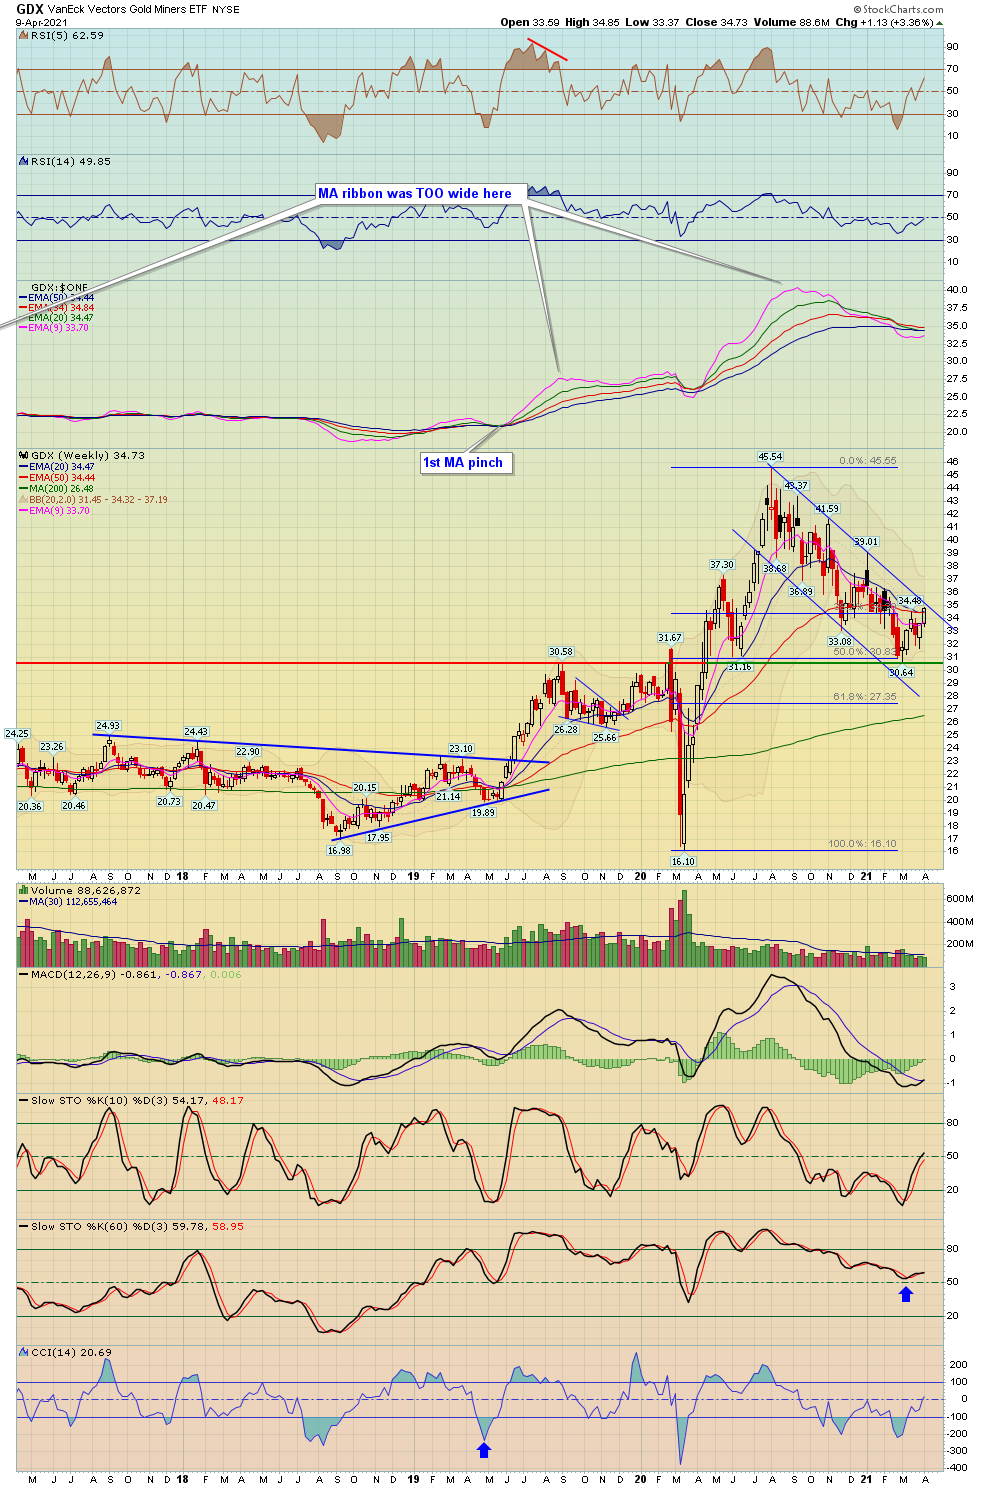
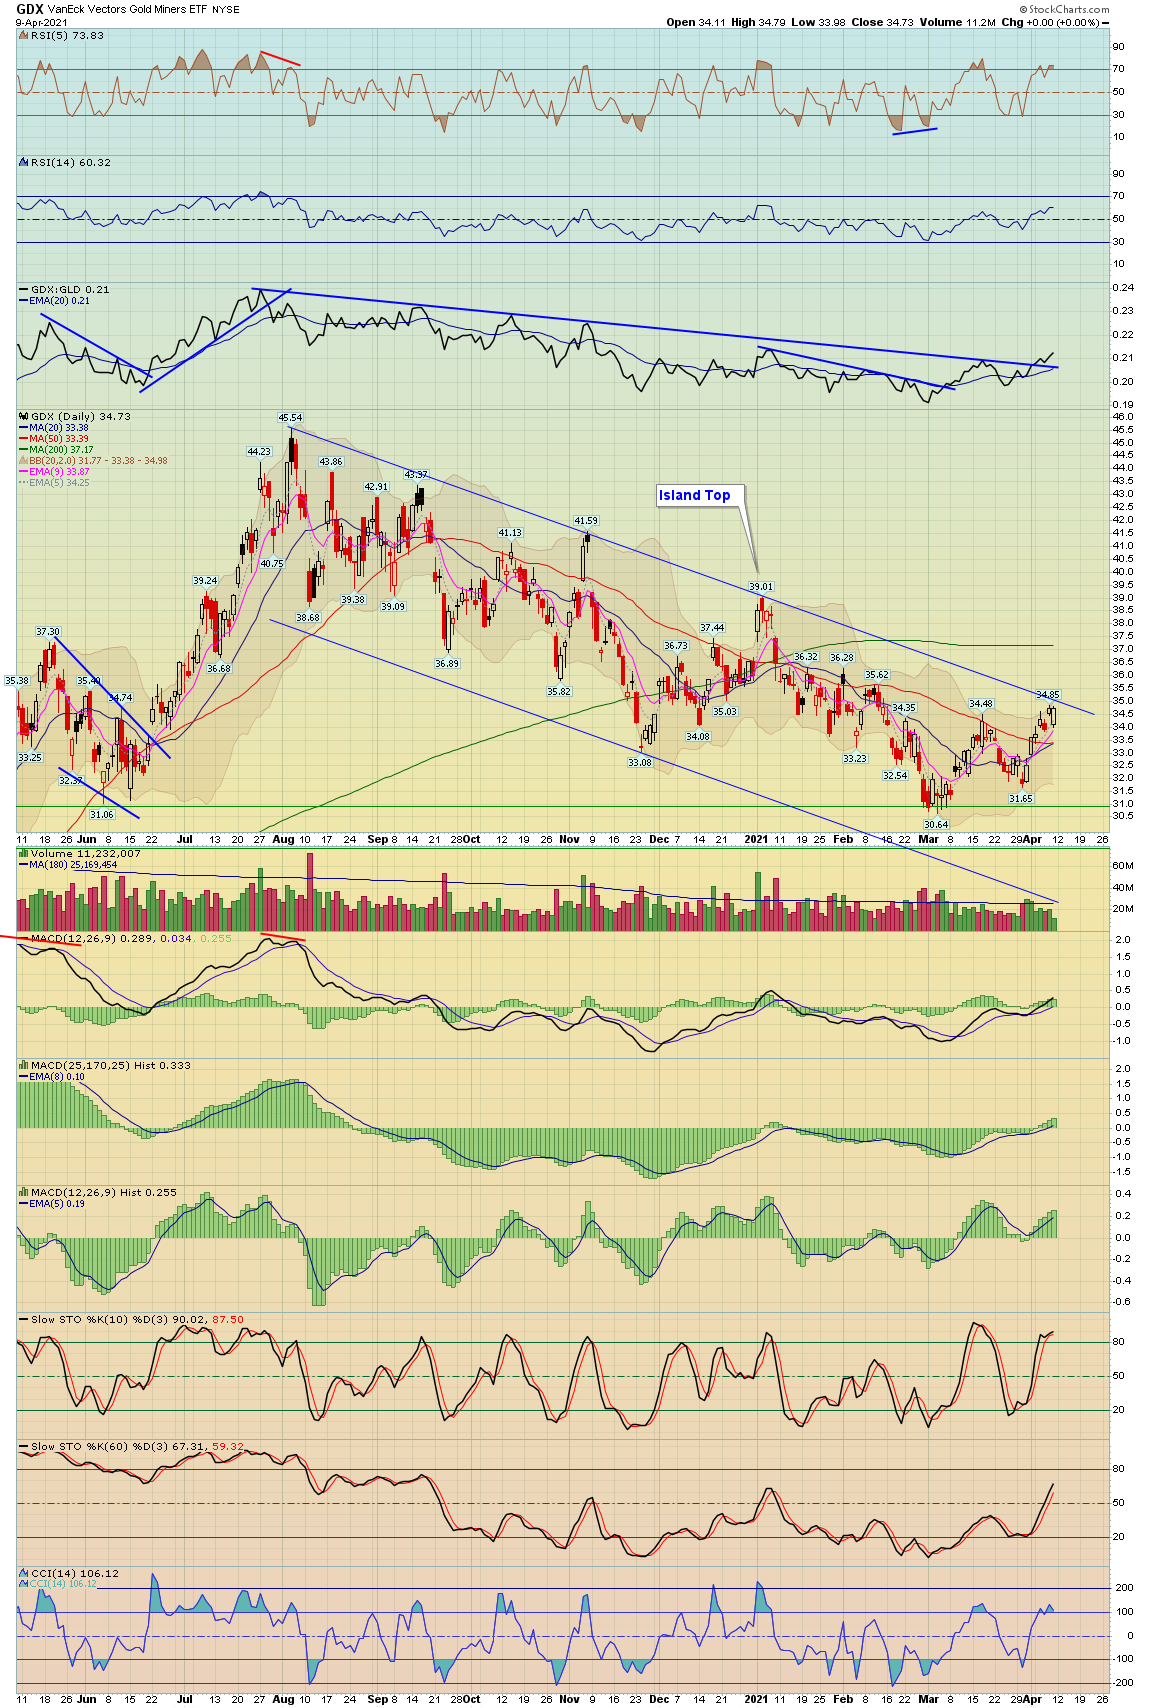
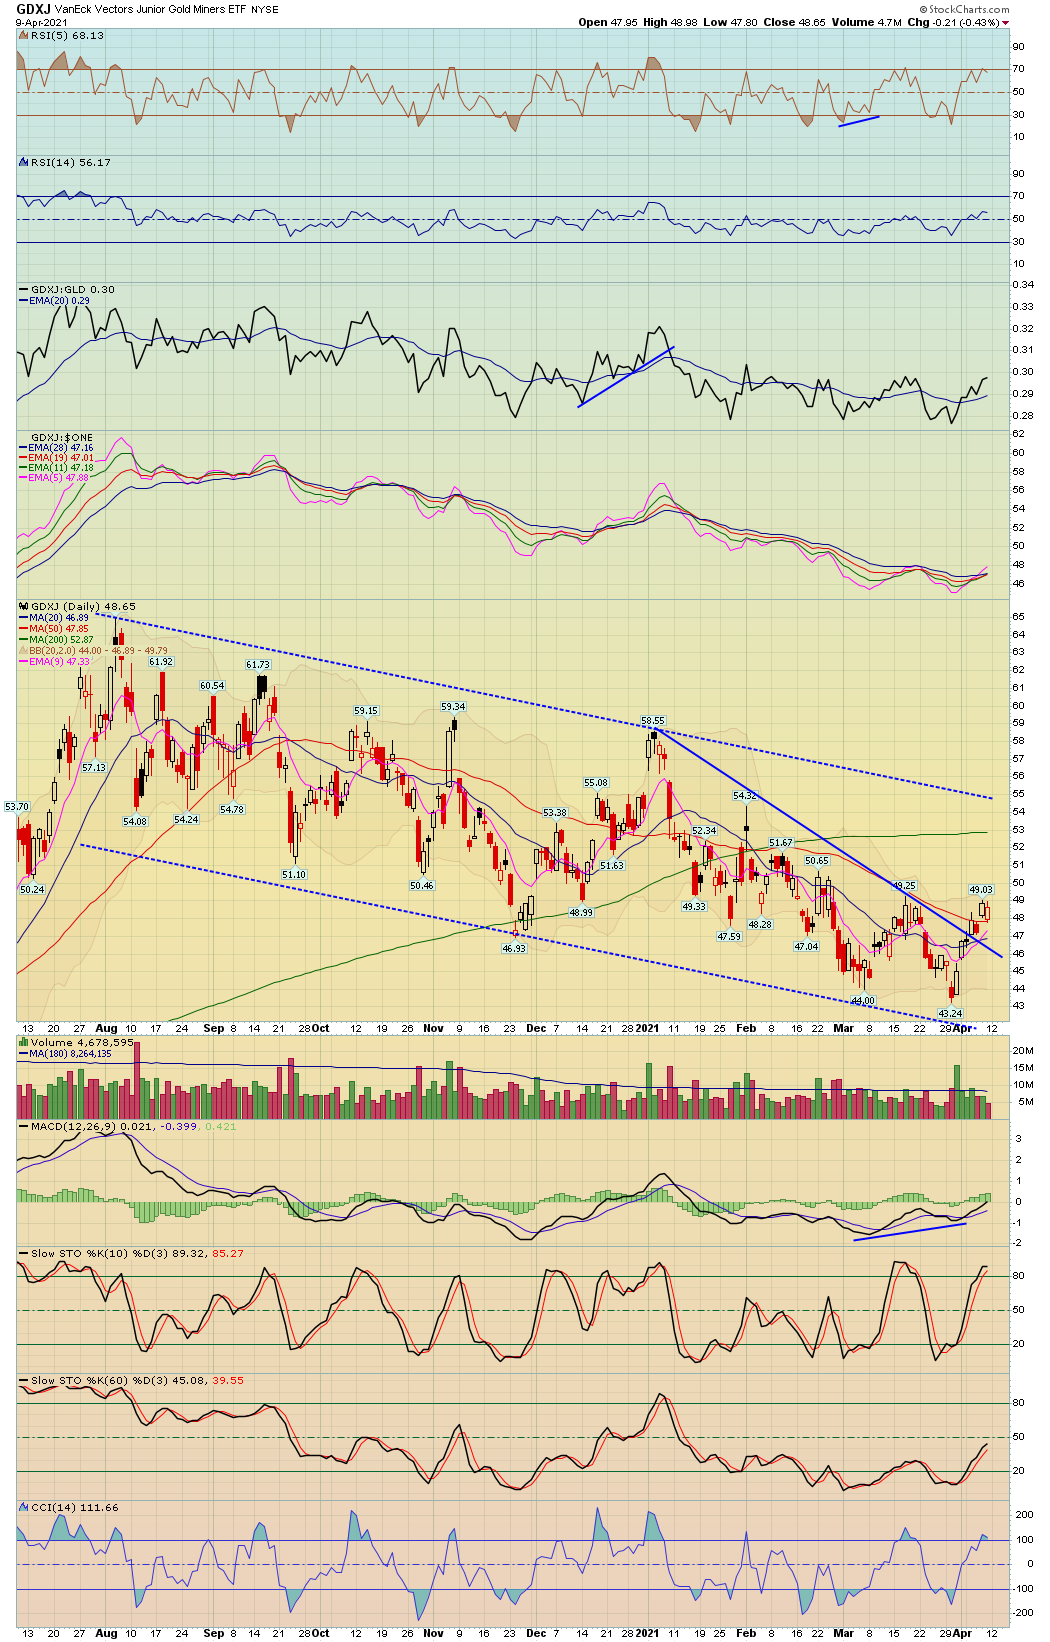
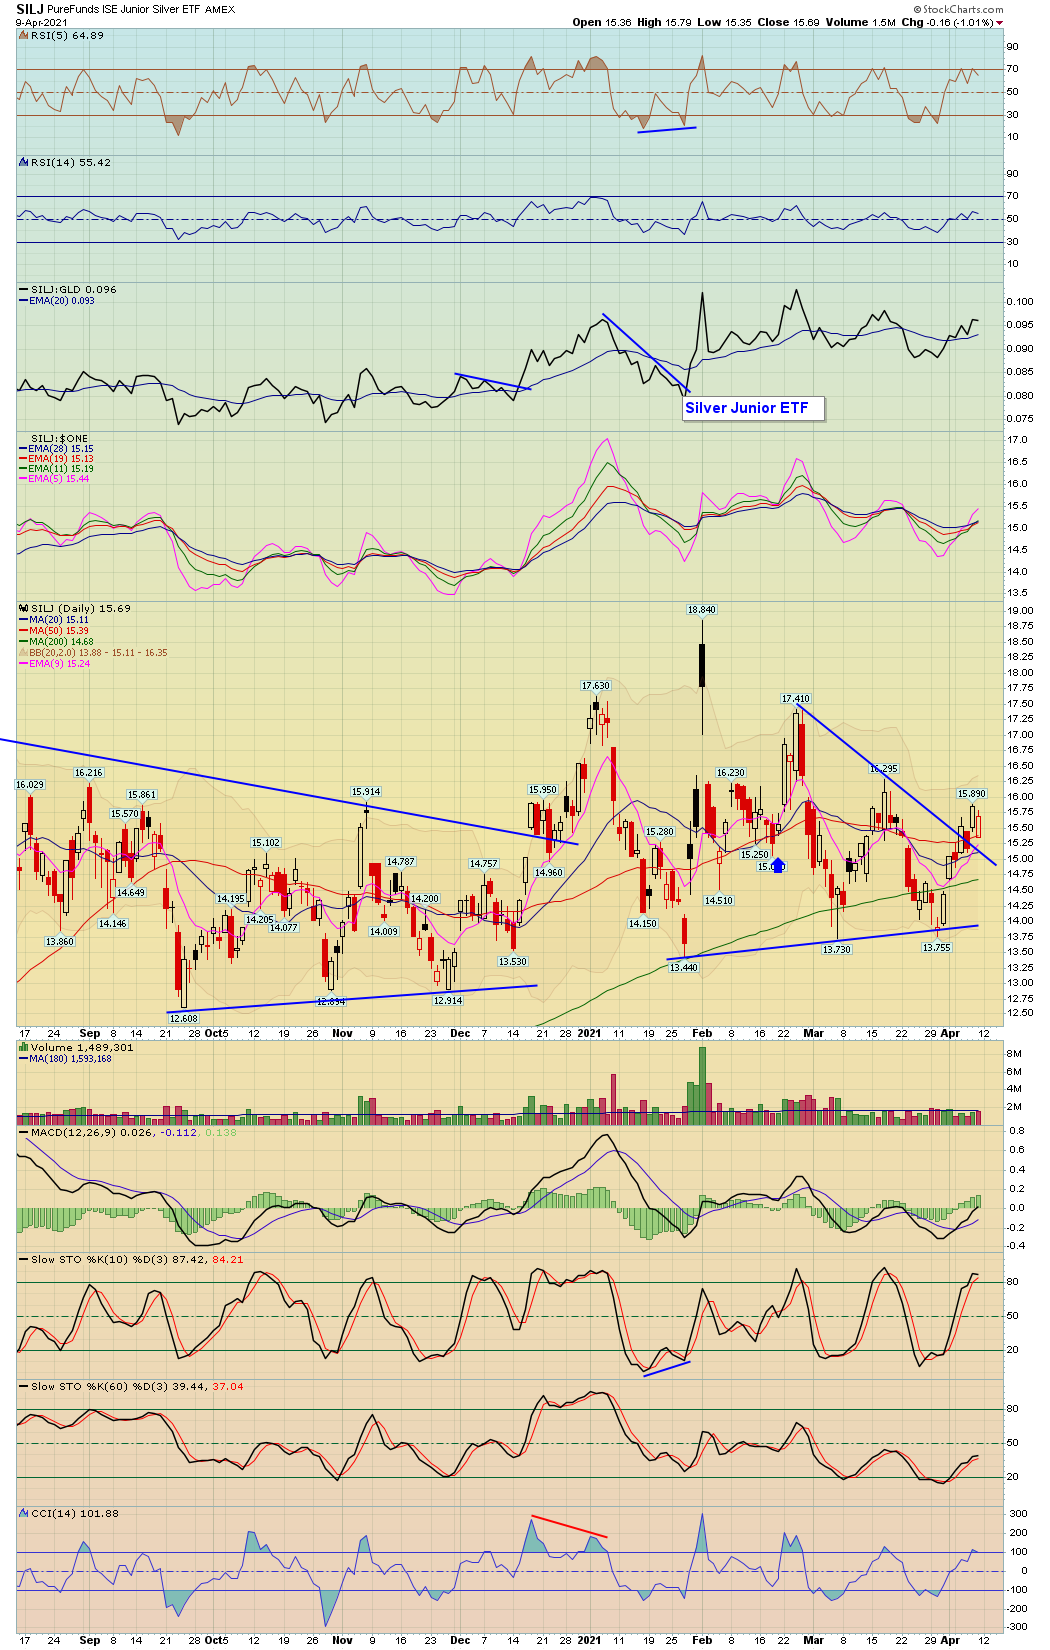
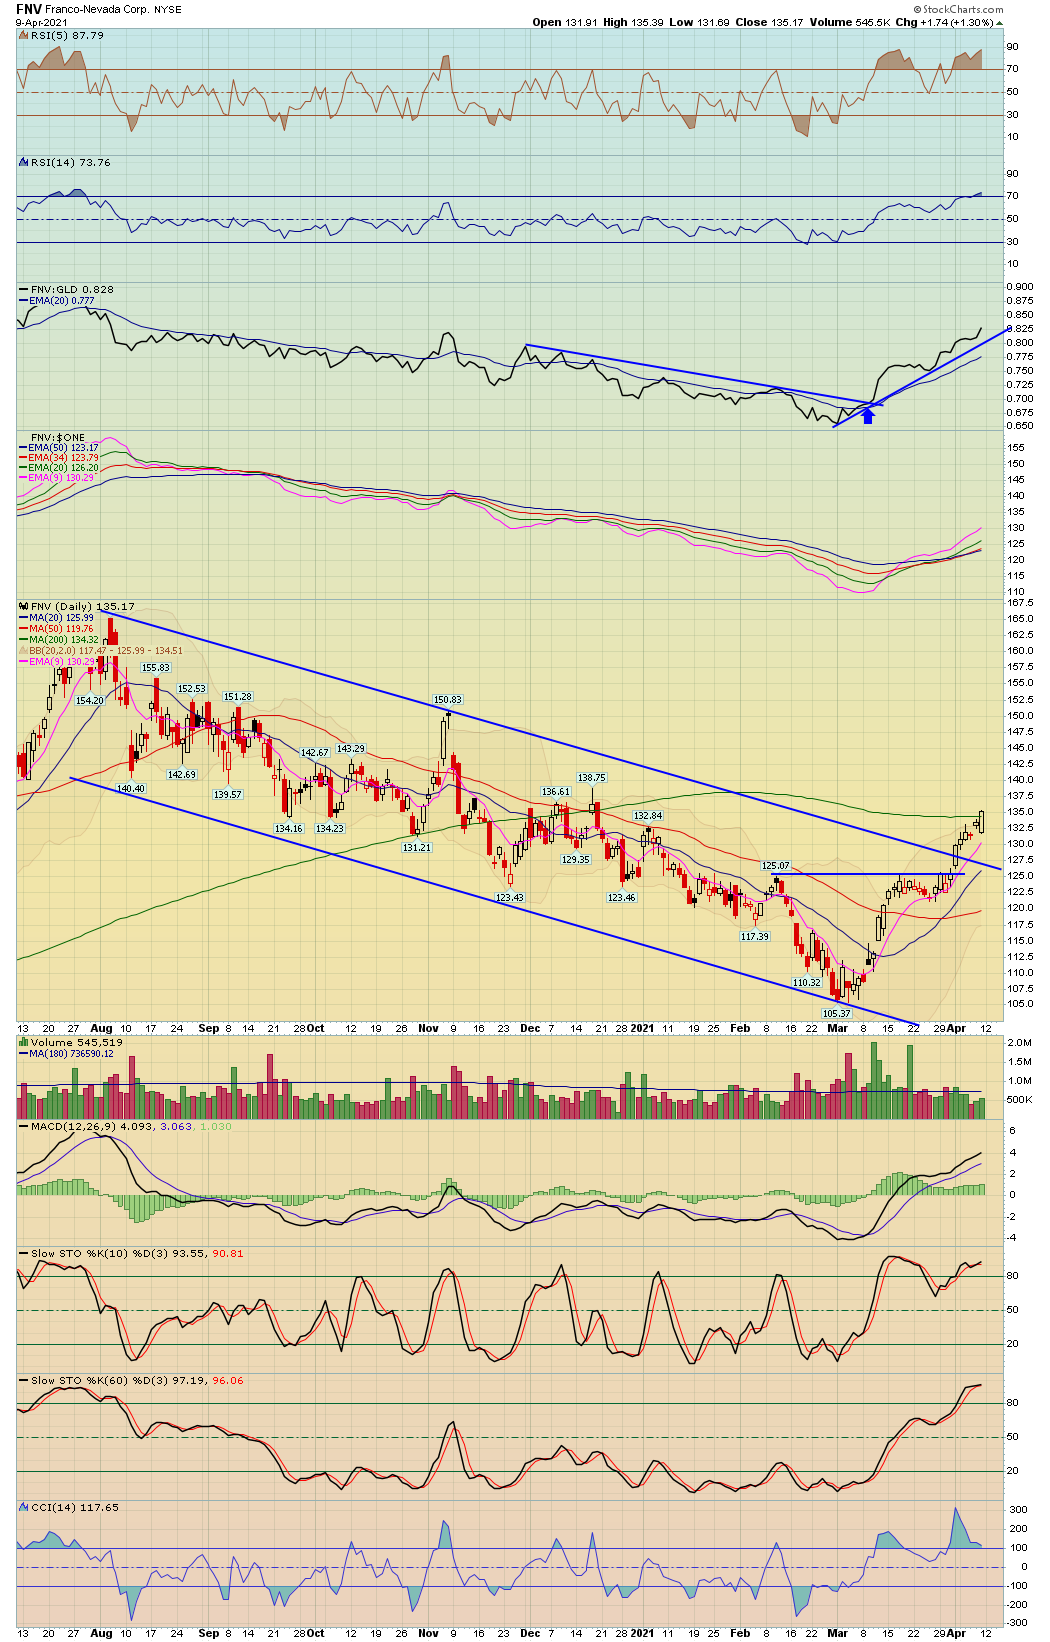
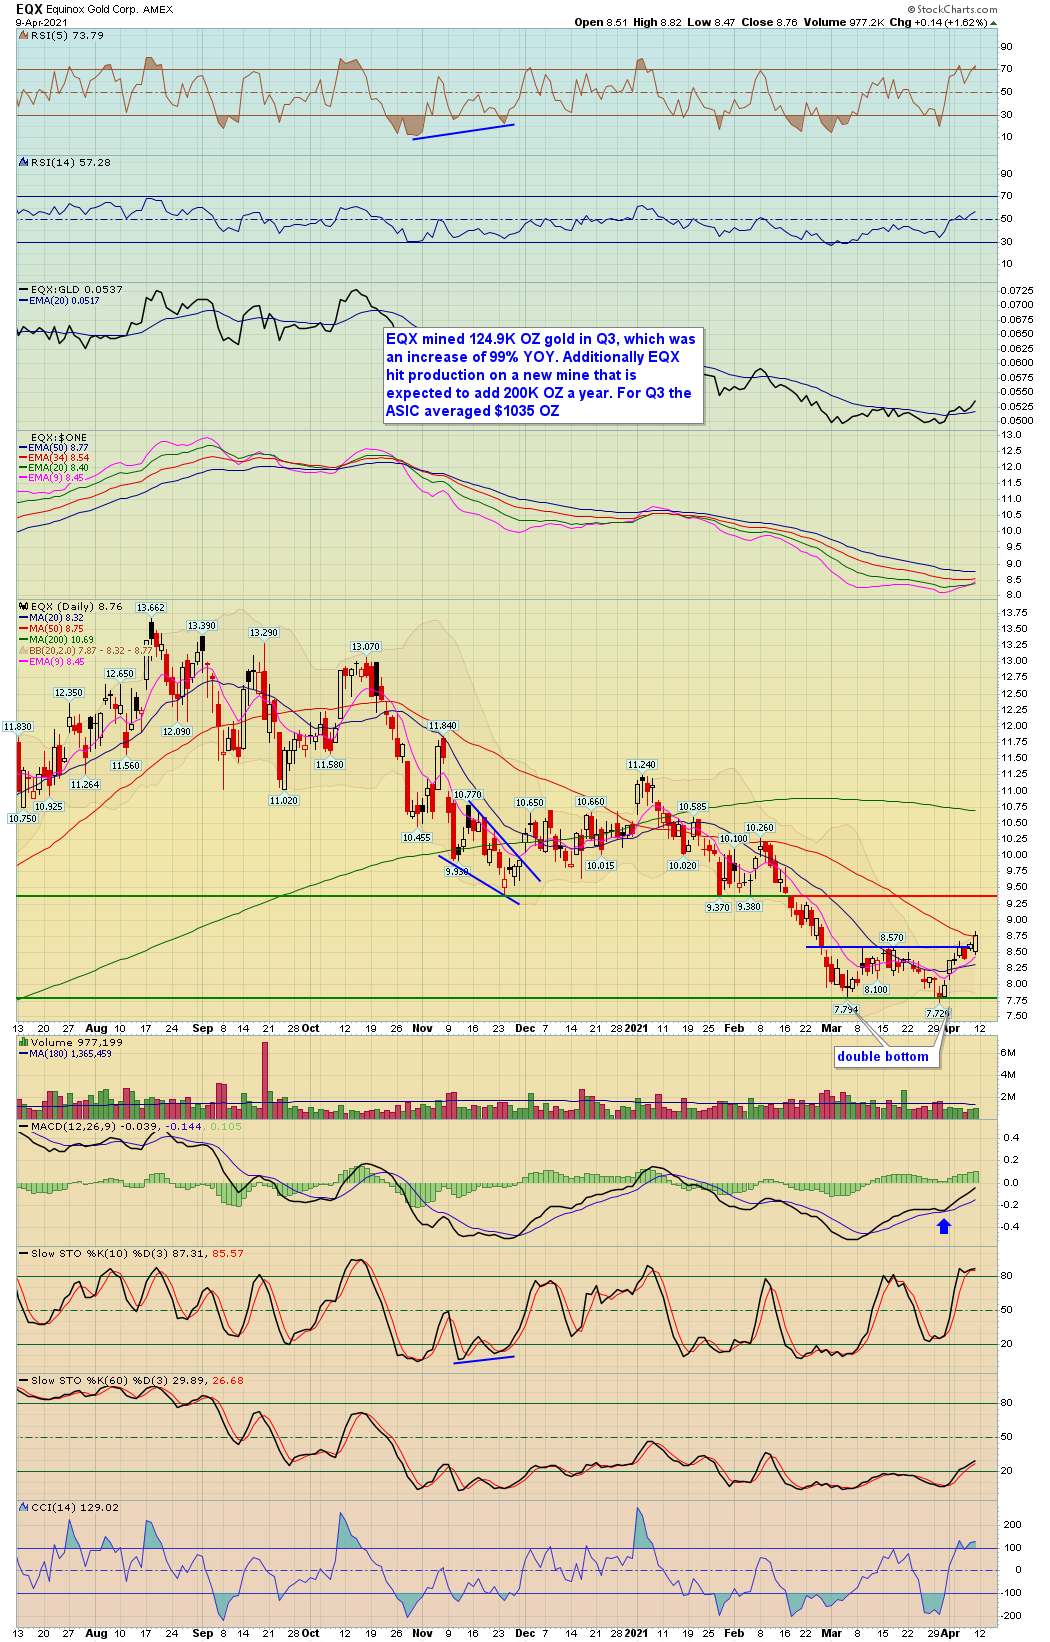
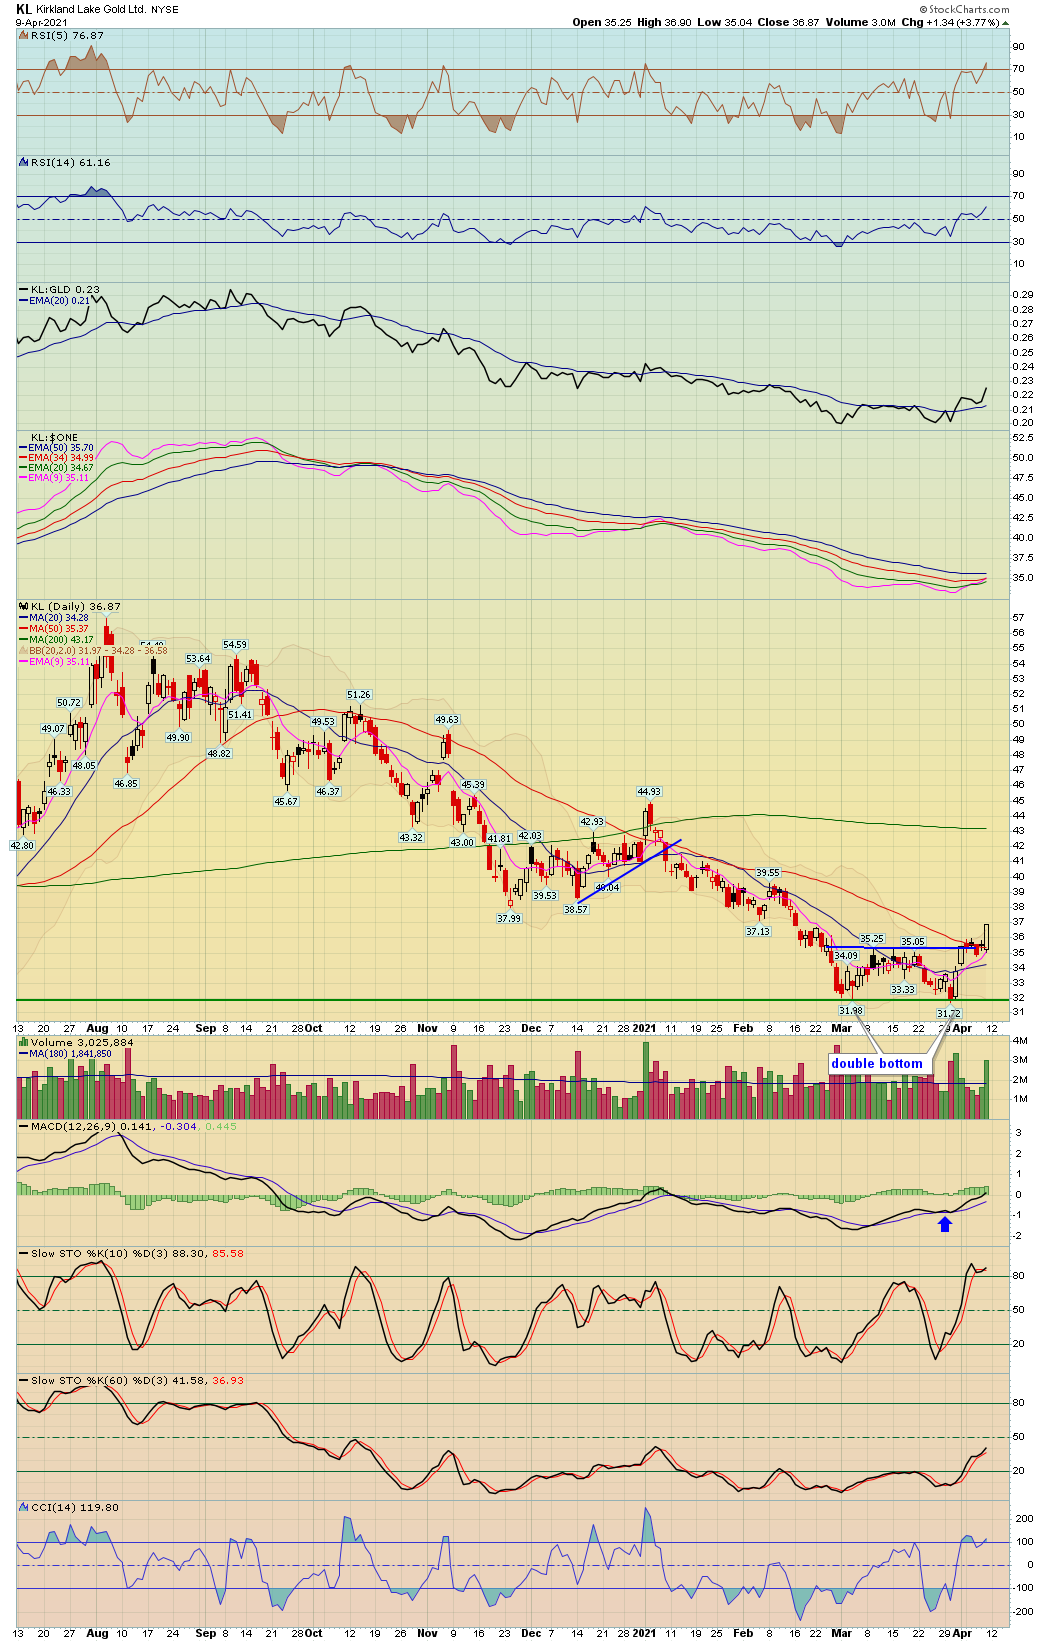
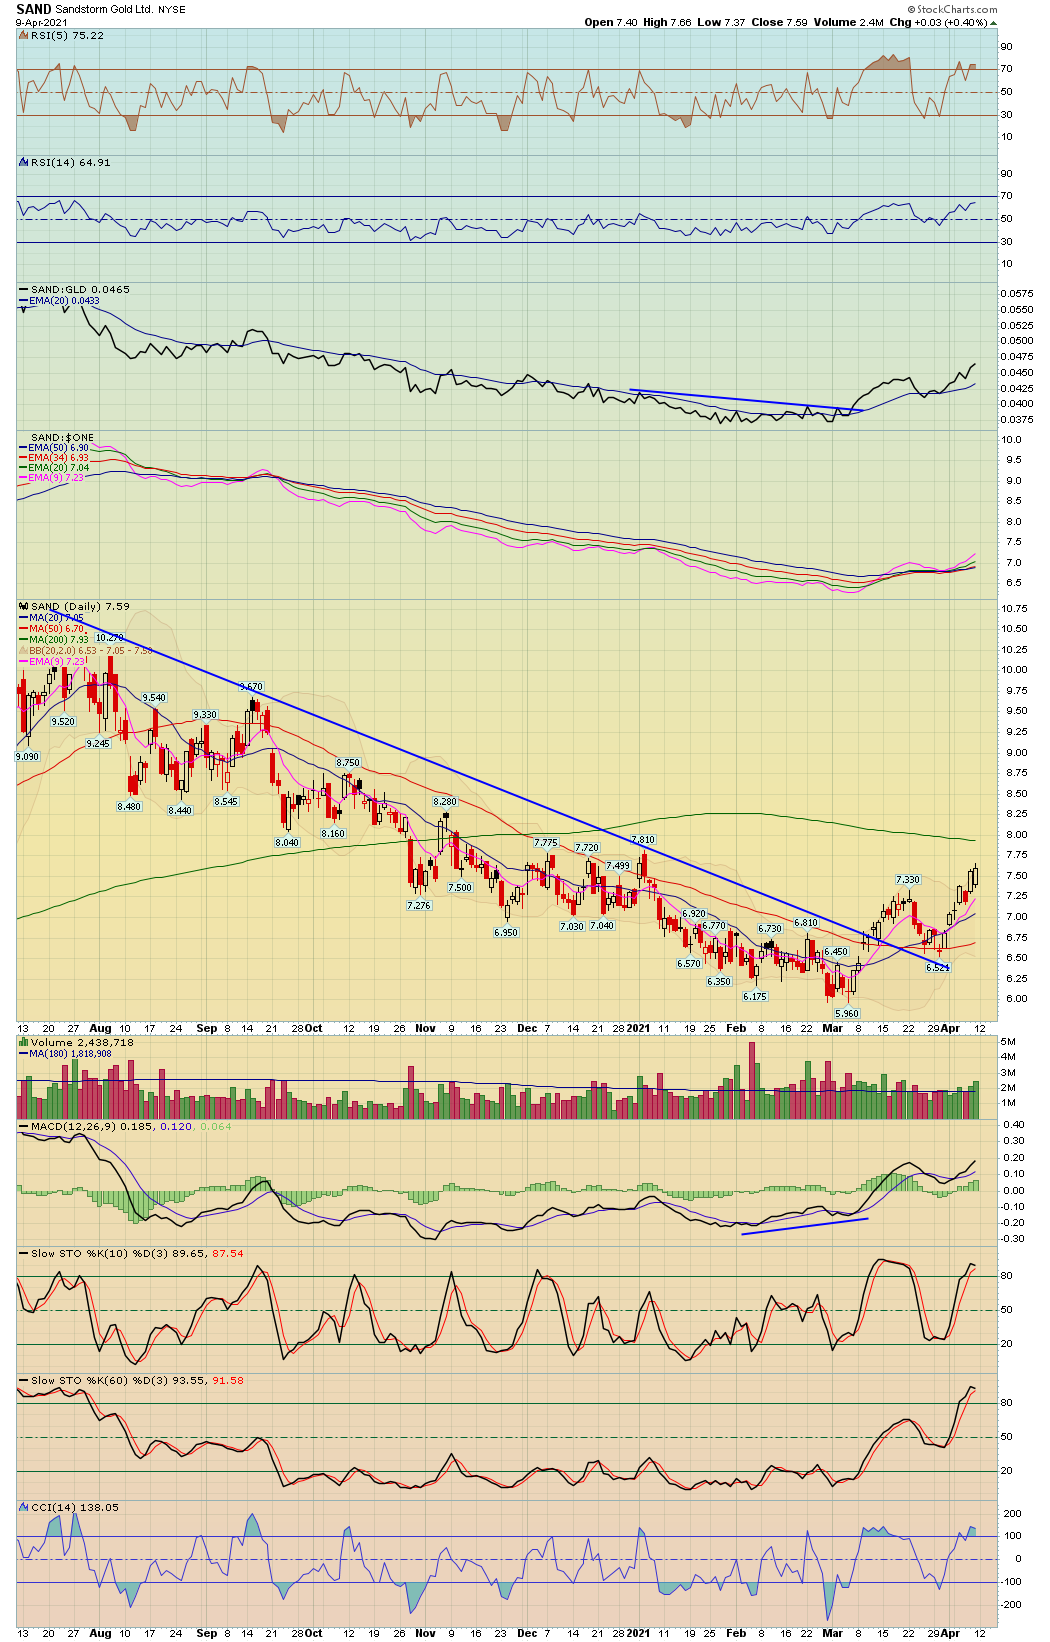
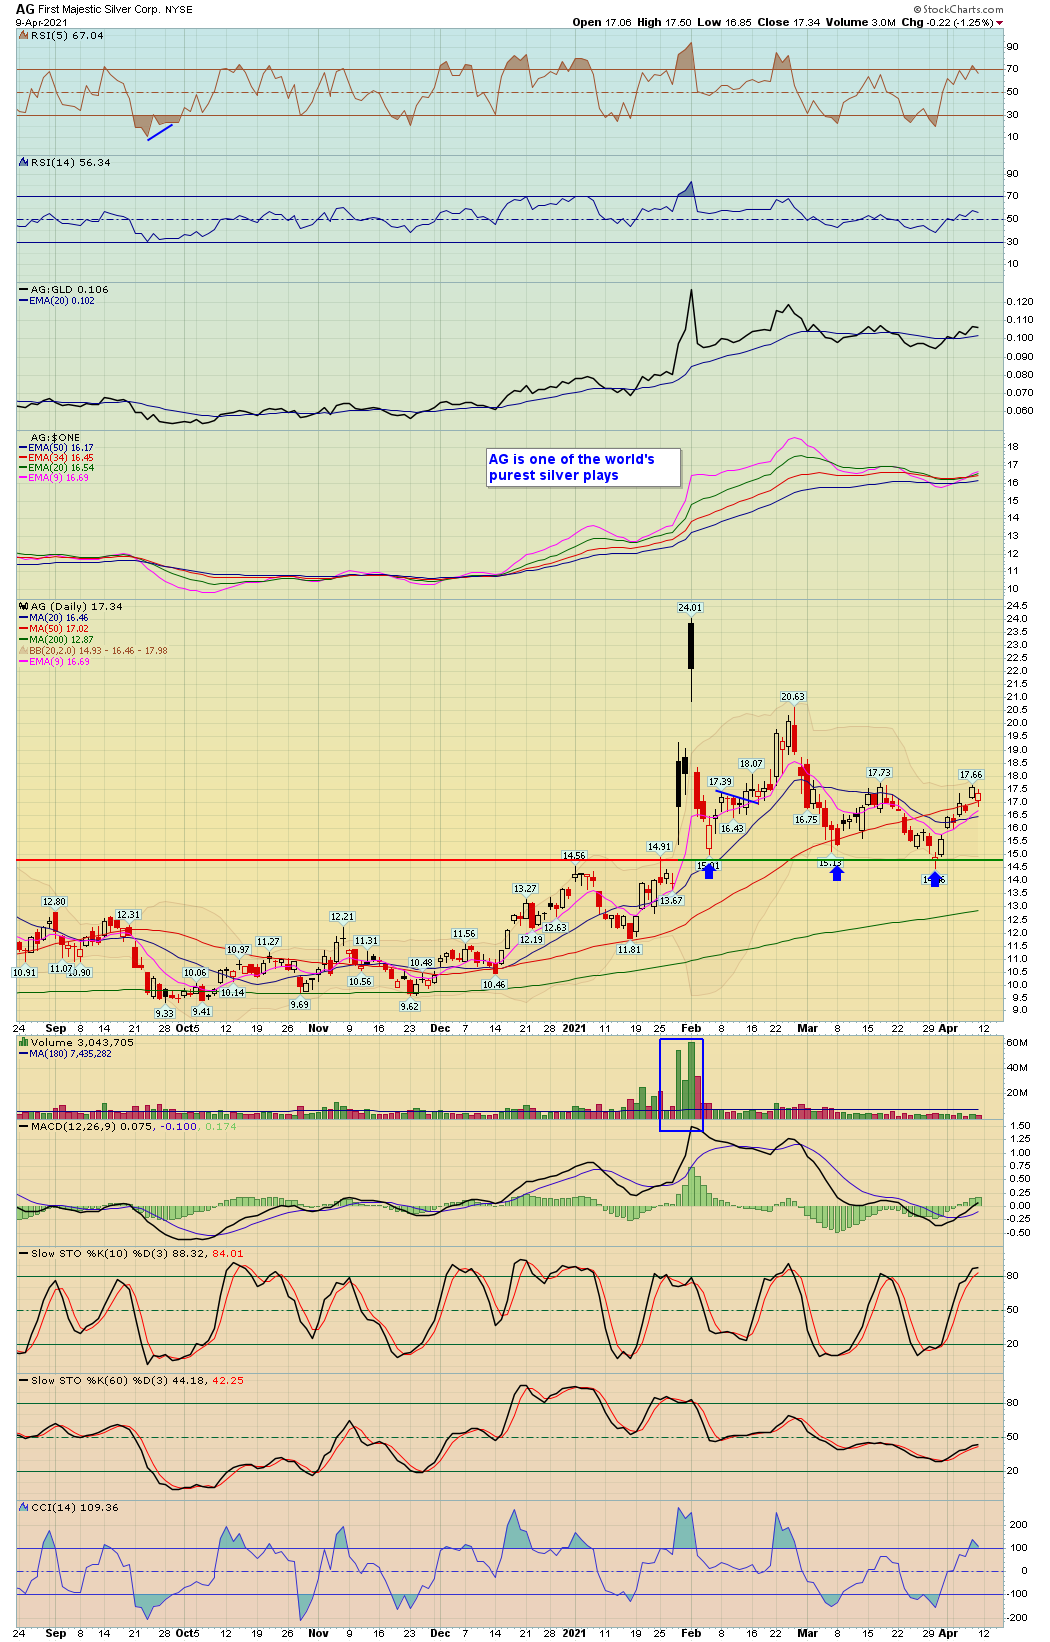
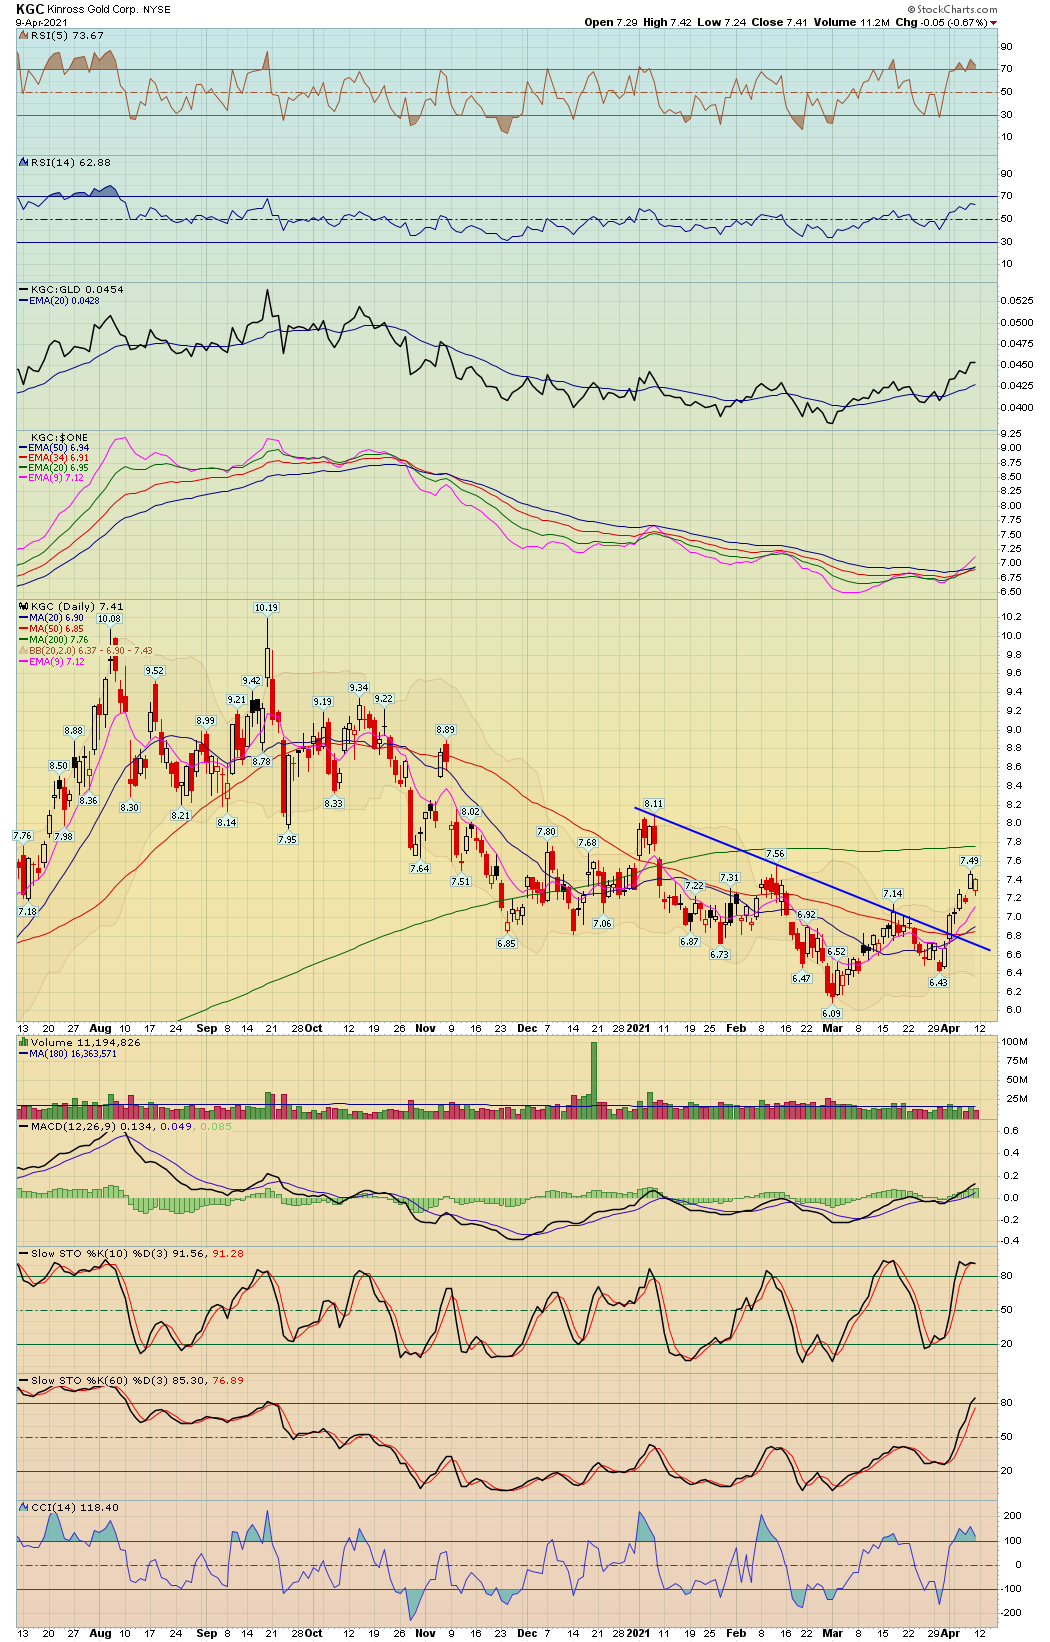
- US Dollar, Commodities, Precious Metals and GDX and a few individual names
- Trade Ideas: following up on triggered names and carrying ones over from last week that didn't trade as well as added new ones
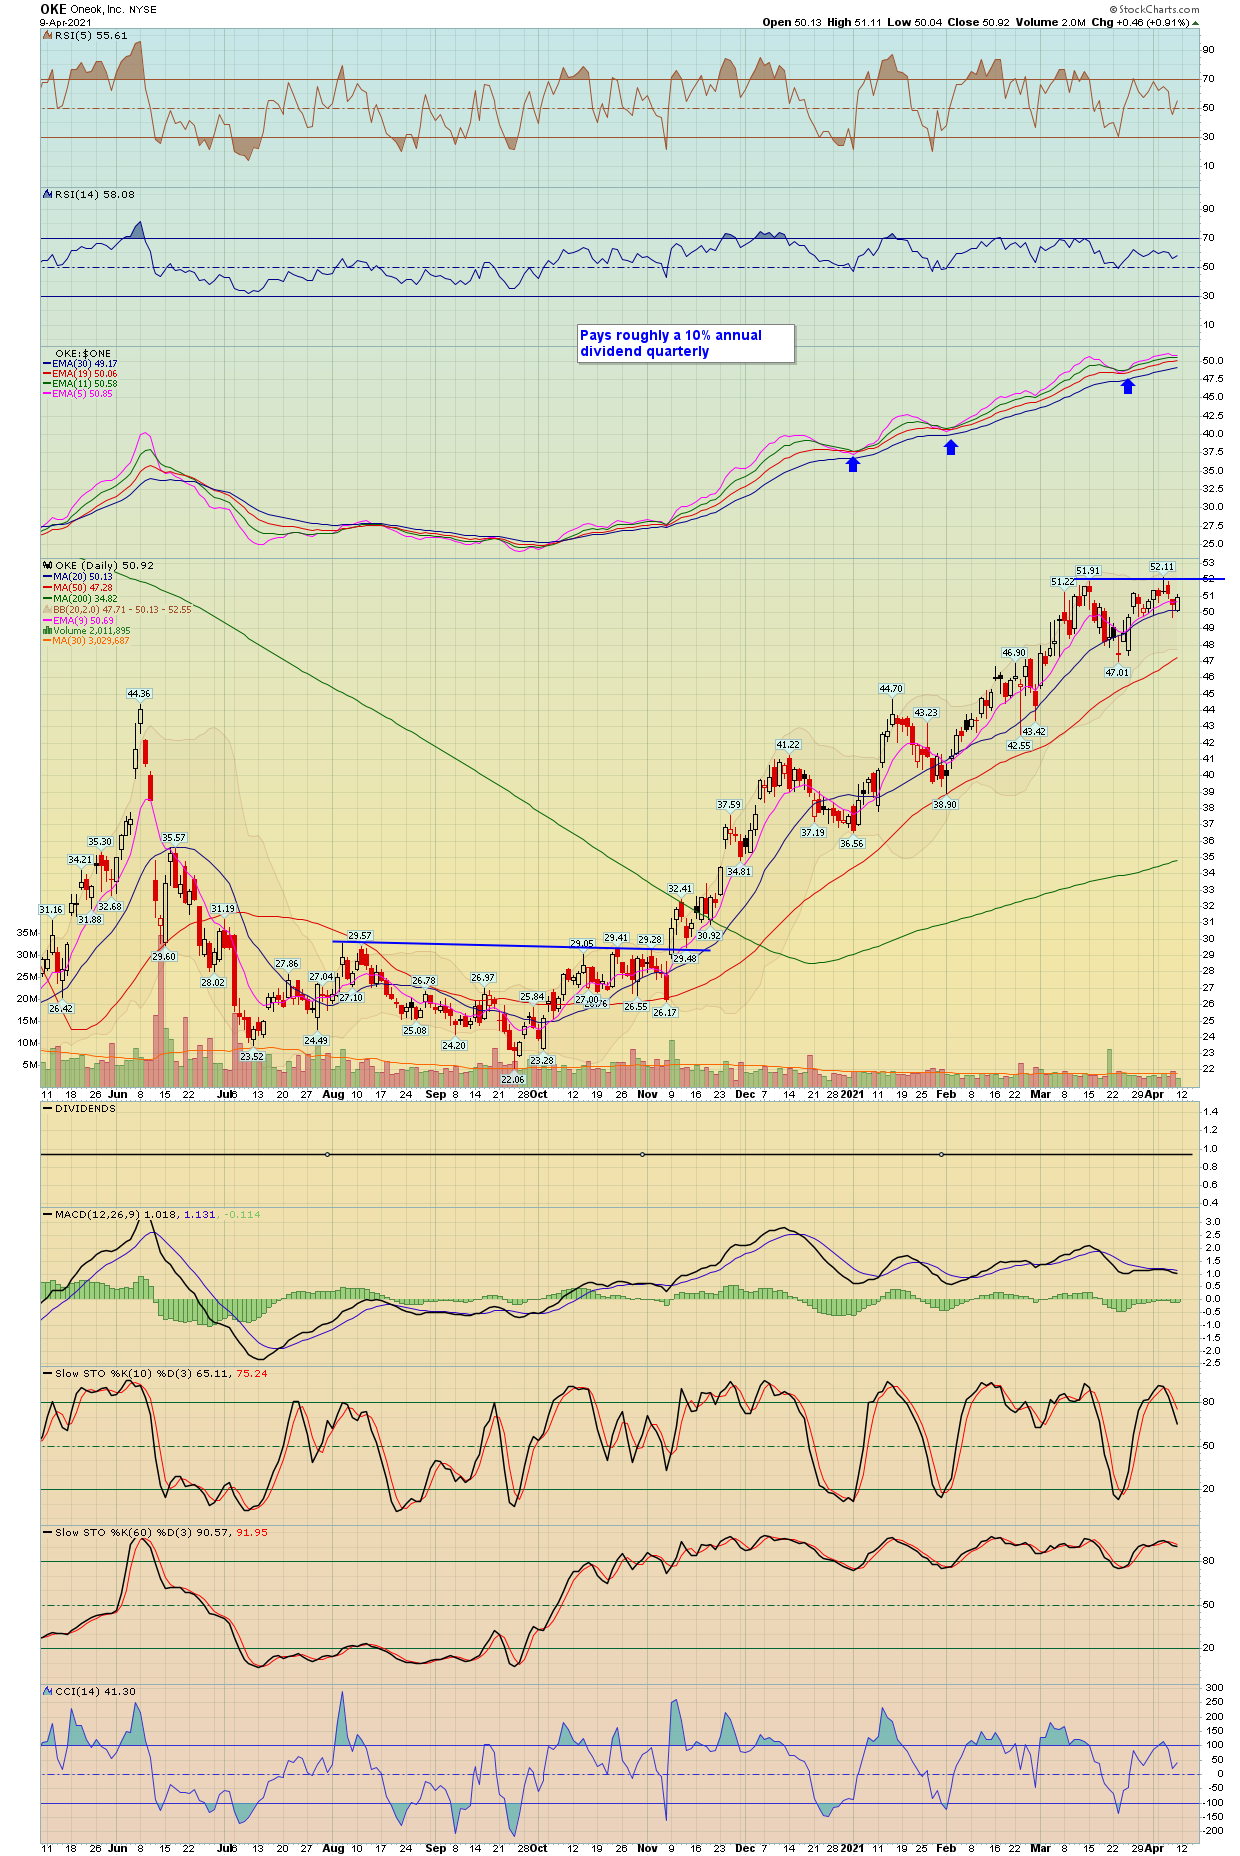
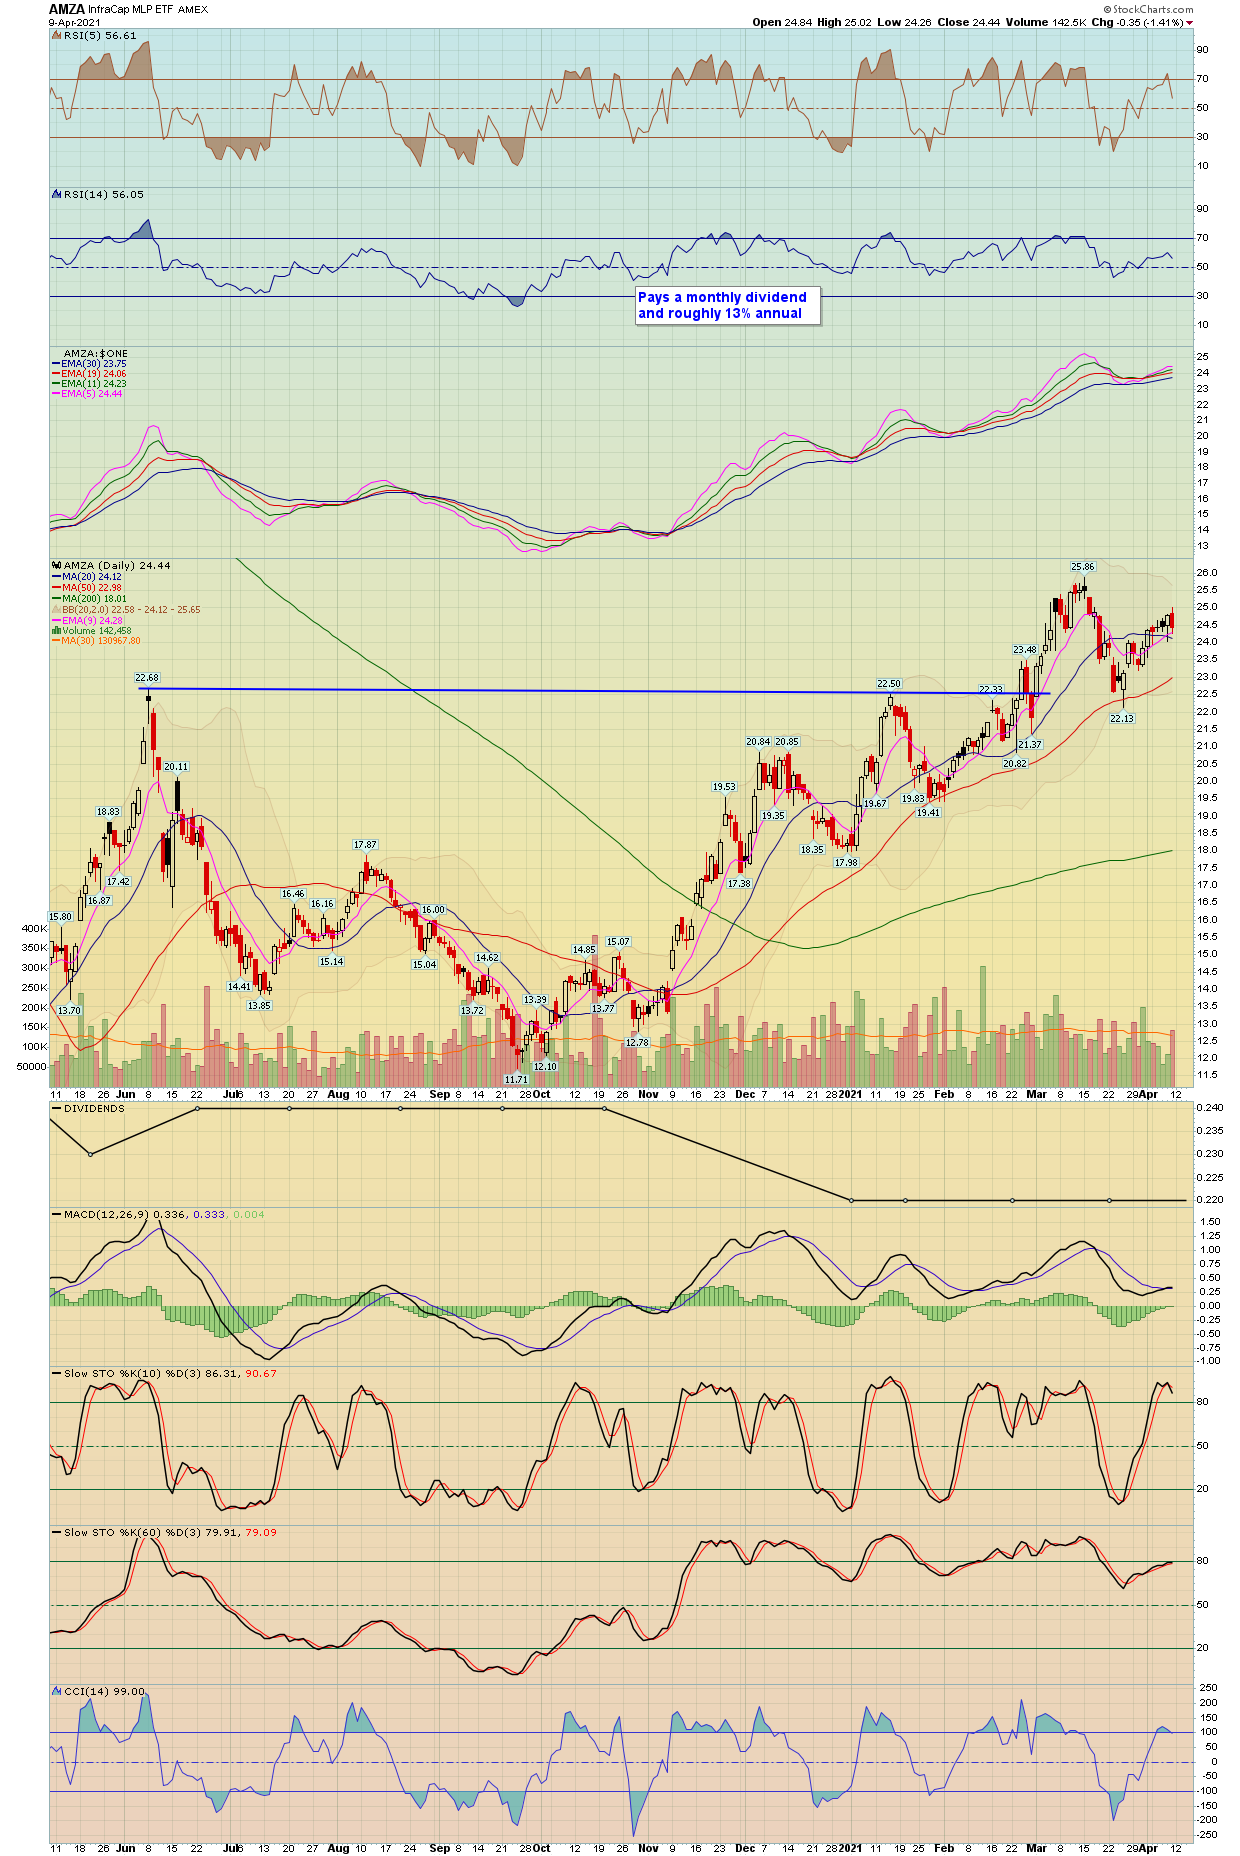
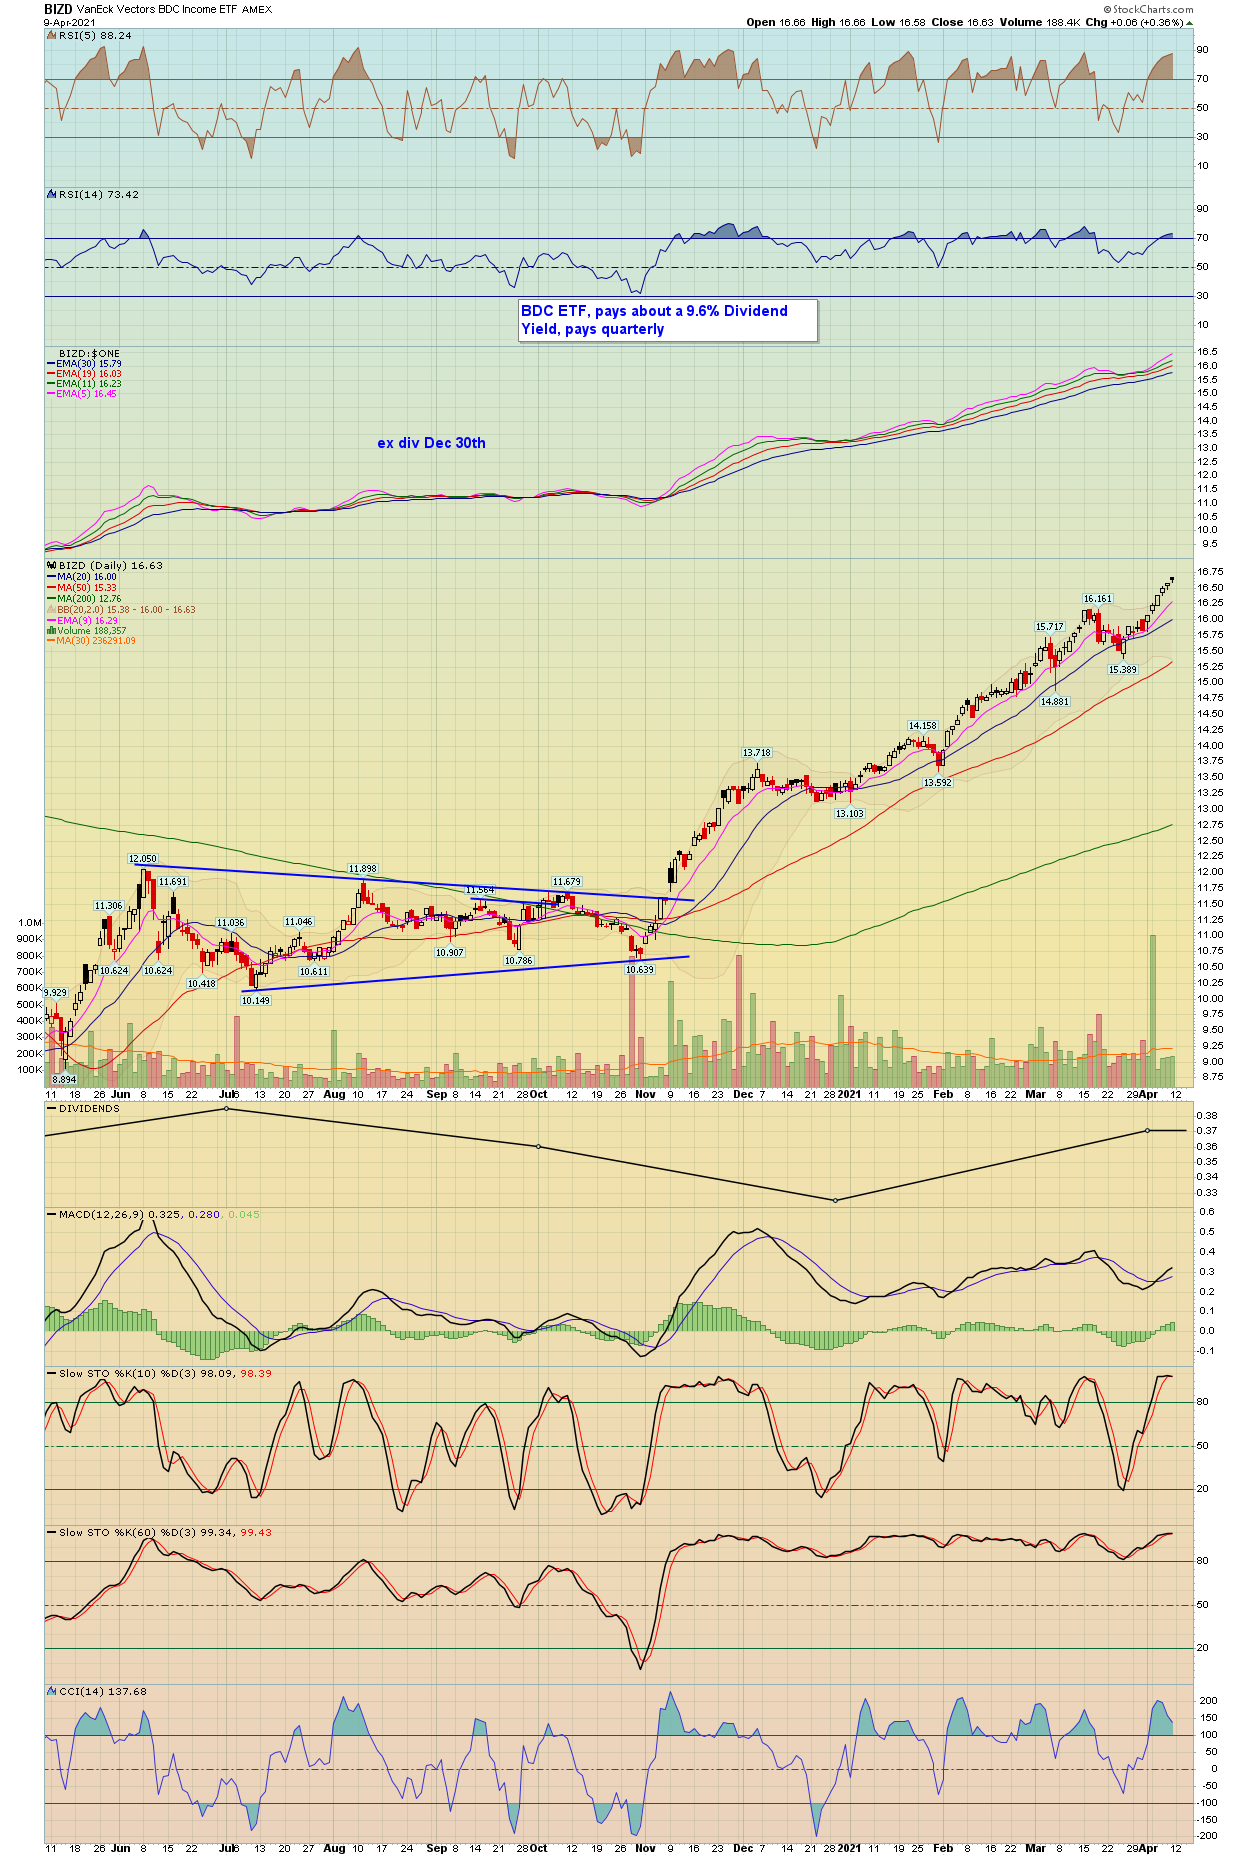
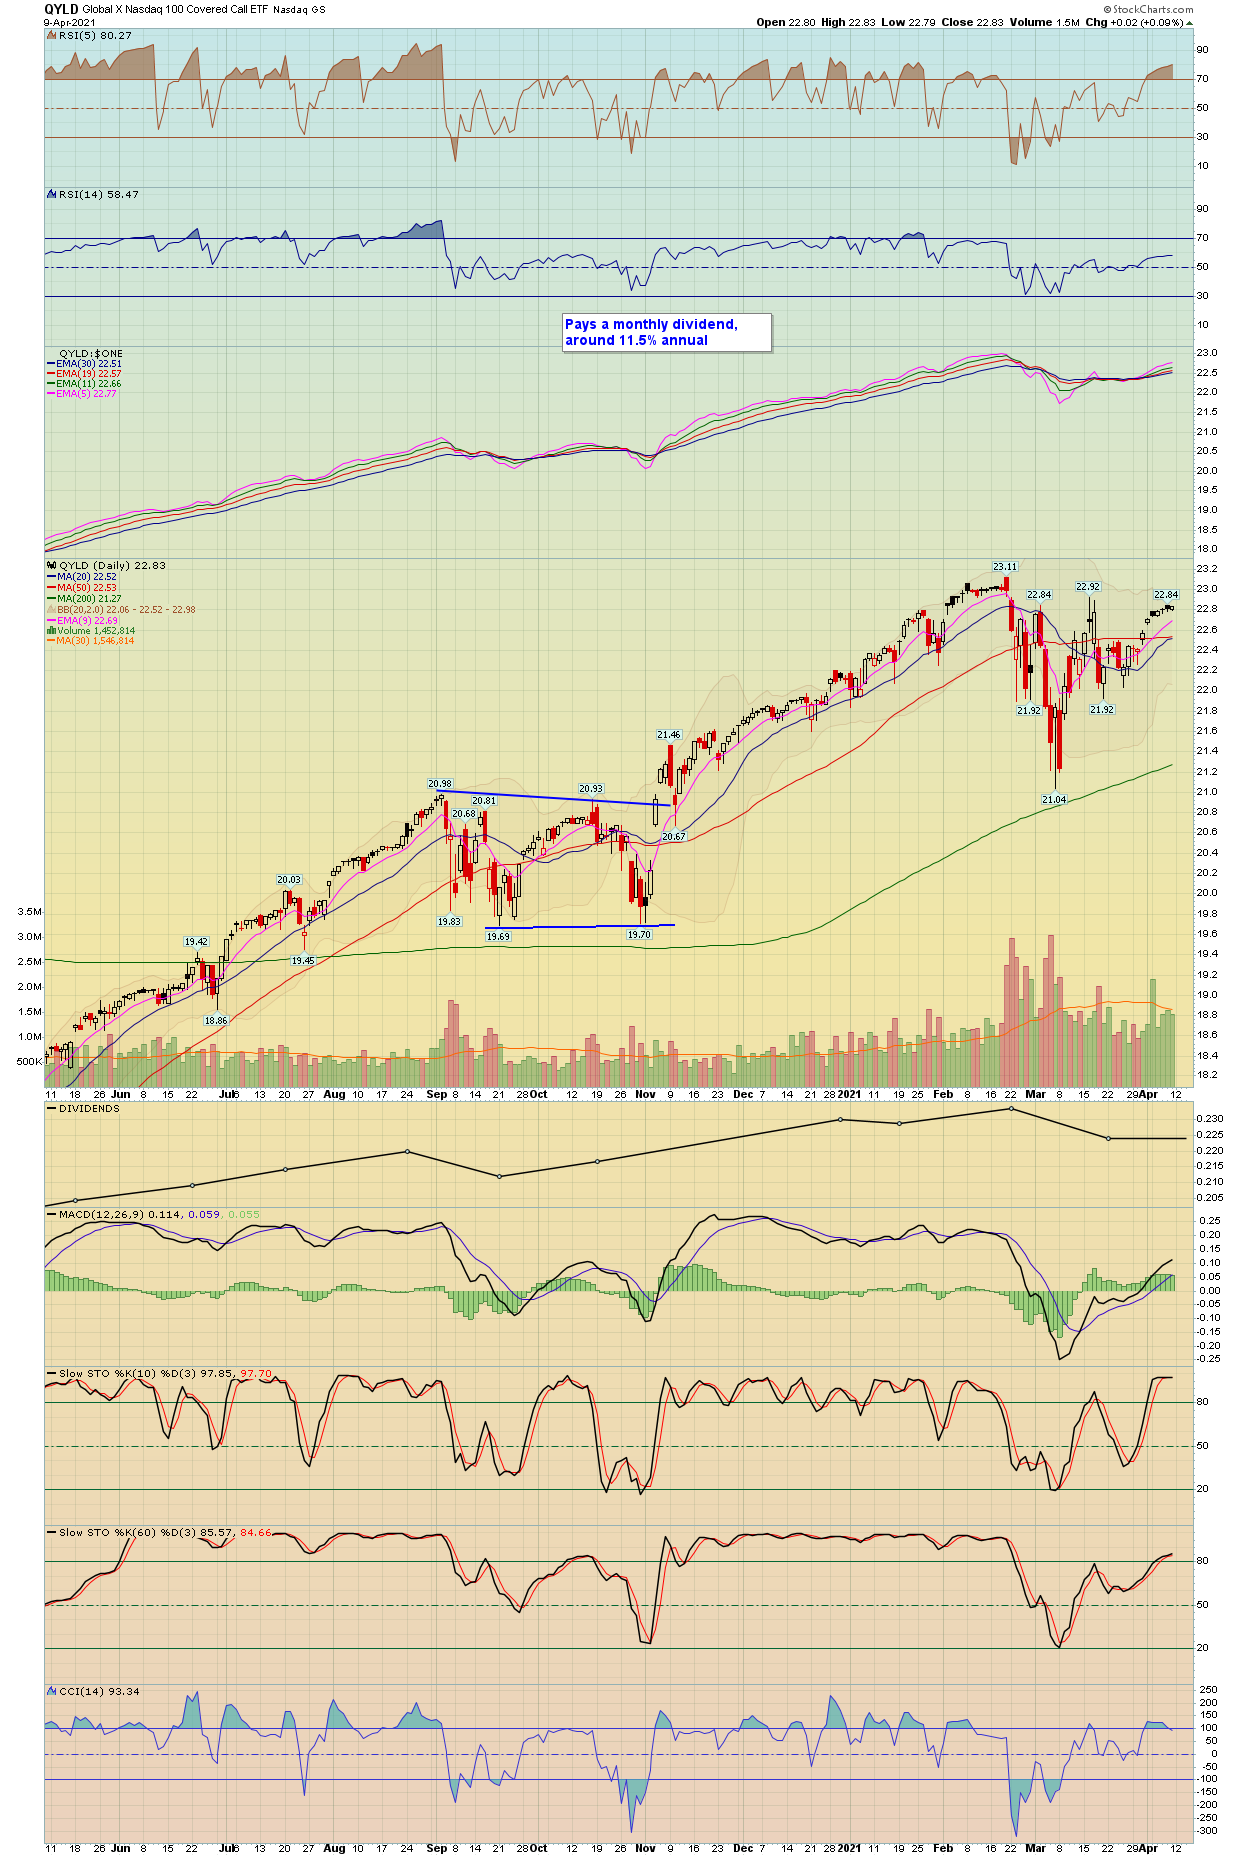
- Dividend Stocks I follow that have been doing well
2
3
4
5
6
| Major Indexes | Index Symbol | ETF Symbol | % G / L Day | % G / L Week | Close |
|---|---|---|---|---|---|
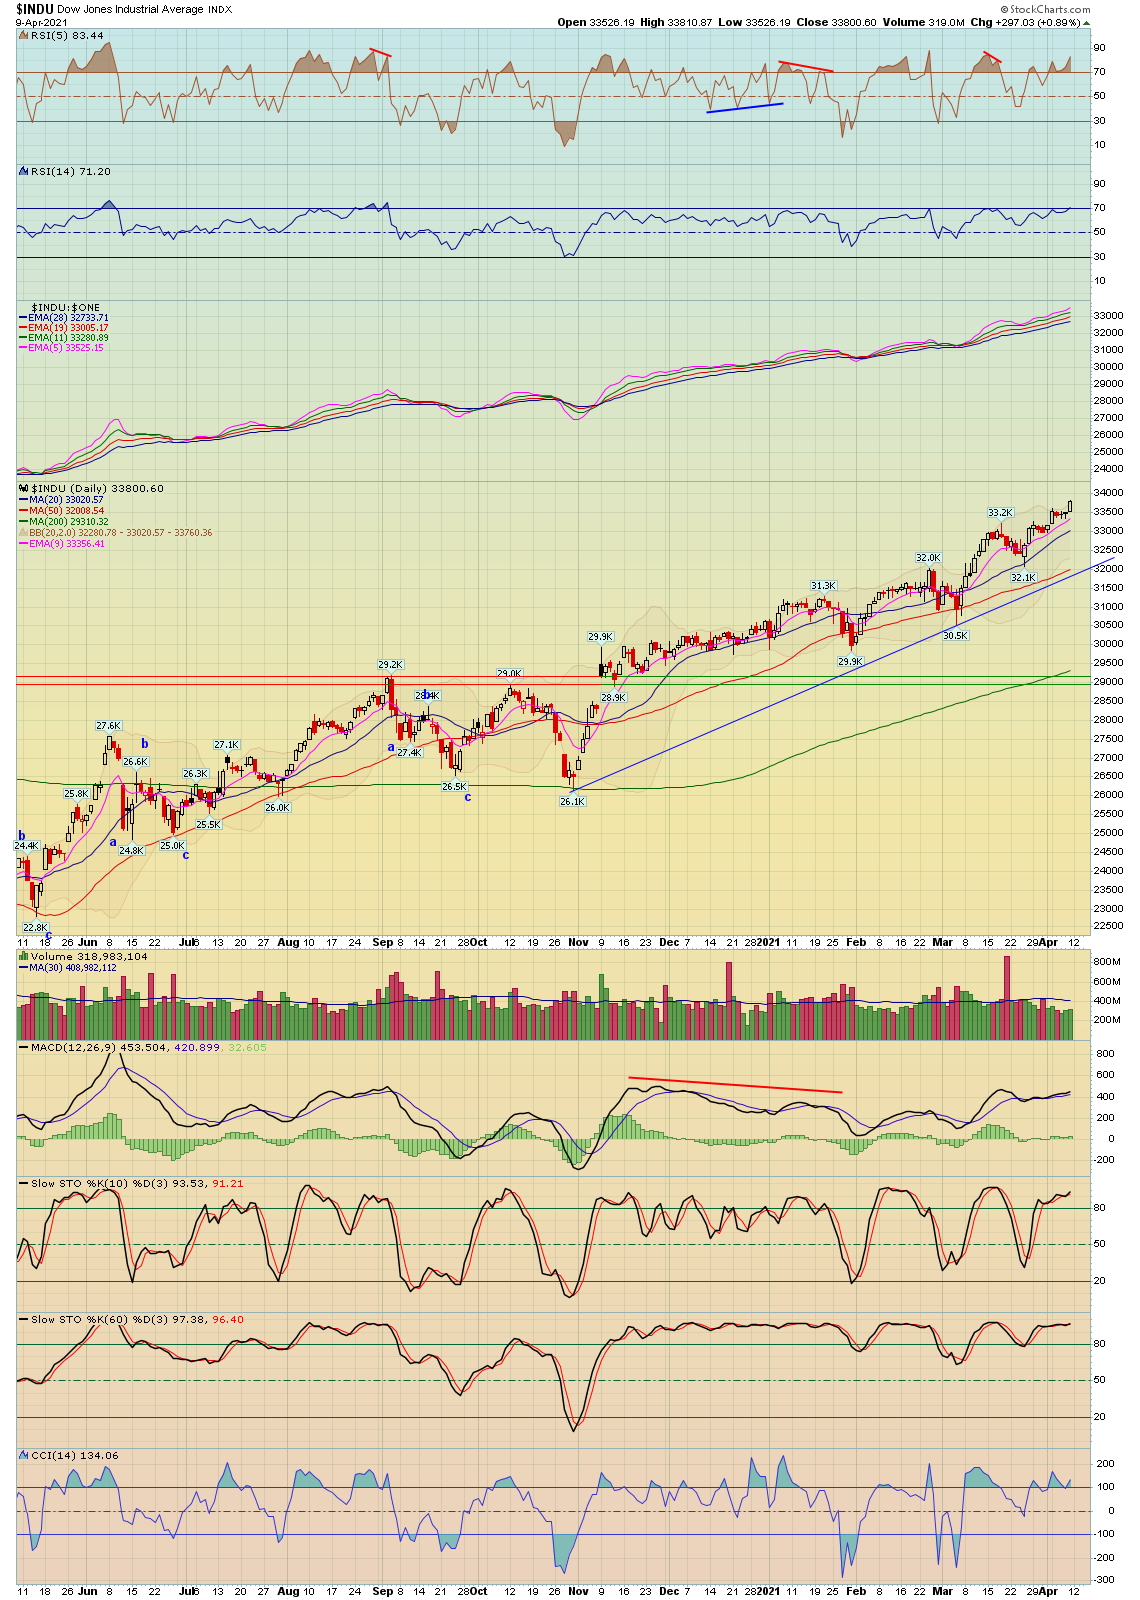
| Dow Jones | INDU - W | DIA - W | 0.89% | 1.95% | 33,800.60 |
| S&P 500 | SPX - W | SPY - W | 0.77% | 2.71% | 4,128.80 |
| Wilshire 5000 | WLSH - W | 0.62% | 2.38% | 43,288.24 | |
| Nasdaq | COMPQ - W | 0.51% | 3.12% | 13,900.19 | |
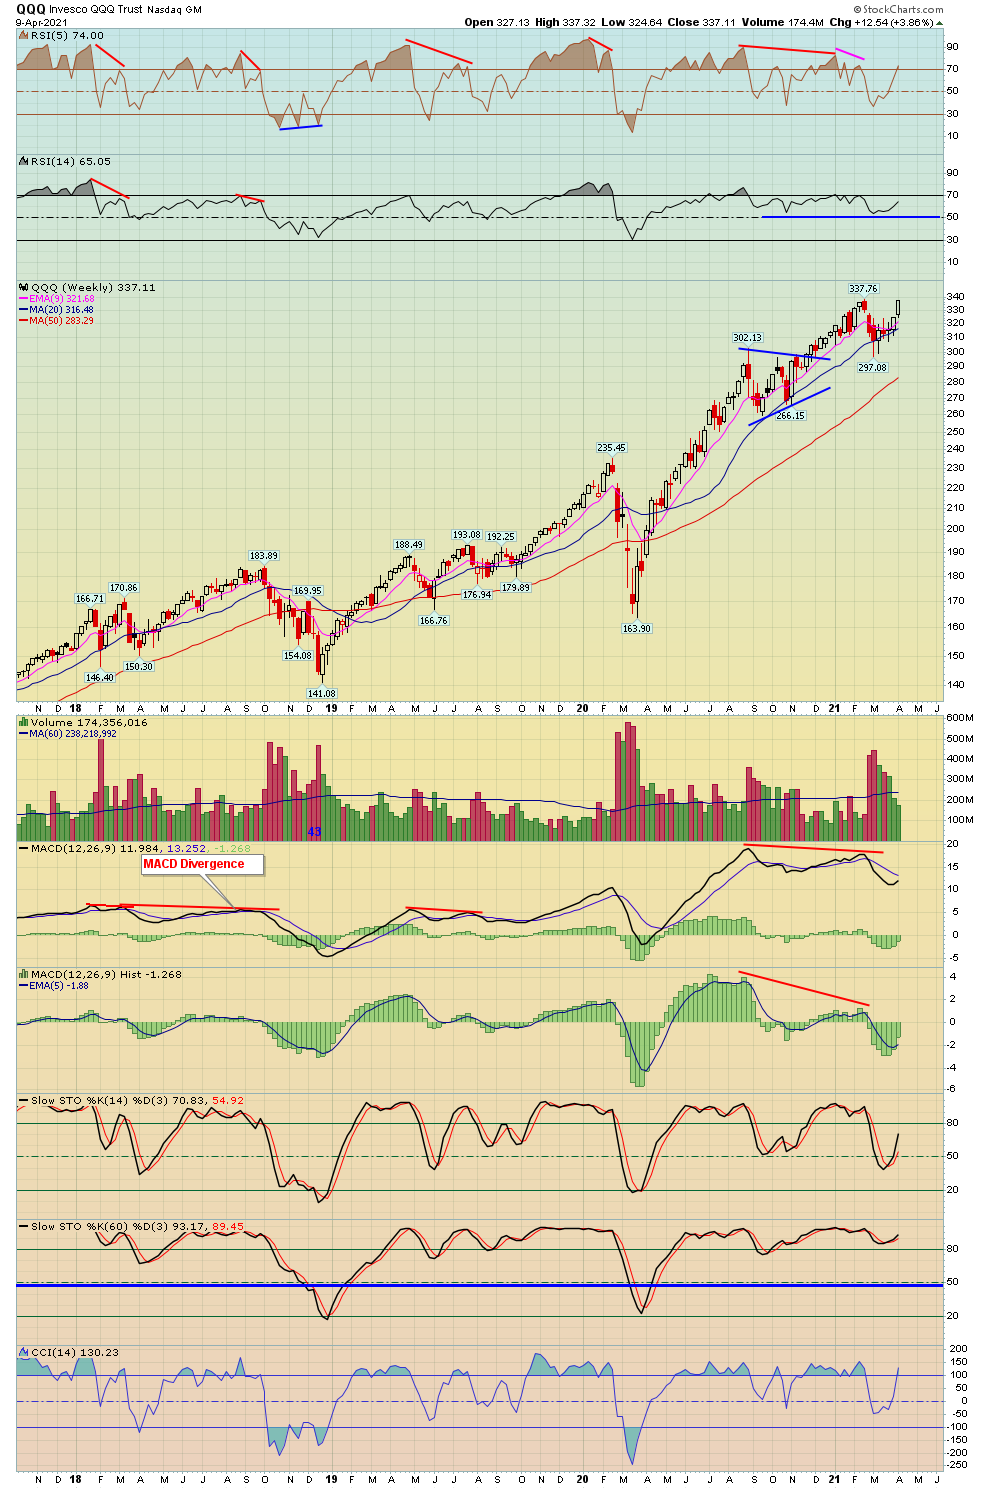
| NDX 100 | NDX - W | QQQ - W | 0.63% | 3.87% | 13,845.06 |
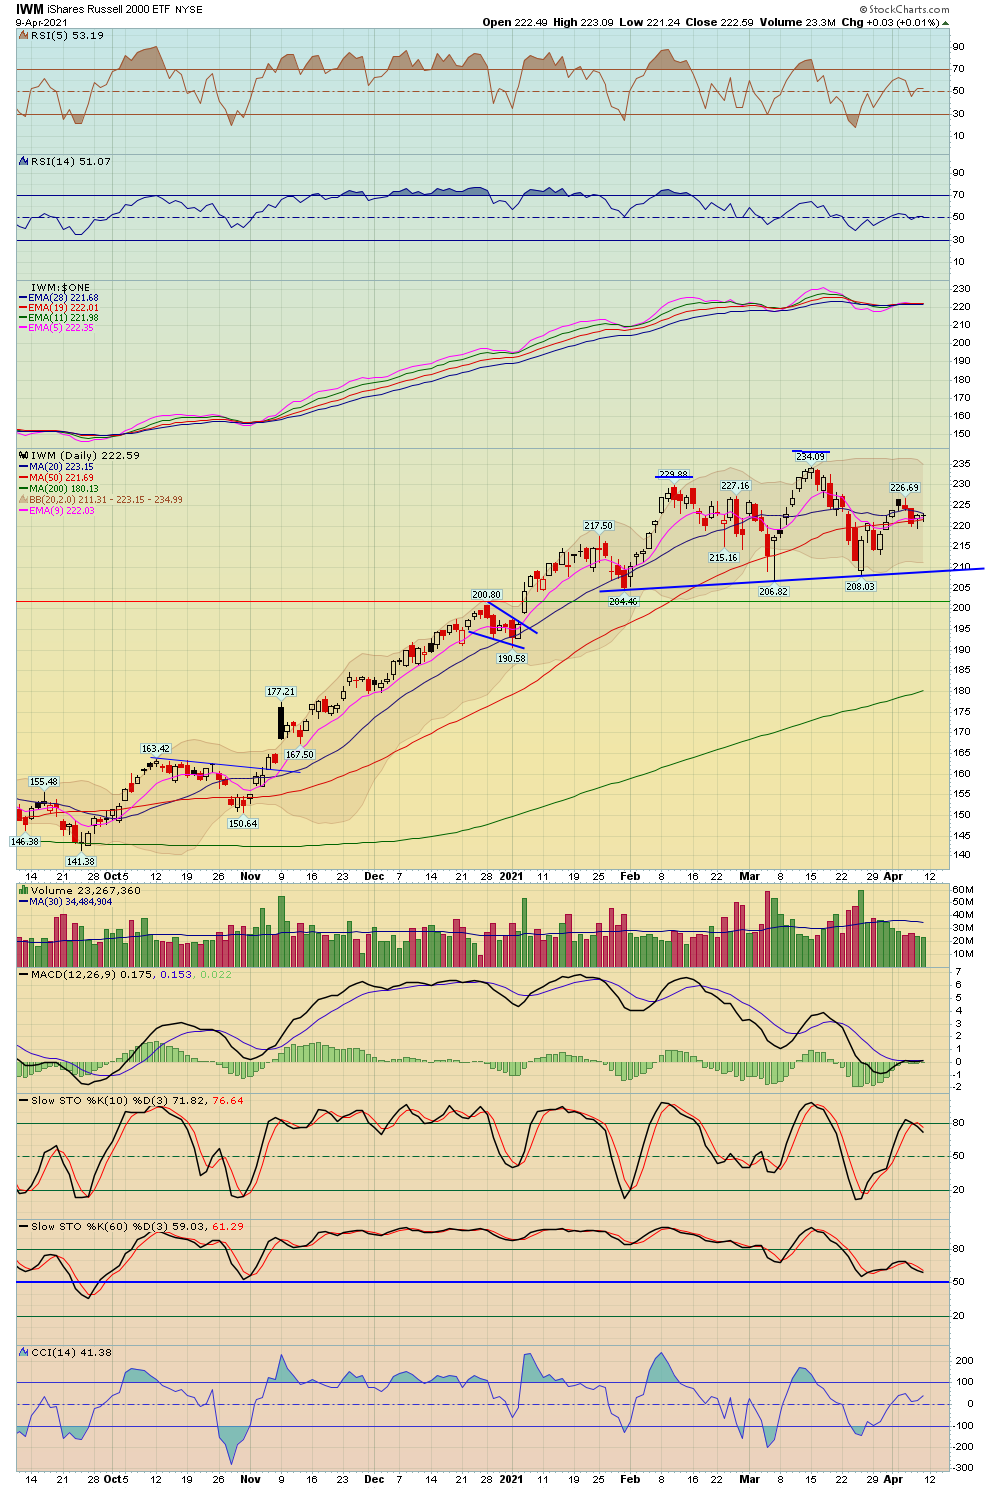
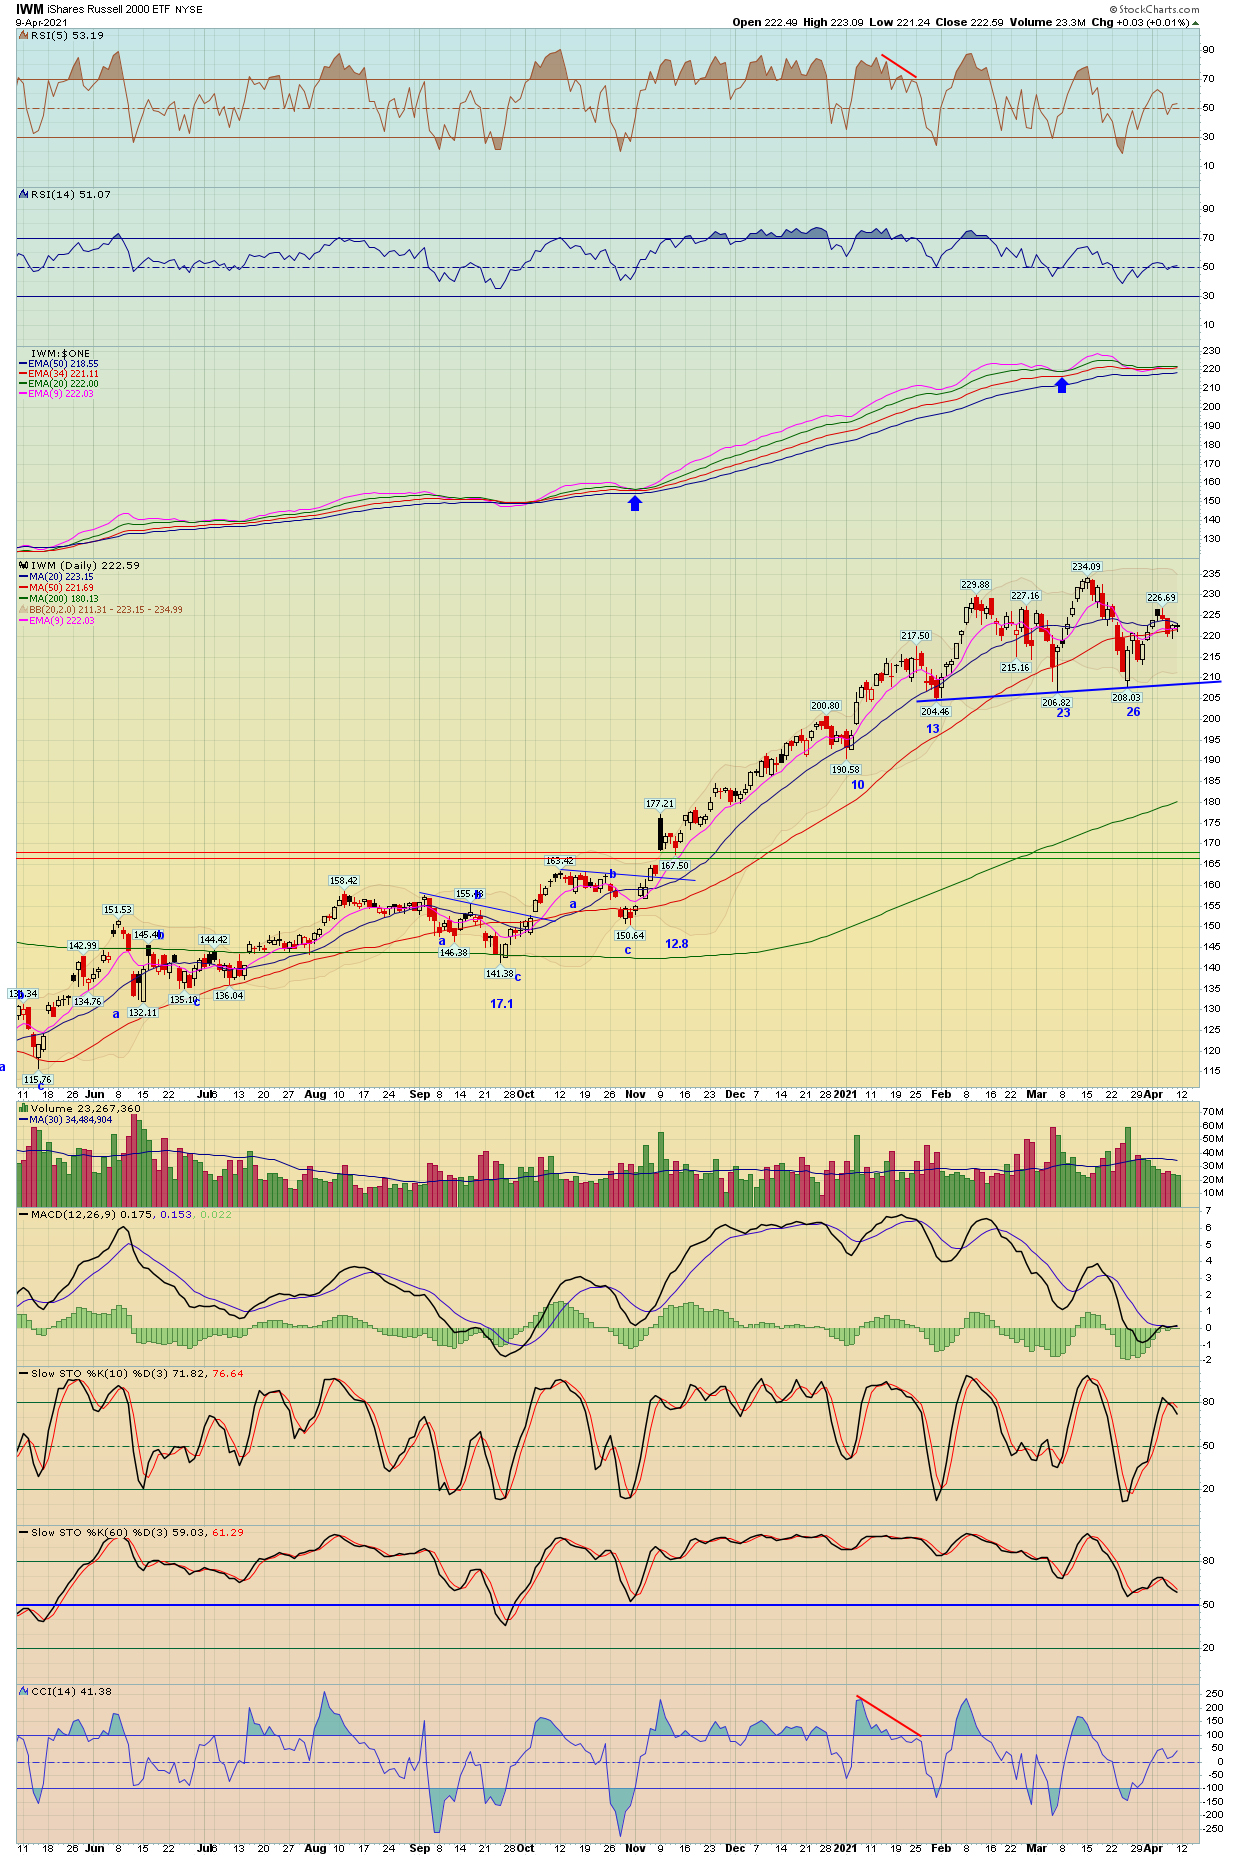
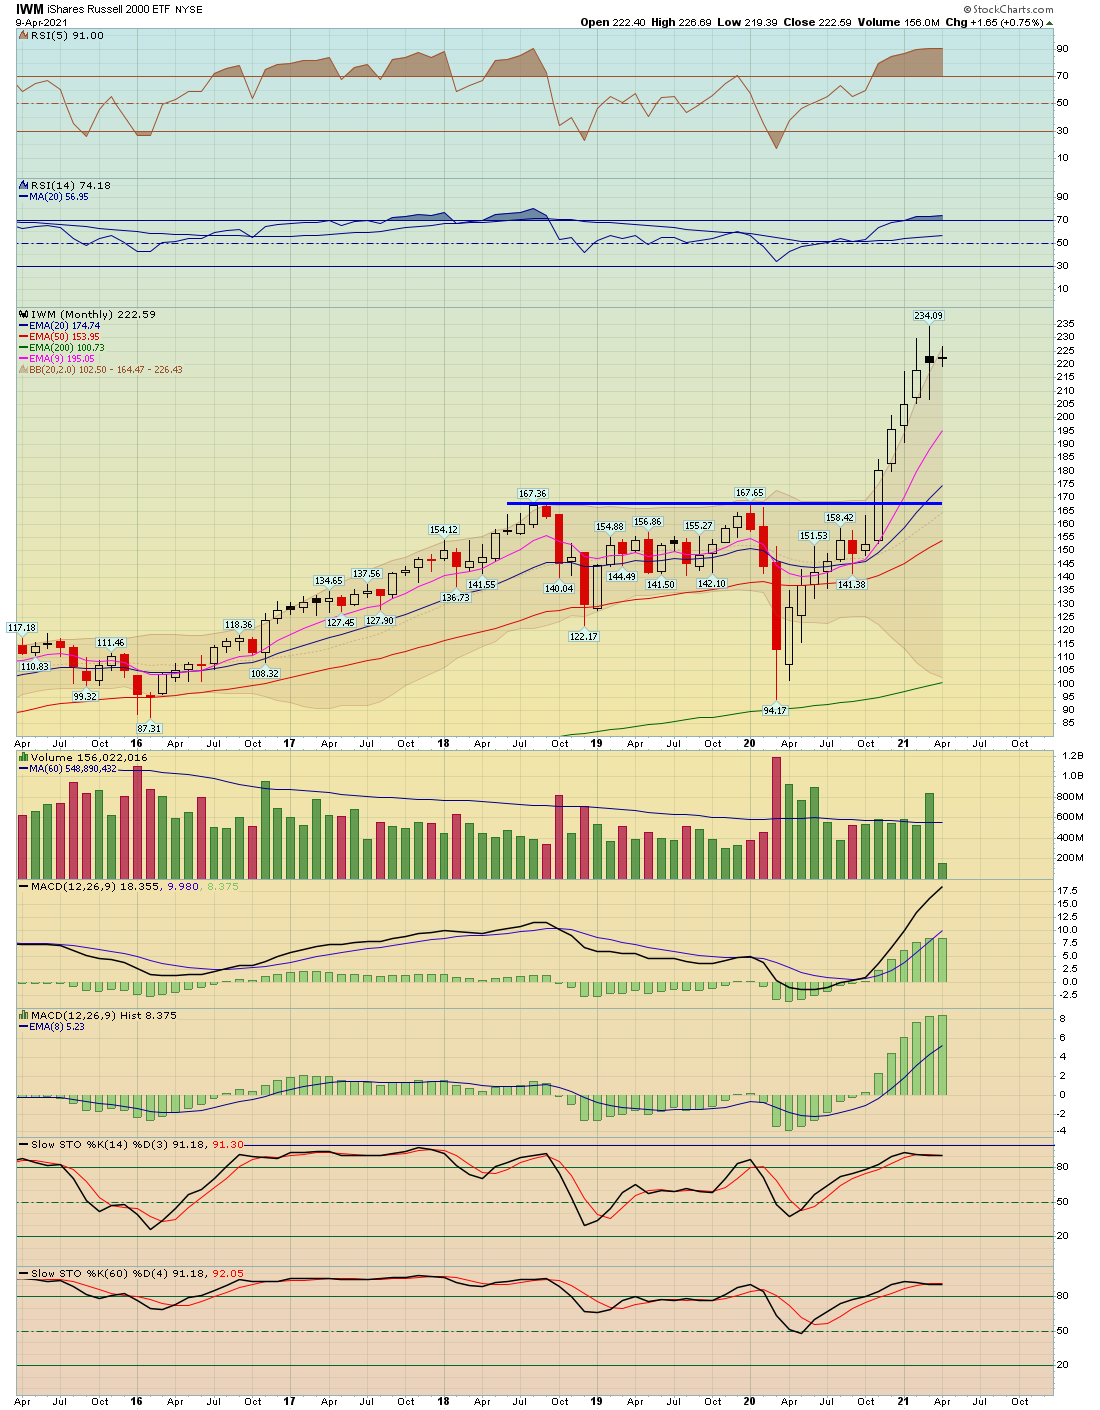
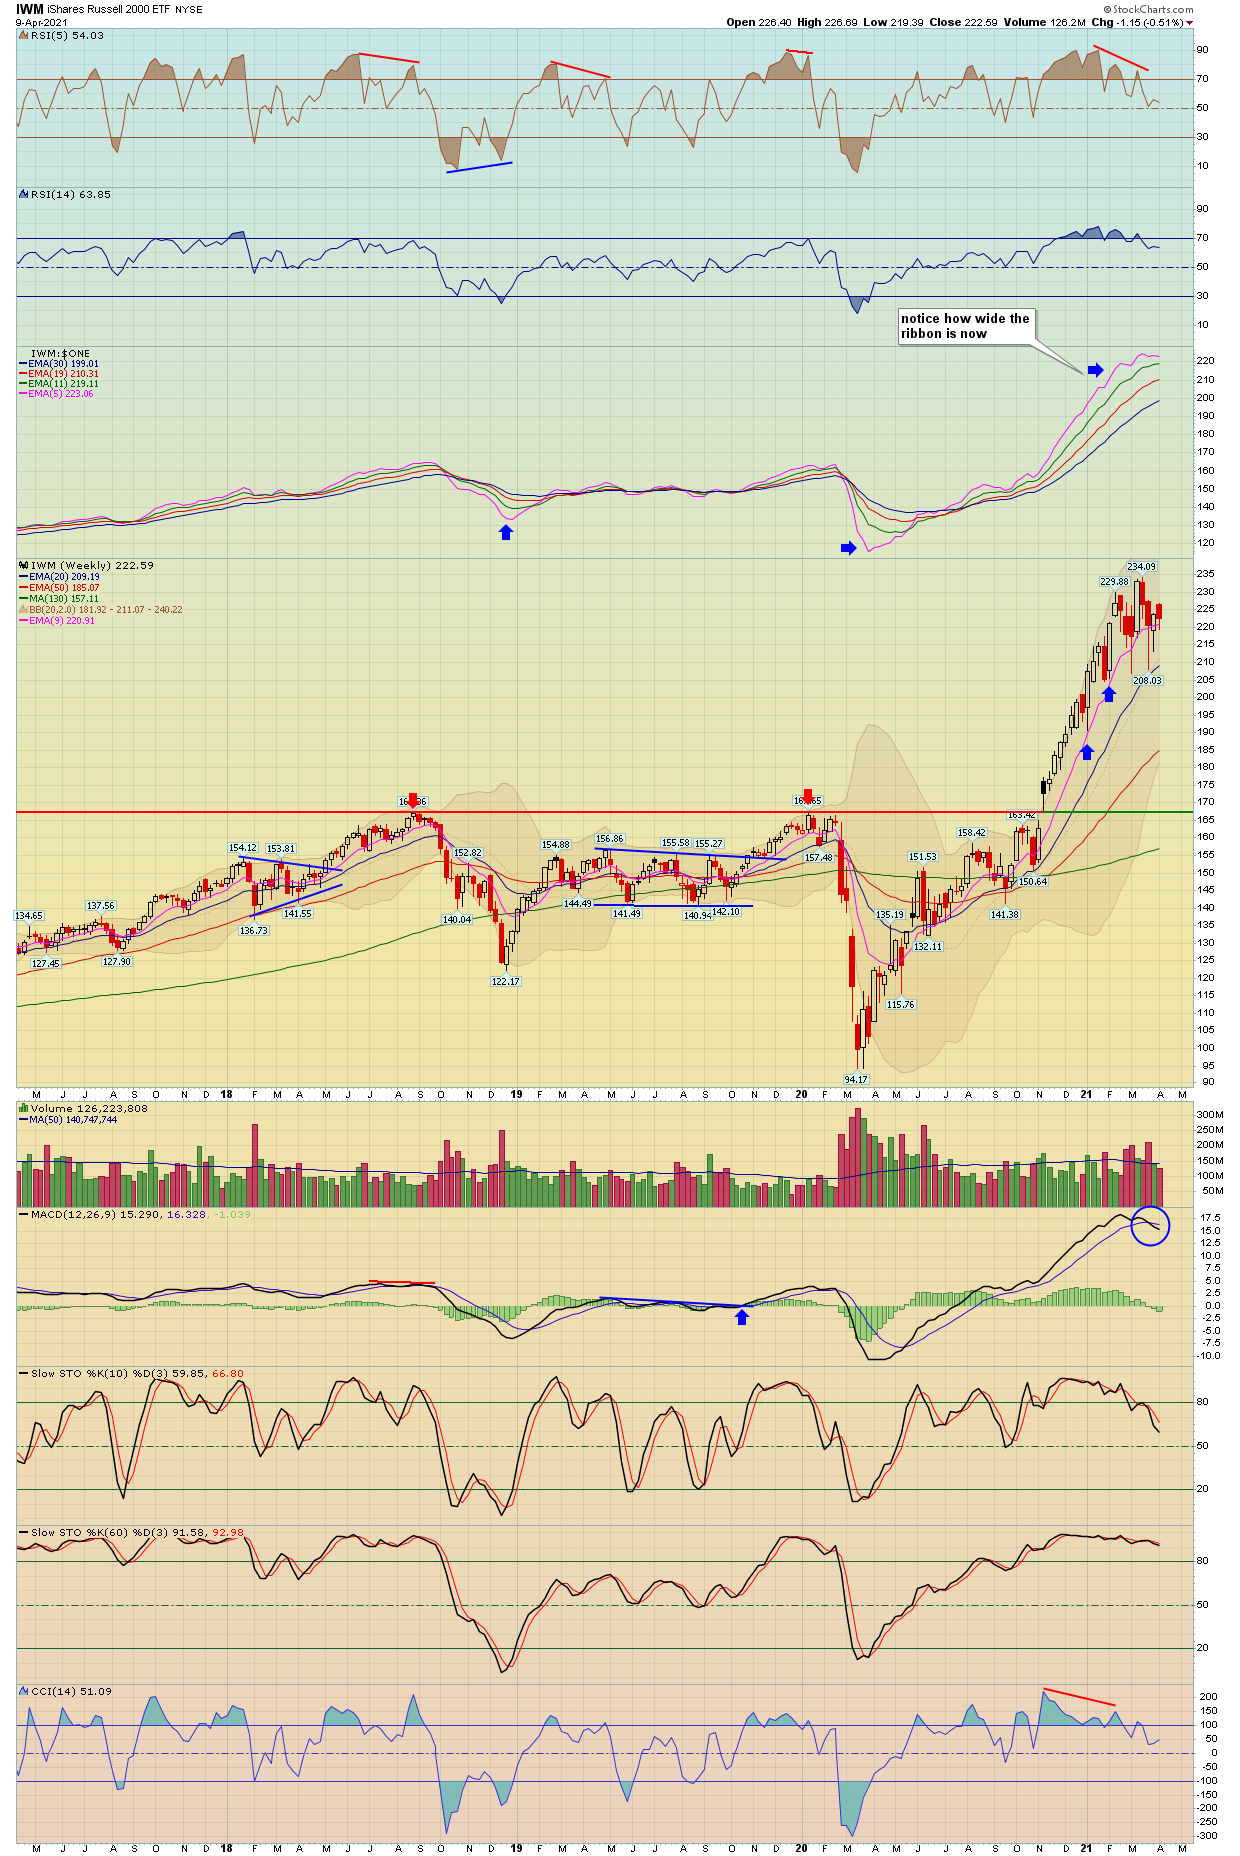
| Russel 2000 (Small Caps) | IWM - W | 0.01% | -0.51% | 222.59 |
| Market Sectors | Index Symbol | ETF Symbol | % G / L Day | % G / L Week | Close |
|---|---|---|---|---|---|
| Transports | TRAN - W | IYT - W | 0.88% | 1.15% | 14,918.33 |
| Banks | BKX - W | 1.08% | 1.51% | 123.24 | |
| Financials | XLF - W | 0.86% | 1.97% | 35.15 | |
| Brokers | XBD - W | 1.05% | 1.78% | 457.93 | |
| XLE (Energy Select) | XLE - W | -0.66% | -4.21% | 48.19 | |
| Oil Service Holders | OIH - W | -2.02% | -6.24% | 184.51 | |
| Technology | XLK - W | 0.96% | 4.64% | 141.77 | |
| Semiconductor | SOX - W | SMH - W | -0.20% | 1.68% | 3,294.53 |
| Communication Services | XLC - W | -0.03% | 3.14% | 76.92 | |
| Retail | XRT - W | 1.56% | 3.02% | 92.21 | |
| Consumer Staples | XLP - W | -0.17% | 1.38% | 68.92 | |
| Consumer Discretionary | XLY - W | 0.95% | 3.87% | 175.98 | |
| Industrials | XLI - W | 0.97% | 1.75% | 100.51 | |
| Real Estate | IYR - W | -0.01% | 0.41% | 93.96 | |
| Homebuilders | HGX - W | XHB - W | 2.22% | 2.32% | 485.89 |
| Materials | XLB - W | 0.87% | 0.70% | 80.05 | |
| Metals And Mining | XME - W | -1.10% | -2.13% | 39.50 | |
| Biotechnology | BTK - W | XBI - W | -0.49% | -2.60% | 5,427.10 |
| Healthcare | XLV - W | 1.10% | 1.34% | 117.95 | |
| Drugs | DRG - W | 0.65% | 0.25% | 694.08 | |
| Utilities | UTIL - W | XLU - W | 0.06% | 1.38% | 891.67 |
| Currencies | Index Symbol | ETF Symbol | % G / L Day | % G / L Week | Close |
|---|---|---|---|---|---|
| US Dollar | UUP - W | 0.08% | -0.80% | 24.81 | |
| Euro | XEU - W | FXE - W | -0.14% | 1.04% | 119.00 |
| Yen | XJY - W | FXY - W | -0.39% | 0.87% | 91.19 |
| Australian | XAD - W | FXA - W | -0.39% | 0.09% | 76.23 |
| British Pound | XBP - W | FXB - W | -0.19% | -0.91% | 137.08 |
| Chinese Yuan | CYB - W | -0.96% | -0.37% | 26.95 | |
| Canadian Dollar | CDW - W | FXC - W | 0.29% | 0.14% | 79.82 |
| Swiss Franc | XSF - W | FXF - W | 0.00% | 1.91% | 108.19 |
| Cryptocurrencies | Index Symbol | ETF Symbol | % G / L Day | % G / L Week | Close |
|---|---|---|---|---|---|
| Bitcoin | BTCUSD - W | -0.21% | 2.47% | 59,660.11 | |
| Bitcoin Cash | BCHUSD - W | 1.17% | 21.35% | 680.44 | |
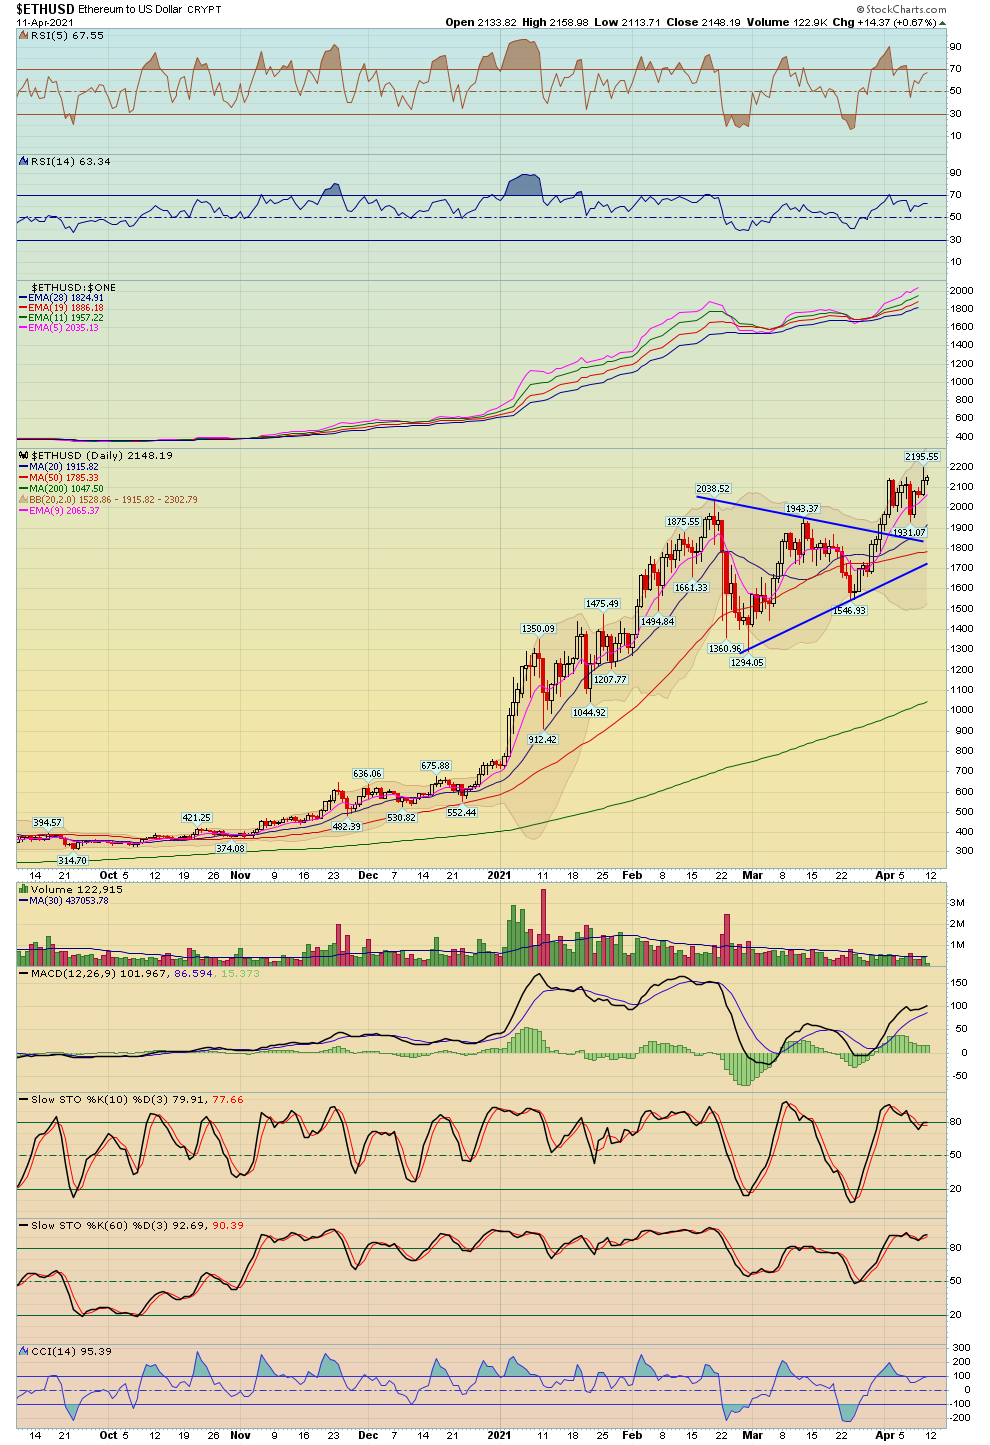
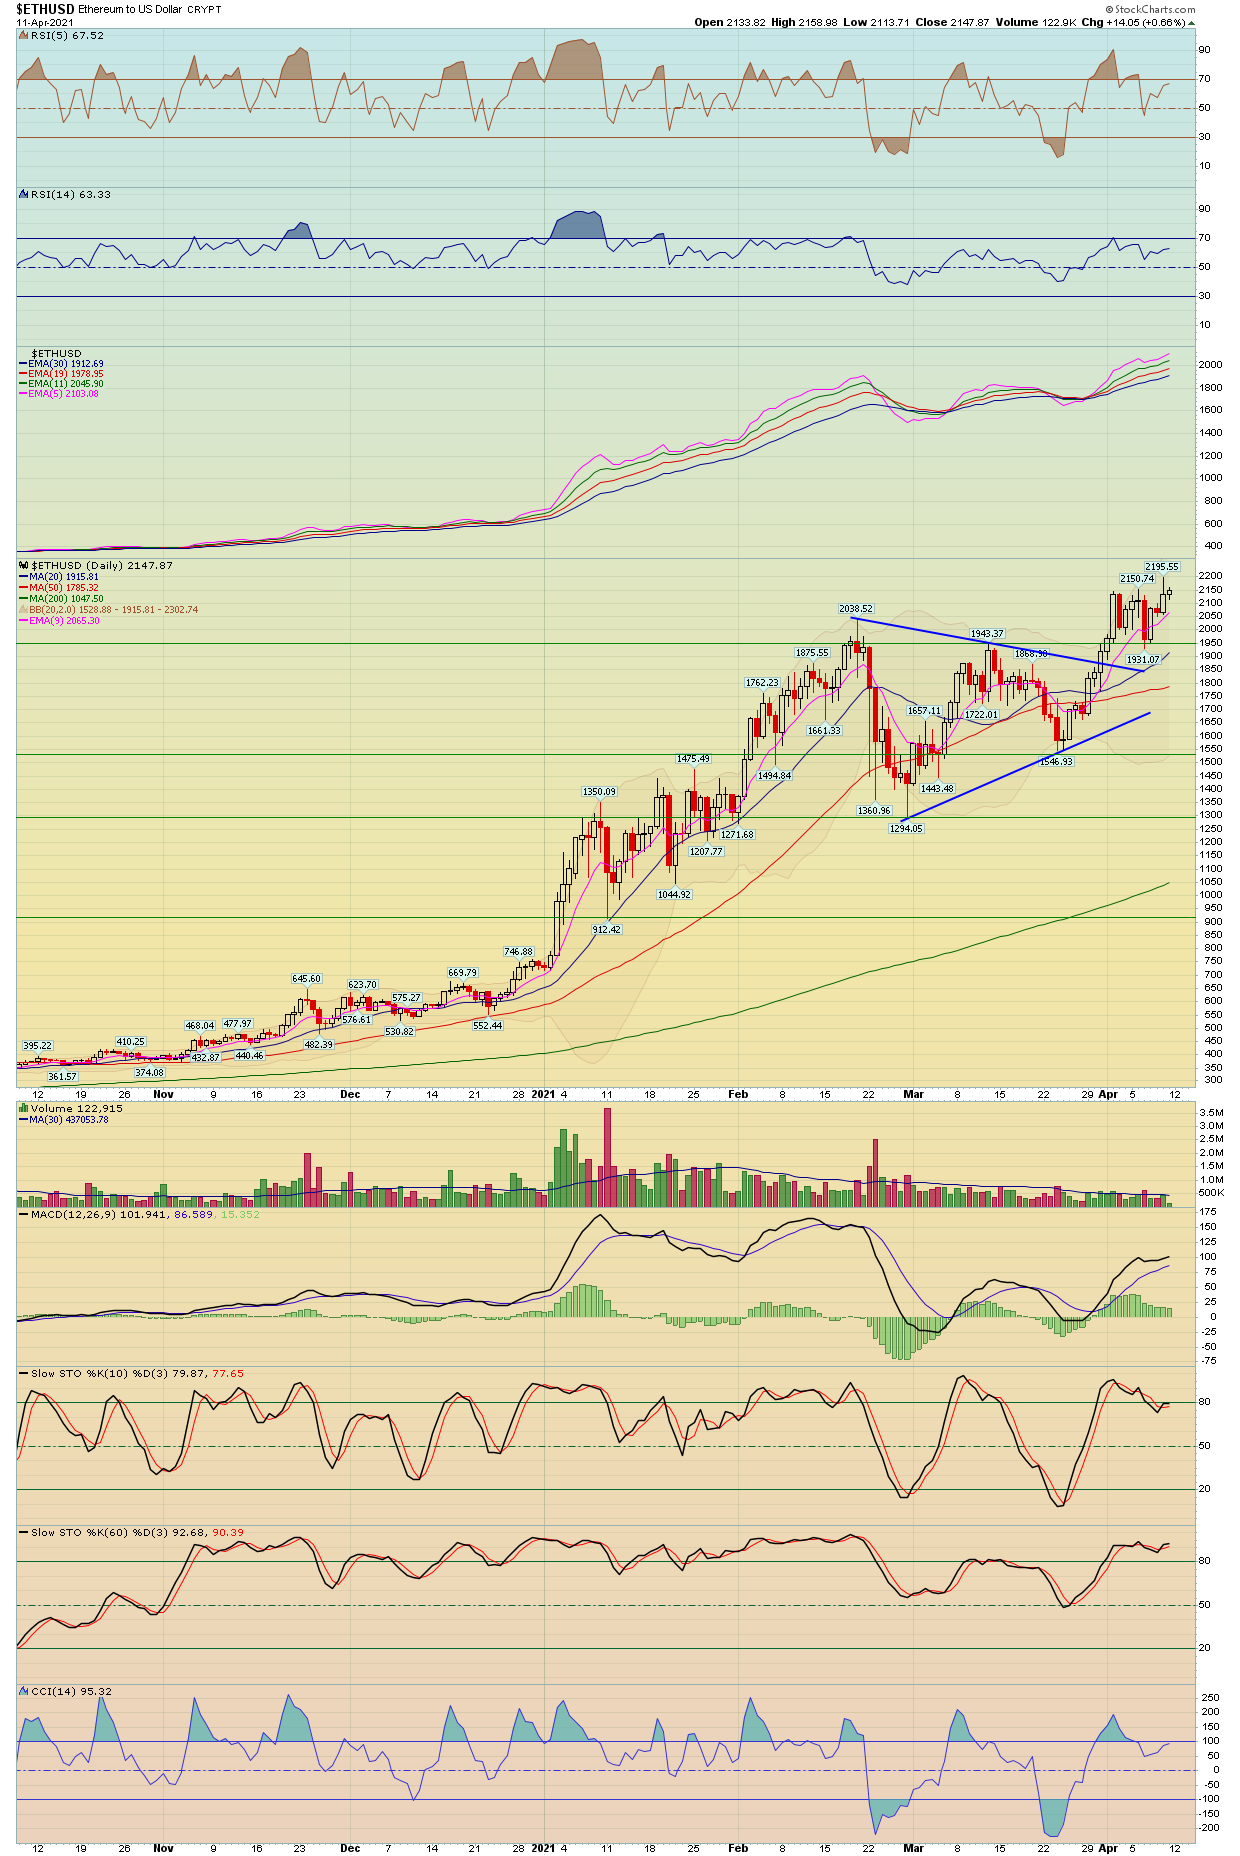
| Etherium | ETHUSD - W | 0.25% | 3.01% | 2,139.13 | |
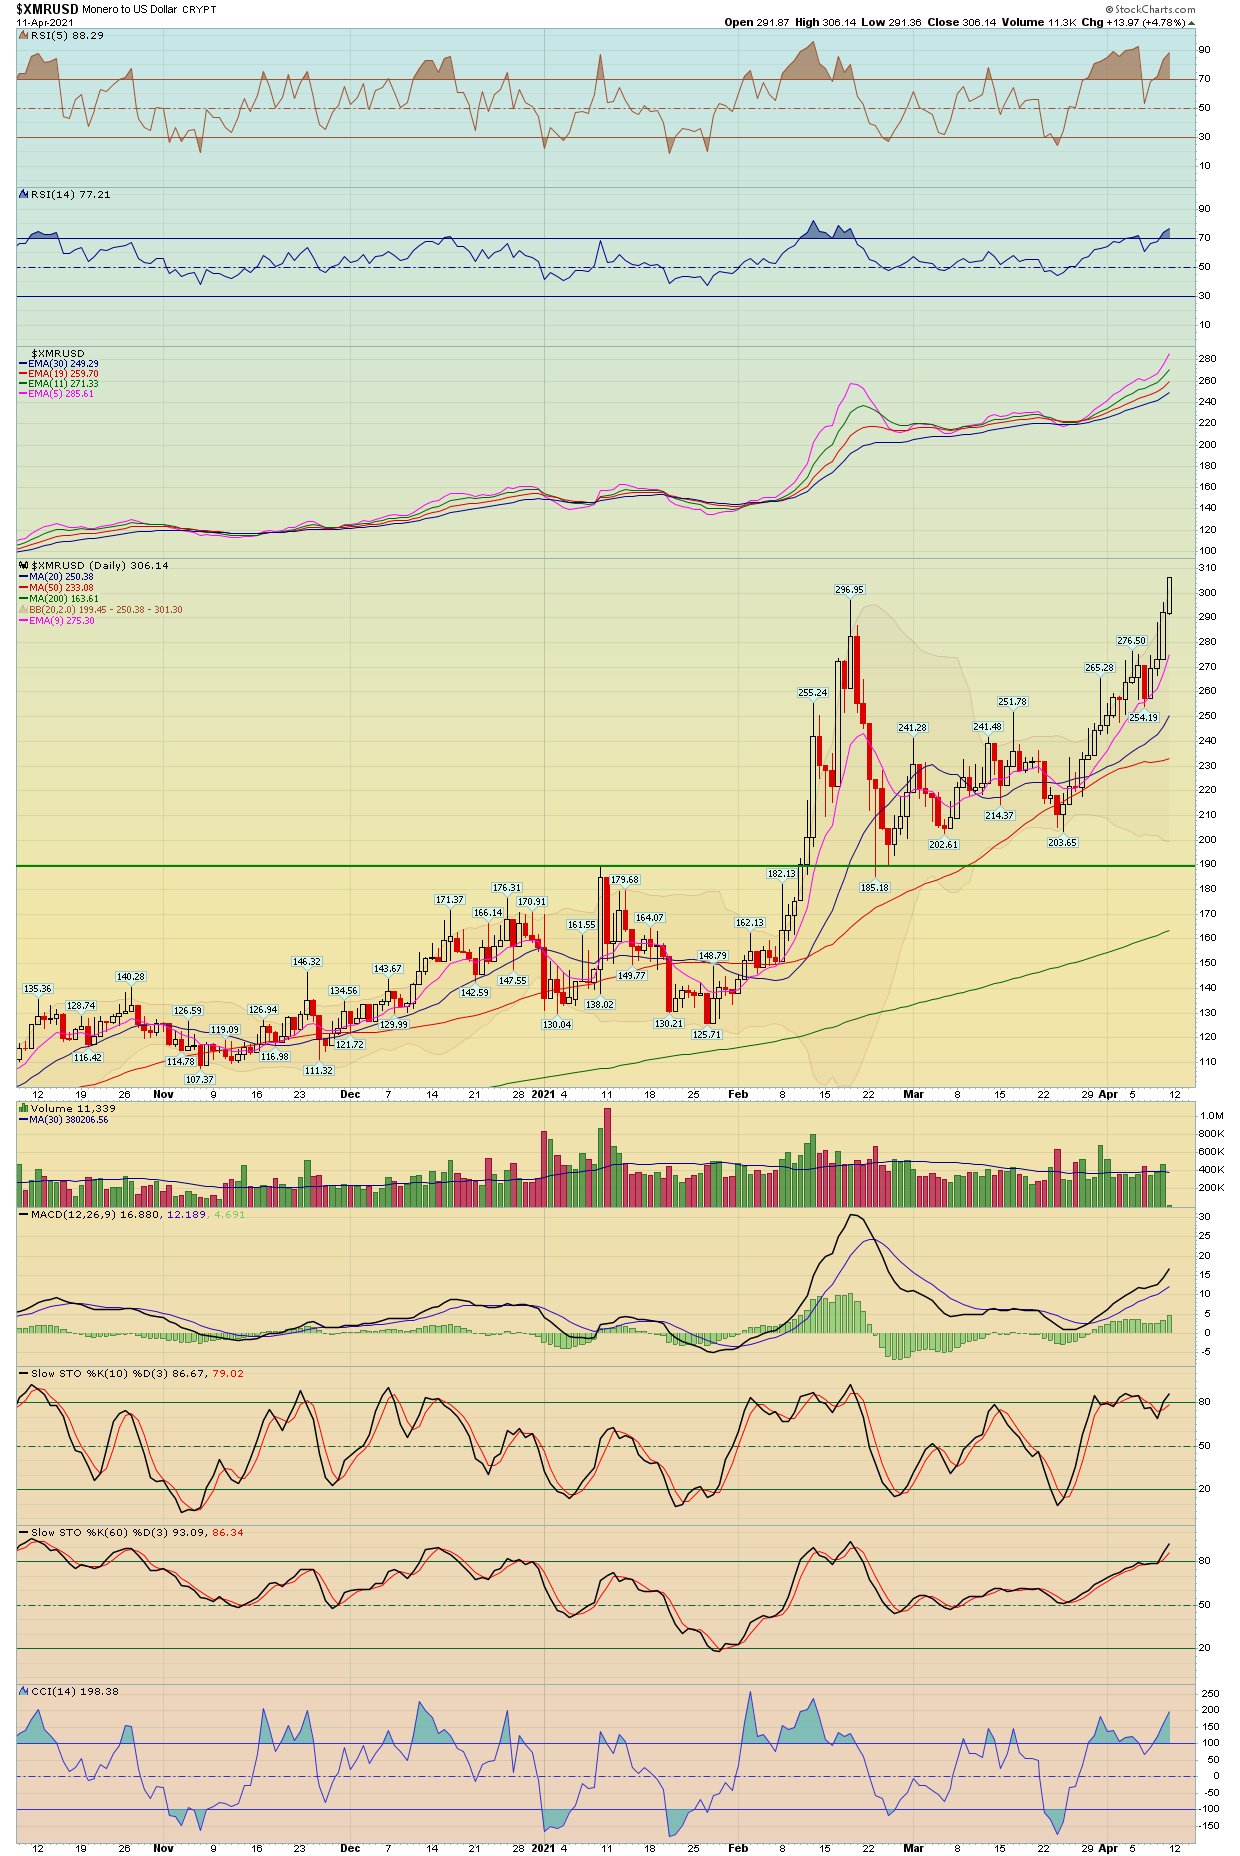
| Monero | XMRUSD - W | 11.32% | 23.29% | 325.24 | |
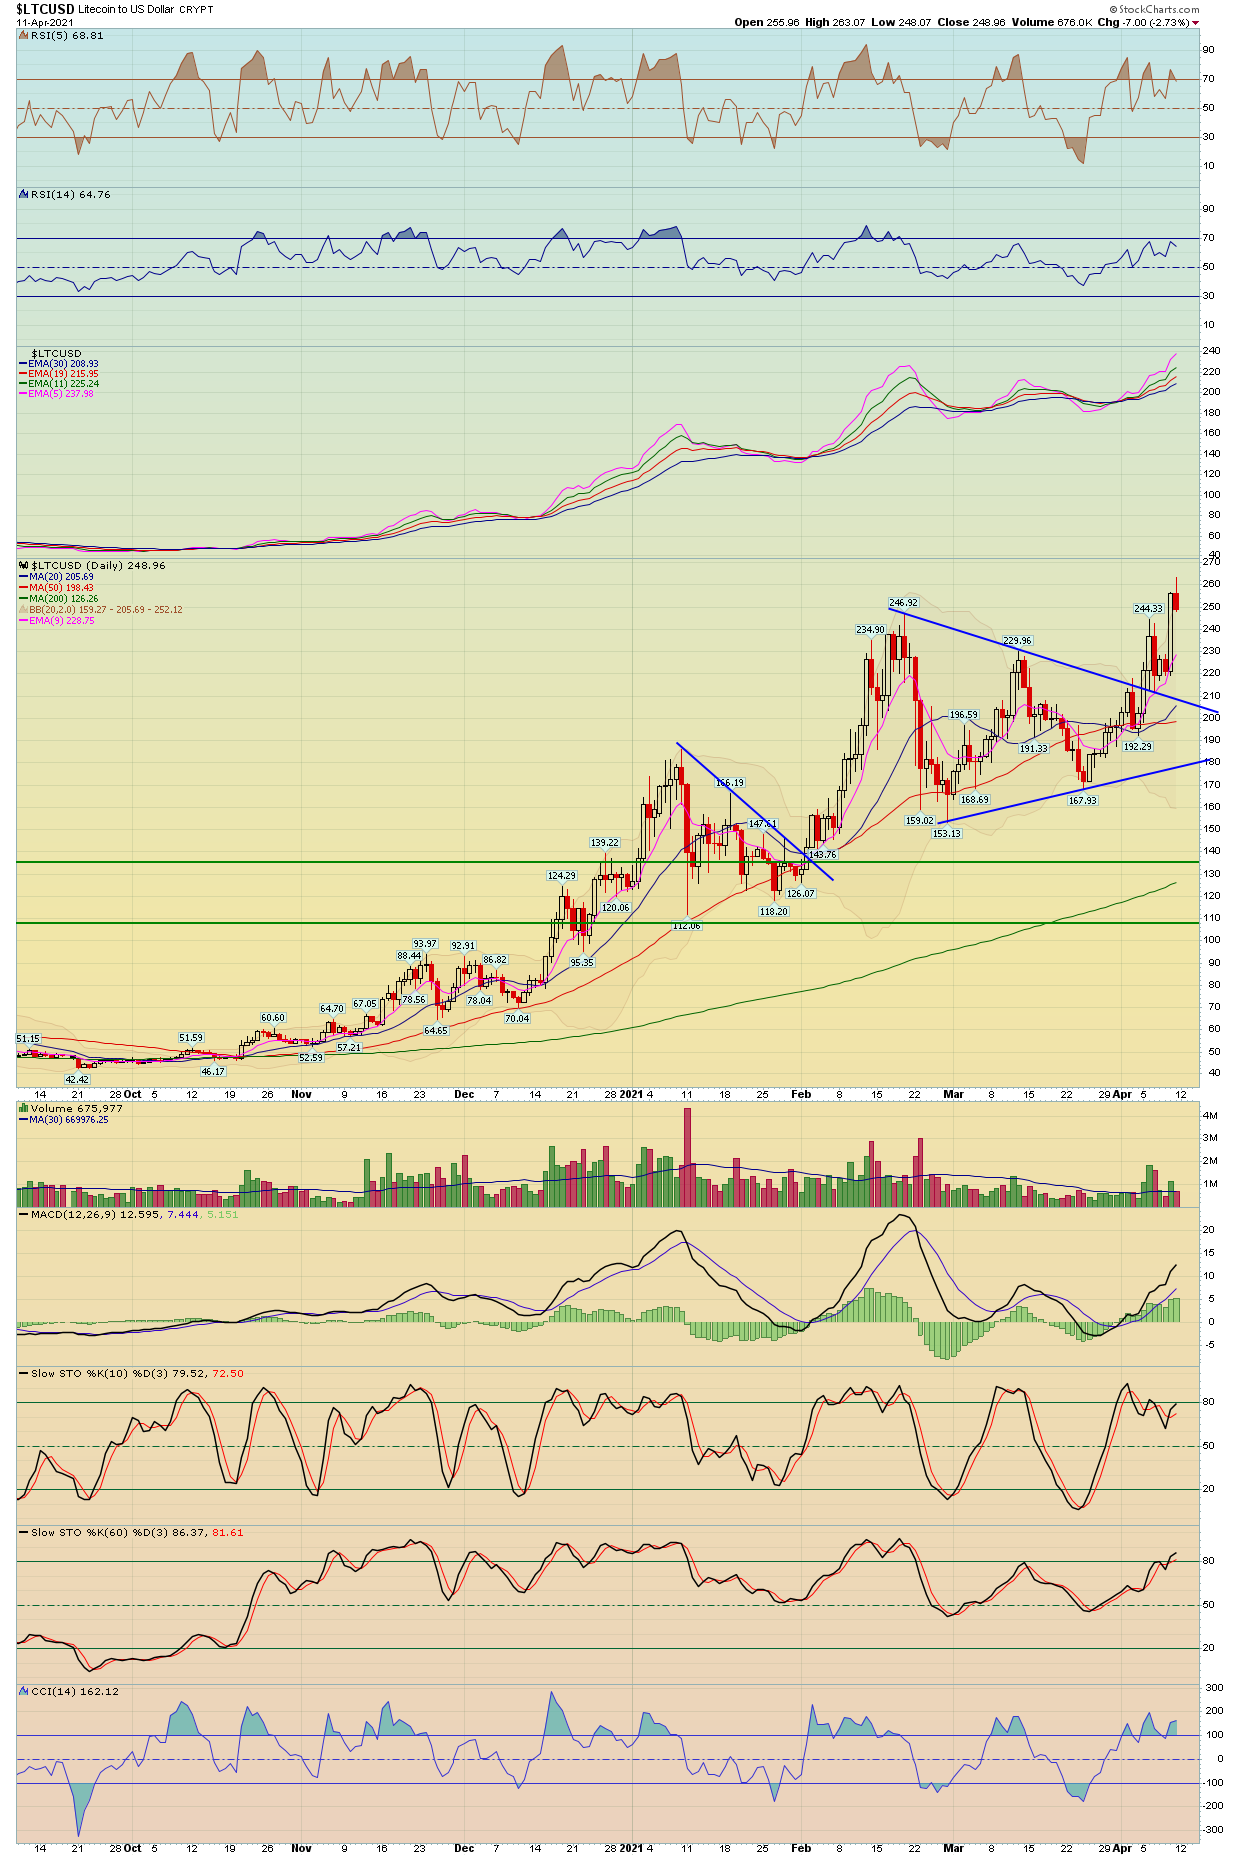
| Litecoin | LTCUSD - W | -2.41% | 23.48% | 249.78 | |
| Ripple | XRPUSD - W | 1.38% | 119.16% | 1.39 |
| Commodities | Index Symbol | ETF Symbol | % G / L Day | % G / L Week | Close |
|---|---|---|---|---|---|
| Commodities | DBC - W | -0.36% | -0.65% | 16.78 | |
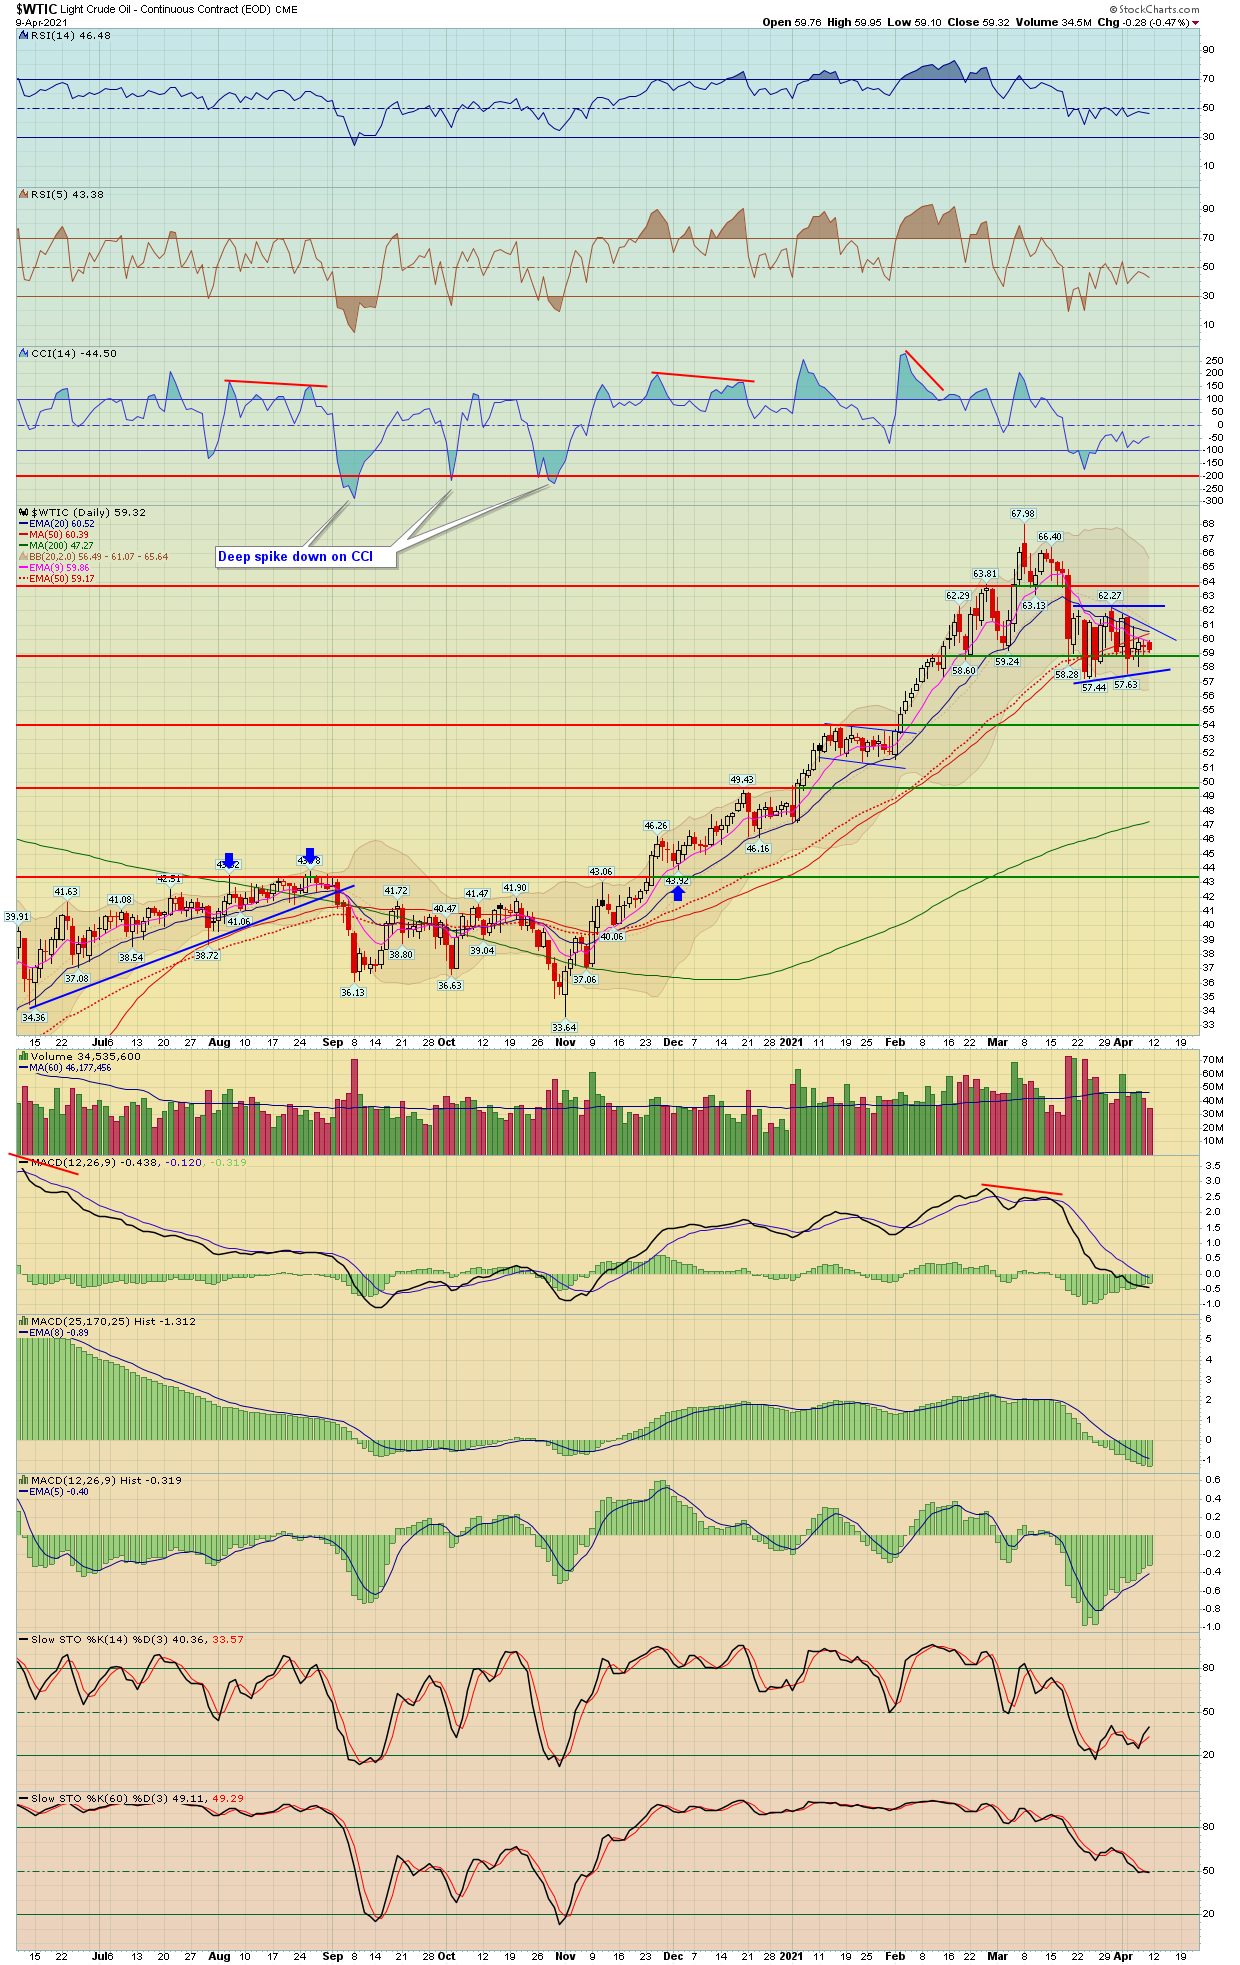
| Crude Oil | WTIC - W | USO - W | -0.47% | -3.47% | 59.32 |
| Gasoline | GASO - W | 0.14% | -2.98% | 1.96 | |
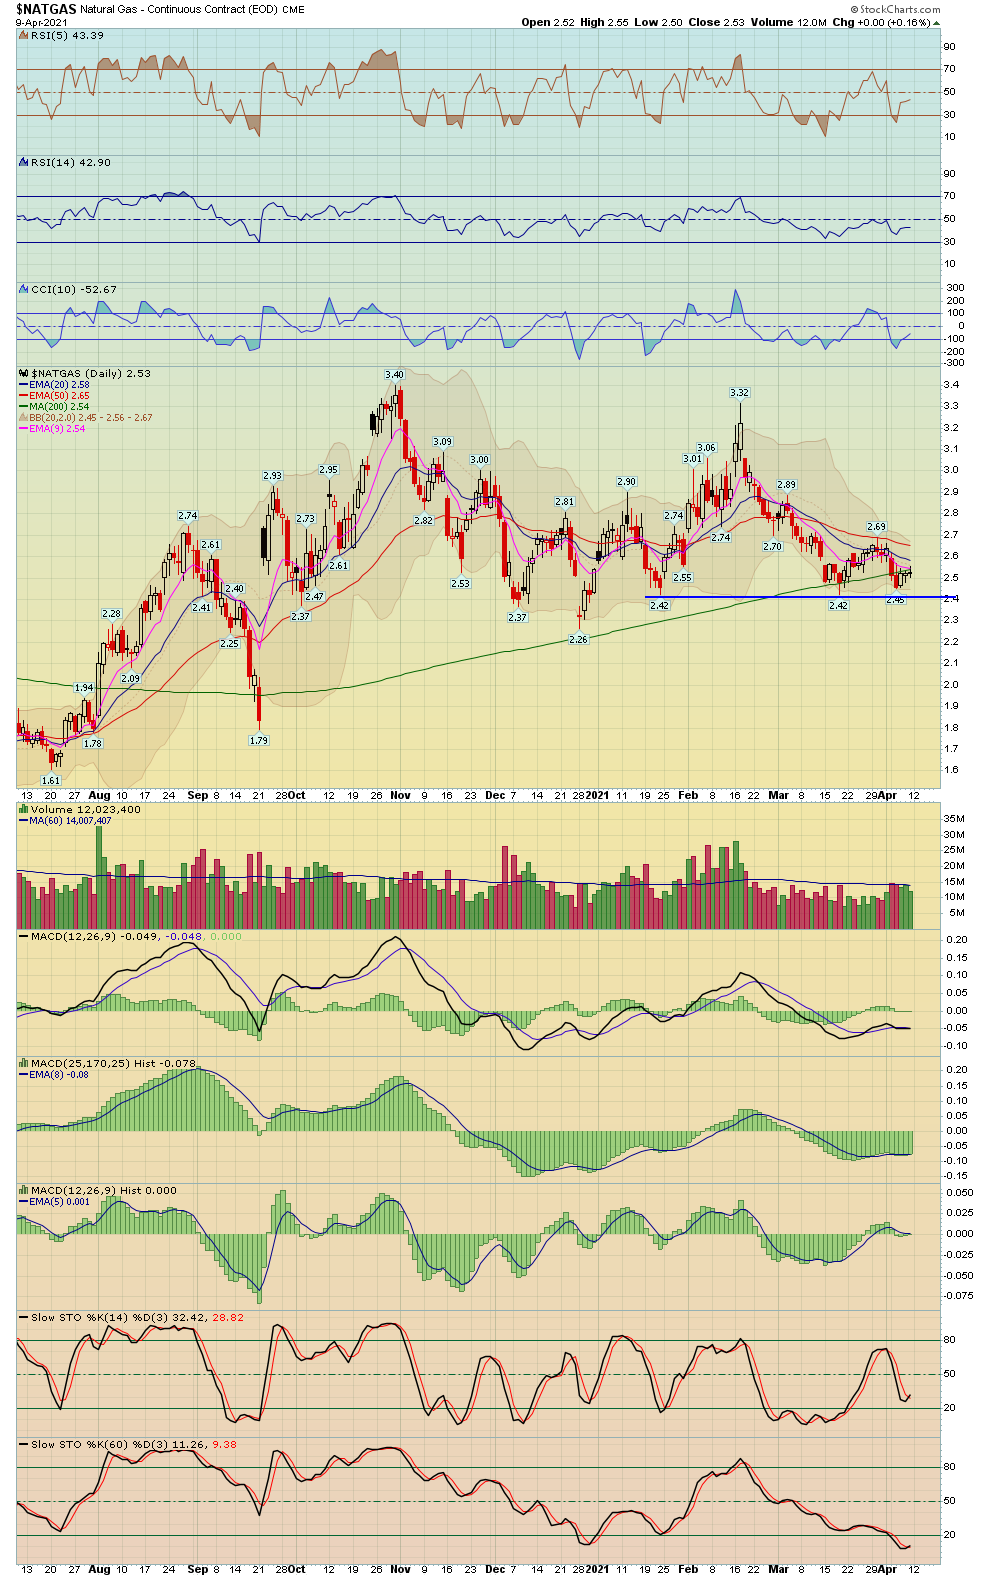
| Natural Gas | NATGAS - W | UNG - W | 0.16% | -4.28% | 2.53 |
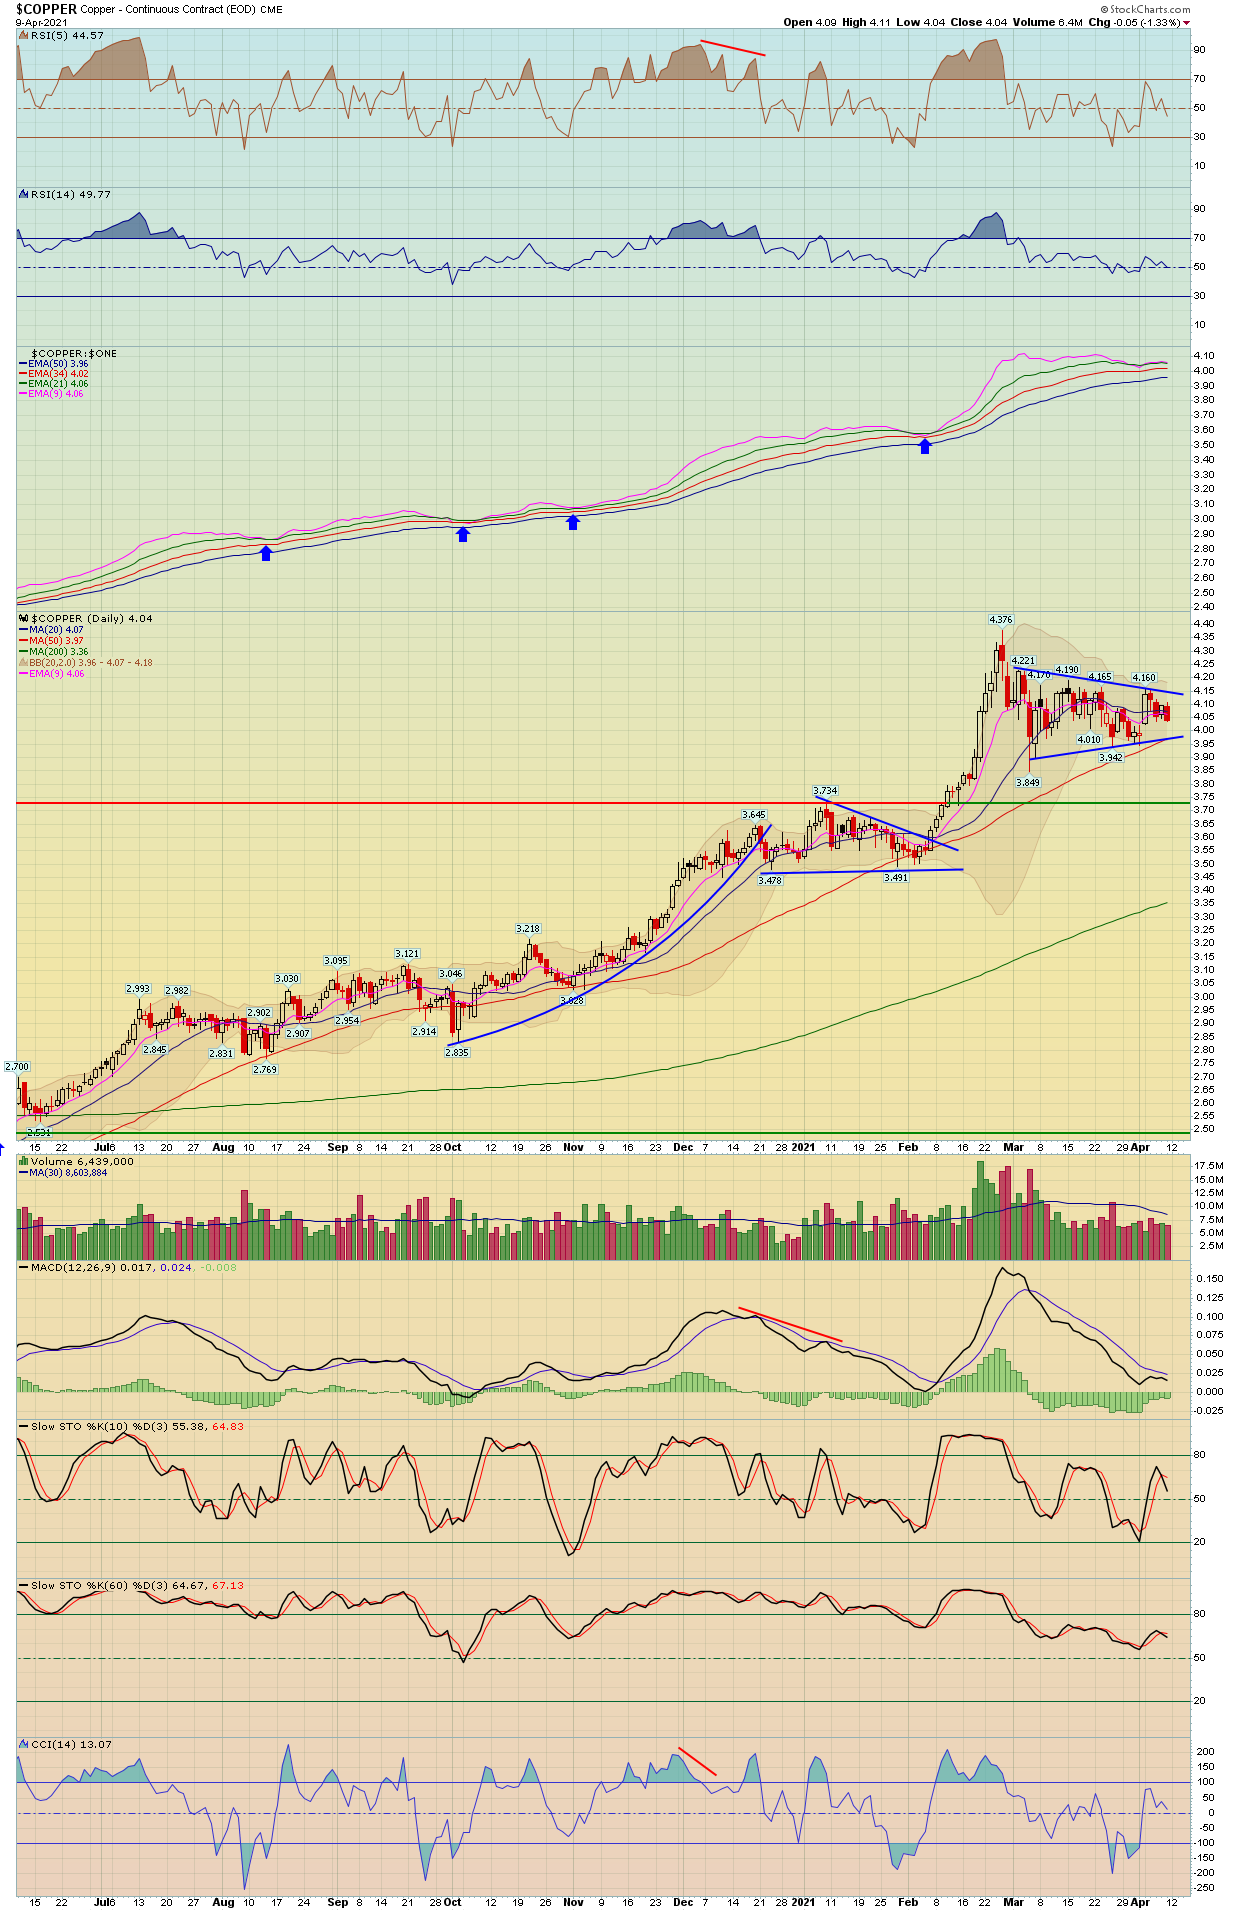
| Copper | COPPER - W | JJCB - W | -1.33% | 1.24% | 4.04 |
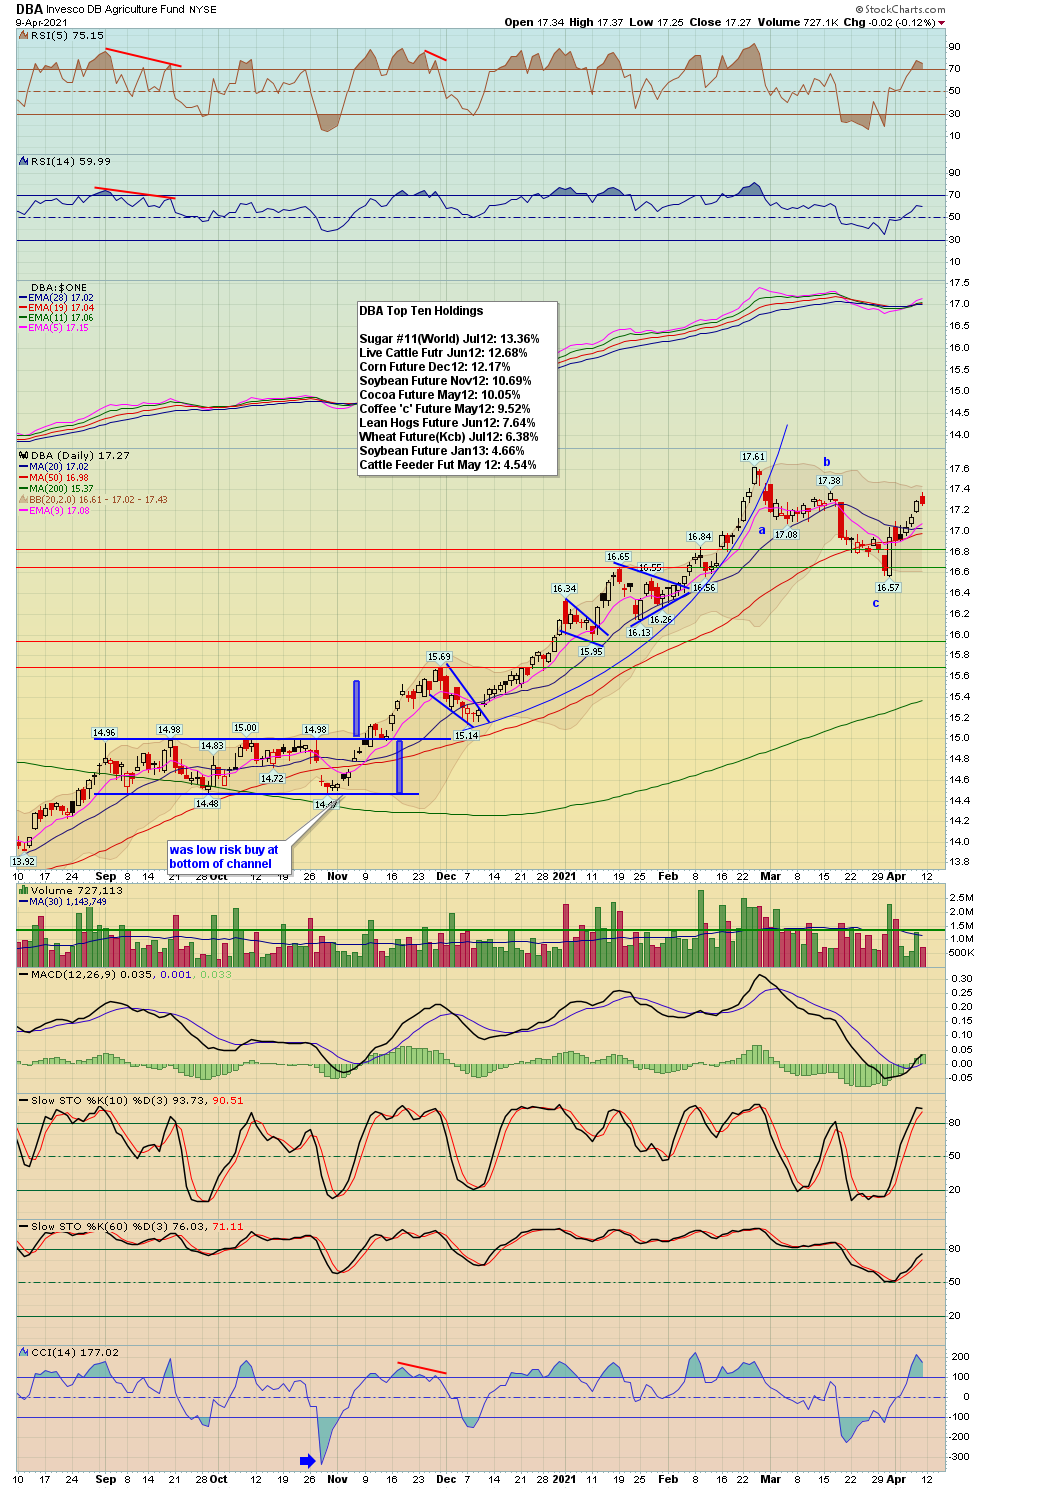
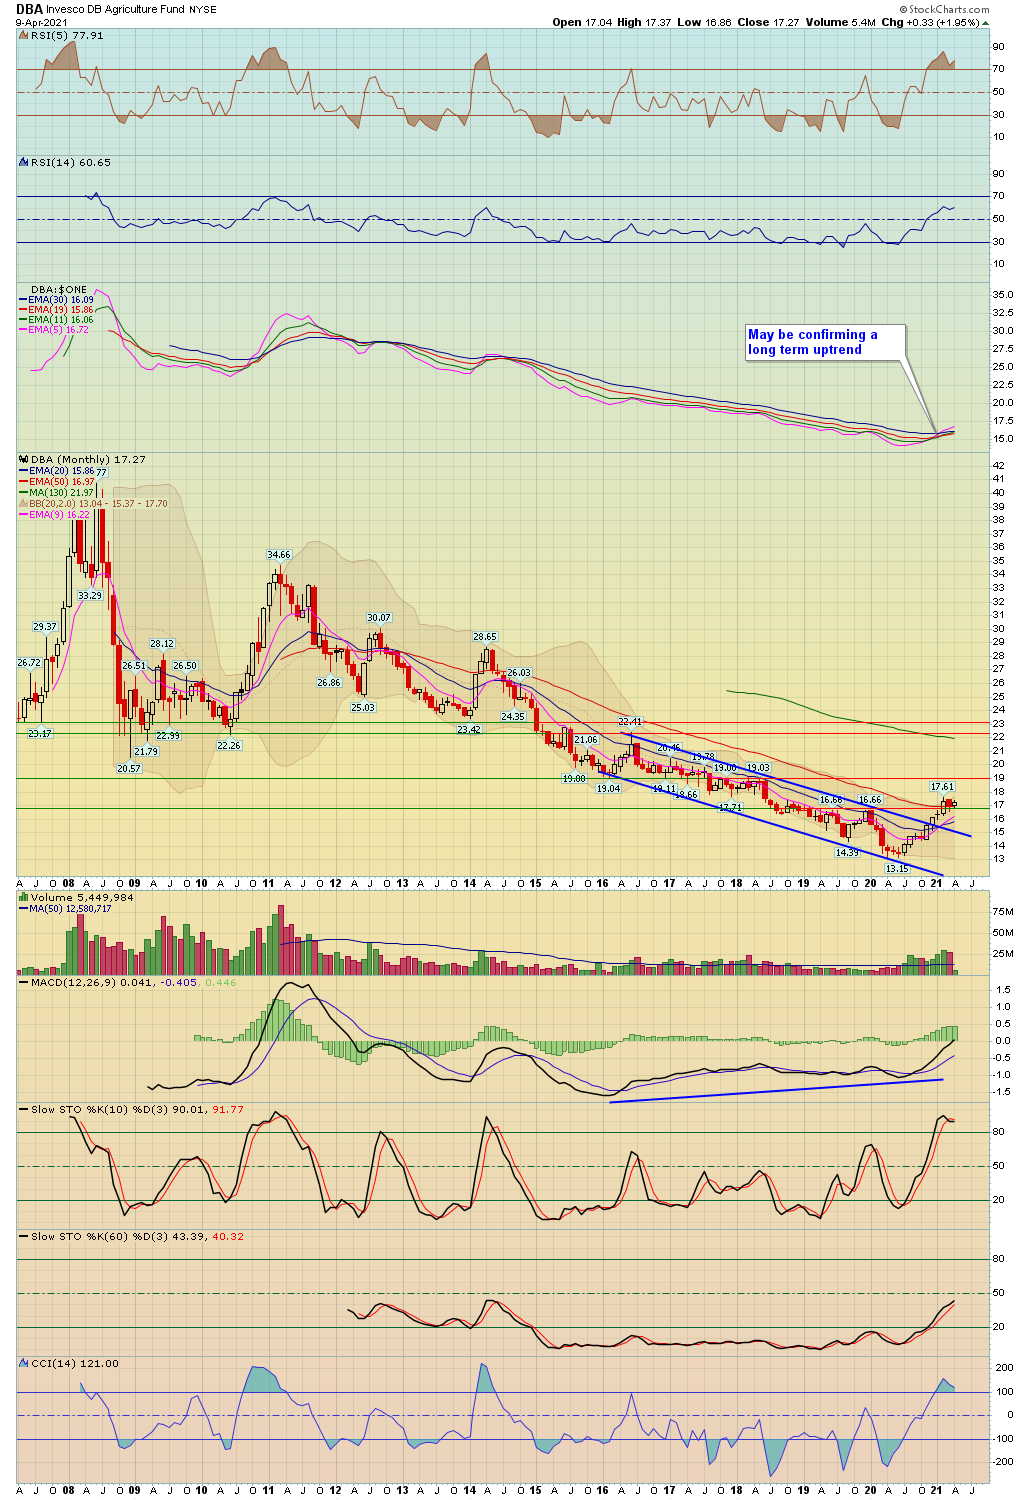
| Agriculture | DBA - W | -0.12% | 2.13% | 17.27 | |
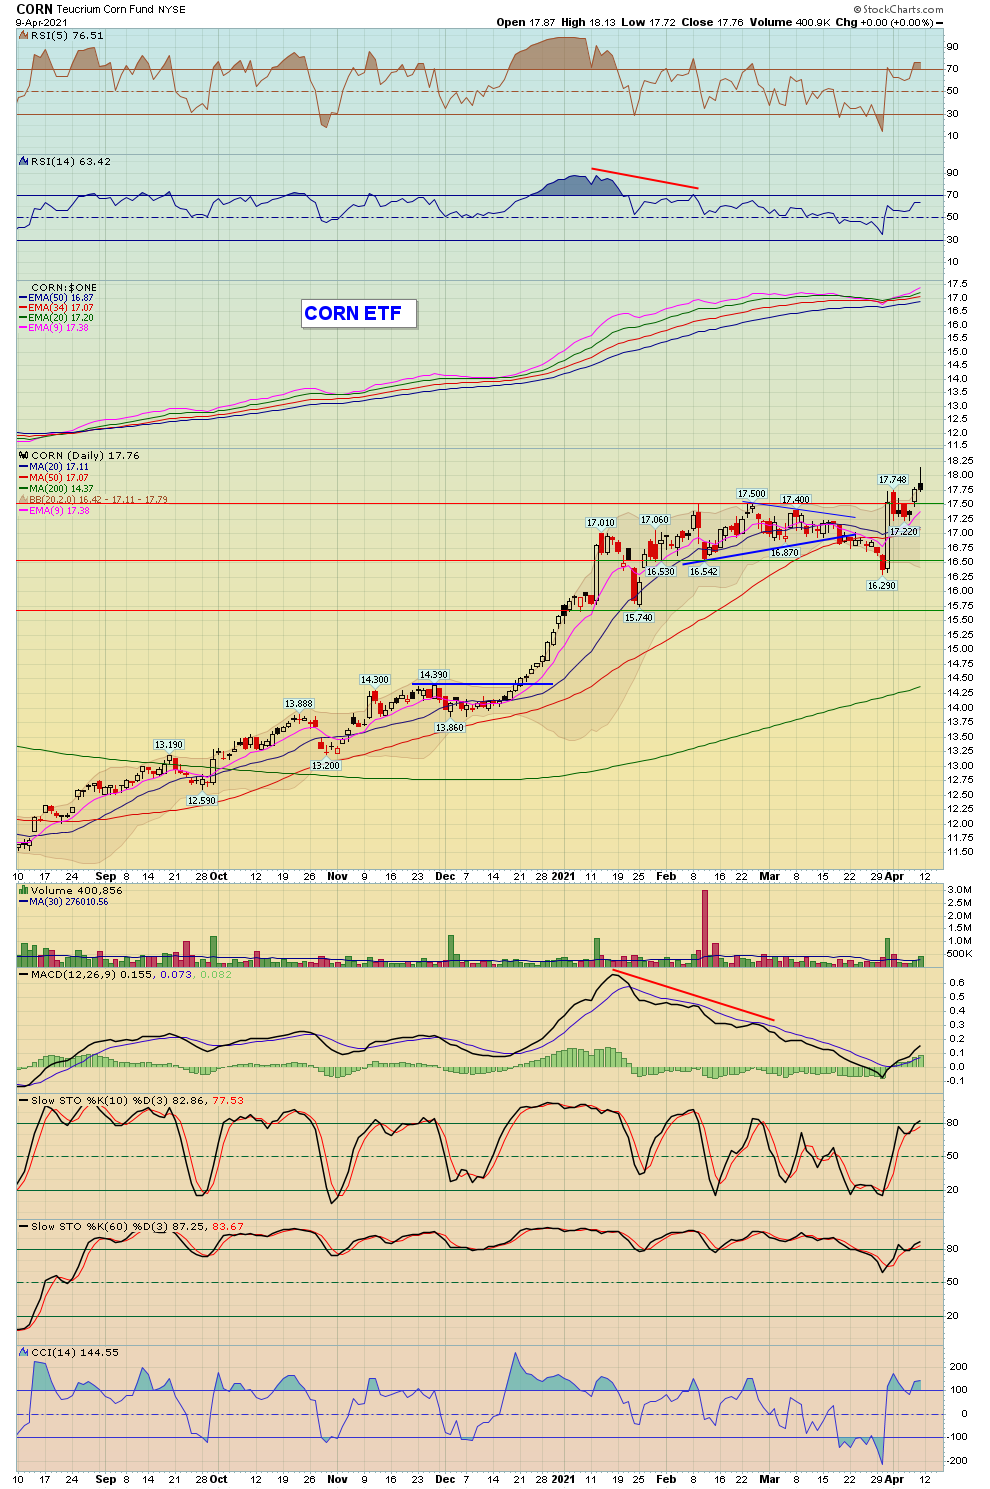
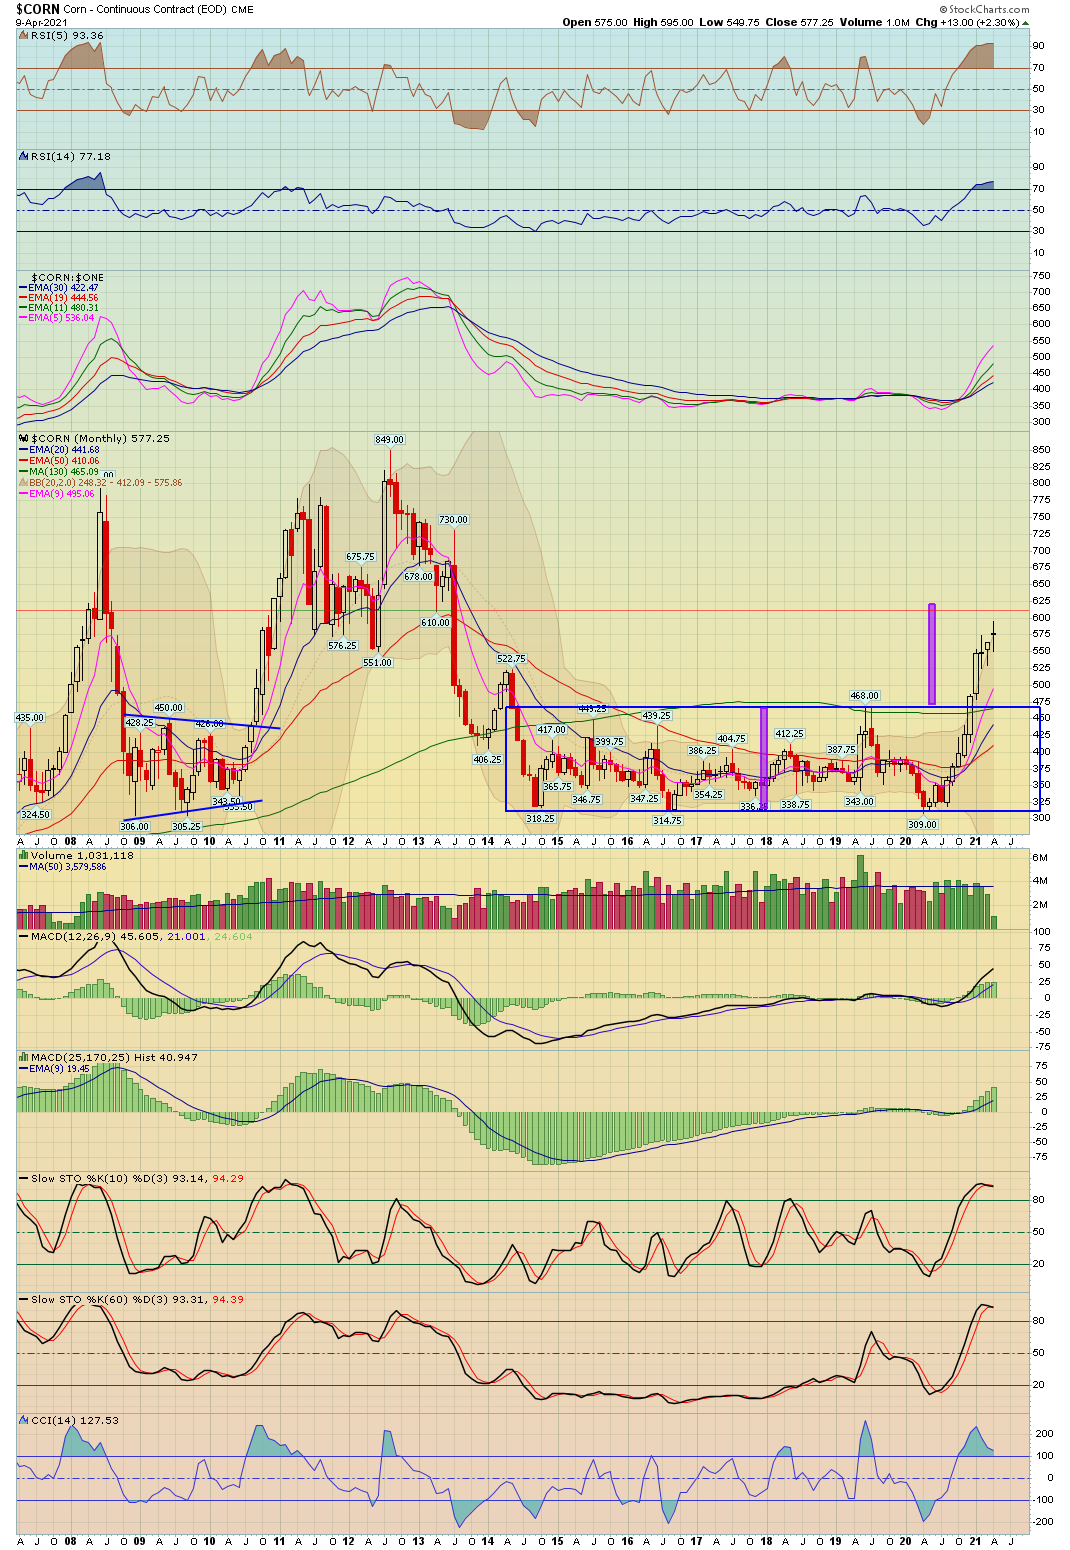
| Corn | CORN - W | CORN - W | -0.43% | 3.13% | 577.25 |
| Wheat | WHEAT - W | WEAT - W | 1.59% | 4.54% | 638.75 |
| Coffee | JO - W | -0.70% | 4.25% | 36.77 | |
| Sugar | CANE - W | 1.79% | 5.29% | 7.36 |
| Precious Metals | Index Symbol | ETF Symbol | % G / L Day | % G / L Week | Close |
|---|---|---|---|---|---|
| Gold Metal | GLD - W | -0.75% | 0.80% | 163.27 | |
| Silver | SLV - W | -0.89% | 1.12% | 23.41 | |
| Platinum | PPLT - W | -2.12% | -0.60% | 112.87 | |
| Palladium | PALL - W | 0.56% | -1.02% | 247.42 | |
| GDX Gold Miners ETF | GDX - W | 0.00% | 3.36% | 34.73 |
| Bonds | Index Symbol | ETF Symbol | % G / L Day | % G / L Week | Close |
|---|---|---|---|---|---|
| High Yield Corporate Bond | HYG - W | -0.07% | 0.15% | 87.20 | |
| TLT 20 Year Bond ETF | TLT - W | -0.36% | 0.00% | 137.51 | |
| 10 Year Treasury Yield | TNX - W | 2.08% | -0.77% | 16.66 | |
| 30 Year Treasury Yield | TYX - W | 0.73% | -0.04% | 23.39 |
7
| Release | ET | For | Trading Impact | Forecast | Consensus | Prior |
|---|---|---|---|---|---|---|
| Apr 12 | ||||||
| Treasury Budget | 14:00 | Mar | Low | NA | -$658.0B | -$118.9B |
| Apr 13 | ||||||
| NFIB Small Business Optimism | 06:00 | Mar | Low | NA | NA | 95.8 |
| CPI | 08:30 | Mar | High | 0.6% | 0.5% | 0.4% |
| Core CPI | 08:30 | Mar | High | 0.3% | 0.2% | 0.1% |
| Apr 14 | ||||||
| MBA Mortgage Applications Index | 07:00 | 04/10 | Low | NA | NA | -5.1% |
| Import Prices | 08:30 | Mar | Low | NA | NA | 1.3% |
| Import Prices ex-oil | 08:30 | Mar | Low | NA | NA | 0.4% |
| Export Prices | 08:30 | Mar | Low | NA | NA | 1.6% |
| Export Prices ex-ag. | 08:30 | Mar | Low | NA | NA | 1.5% |
| EIA Crude Oil Inventories | 10:30 | 04/10 | High | NA | NA | -3.52M |
| Fed's Beige Book | 14:00 | Apr | Low | NA | NA | NA |
| Apr 15 | ||||||
| Retail Sales | 08:30 | Mar | High | 6.0% | 5.3% | -3.0% |
| Retail Sales ex-auto | 08:30 | Mar | High | 5.3% | 4.9% | -2.7% |
| Initial Claims | 08:30 | 04/10 | High | 705K | 695K | 744K |
| Continuing Claims | 08:30 | 04/03 | High | NA | NA | 3.734M |
| Empire State Manufacturing | 08:30 | Apr | Low | 25.0 | 23.0 | 17.4 |
| Philadelphia Fed Index | 08:30 | Apr | Low | 41.5 | 35.0 | 51.8 |
| Industrial Production | 09:15 | Mar | Medium | 3.2% | 2.9% | -2.2% |
| Capacity Utilization | 09:15 | Mar | Medium | 75.7% | 75.9% | 73.8% |
| Business Inventories | 10:00 | Feb | Low | 0.5% | 0.5% | 0.3% |
| NAHB Housing Market Index | 10:00 | Apr | Medium | 84.0 | 84.0 | 82.0 |
| EIA Natural Gas Inventories | 10:30 | 04/10 | Low | NA | NA | +20 bcf |
| Net Long-Term TIC Flows | 16:00 | Feb | Low | NA | NA | $90.8B |
| Apr 16 | ||||||
| Housing Starts | 08:30 | Mar | High | 1650K | 1621K | 1421K |
| Building Permits | 08:30 | Mar | High | 1800K | 1750K | 1682K |
| Univ. of Michigan Consumer Sentiment - Prelim | 10:00 | Apr | High | 89.0 | 88.0 | 84.9 |
Stock Earnings Calender:
Click here for a list of Stocks that are reporting Earnings
**Generally we never hold a position into earnings since the risk/reward is too great
8 - View Live Chart
9
10
11
12
13
14 - View Live Chart
15 - View Live Chart
16 - View Live Chart
17 - View Live Chart
18 - View Live Chart
19 - View Live Chart
20 - View Live Chart
21 - View Live Chart
22 - View Live Chart
23 - View Live Chart
24 - View Live Chart
25
26
27
28 - View Live Chart
29 - View Live Chart
30 - View Live Chart
31 - View Live Chart
32 - View Live Chart
33 - View Live Chart
34 - View Live Chart
35 - View Live Chart
36 - View Live Chart
37 - View Live Chart
38 - View Live Chart
39 - View Live Chart
40 - View Live Chart
41 - View Live Chart
42 - View Live Chart
43 - View Live Chart
44 - View Live Chart
45 - View Live Chart
46 - View Live Chart
47 - View Live Chart
48 - View Live Chart
49 - View Live Chart
50 - View Live Chart
51 - View Live Chart
52 - View Live Chart
53 - View Live Chart
54 - View Live Chart
55 - View Live Chart
56 - View Live Chart
57 - View Live Chart
58 - View Live Chart
59 - View Live Chart
60 - View Live Chart
61 - View Live Chart
62 - View Live Chart
63 - View Live Chart
64 - View Live Chart
65 - View Live Chart
66 - View Live Chart
67 - View Live Chart
68 - View Live Chart
69 - View Live Chart
70 - View Live Chart
71 - View Live Chart
72 - View Live Chart
73 - View Live Chart
74 - View Live Chart
75 - View Live Chart
76 - View Live Chart
77 - View Live Chart
78 - View Live Chart
79 - View Live Chart
80 - View Live Chart
81 - View Live Chart
82 - View Live Chart
83 - View Live Chart
84 - View Live Chart
85 - View Live Chart
86 - View Live Chart
87 - View Live Chart
88 - View Live Chart
89 - View Live Chart
90 - View Live Chart
91 - View Live Chart
92 - View Live Chart
93 - View Live Chart
94 - View Live Chart
95 - View Live Chart
96 - View Live Chart
97 - View Live Chart
98 - View Live Chart
99 - View Live Chart
100 - View Live Chart
101 - View Live Chart
102 - View Live Chart
103 - View Live Chart
104 - View Live Chart
105 - View Live Chart
106 - View Live Chart
107 - View Live Chart
108 - View Live Chart
109 - View Live Chart
110 - View Live Chart
111 - View Live Chart
112 - View Live Chart
113 - View Live Chart
114 - View Live Chart
115 - View Live Chart
- Hide Player Link to Newsletter Audio
- Hide Player Link to Newsletter Audio