BPT Weekend Newsletter for Sunday January 31st, 2021 - free
Disclaimer: Intraday Chart Links will show up as daily charts unless you have an active stockcharts.com membership and are signed in, you can sign up here.
1
Table of Contents:
This is an audio based newsletter, therefore please listen to my comments and observations during my 46 min discussion, I thought it was more important to get the newsletter out sooner vs spending another couple hrs writing a couple pages of text that I already cover in my audio discuss.
Otherwise here's a summary of the topics discussed:
- Introductory comments (r/wallstreetbets) and administrative discussion on the SPY reversion to mean systems
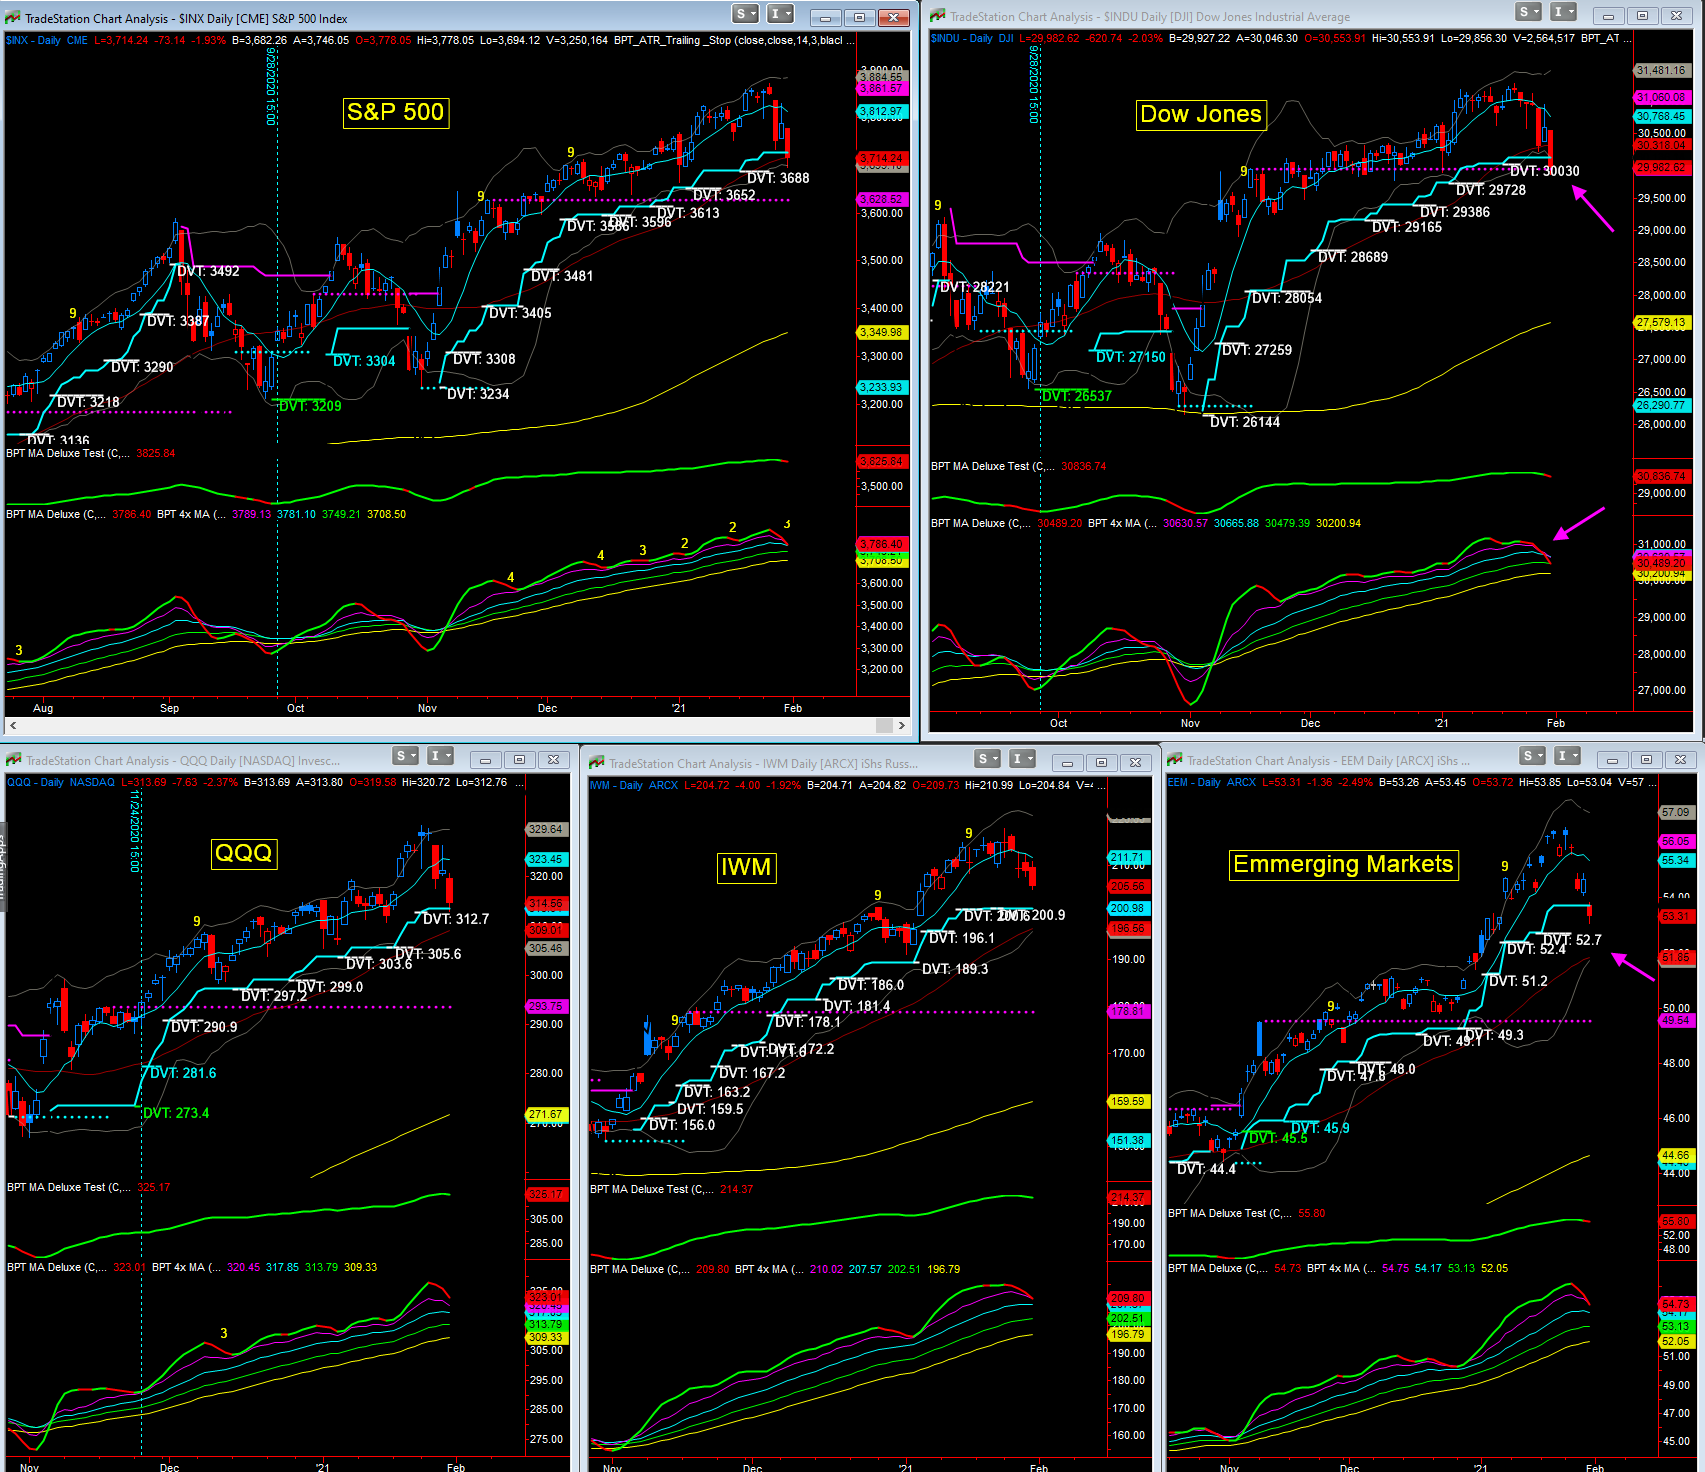
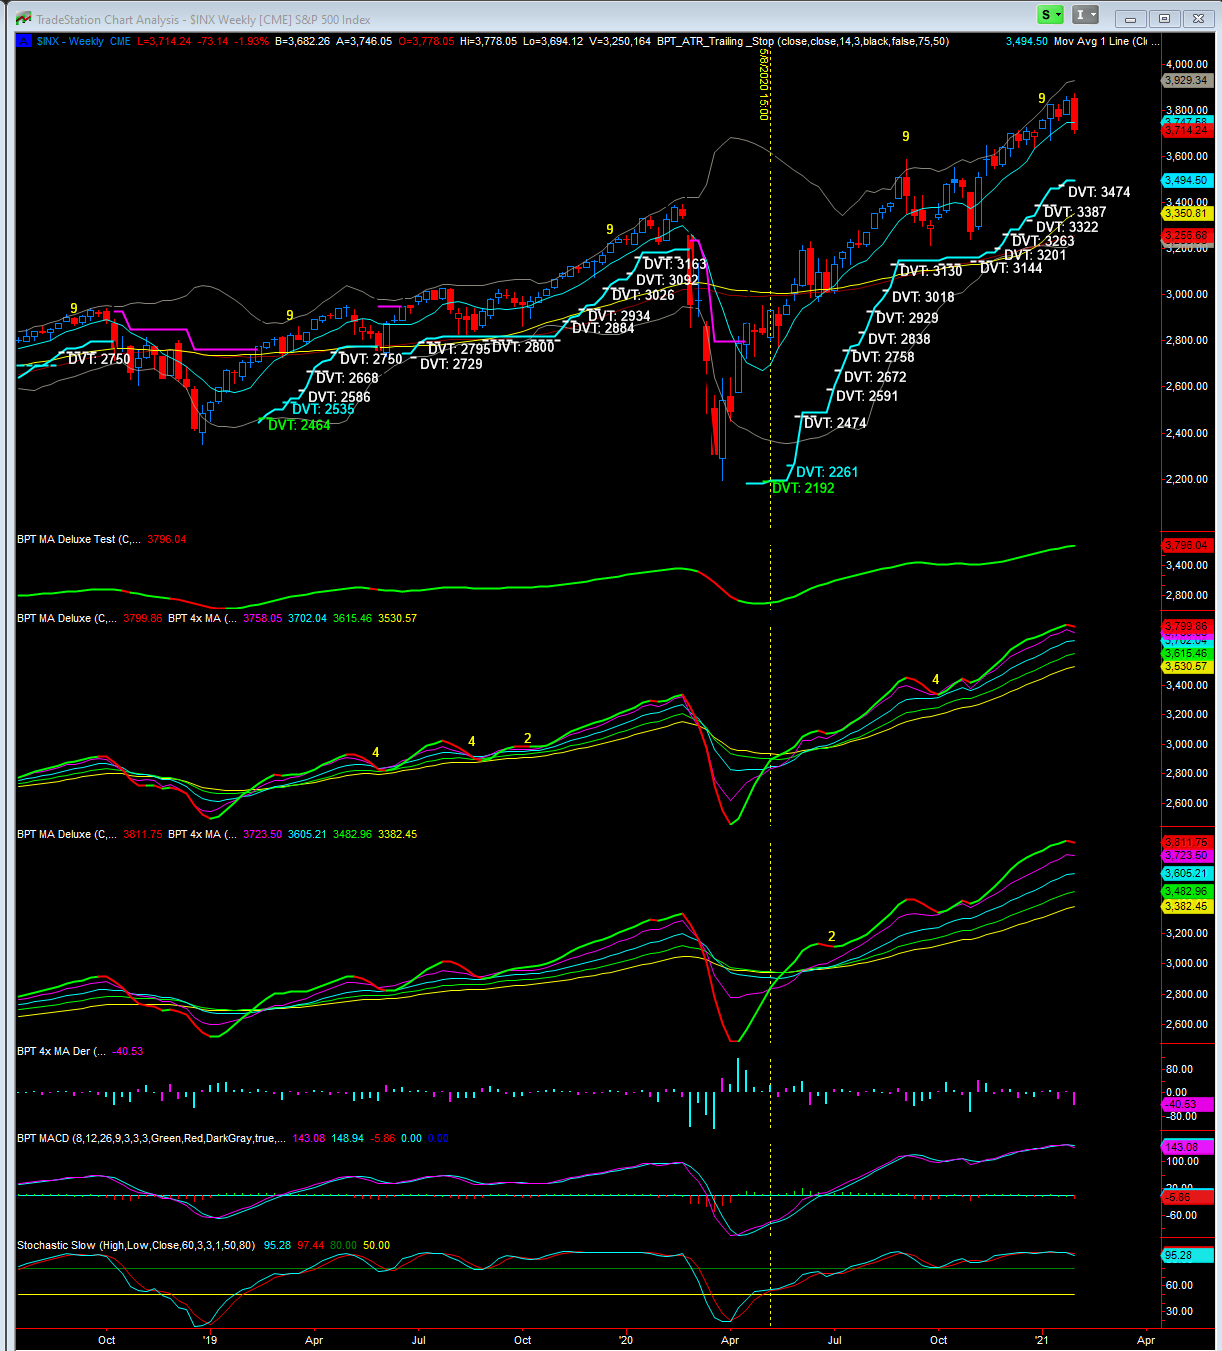
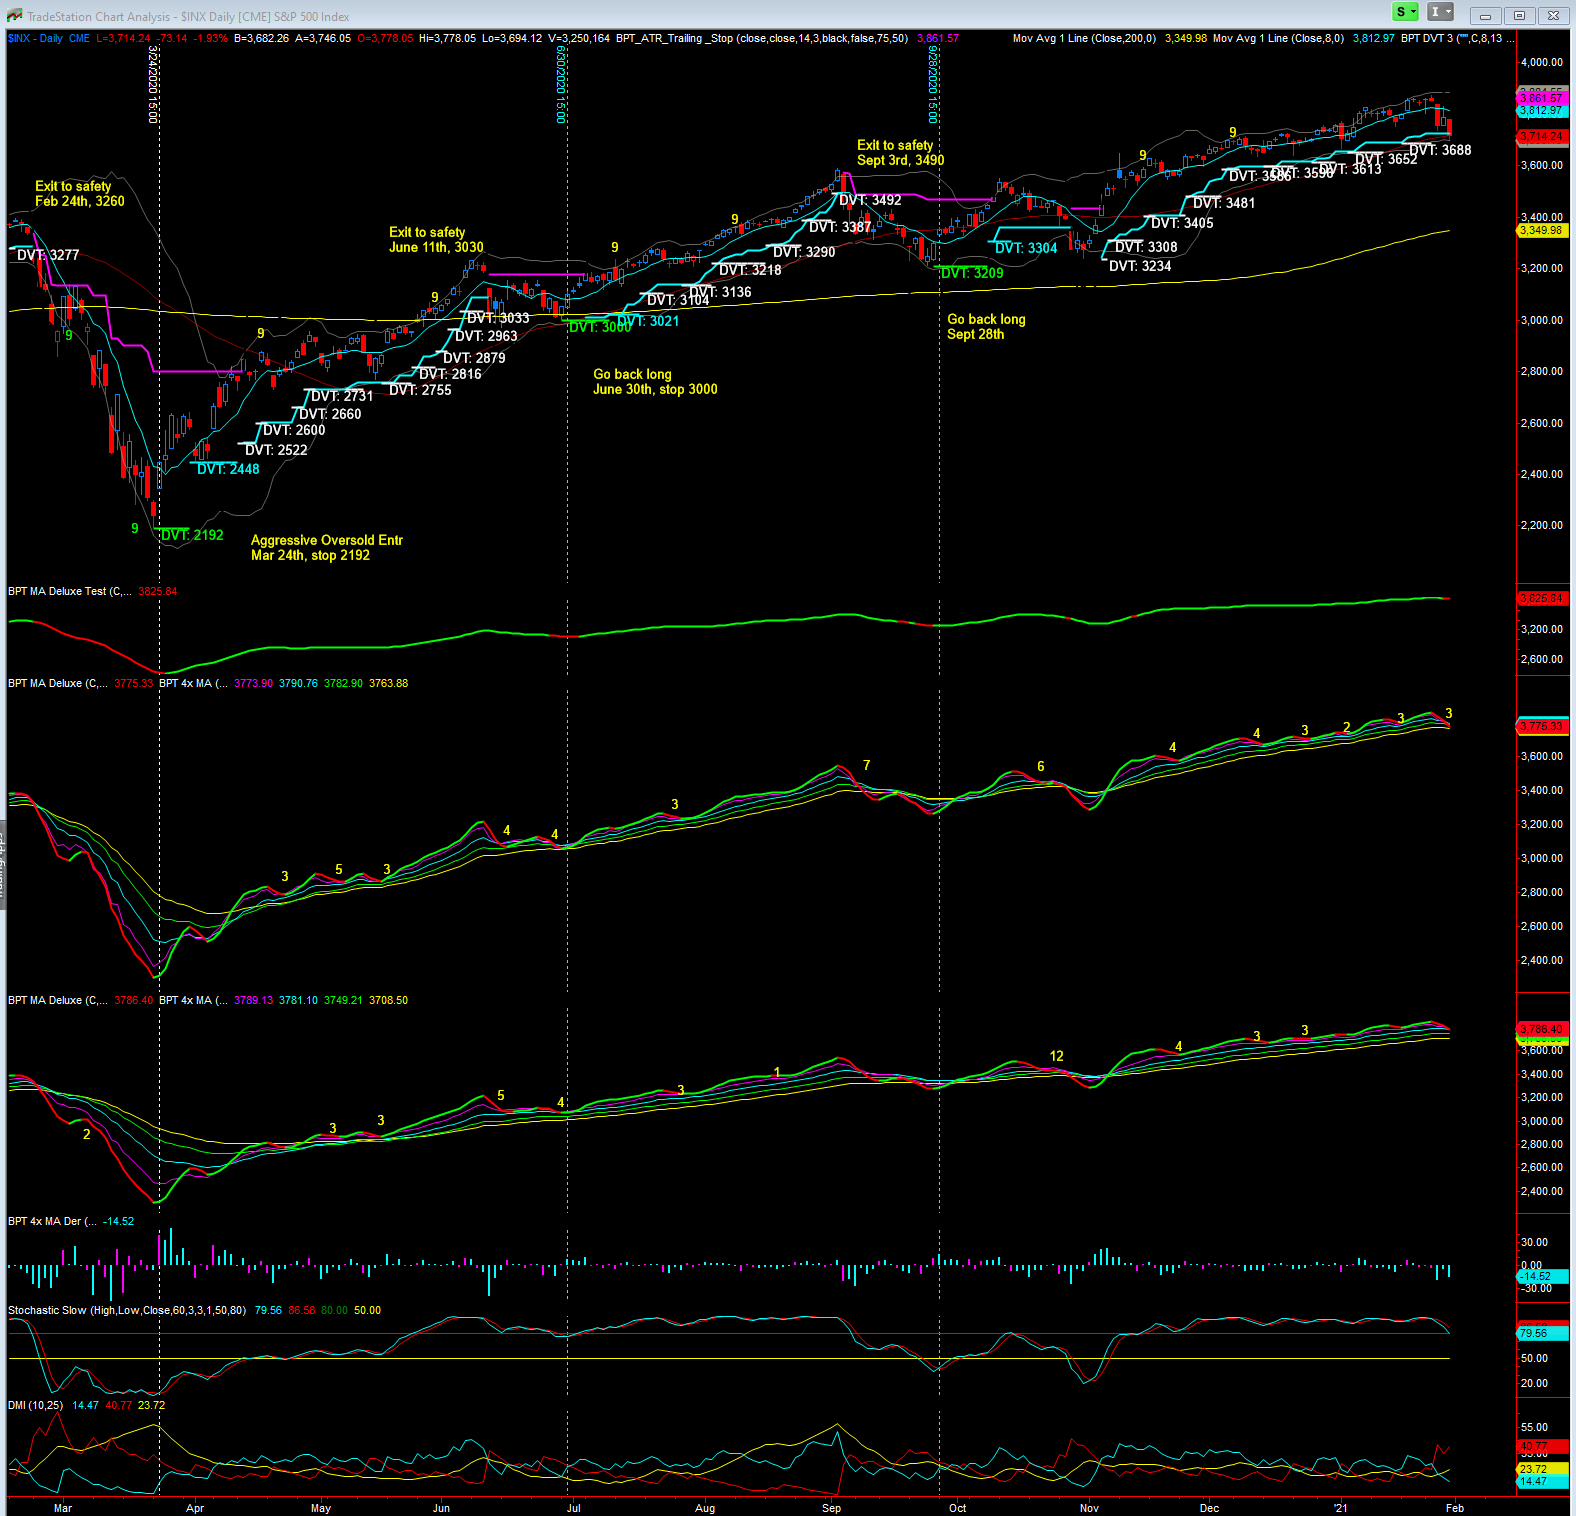
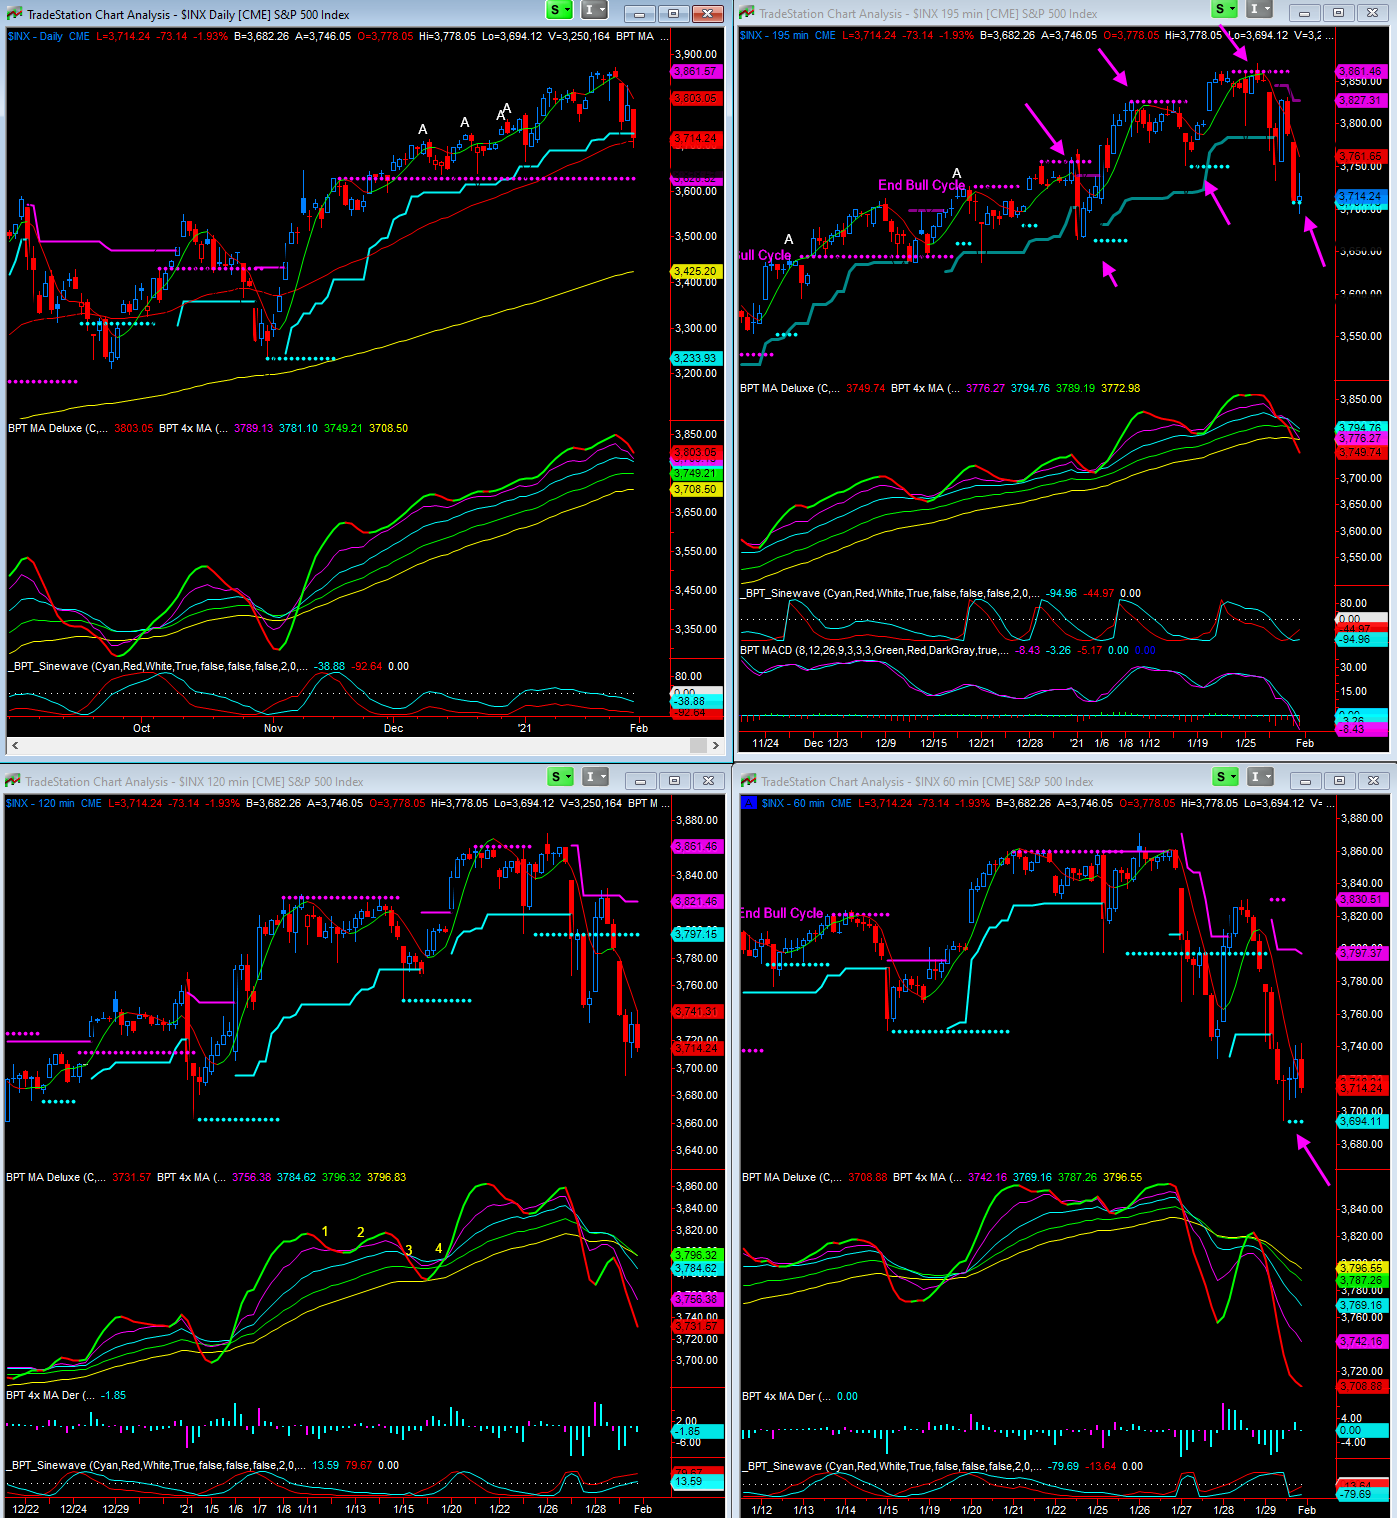
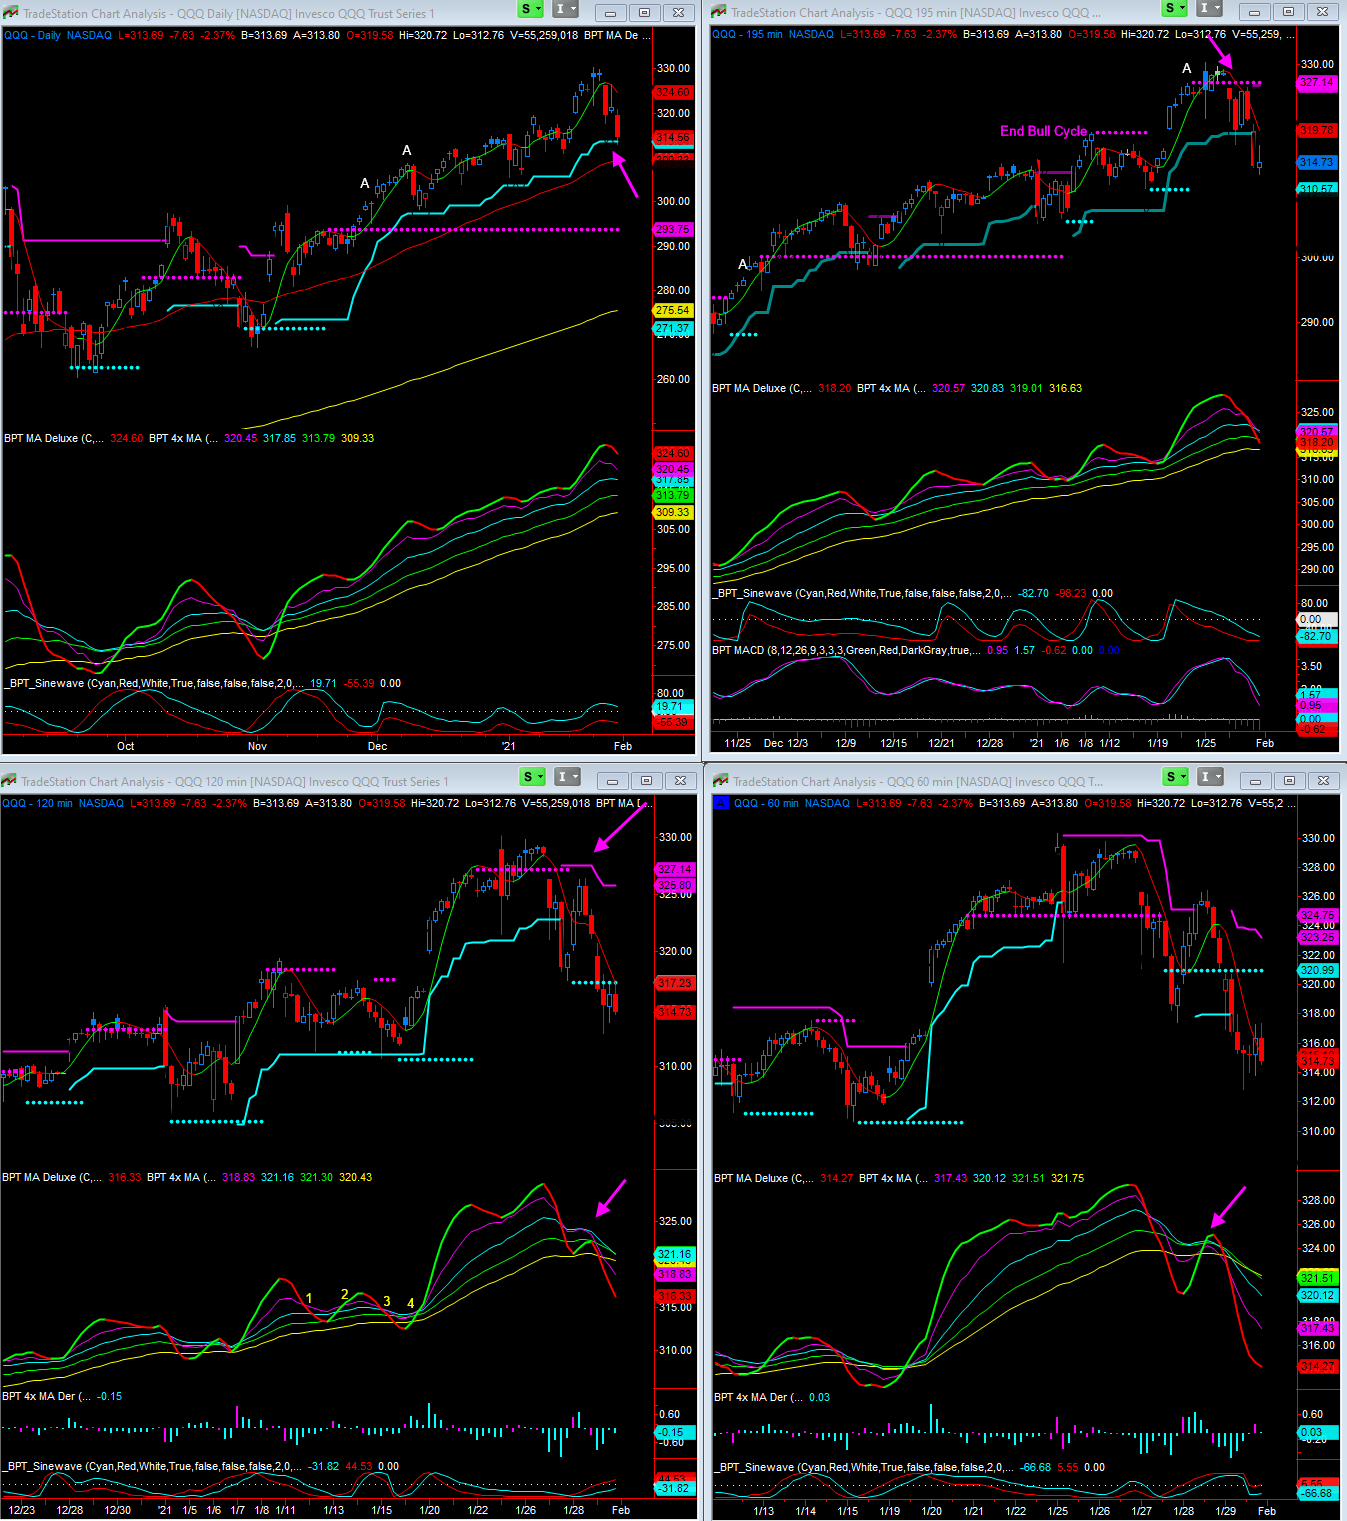
- Discussion of last week's market and a look at the major indexes on multiple time frames, and my thoughts going forward
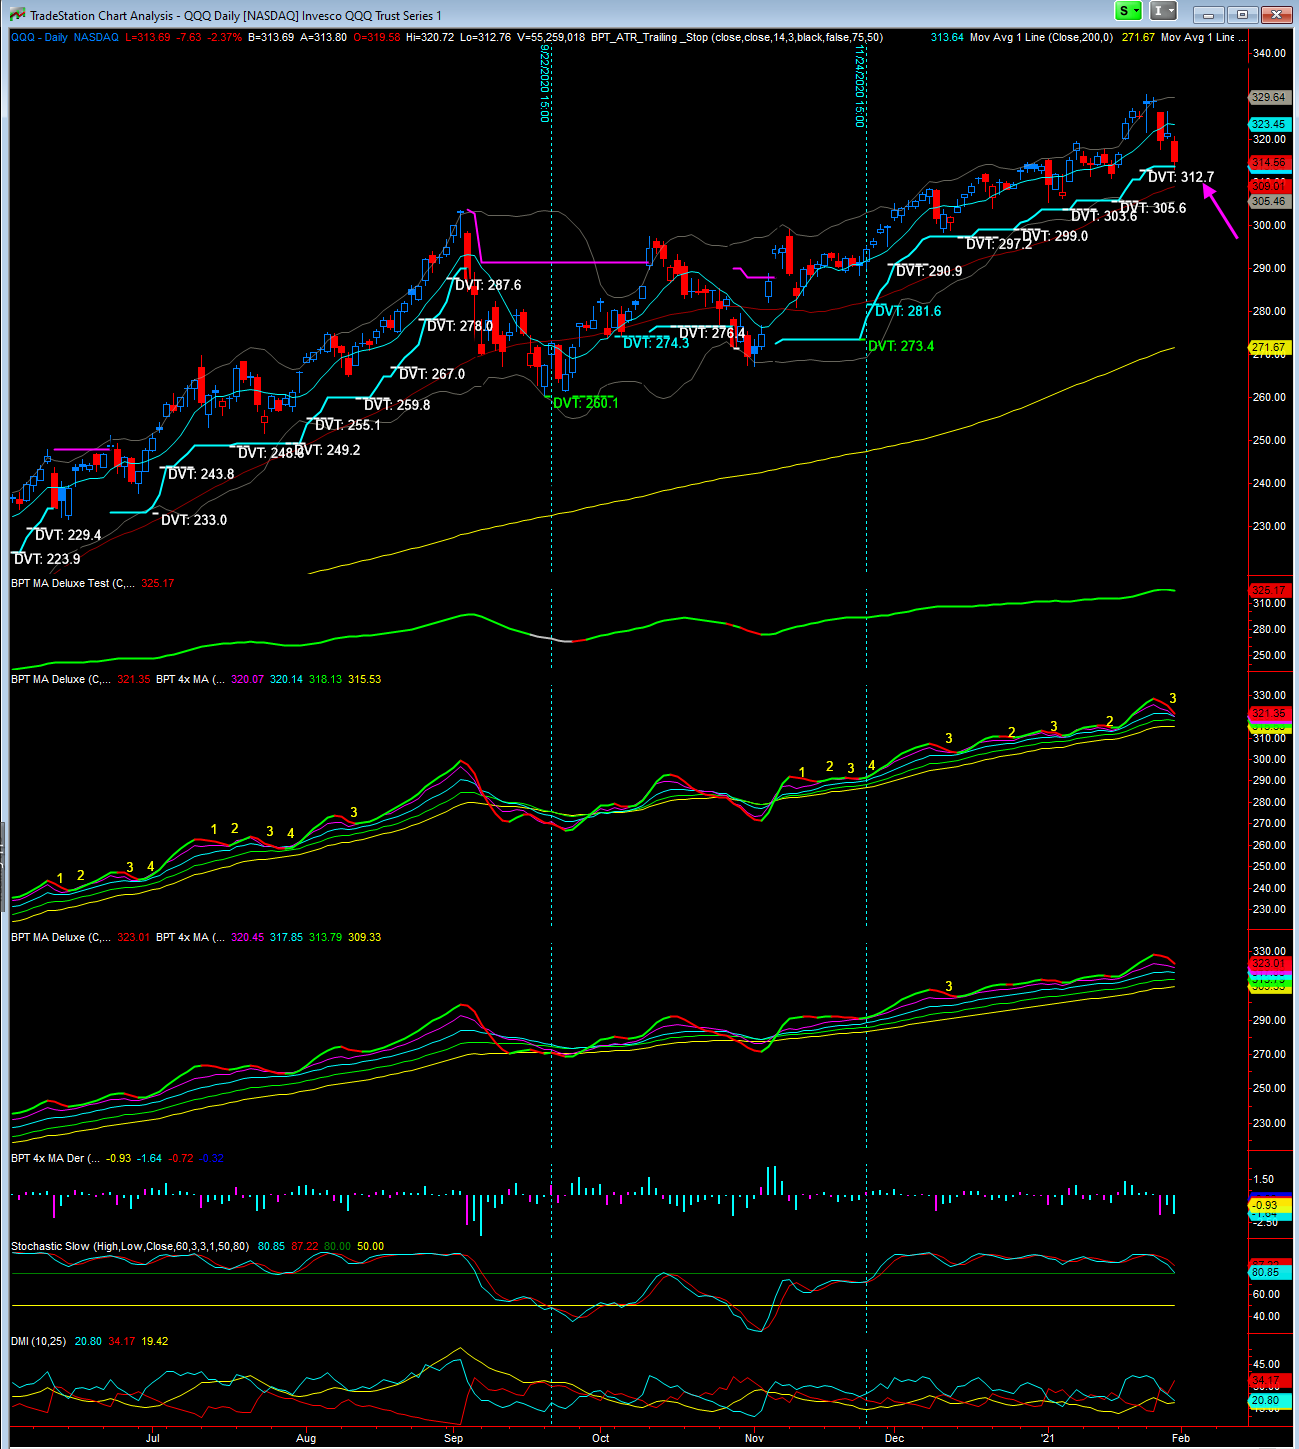
- Discussions regarding the KISS Charts and DVT prices
- A look at important market indicators (VIX, NYSI, NYMO, etc)
- Bonds 20 Year and High Yield Corporate
- Market Sectors and DVT's
- World Market ETF's and DVT's
- Commodities: Crude Oil, Natural Gas, Copper, Agriculture and Grains, Uranium
- US Dollar, Bitcoin, Gold, Silver, and various silver stocks and other previous metal stocks (r/wallstreetbets)
2

3

4

5
| Major Indexes | Index Symbol | ETF Symbol | % G / L Day | % G / L Week | Close |
|---|---|---|---|---|---|
| Dow Jones | INDU - W | DIA - W | -2.03% | -3.27% | 29,982.62 |
| S&P 500 | SPX - W | SPY - W | -1.93% | -3.31% | 3,714.24 |
| Wilshire 5000 | WLSH - W | -1.82% | -3.40% | 39,396.17 | |
| Nasdaq | COMPQ - W | -2.00% | -3.49% | 13,070.69 | |
| NDX 100 | NDX - W | QQQ - W | -2.09% | -3.30% | 12,925.38 |
| Russel 2000 (Small Caps) | IWM - W | -1.51% | -4.39% | 205.56 |
| Market Sectors | Index Symbol | ETF Symbol | % G / L Day | % G / L Week | Close |
|---|---|---|---|---|---|
| Transports | TRAN - W | IYT - W | -2.56% | -5.98% | 12,087.99 |
| Banks | BKX - W | -2.51% | -5.78% | 97.78 | |
| Financials | XLF - W | -2.00% | -4.58% | 28.95 | |
| Brokers | XBD - W | -2.04% | -4.03% | 377.72 | |
| XLE (Energy Select) | XLE - W | -3.32% | -6.54% | 39.32 | |
| Oil Service Holders | OIH - W | -1.57% | -5.48% | 162.59 | |
| Technology | XLK - W | -2.36% | -2.94% | 128.93 | |
| Semiconductor | SOX - W | SMH - W | -1.64% | -6.09% | 2,887.08 |
| Communication Services | XLC - W | -1.86% | -2.85% | 66.88 | |
| Retail | XRT - W | 6.07% | 17.55% | 88.01 | |
| Consumer Staples | XLP - W | -2.06% | -1.51% | 64.09 | |
| Consumer Discretionary | XLY - W | -2.33% | -4.76% | 162.01 | |
| Industrials | XLI - W | -2.16% | -4.23% | 84.77 | |
| Real Estate | IYR - W | -1.02% | -0.80% | 85.28 | |
| Homebuilders | HGX - W | XHB - W | -2.17% | -5.08% | 400.51 |
| Materials | XLB - W | -1.94% | -5.03% | 70.64 | |
| Metals And Mining | XME - W | -2.47% | -6.23% | 32.35 | |
| GDX Gold Miners ETF | GDX - W | -0.20% | -2.04% | 34.51 | |
| Biotechnology | BTK - W | XBI - W | -0.49% | -2.87% | 5,984.62 |
| Healthcare | XLV - W | -0.84% | -2.18% | 115.03 | |
| Drugs | DRG - W | -1.50% | -2.53% | 699.04 | |
| Utilities | UTIL - W | XLU - W | -0.10% | -0.65% | 852.40 |
| Currencies | Index Symbol | ETF Symbol | % G / L Day | % G / L Week | Close |
|---|---|---|---|---|---|
| US Dollar | UUP - W | 0.12% | 0.33% | 24.42 | |
| Euro | XEU - W | FXE - W | 0.08% | -0.35% | 121.32 |
| Yen | XJY - W | FXY - W | -0.48% | -0.92% | 95.48 |
| Australian | XAD - W | FXA - W | -0.42% | -0.93% | 76.46 |
| British Pound | XBP - W | FXB - W | -0.11% | 0.18% | 137.09 |
| Chinese Yuan | CYB - W | 0.58% | 0.94% | 27.69 | |
| Canadian Dollar | CDW - W | FXC - W | 0.43% | -0.30% | 78.28 |
| Swiss Franc | XSF - W | FXF - W | -0.27% | -0.65% | 112.24 |
| Commodities | Index Symbol | ETF Symbol | % G / L Day | % G / L Week | Close |
|---|---|---|---|---|---|
| Commodities | DBC - W | 0.13% | 0.66% | 15.19 | |
| Crude Oil | WTIC - W | USO - W | -0.27% | -0.13% | 52.20 |
| Gasoline | GASO - W | -1.44% | 0.50% | 1.55 | |
| Natural Gas | NATGAS - W | UNG - W | -3.75% | 4.40% | 2.56 |
| Copper | COPPER - W | JJCB - W | -0.61% | -1.93% | 3.56 |
| Agriculture | DBA - W | 0.55% | 1.11% | 16.39 | |
| Corn | CORN - W | CORN - W | 2.34% | 9.29% | 547.00 |
| Wheat | WHEAT - W | WEAT - W | 2.47% | 4.49% | 663.00 |
| Coffee | JO - W | -0.88% | -0.58% | 35.97 | |
| Sugar | CANE - W | 0.51% | 0.14% | 6.91 |
| Precious Metals | Index Symbol | ETF Symbol | % G / L Day | % G / L Week | Close |
|---|---|---|---|---|---|
| Gold Metal | GLD - W | -0.04% | -0.74% | 172.61 | |
| Silver | SLV - W | 1.09% | 5.62% | 24.99 | |
| Platinum | PPLT - W | -0.21% | -2.74% | 100.44 | |
| Palladium | PALL - W | -4.70% | -5.52% | 208.37 | |
| GDX Gold Miners ETF | GDX - W | -0.20% | -2.04% | 34.51 |
| Bonds | Index Symbol | ETF Symbol | % G / L Day | % G / L Week | Close |
|---|---|---|---|---|---|
| High Yield Corporate Bond | HYG - W | -0.26% | -0.38% | 86.97 | |
| TLT 20 Year Bond ETF | TLT - W | -0.60% | 0.08% | 152.00 | |
| 10 Year Treasury Yield | TNX - W | 3.41% | 0.18% | 10.93 | |
| 30 Year Treasury Yield | TYX - W | 2.09% | 0.05% | 18.58 |
6
| Release | ET | For | Trading Impact | Forecast | Consensus | Prior |
|---|---|---|---|---|---|---|
| Feb 01 | ||||||
| IHS Market Manufacturing PMI - Final | 09:45 | Jan | Low | NA | NA | 59.1 |
| ISM Manufacturing Index | 10:00 | Jan | High | 61.0% | 60.1% | 60.7% |
| Construction Spending | 10:00 | Dec | Low | 0.6% | 0.8% | 0.9% |
| Feb 03 | ||||||
| MBA Mortgage Applications Index | 07:00 | 01/30 | Low | NA | NA | -4.1% |
| ADP Employment Change | 08:15 | Jan | Medium | 40K | 55K | -123K |
| IHS Markit Services PMI - Final | 09:45 | Jan | Low | NA | NA | 57.5 |
| ISM Non-Manufacturing Index | 10:00 | Jan | High | 56.6% | 57.0% | 57.2% |
| EIA Crude Oil Inventories | 10:30 | 01/30 | -- | NA | NA | -9.91M |
| Feb 04 | ||||||
| Productivity-Prel | 08:30 | Q4 | Medium | -2.8% | -2.8% | 4.6% |
| Unit Labor Costs - Prelim | 08:30 | Q4 | Low | 3.5% | 3.3% | -6.6% |
| Initial Claims | 08:30 | 01/30 | High | 830K | 825K | 847K |
| Continuing Claims | 08:30 | 01/23 | High | NA | NA | 4.771M |
| Factory Orders | 10:00 | Dec | Low | 0.7% | 0.7% | 1.0% |
| EIA Natural Gas Inventories | 10:30 | 01/30 | Low | NA | NA | -128 bcf |
| Feb 05 | ||||||
| Nonfarm Payrolls | 08:30 | Jan | High | 35K | 50K | -140K |
| Nonfarm Private Payrolls | 08:30 | Jan | High | 40K | 60K | -95K |
| Unemployment Rate | 08:30 | Jan | High | 6.7% | 6.7% | 6.7% |
| Hourly Earnings | 08:30 | Jan | High | 0.3% | 0.3% | 0.8% |
| Average Workweek | 08:30 | Jan | High | 34.7 | 34.7 | 34.7 |
| Trade Balance | 08:30 | Dec | Low | -$66.0B | -$65.7B | -$68.1B |
| Consumer Credit | 15:00 | Dec | Low | $14.0B | $9.0B | $15.3B |
Stock Earnings Calender:
Click here for a list of Stocks that are reporting Earnings
**Generally we never hold a position into earnings since the risk/reward is too great
7 - View Live Chart

8 - View Live Chart

9 - View Live Chart

10

11
12
13
14
15 - View Live Chart

16 - View Live Chart

17 - View Live Chart

18 - View Live Chart

19 - View Live Chart

20 - View Live Chart

21 - View Live Chart

22 - View Live Chart

23

24 - View Live Chart

25 - View Live Chart

26 - View Live Chart

27 - View Live Chart

28
29
30 - View Live Chart

31 - View Live Chart

32 - View Live Chart

33 - View Live Chart

34 - View Live Chart

35 - View Live Chart

36 - View Live Chart

37 - View Live Chart

38 - View Live Chart

39 - View Live Chart

40 - View Live Chart

41 - View Live Chart

42 - View Live Chart

43 - View Live Chart

44 - View Live Chart

45

46

47

48 - View Live Chart

49 - View Live Chart

50 - View Live Chart

51 - View Live Chart

52 - View Live Chart

53 - View Live Chart

54 - View Live Chart

55 - View Live Chart

56 - View Live Chart

57 - View Live Chart

58 - View Live Chart

59 - View Live Chart

60 - View Live Chart

61 - View Live Chart

62 - View Live Chart

63 - View Live Chart

64 - View Live Chart

65 - View Live Chart

66 - View Live Chart

67 - View Live Chart

68 - View Live Chart

69 - View Live Chart

70 - View Live Chart

71 - View Live Chart

72 - View Live Chart

73 - View Live Chart

74 - View Live Chart

75 - View Live Chart

76 - View Live Chart

77 - View Live Chart

78 - View Live Chart

79 - View Live Chart

80 - View Live Chart

81 - View Live Chart

82 - View Live Chart

83 - View Live Chart

84 - View Live Chart

85 - View Live Chart

86 - View Live Chart

87 - View Live Chart

88 - View Live Chart

89 - View Live Chart

- Hide Player Link to Newsletter Audio
- Hide Player Link to Newsletter Audio