Comprehensive BPT Newsletter For Feb 18th, 2019 - free
Disclaimer: Intraday Chart Links will show up as daily charts unless you have an active stockcharts.com membership and are signed in, you can sign up here.
1
Table of Contents:
1. Glance at last Week Stats, Upcoming Economic Table, Earnings Release Dates
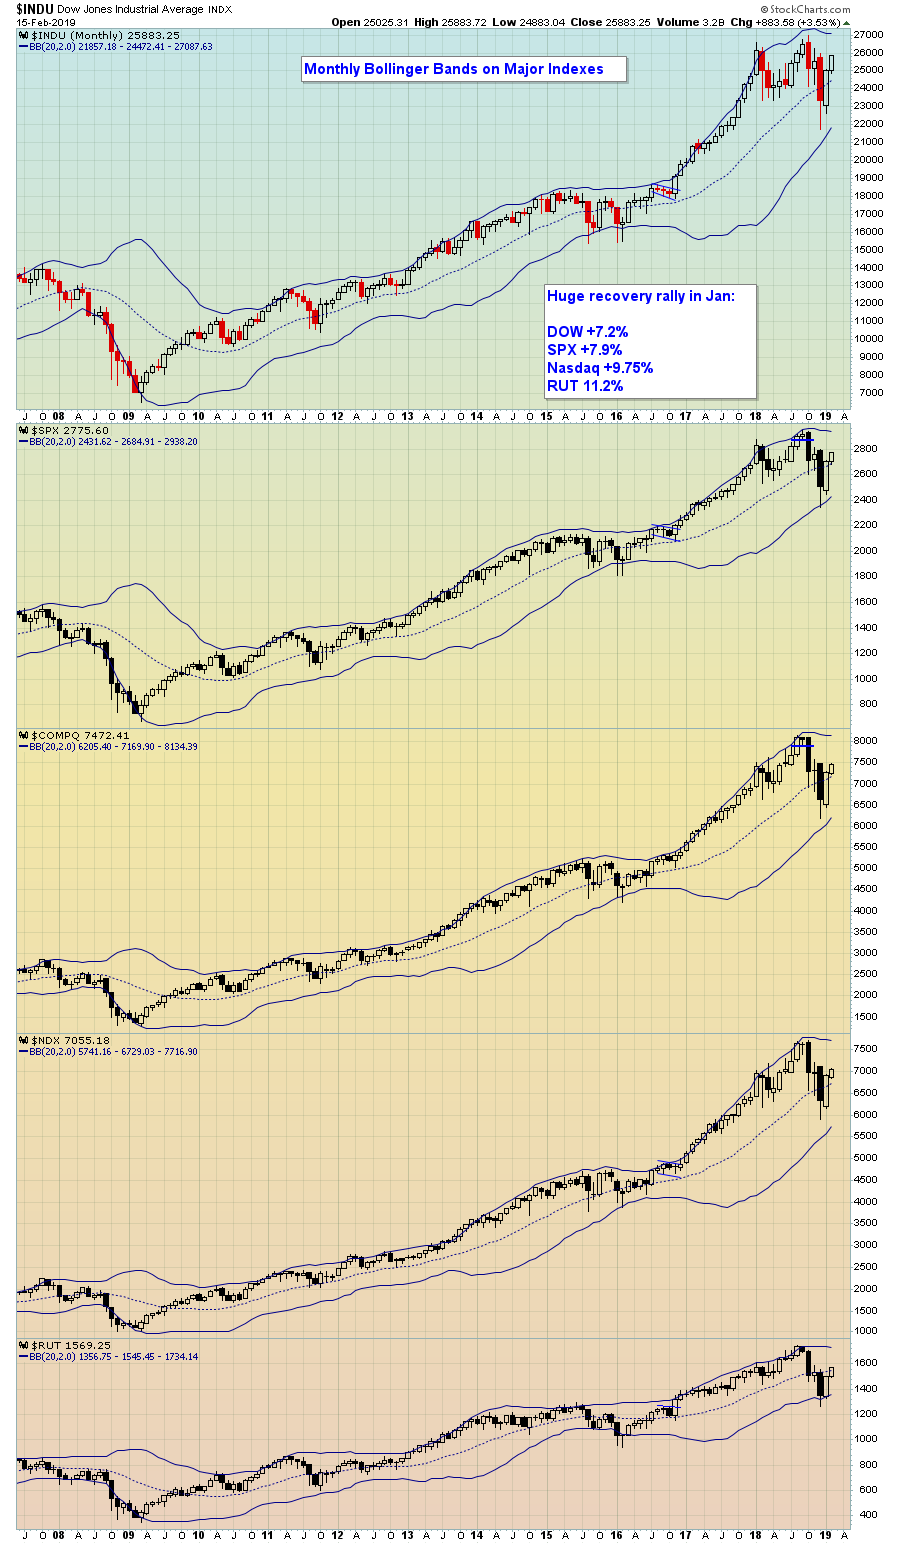
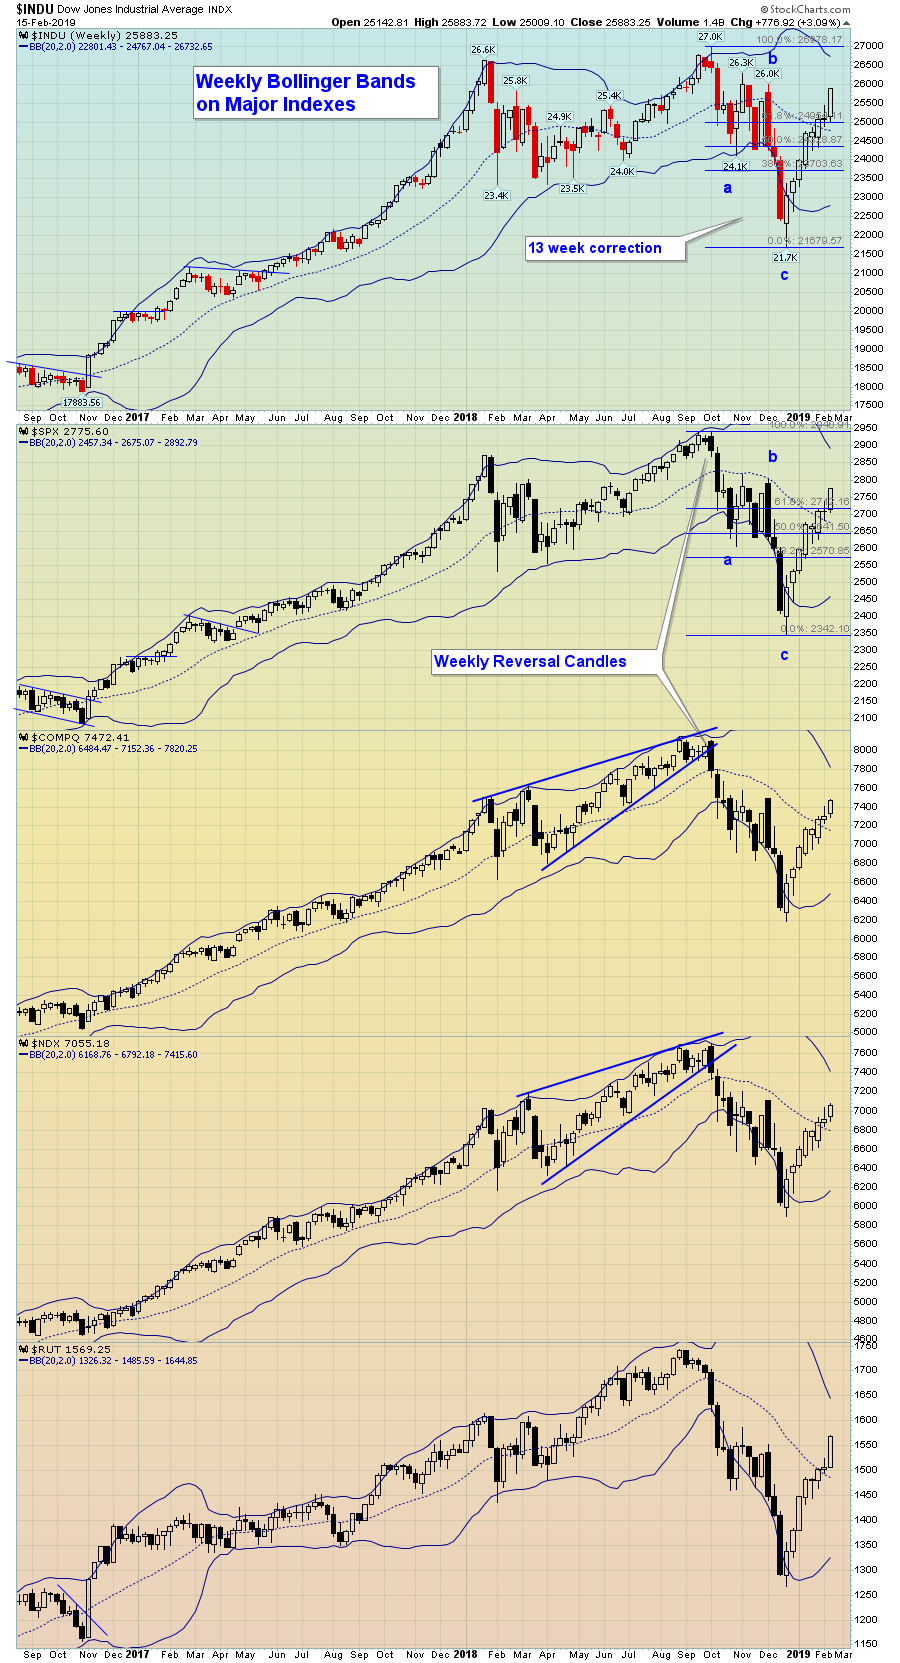
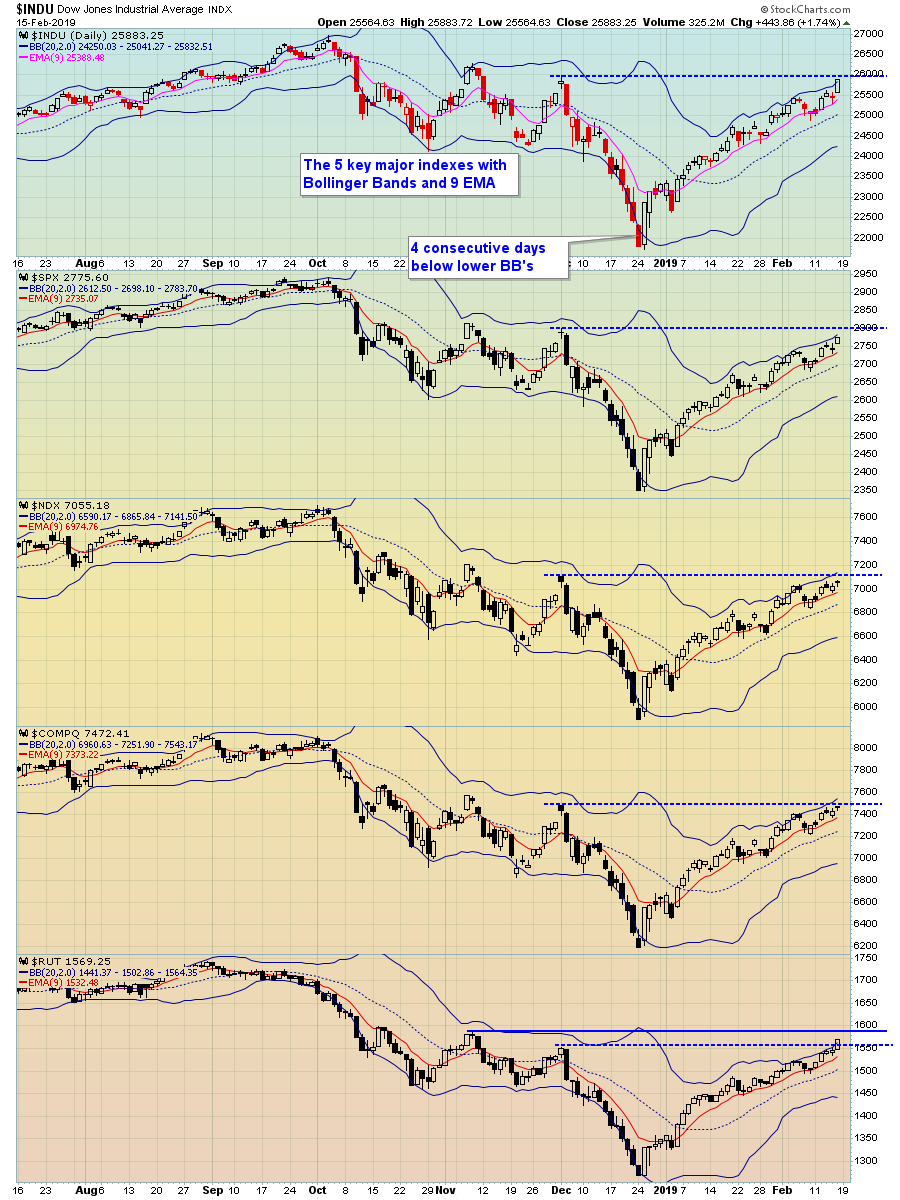
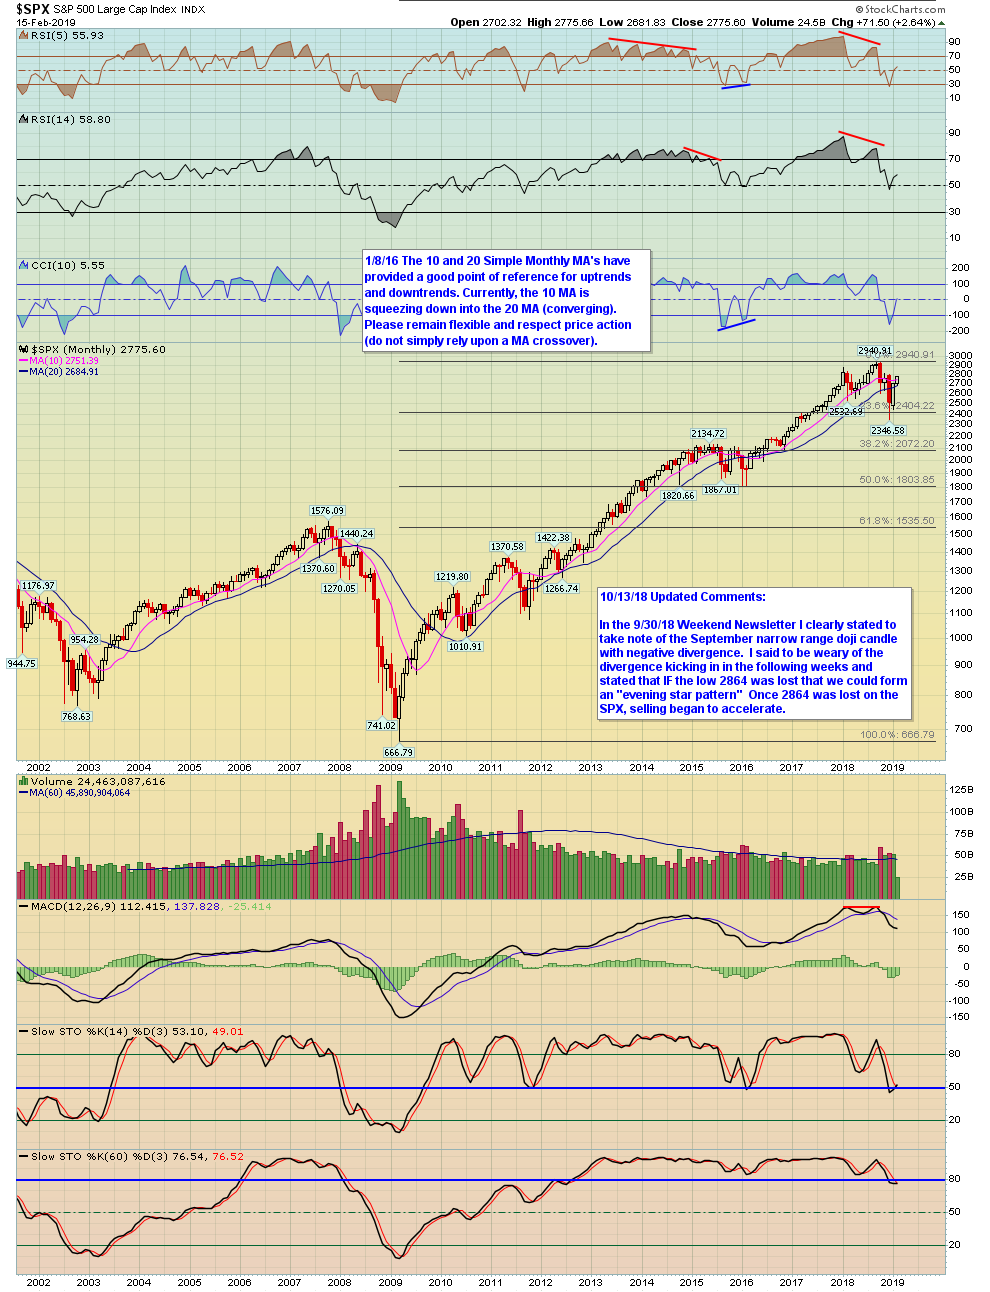
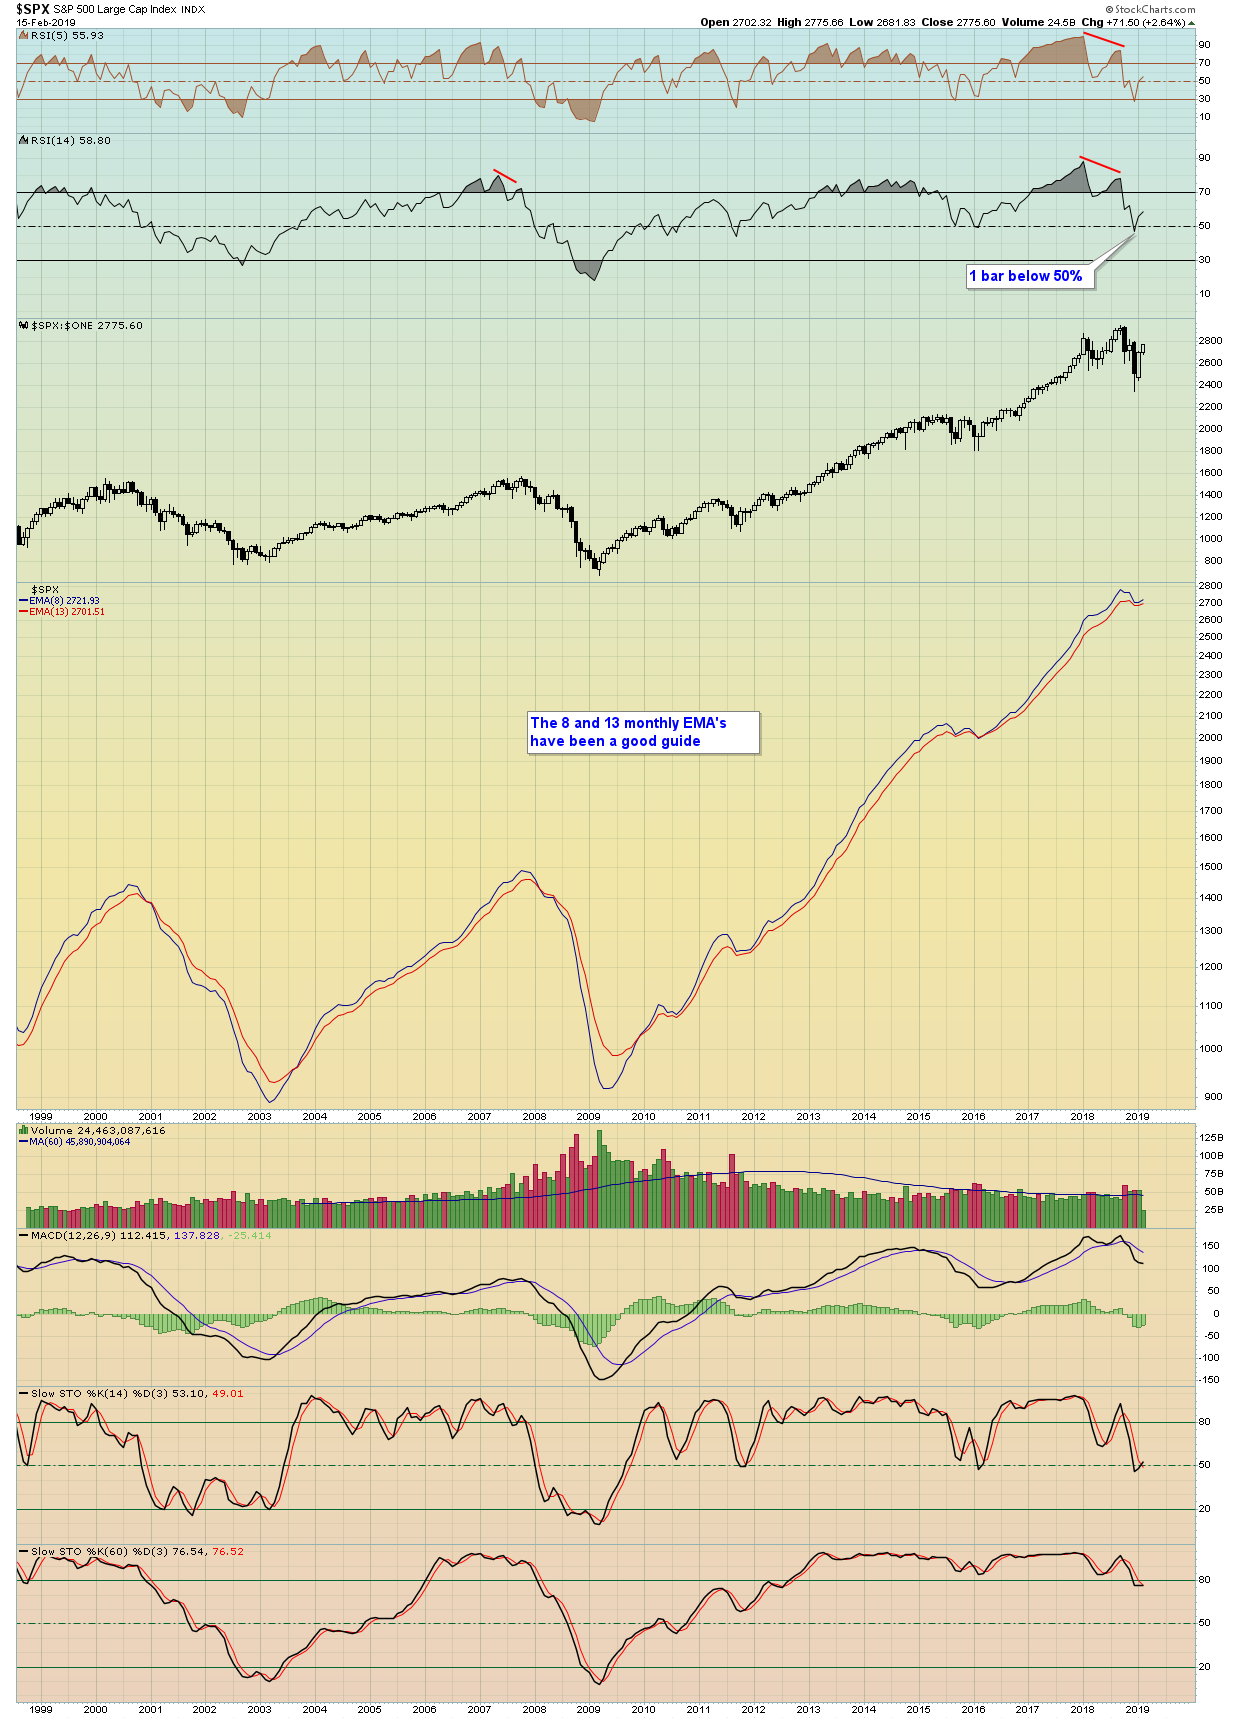
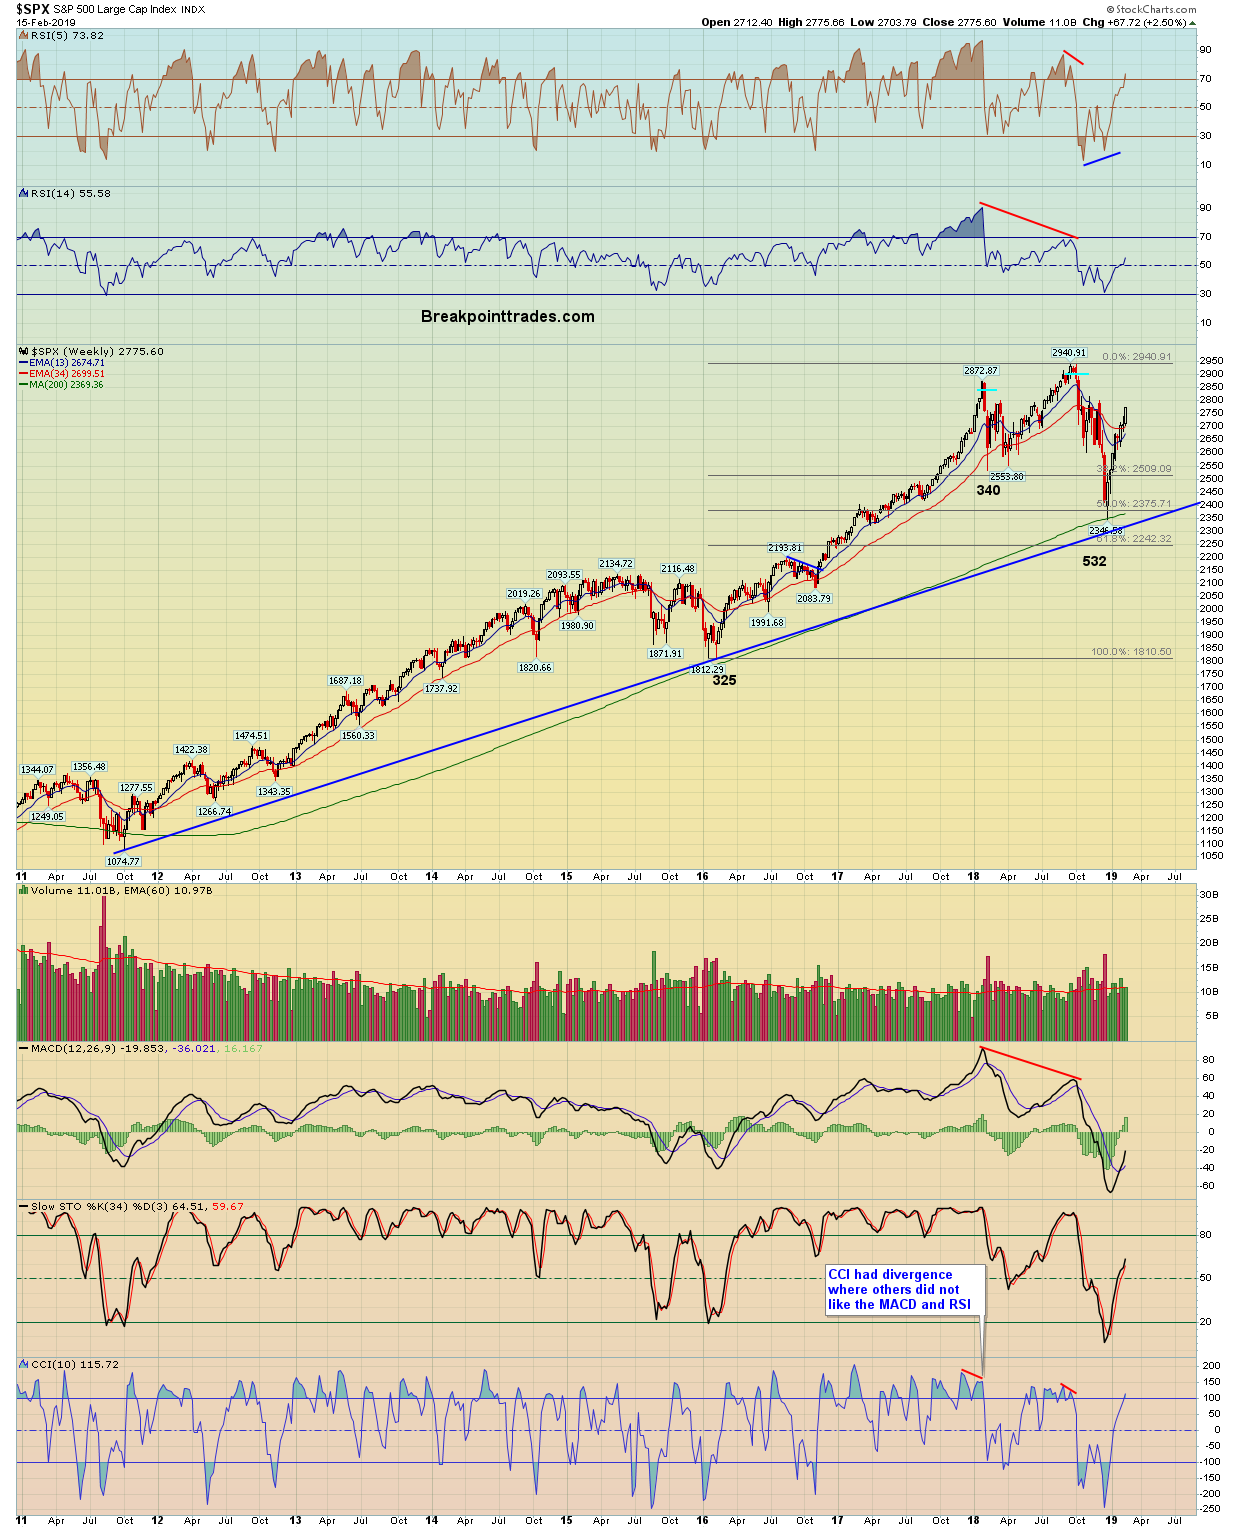
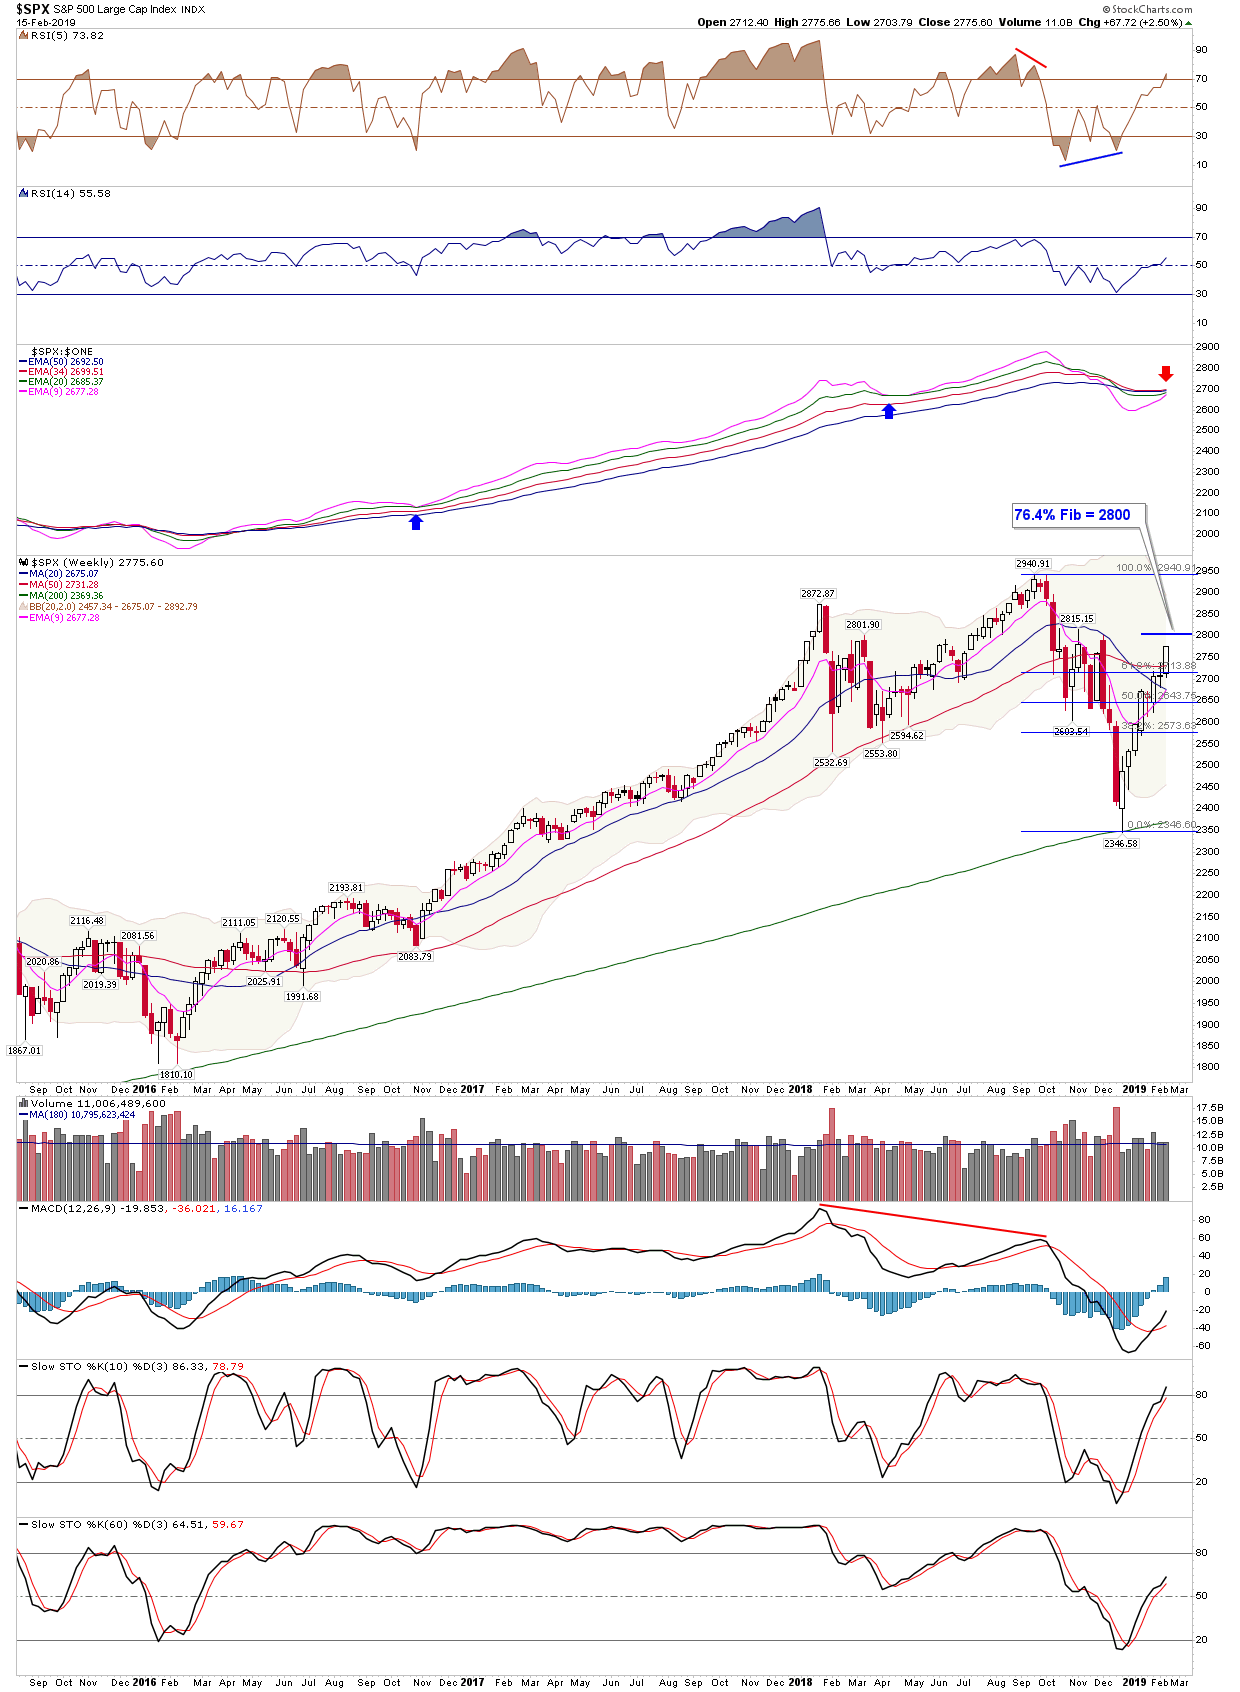
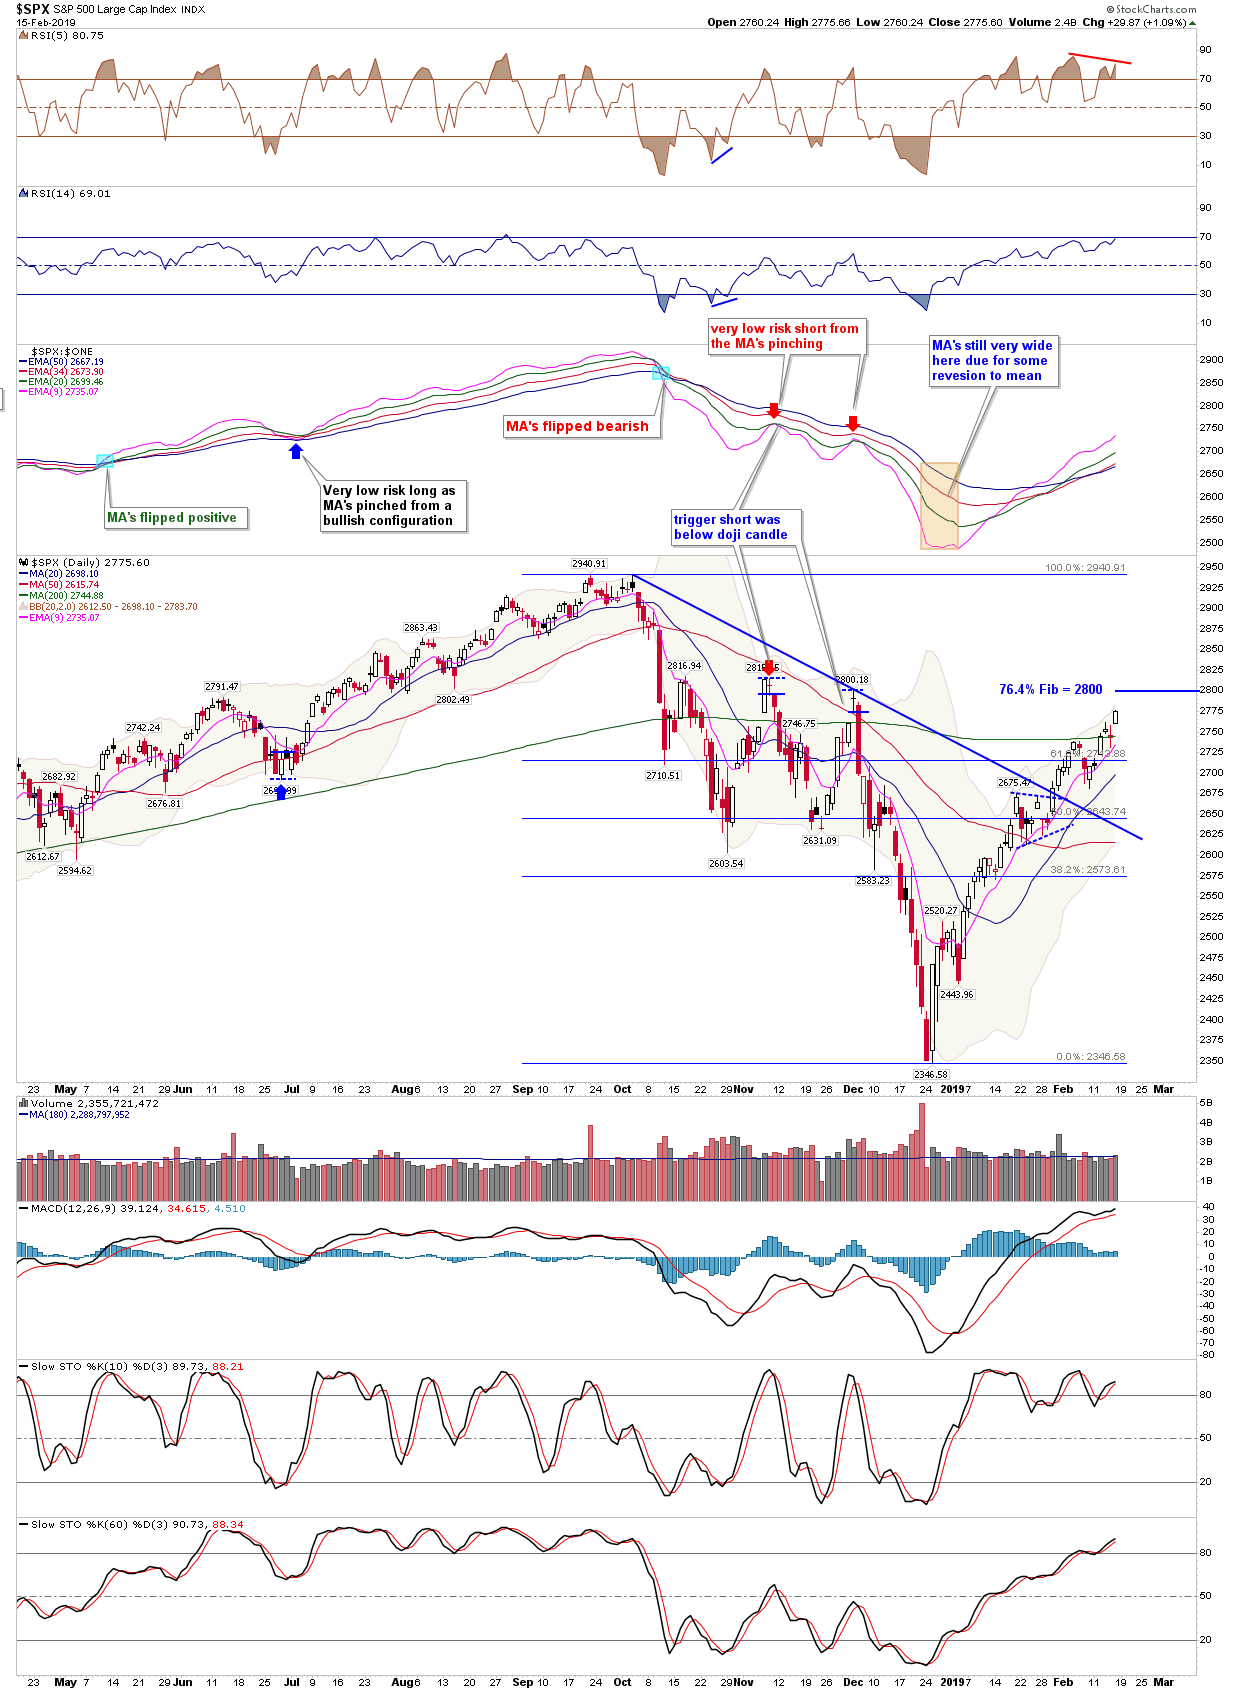
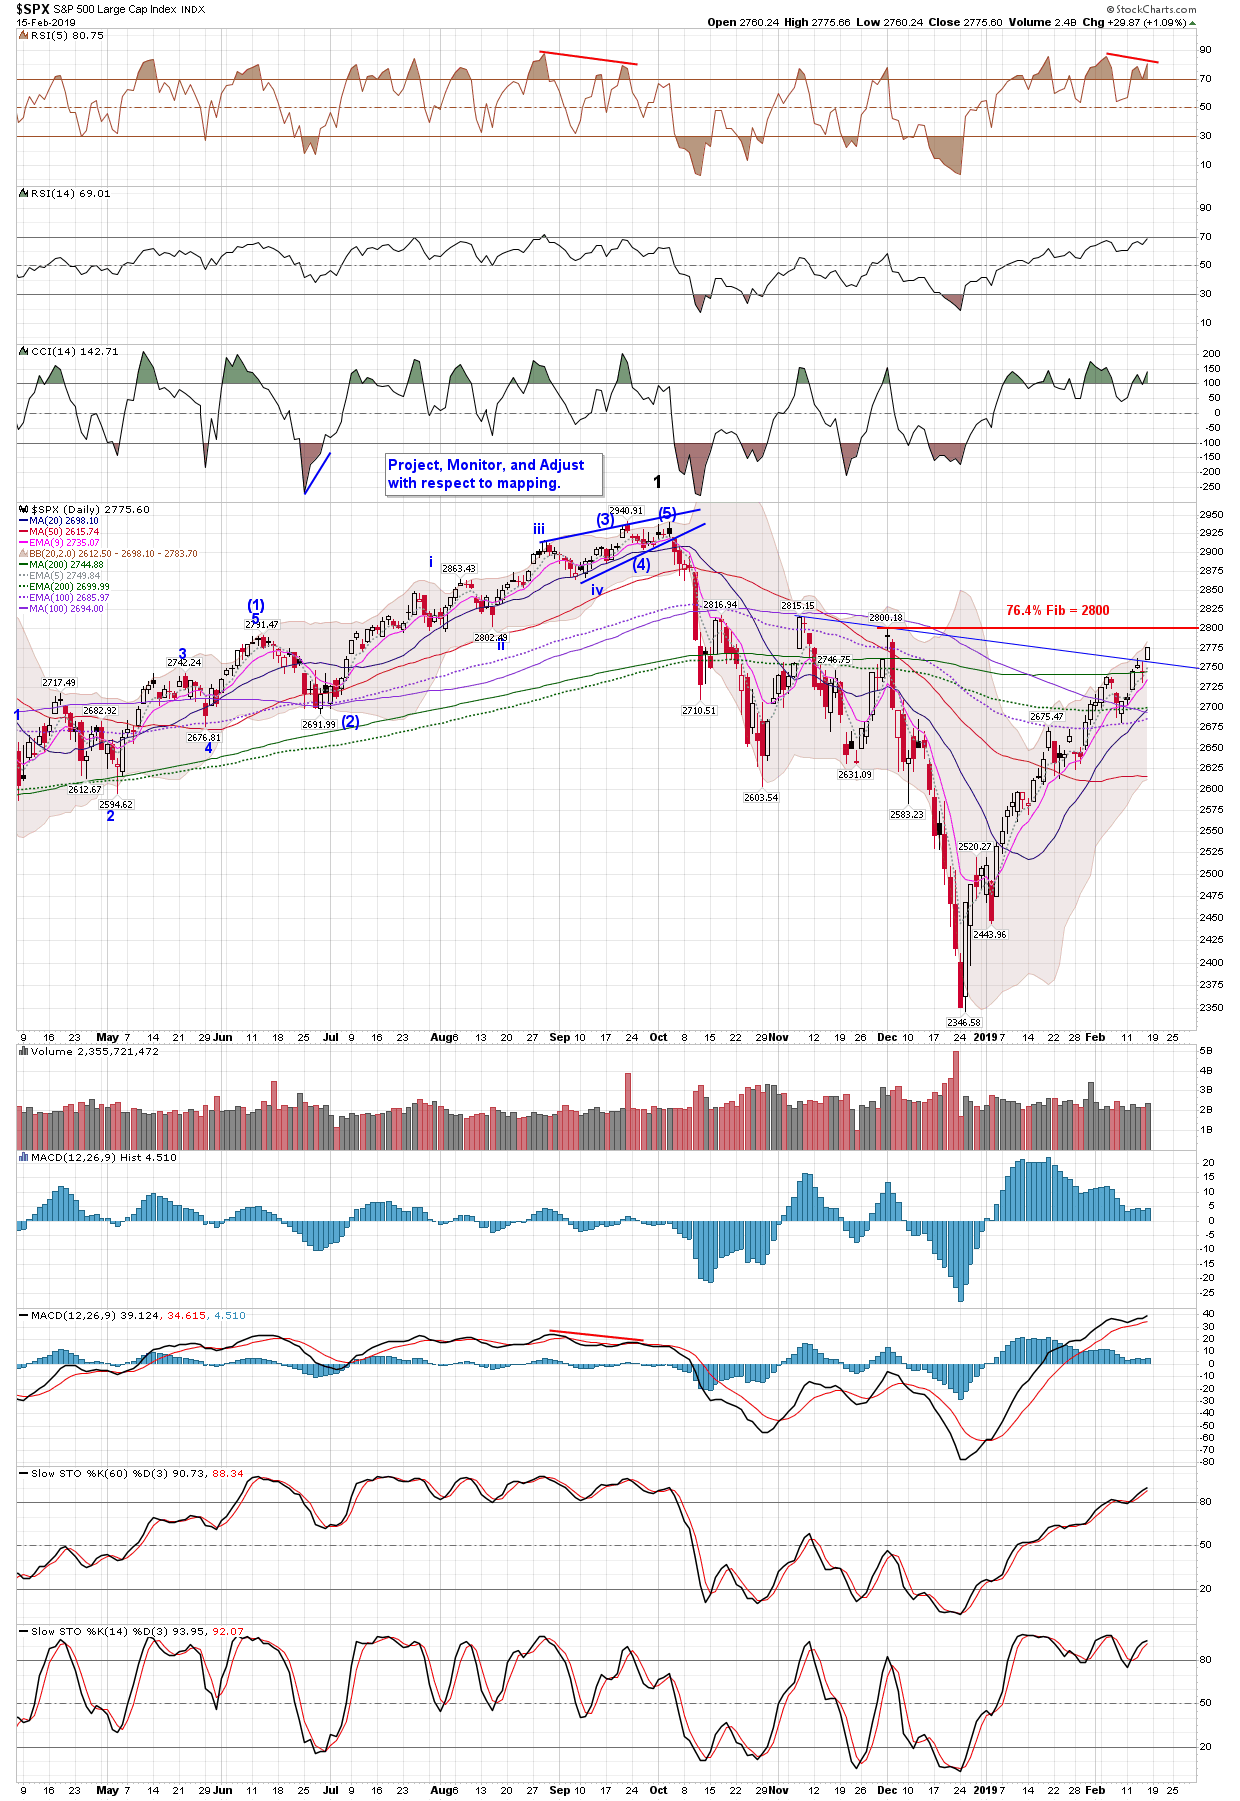
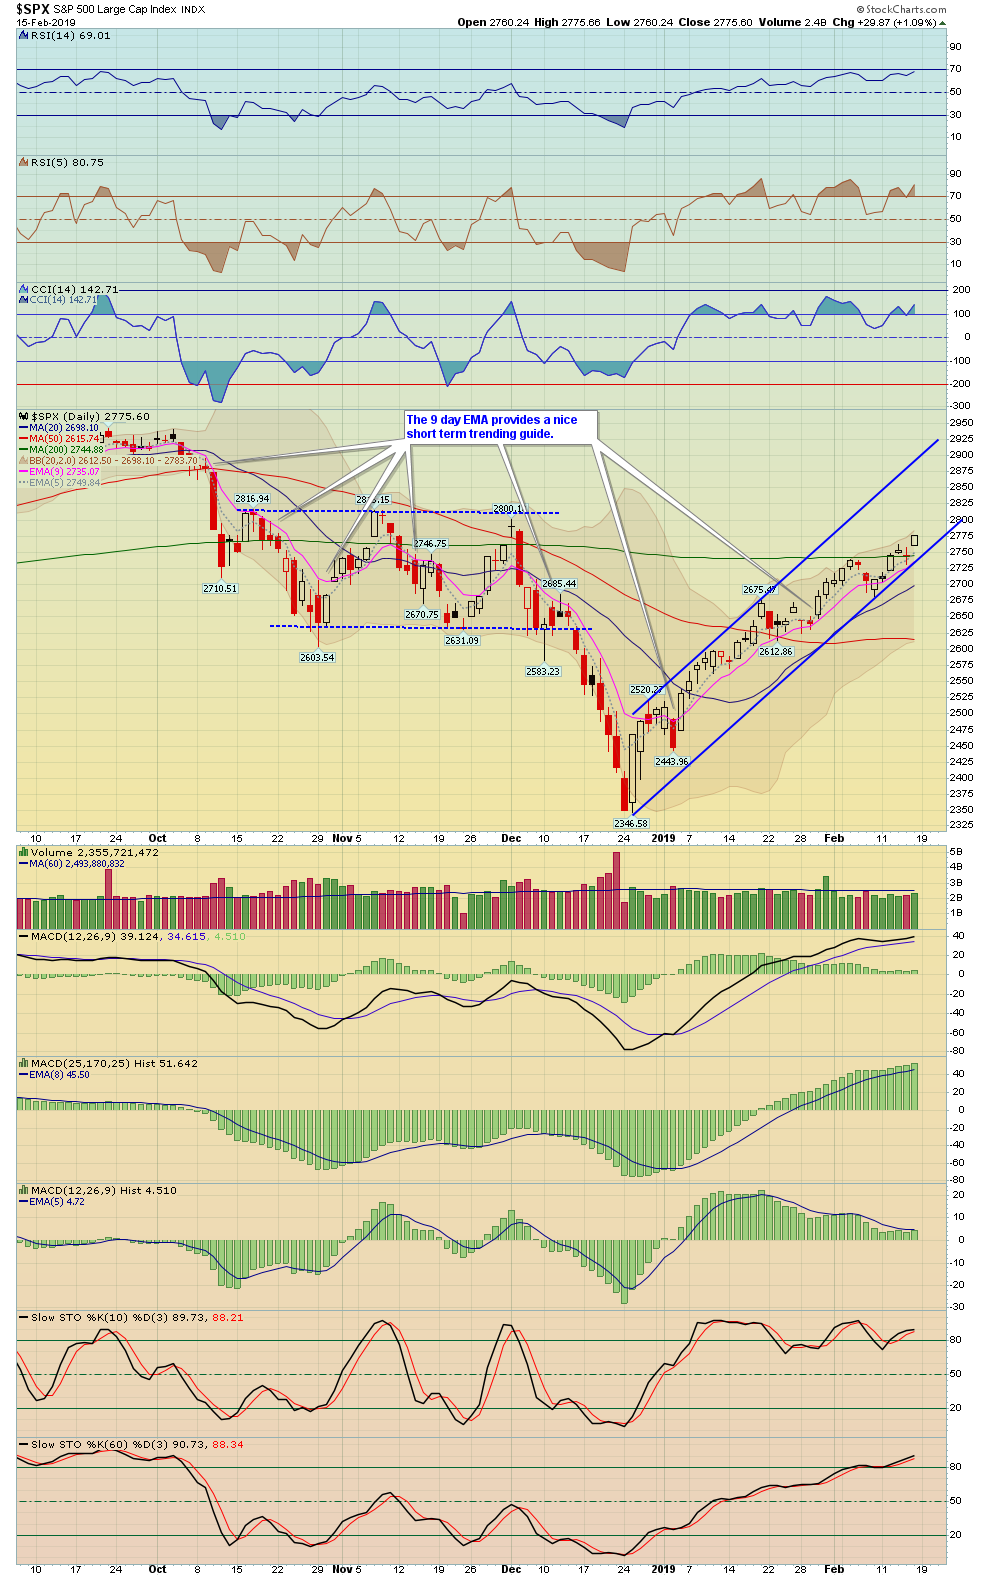
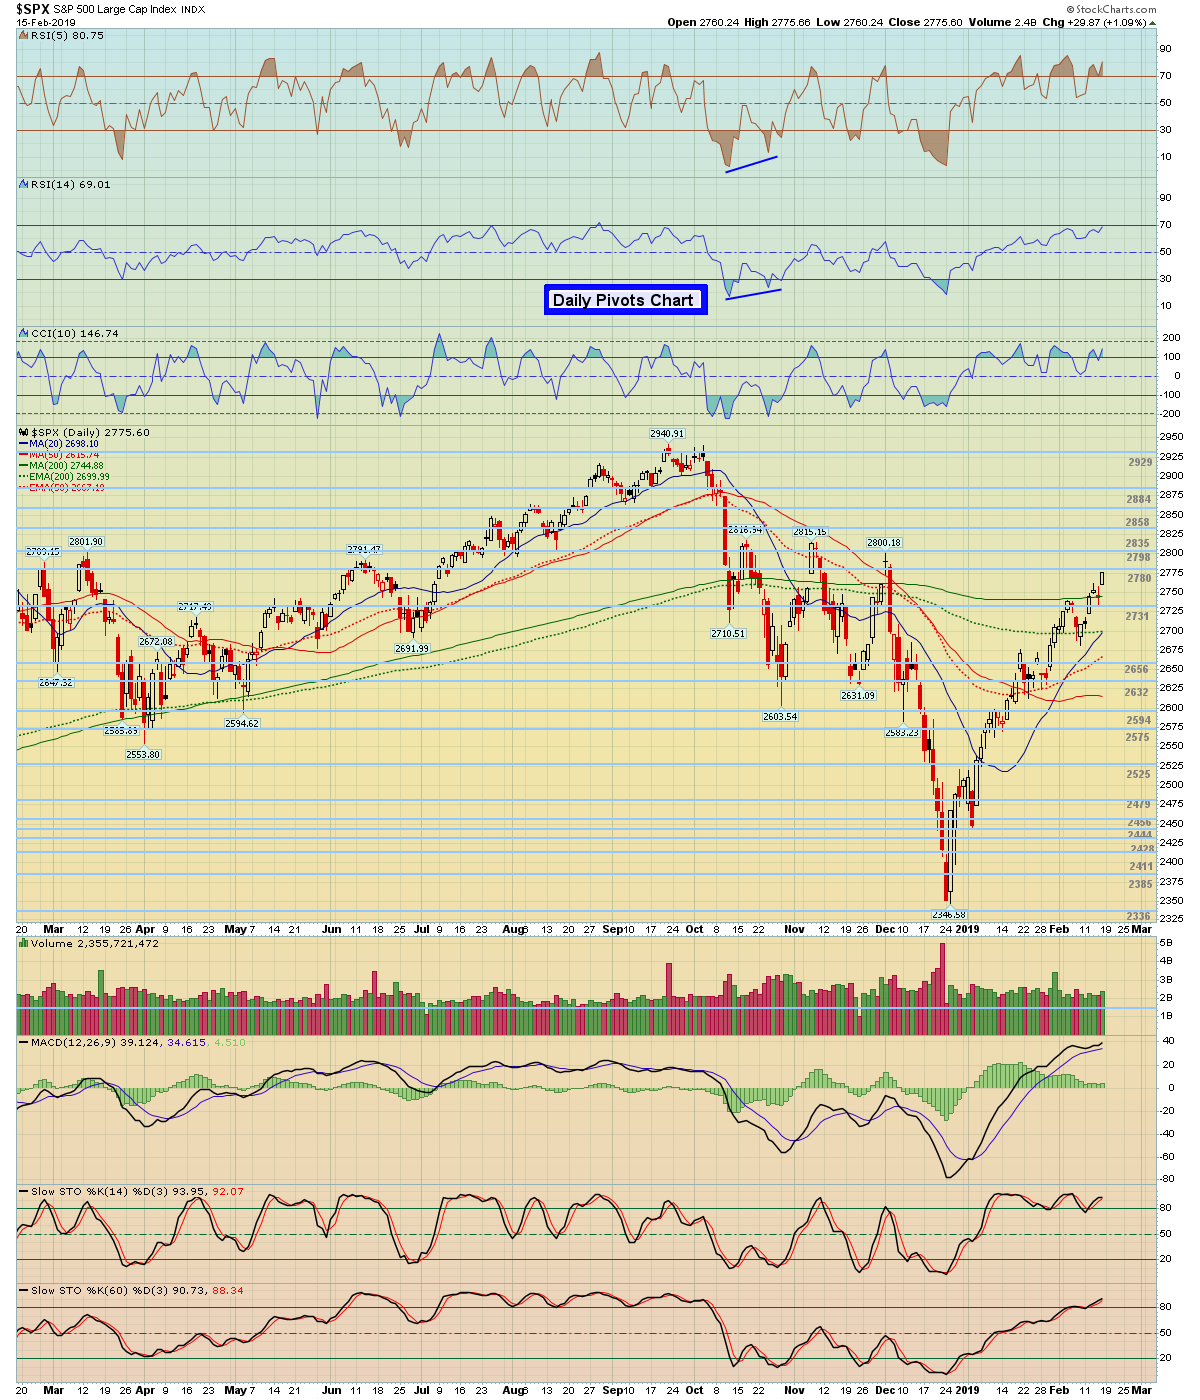
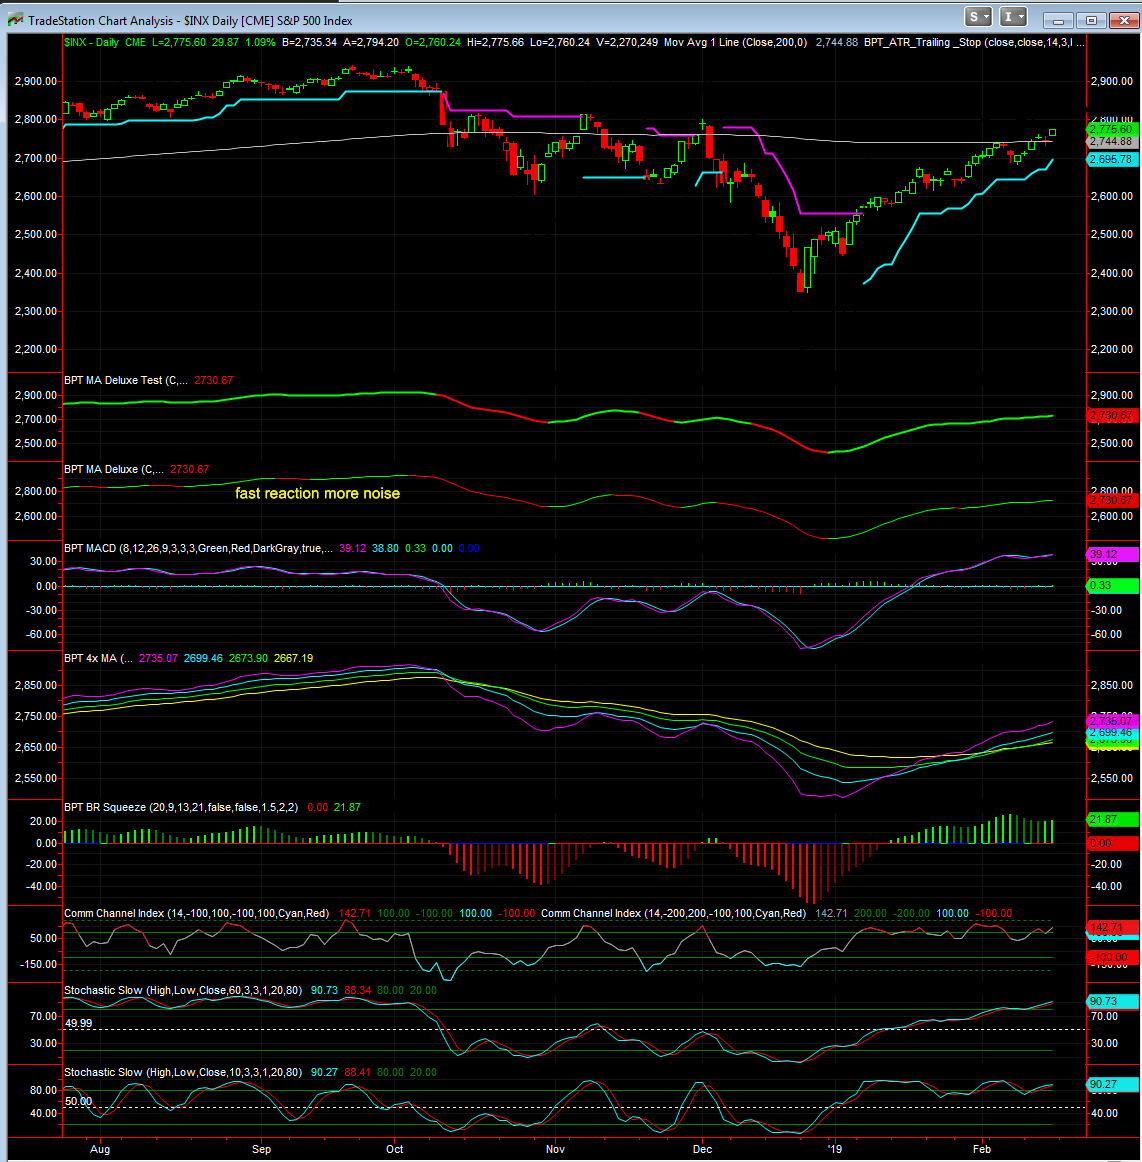
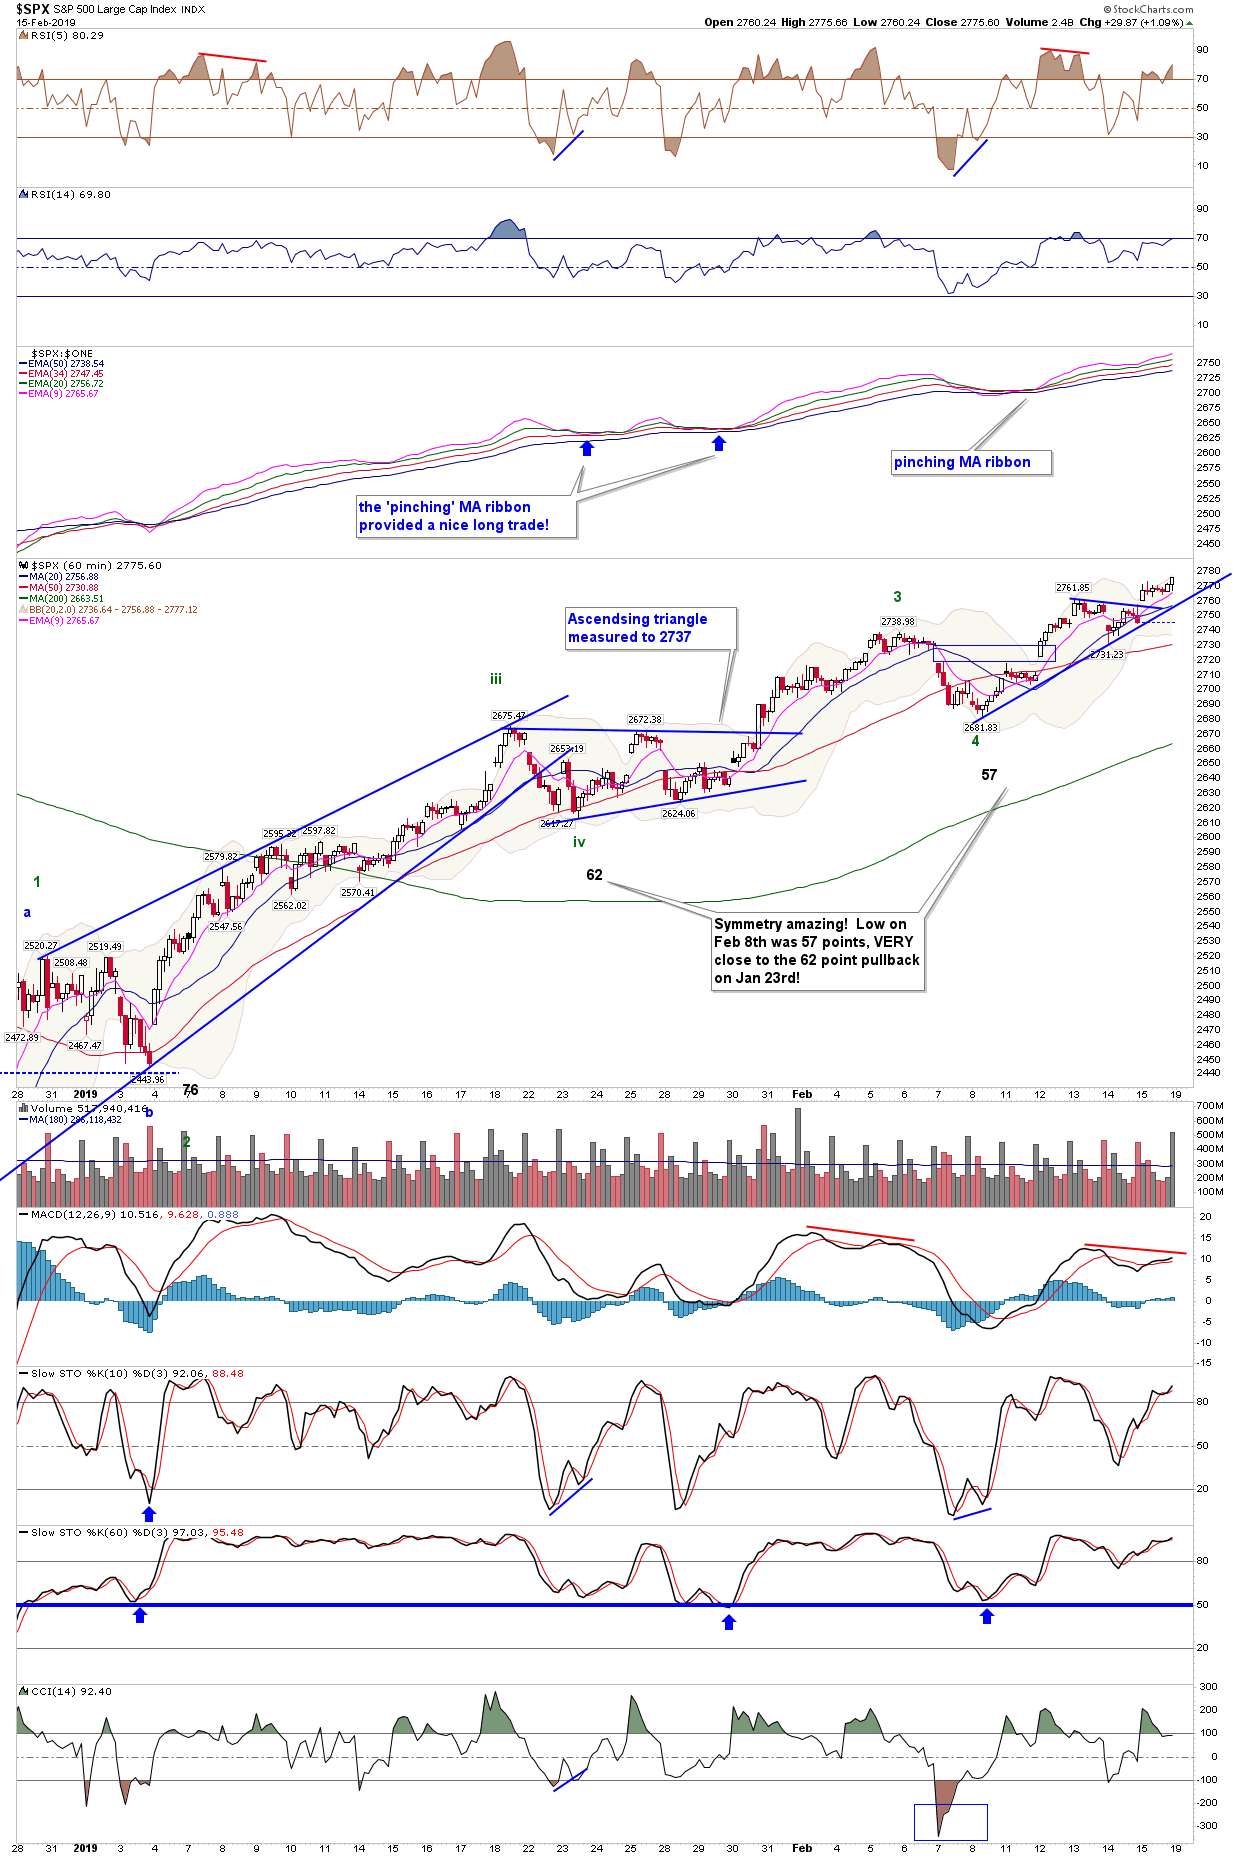
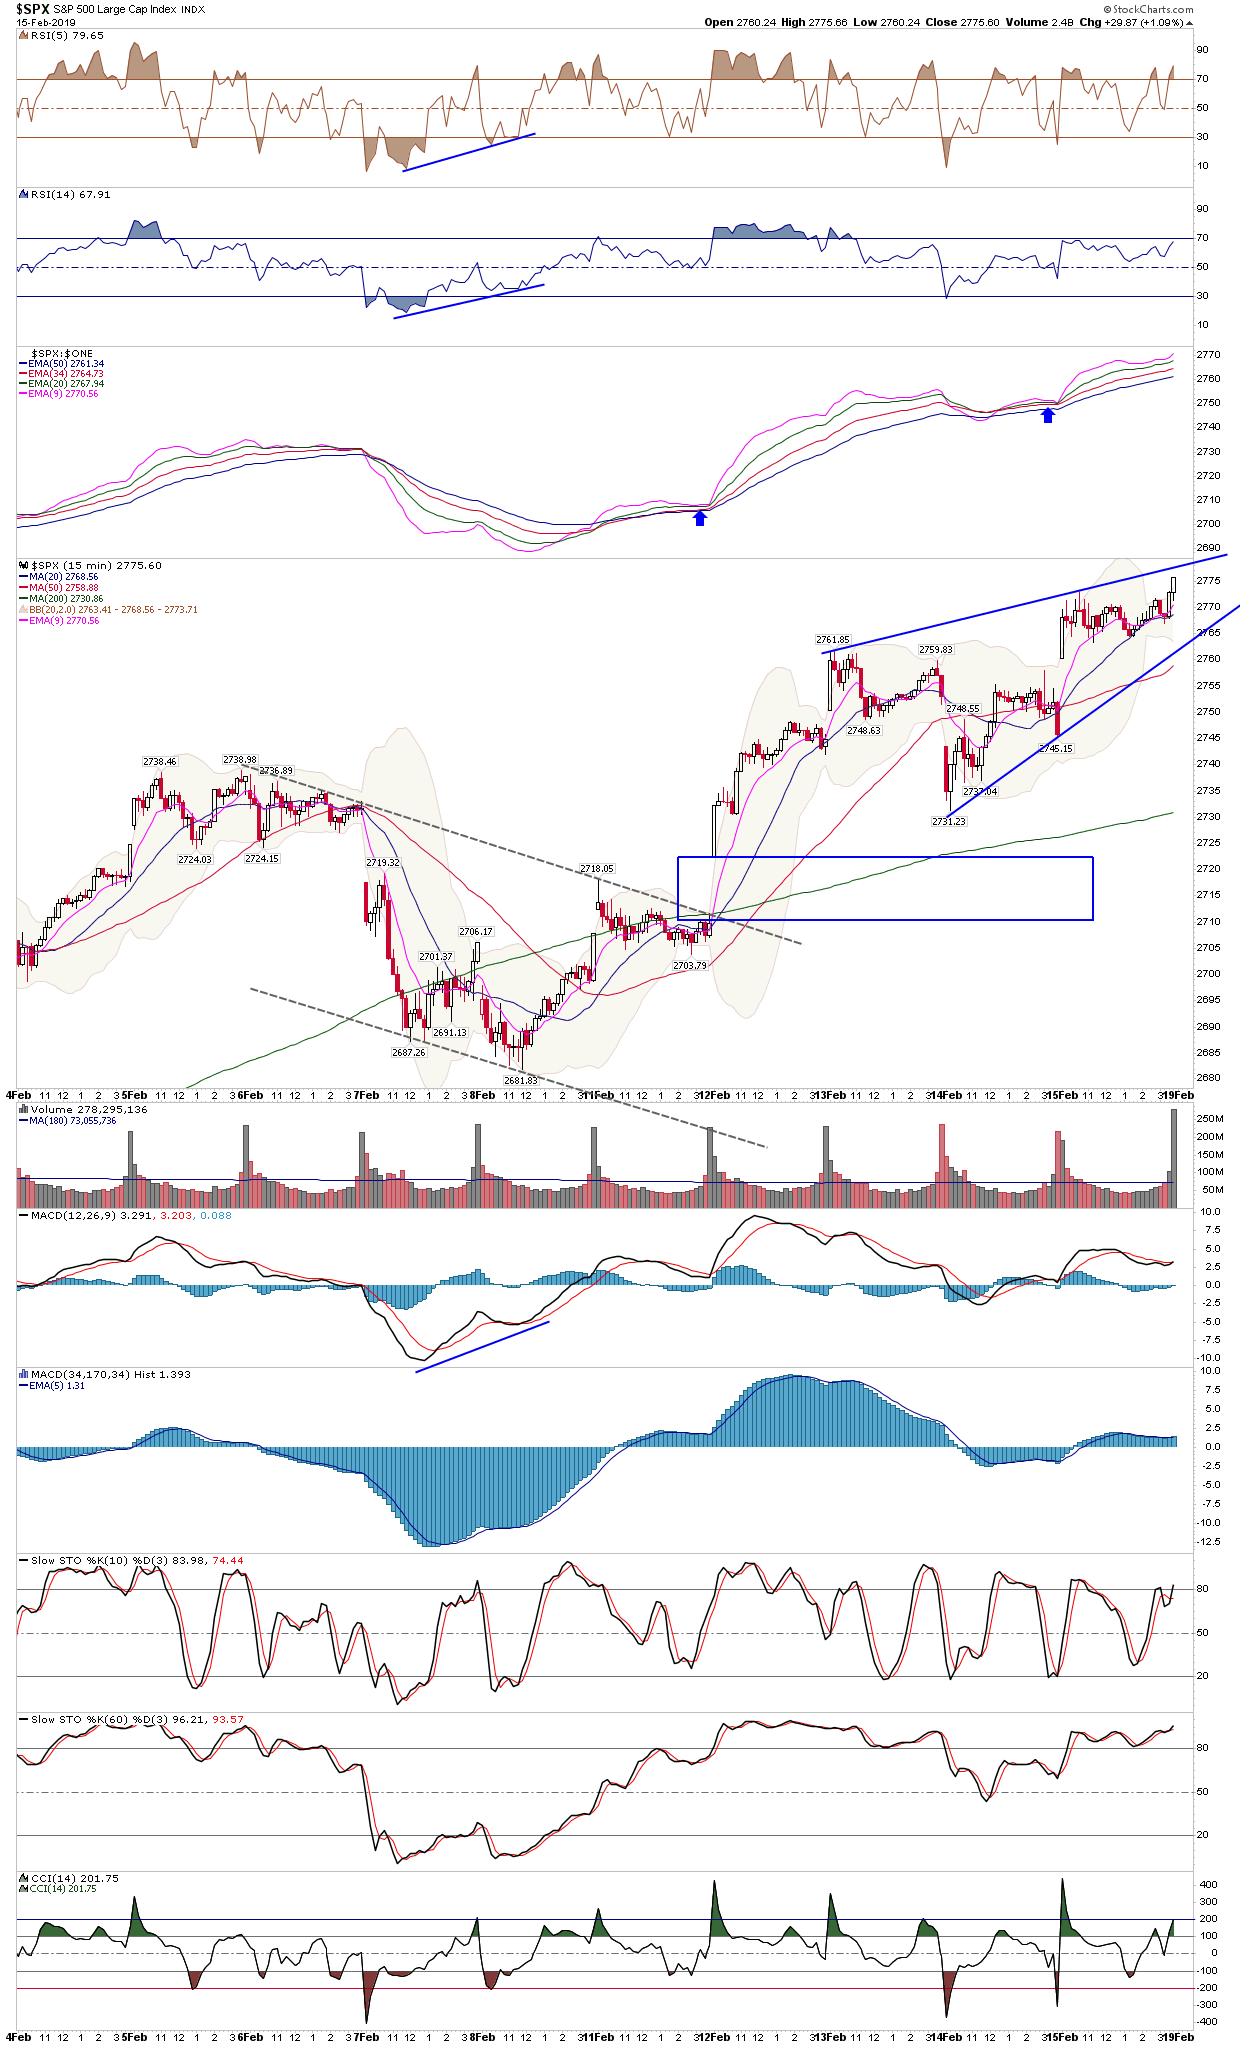
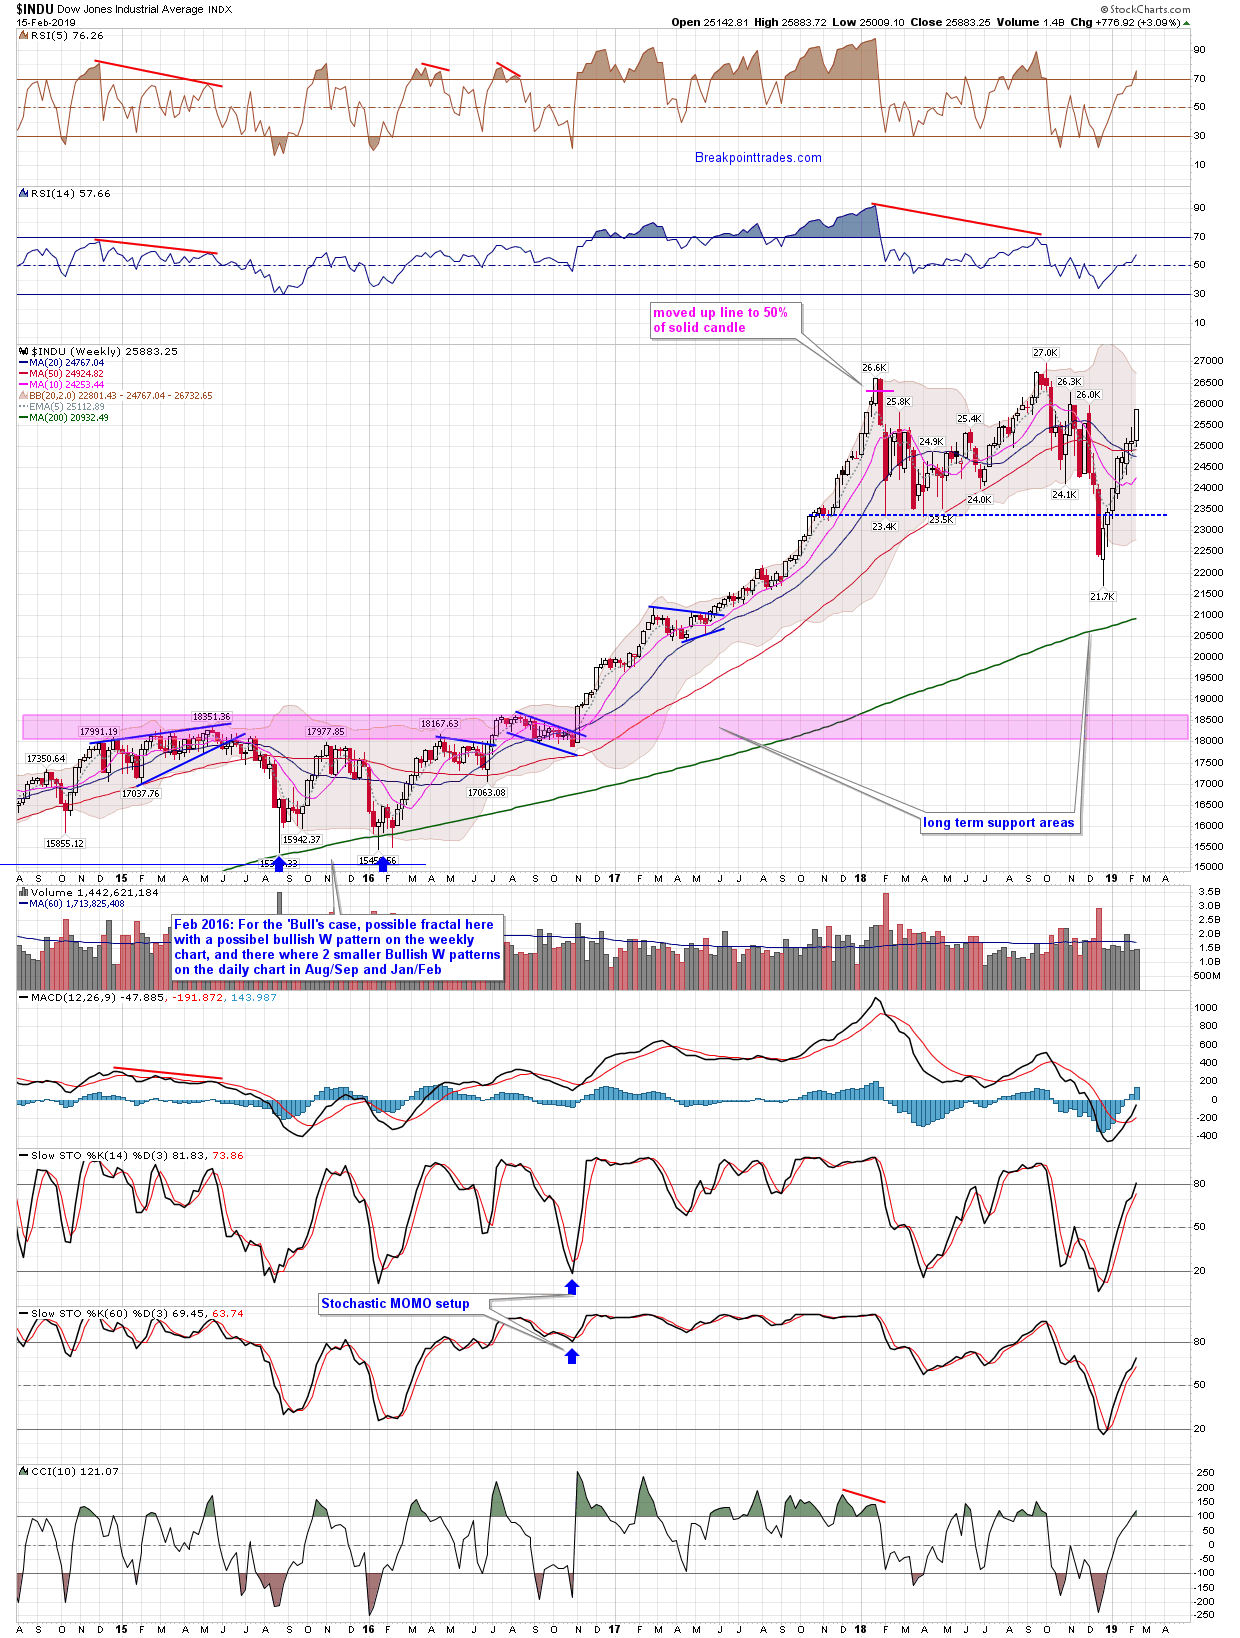
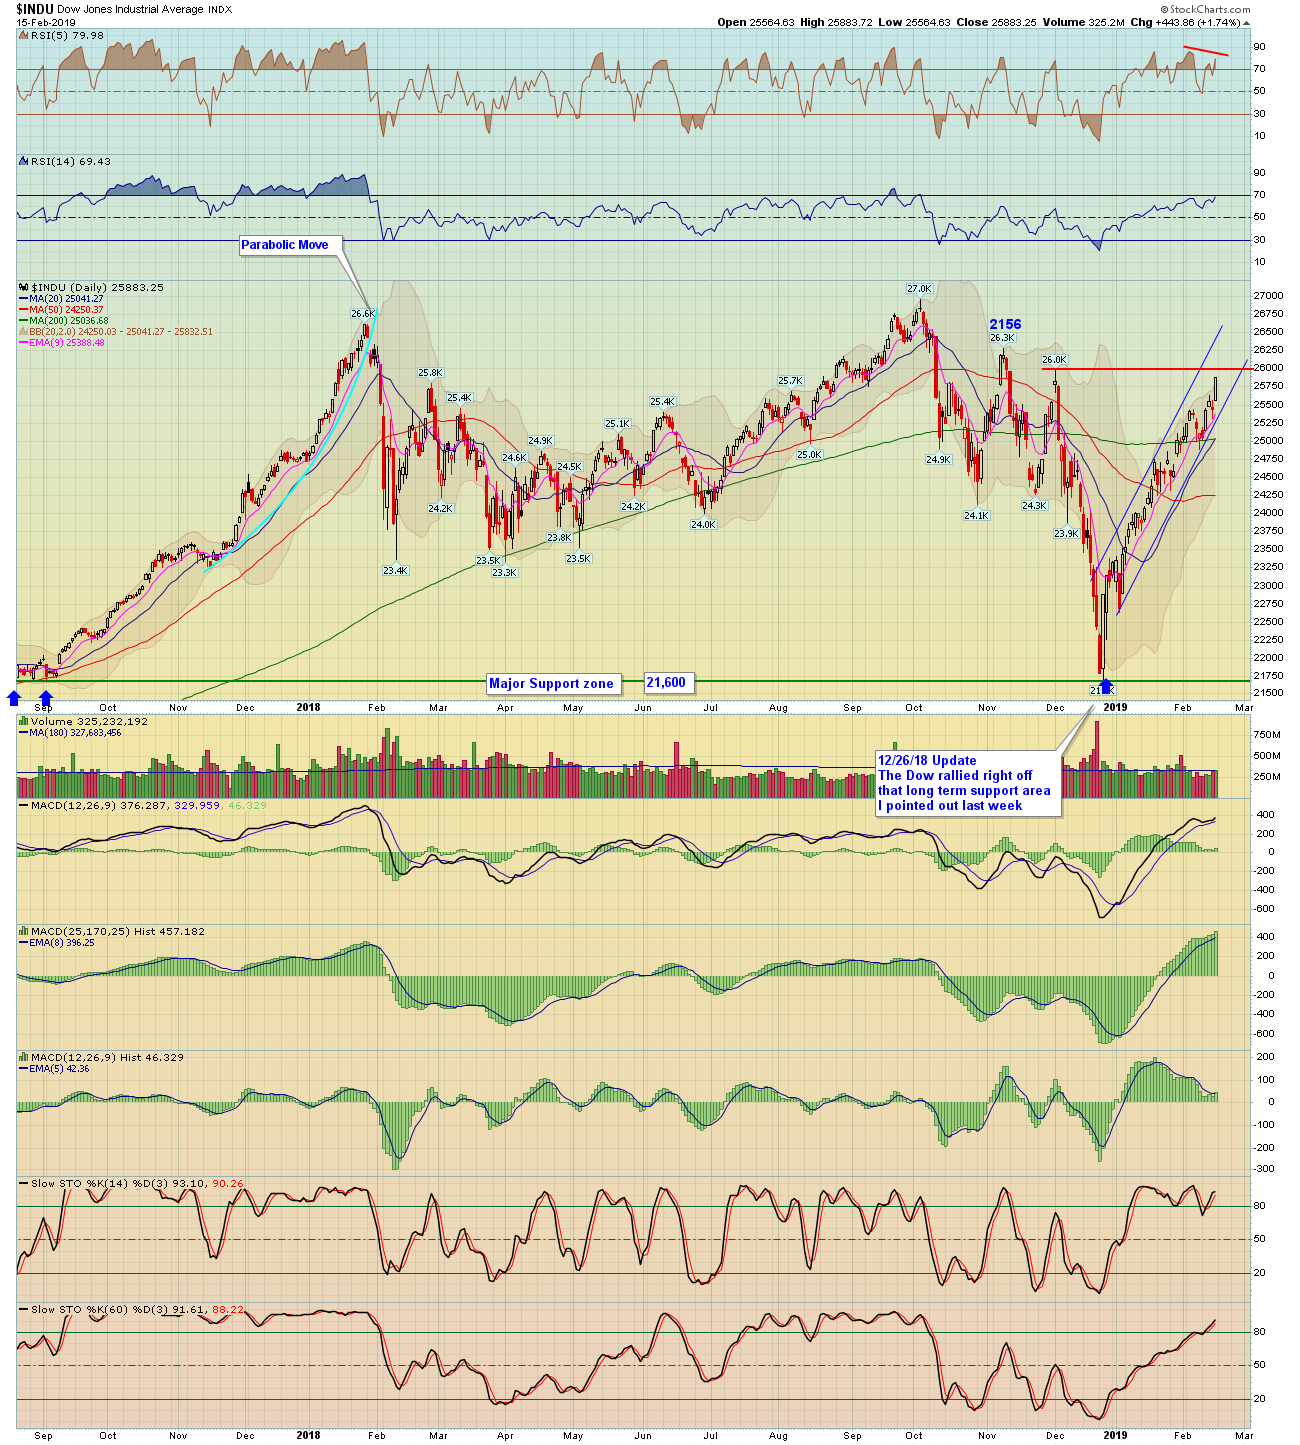
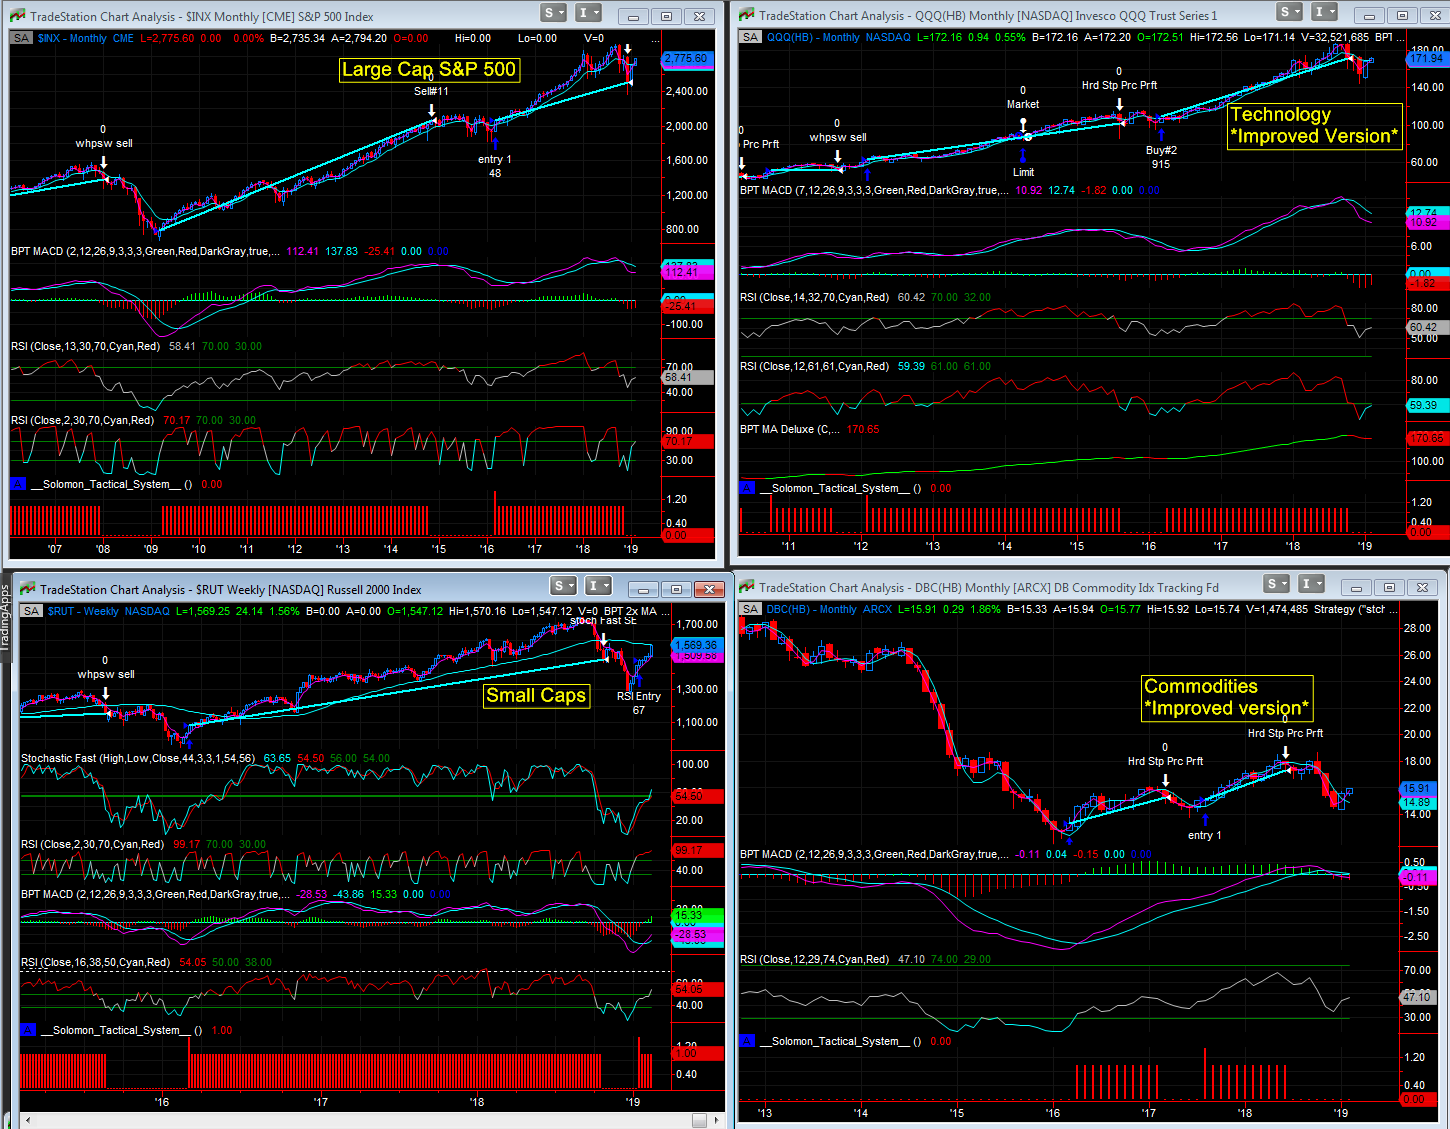
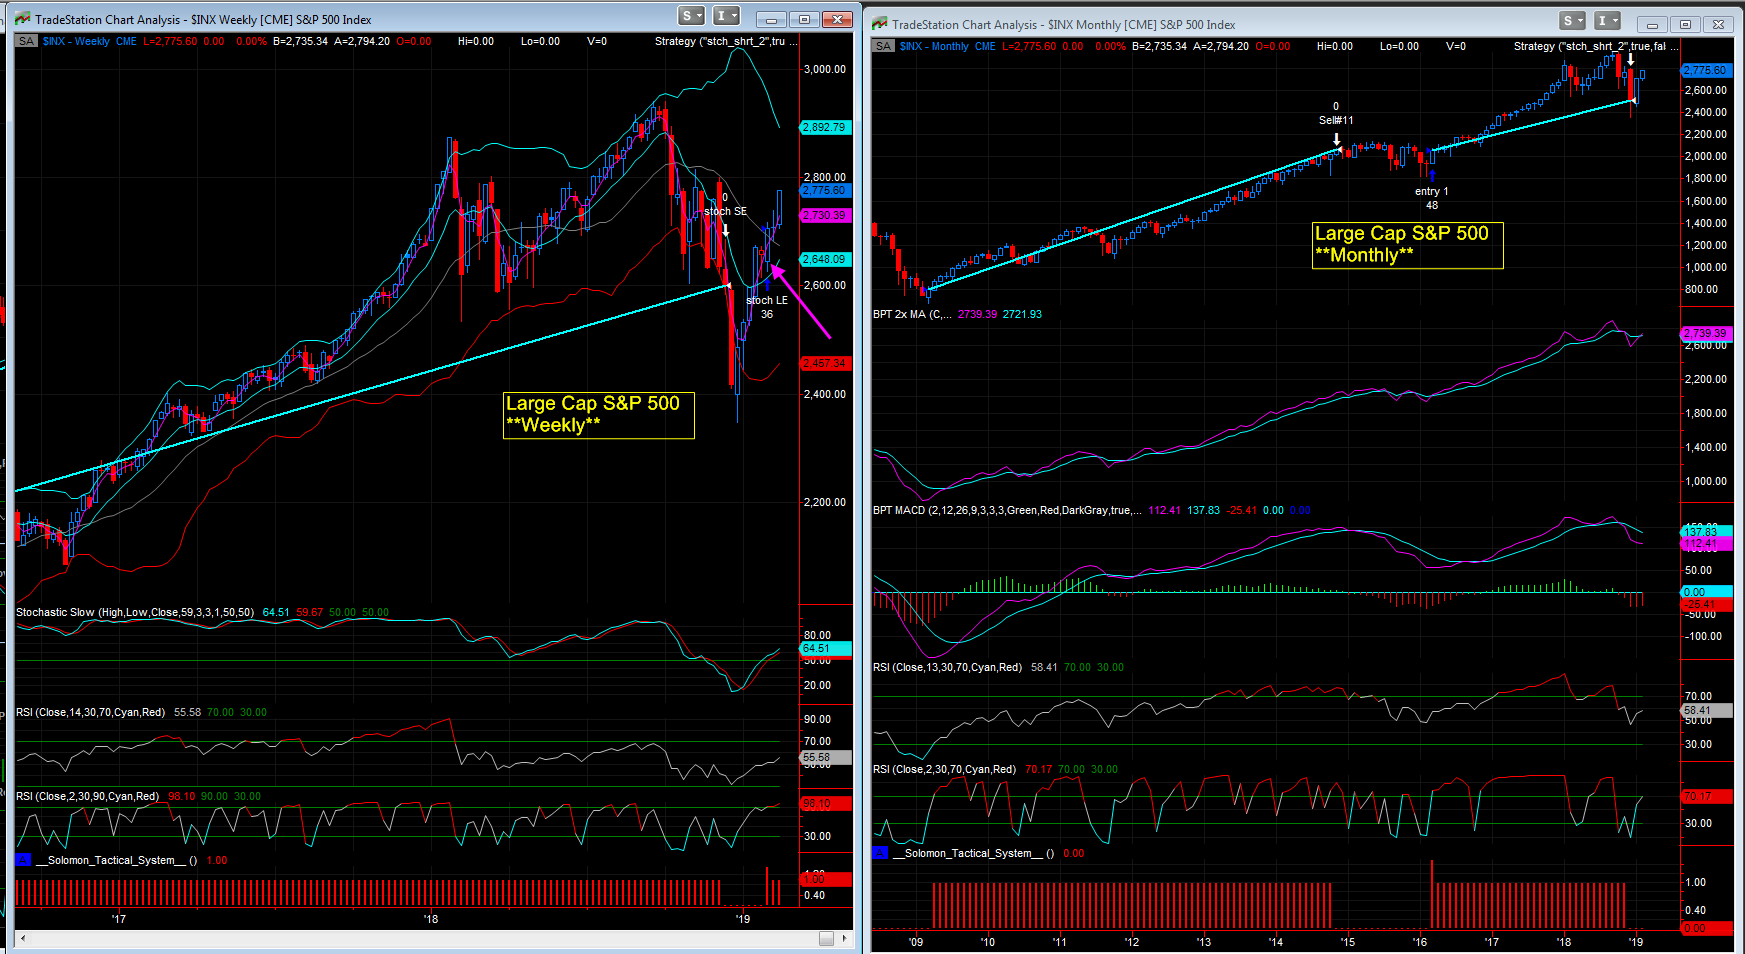
2. Review of the Major Indexes, Monthly, Weekly, Daily Intra day with focus on S&P 500
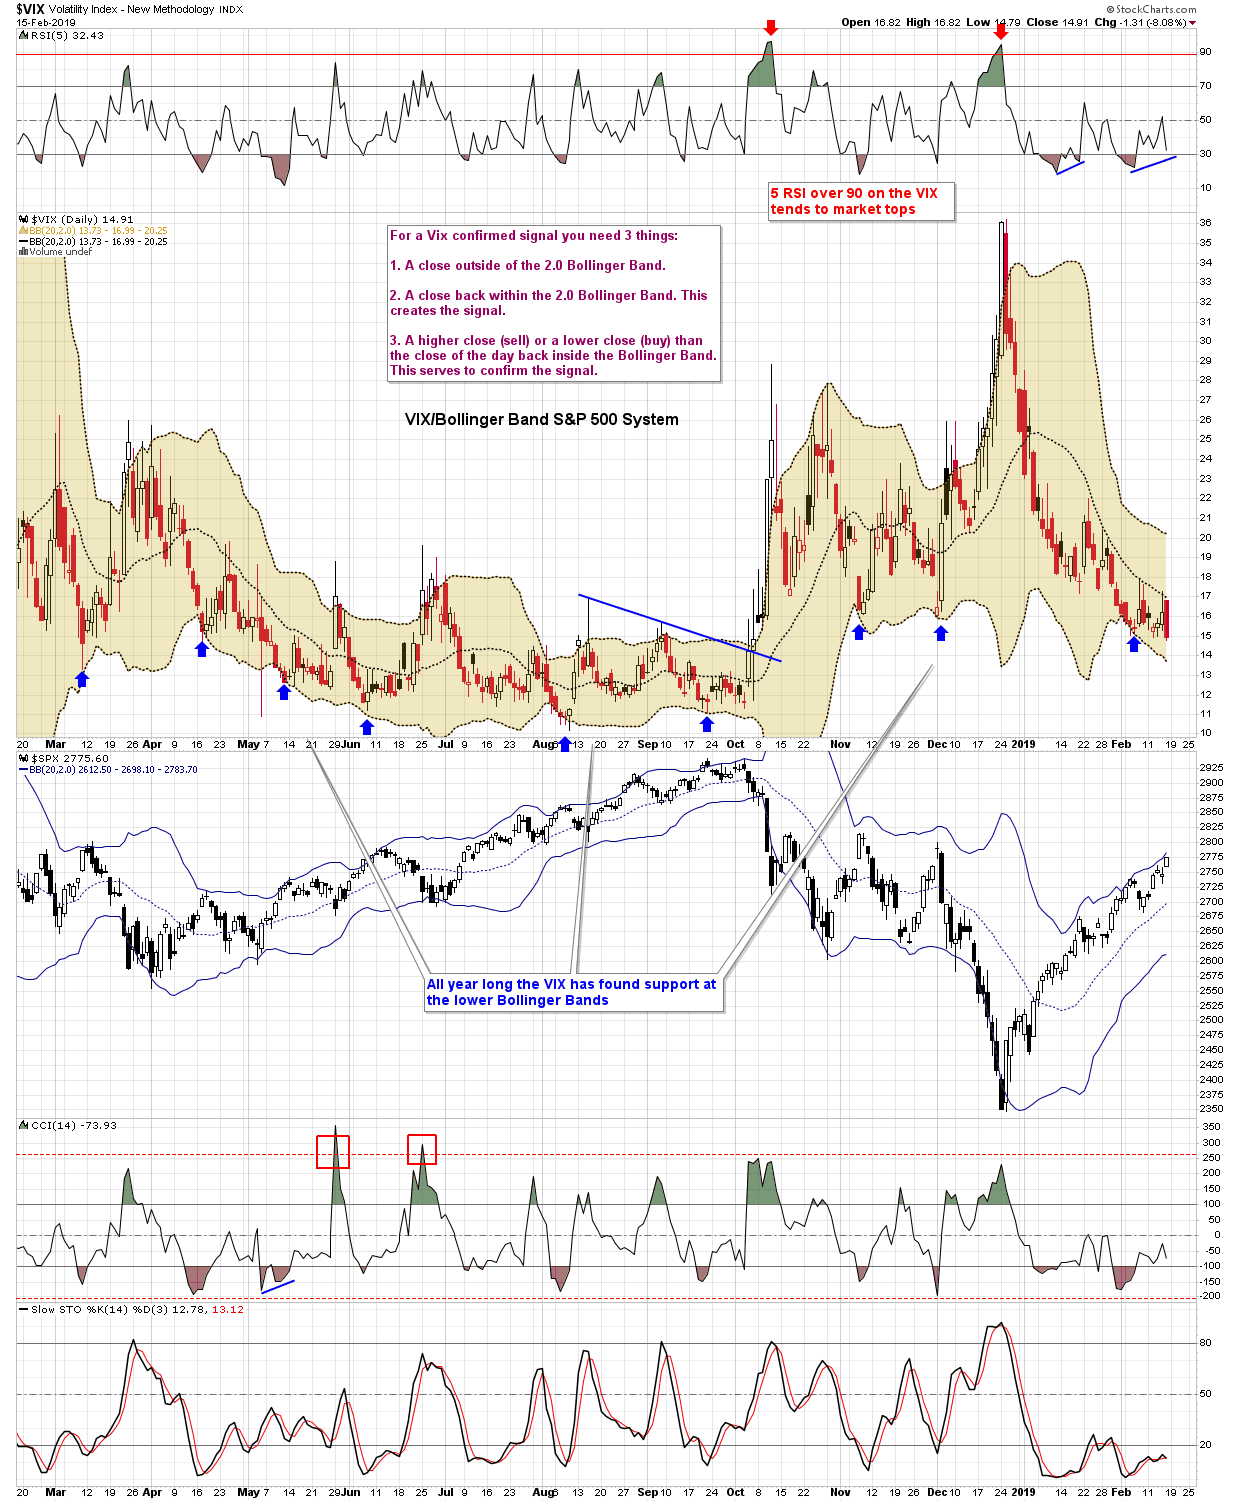
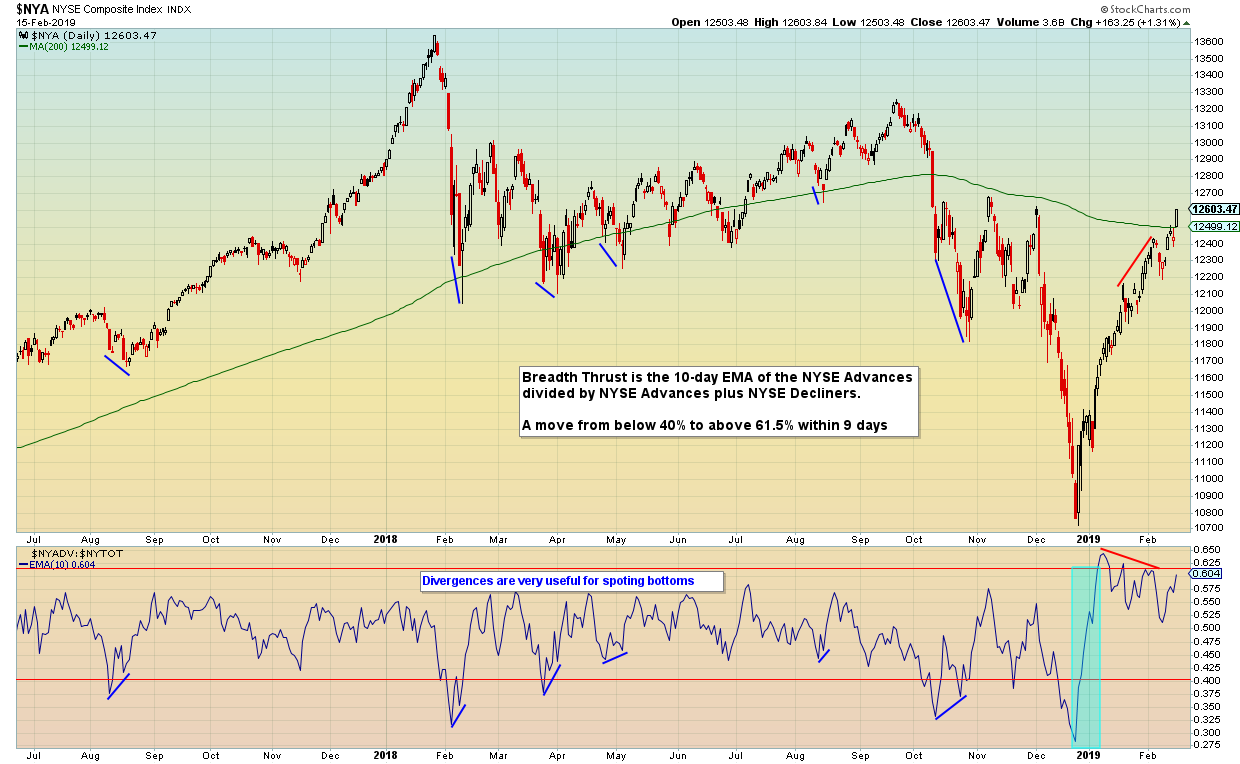
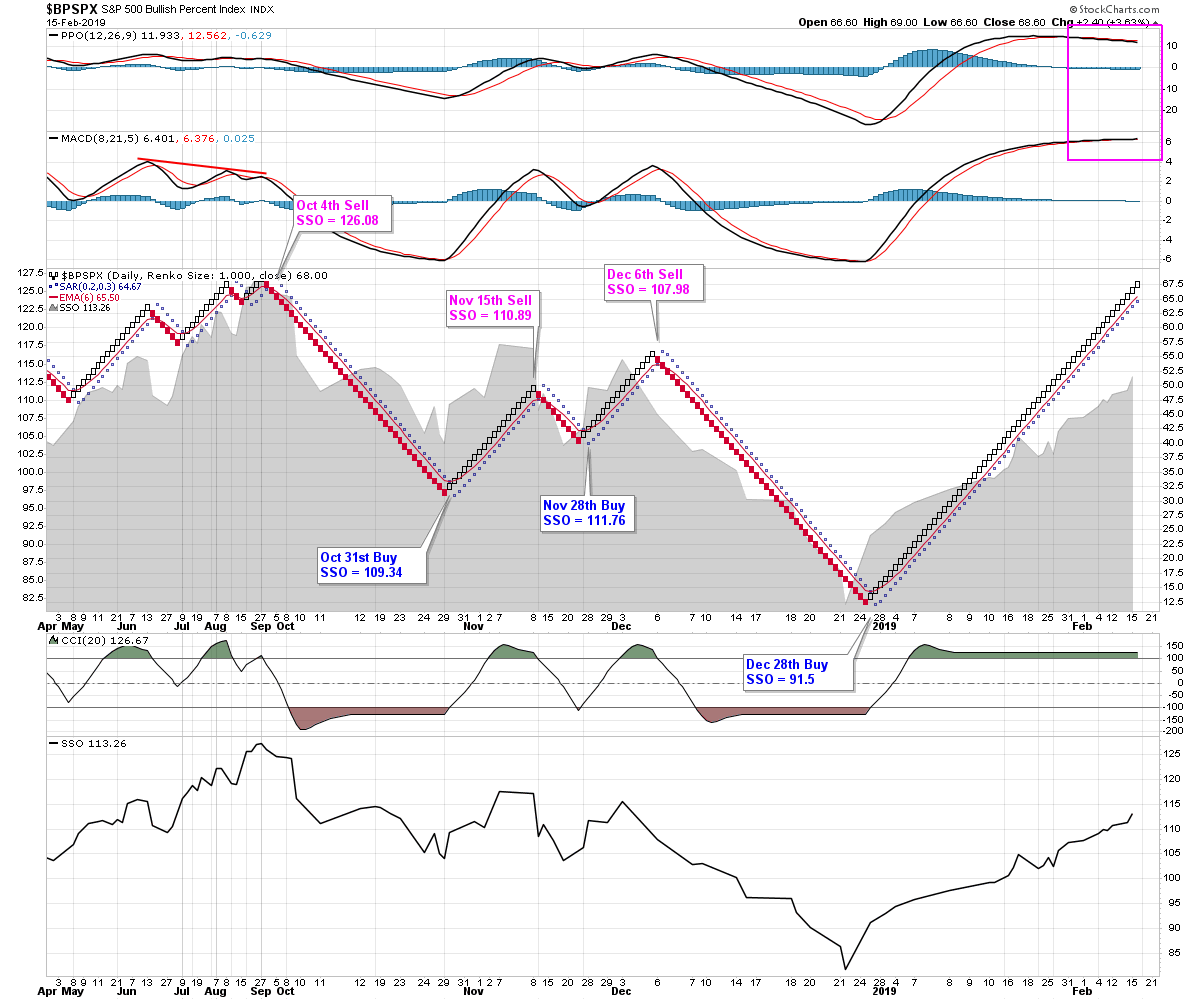
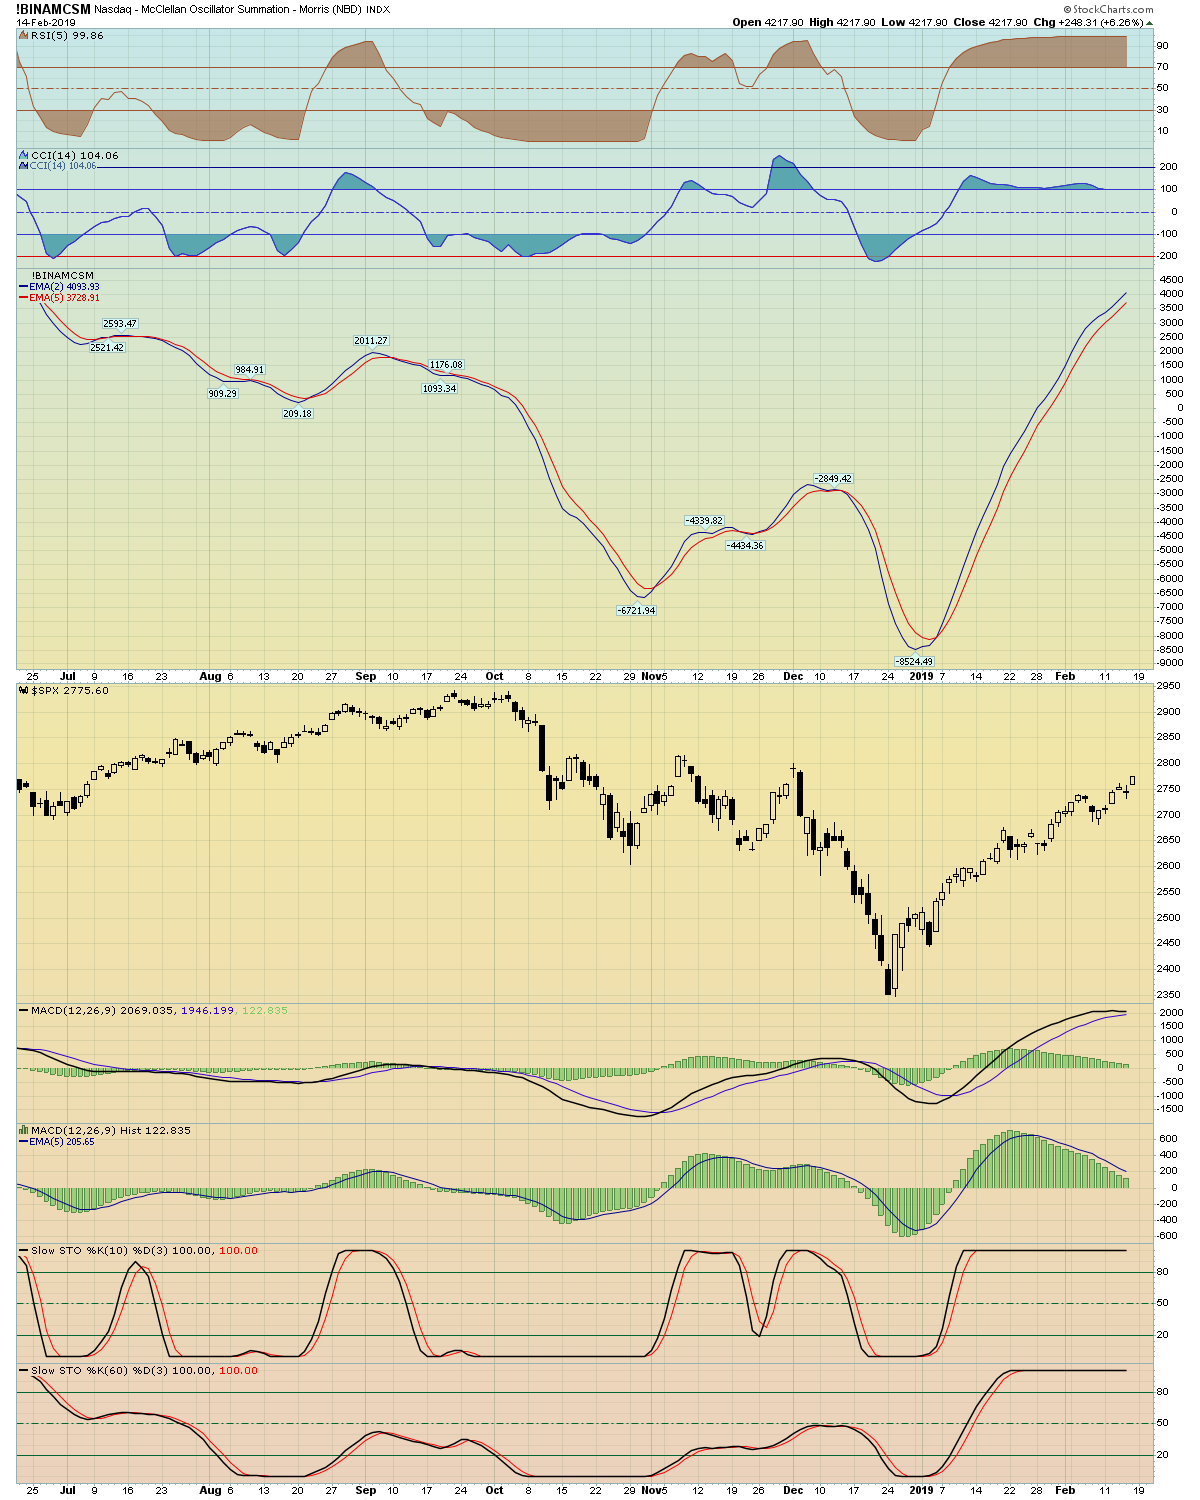
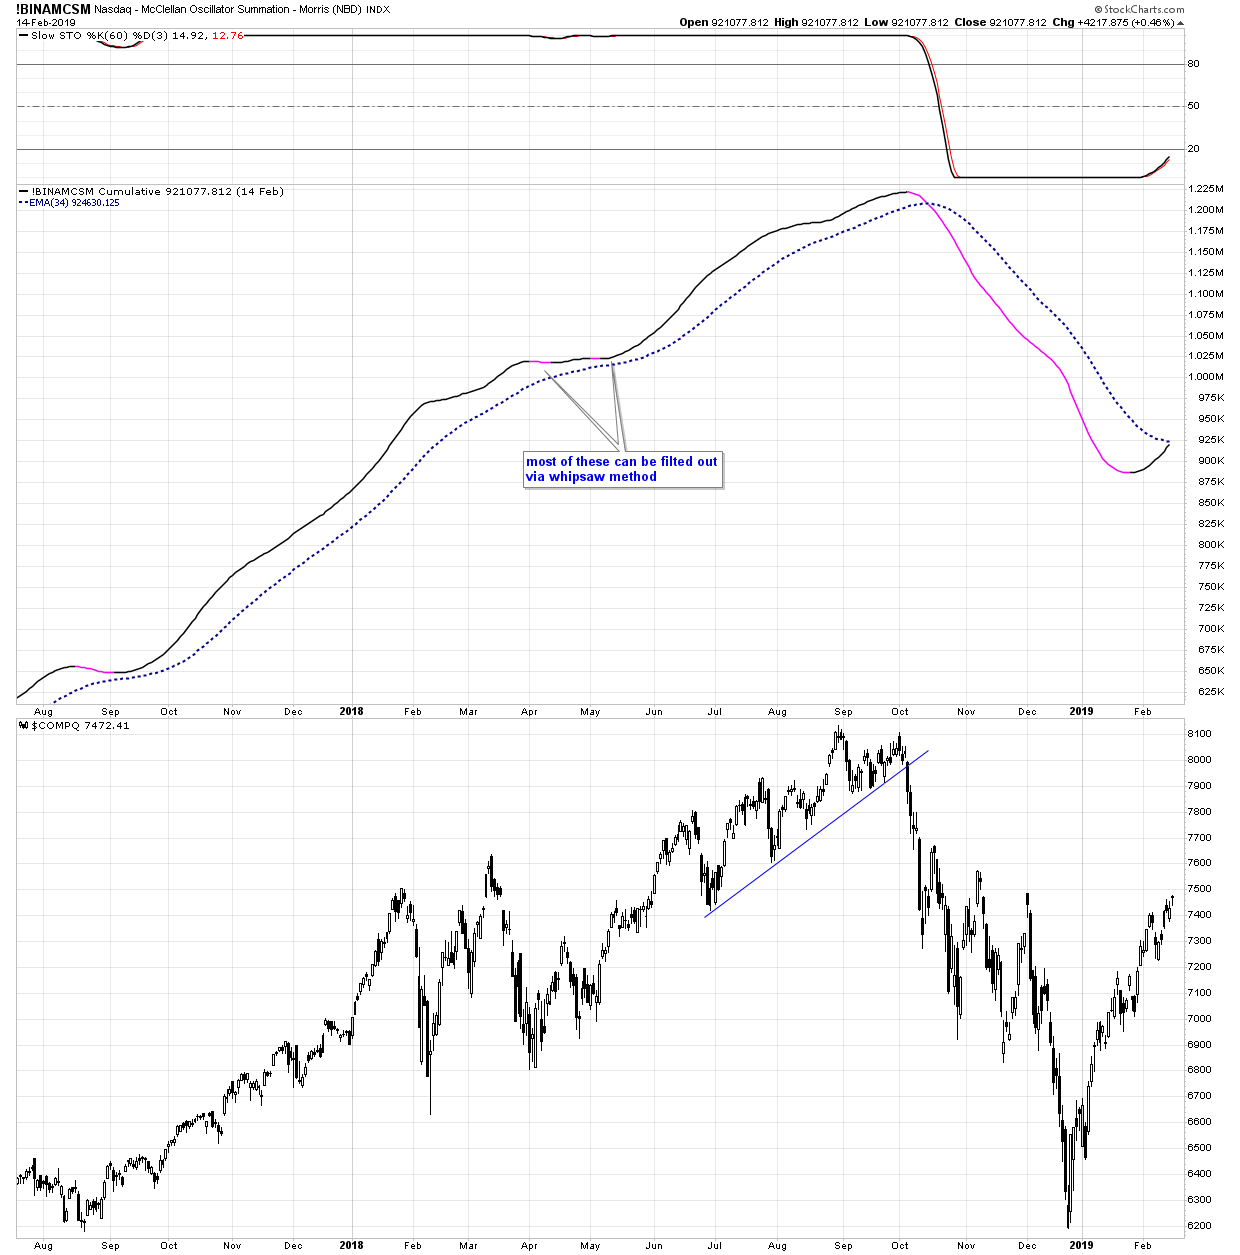
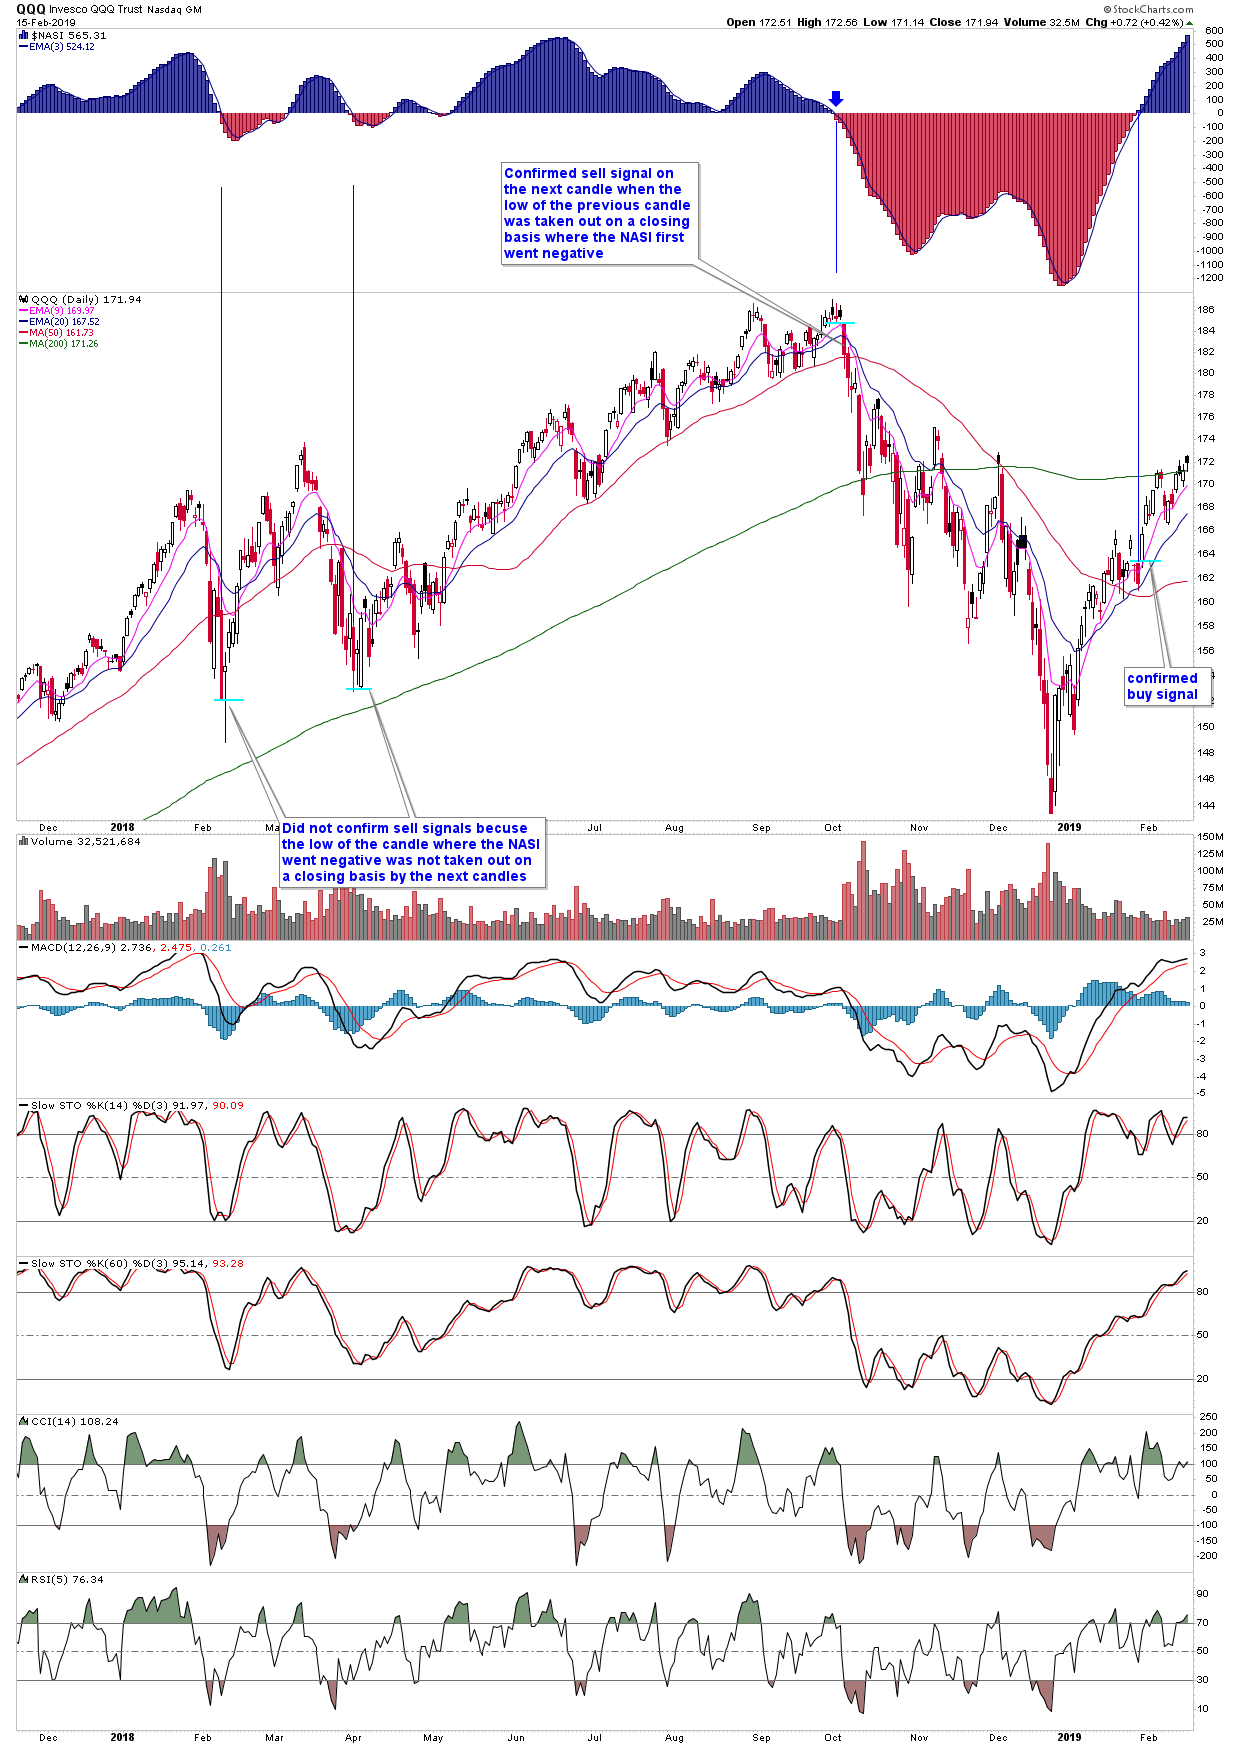
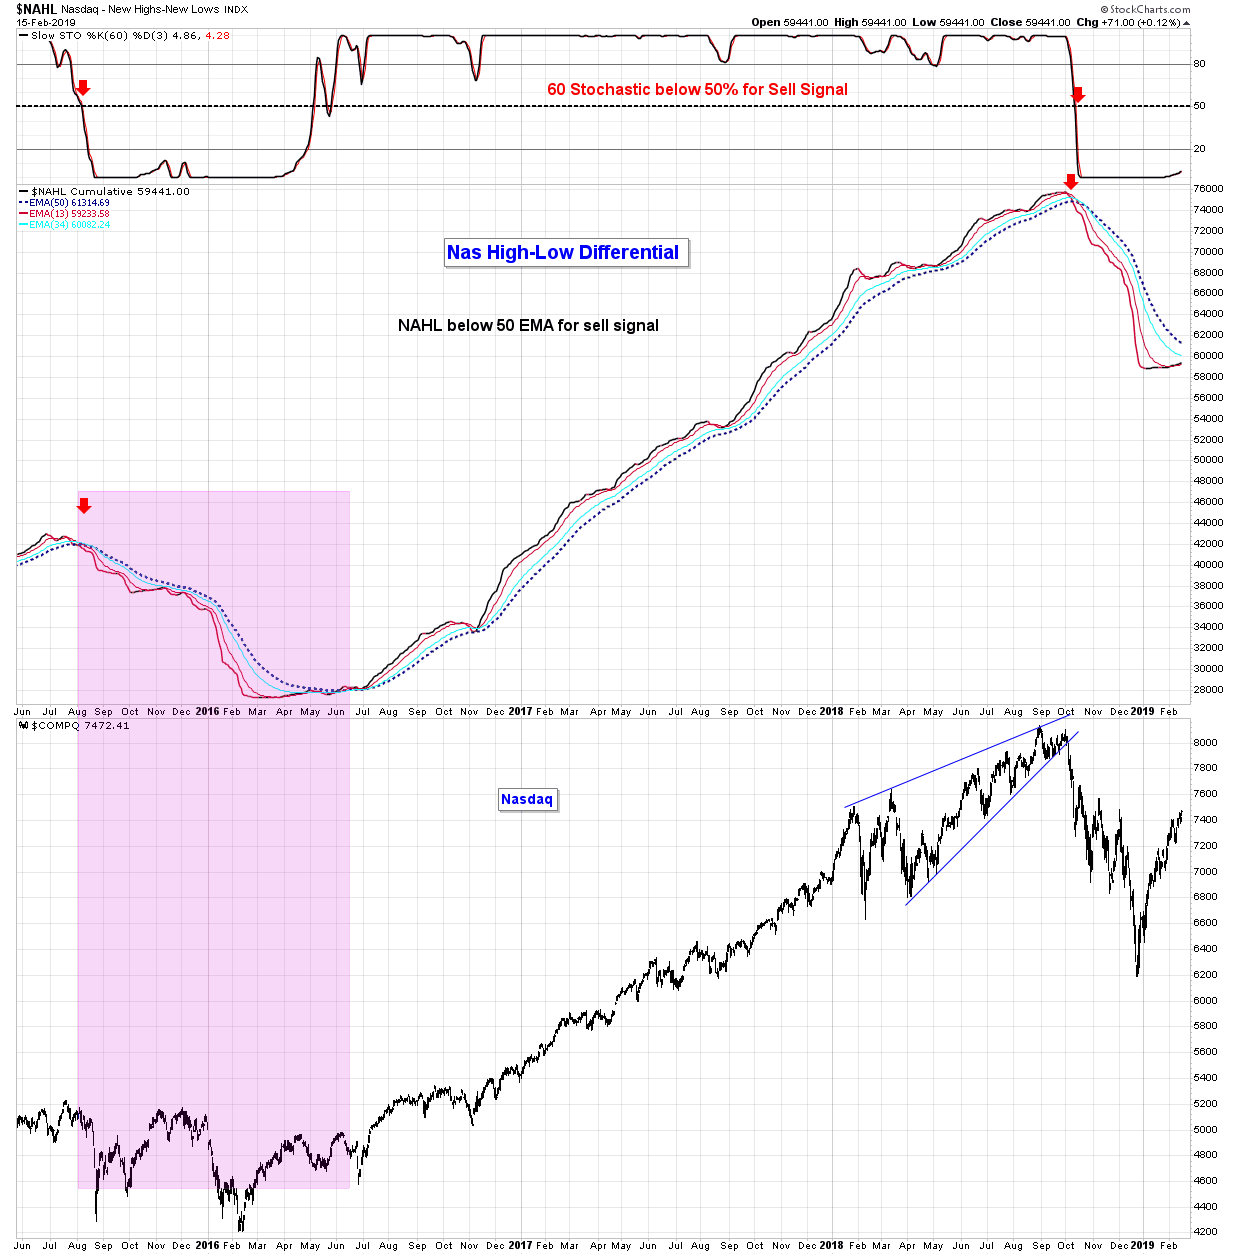
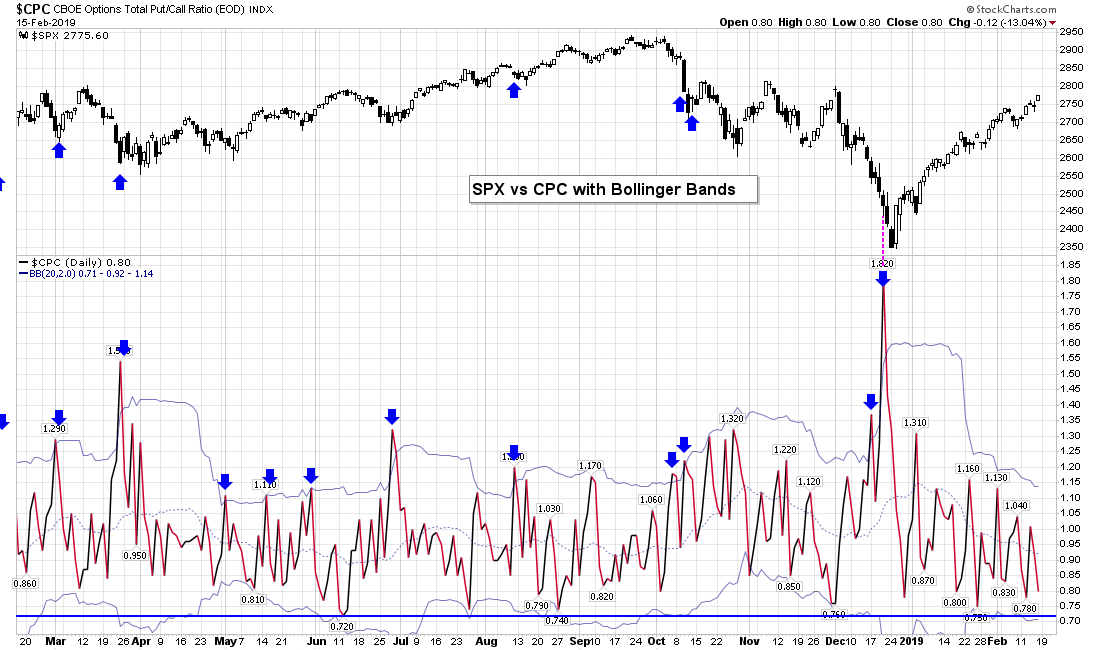
3. An In-Depth look at important market indicators: VIX, CPC, NYSI, NASI, and summation indicators,
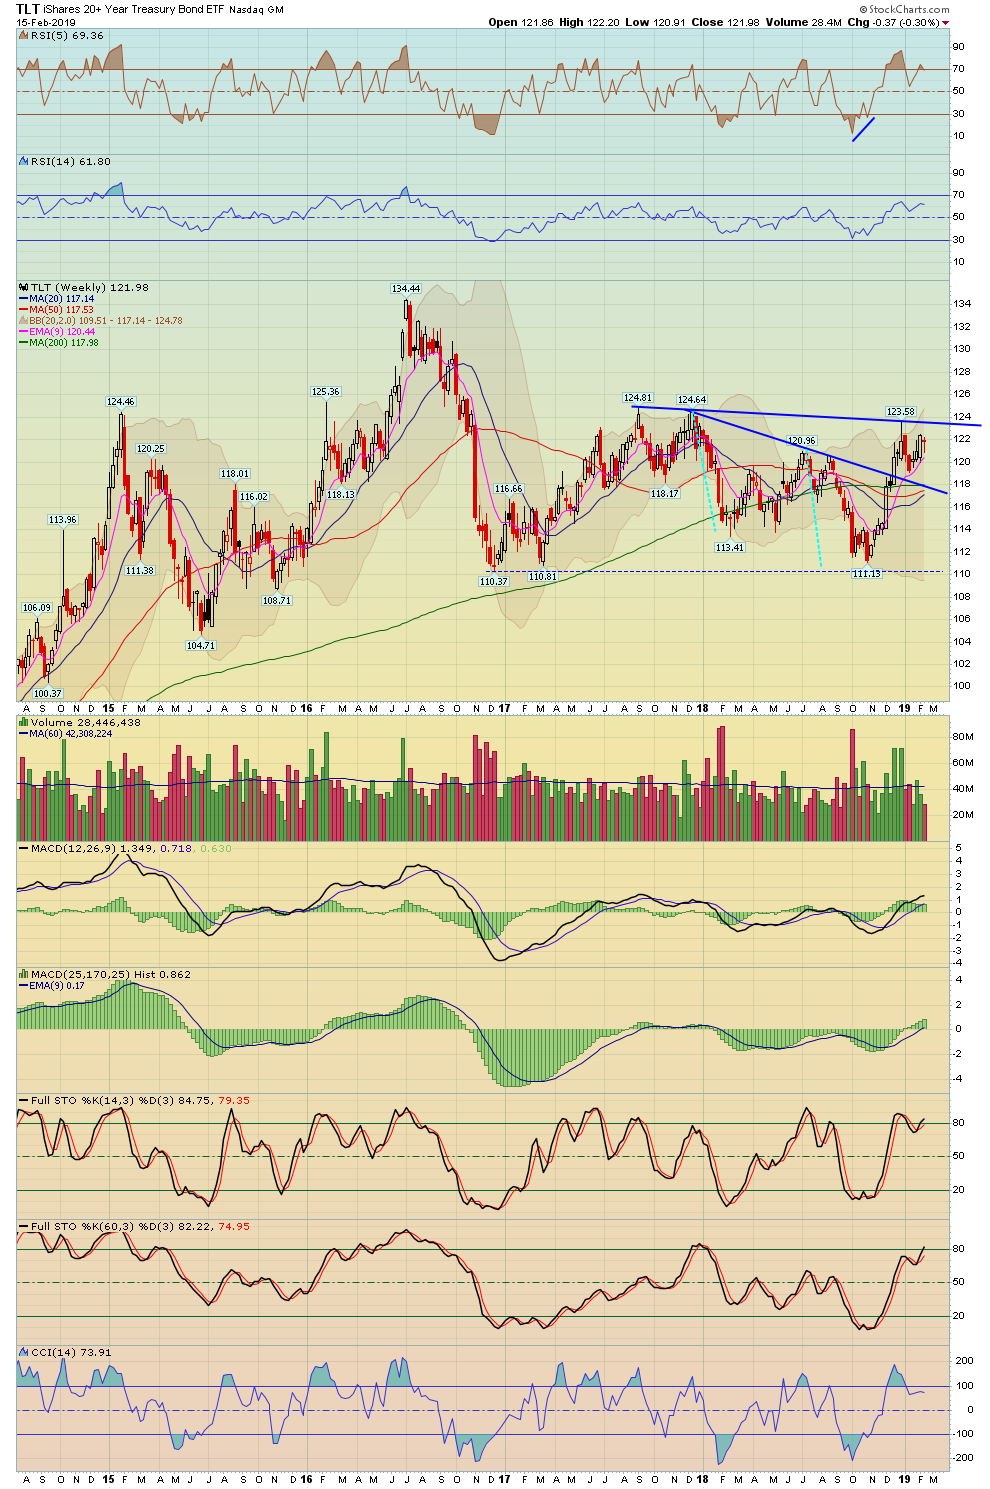
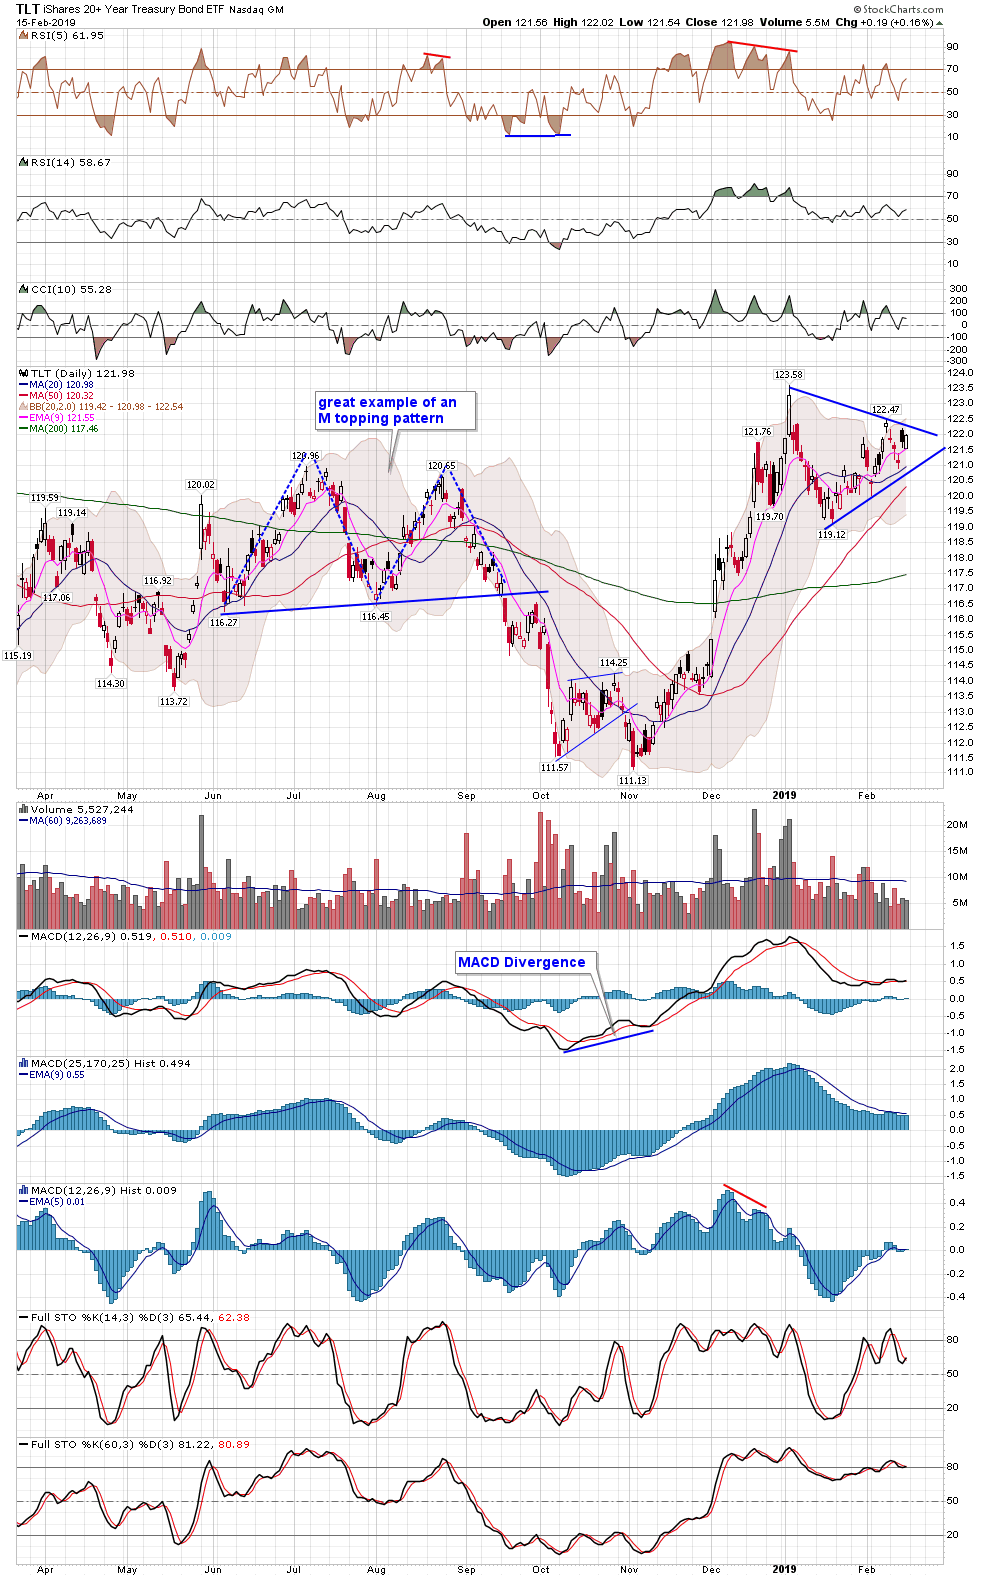
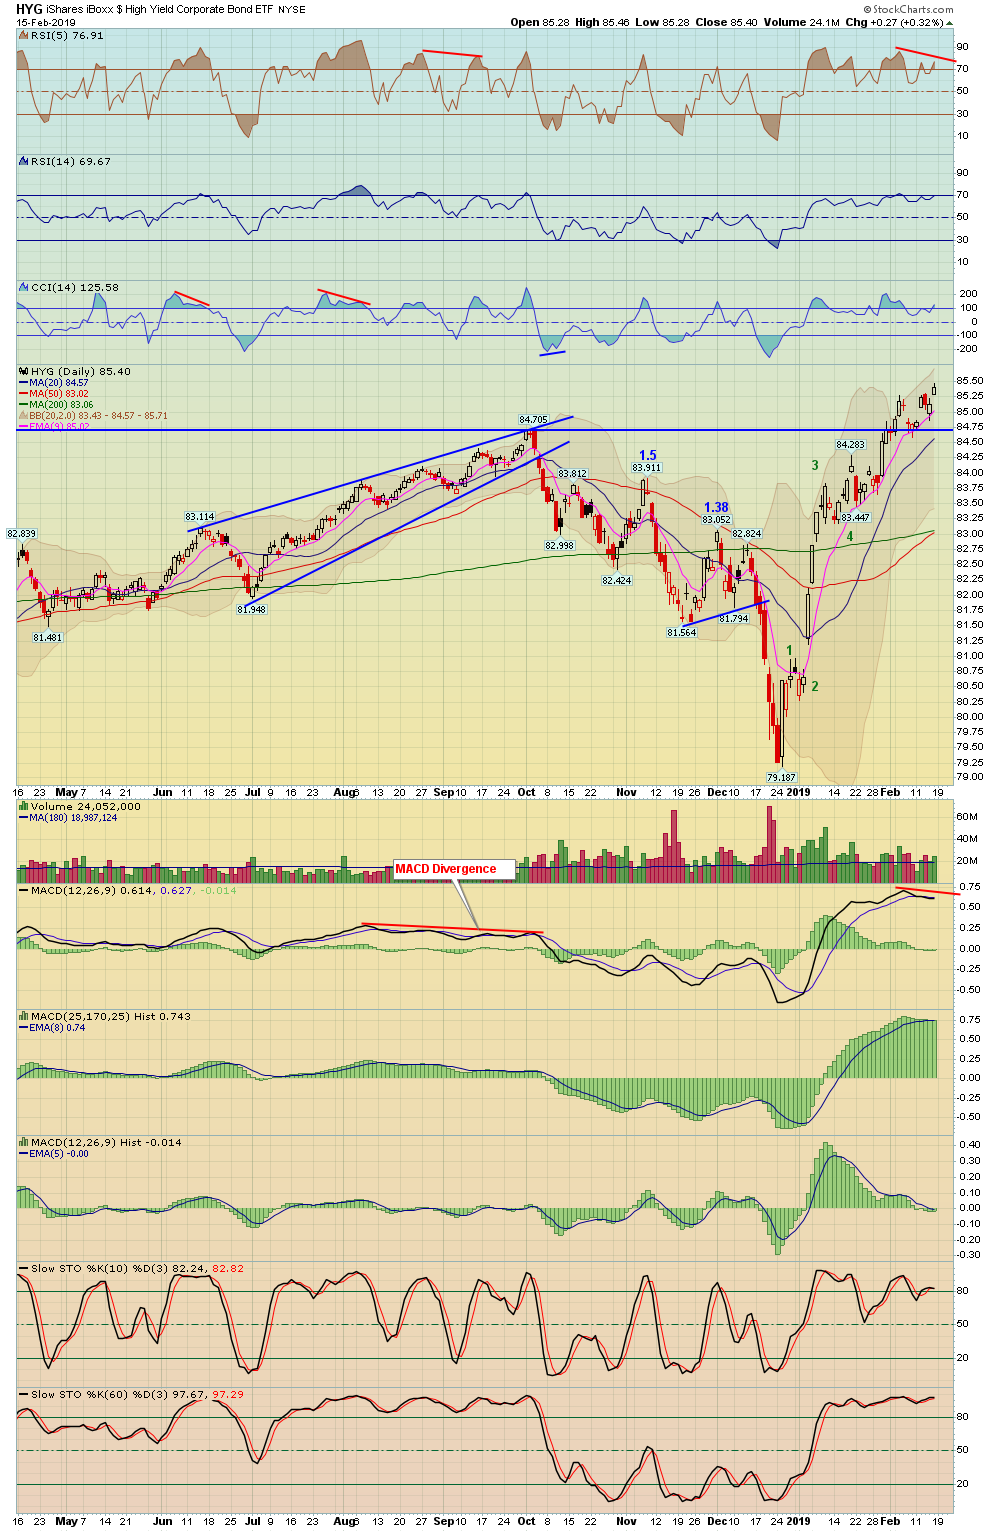
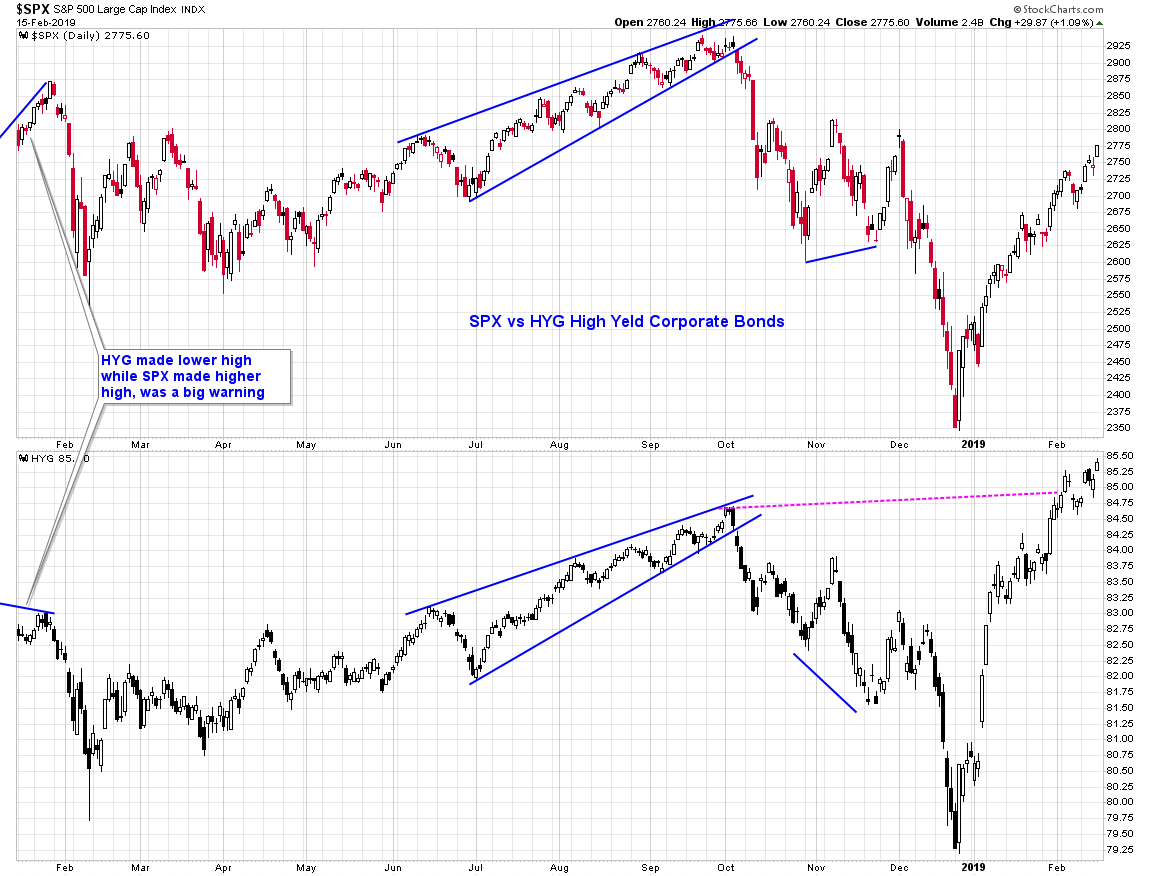
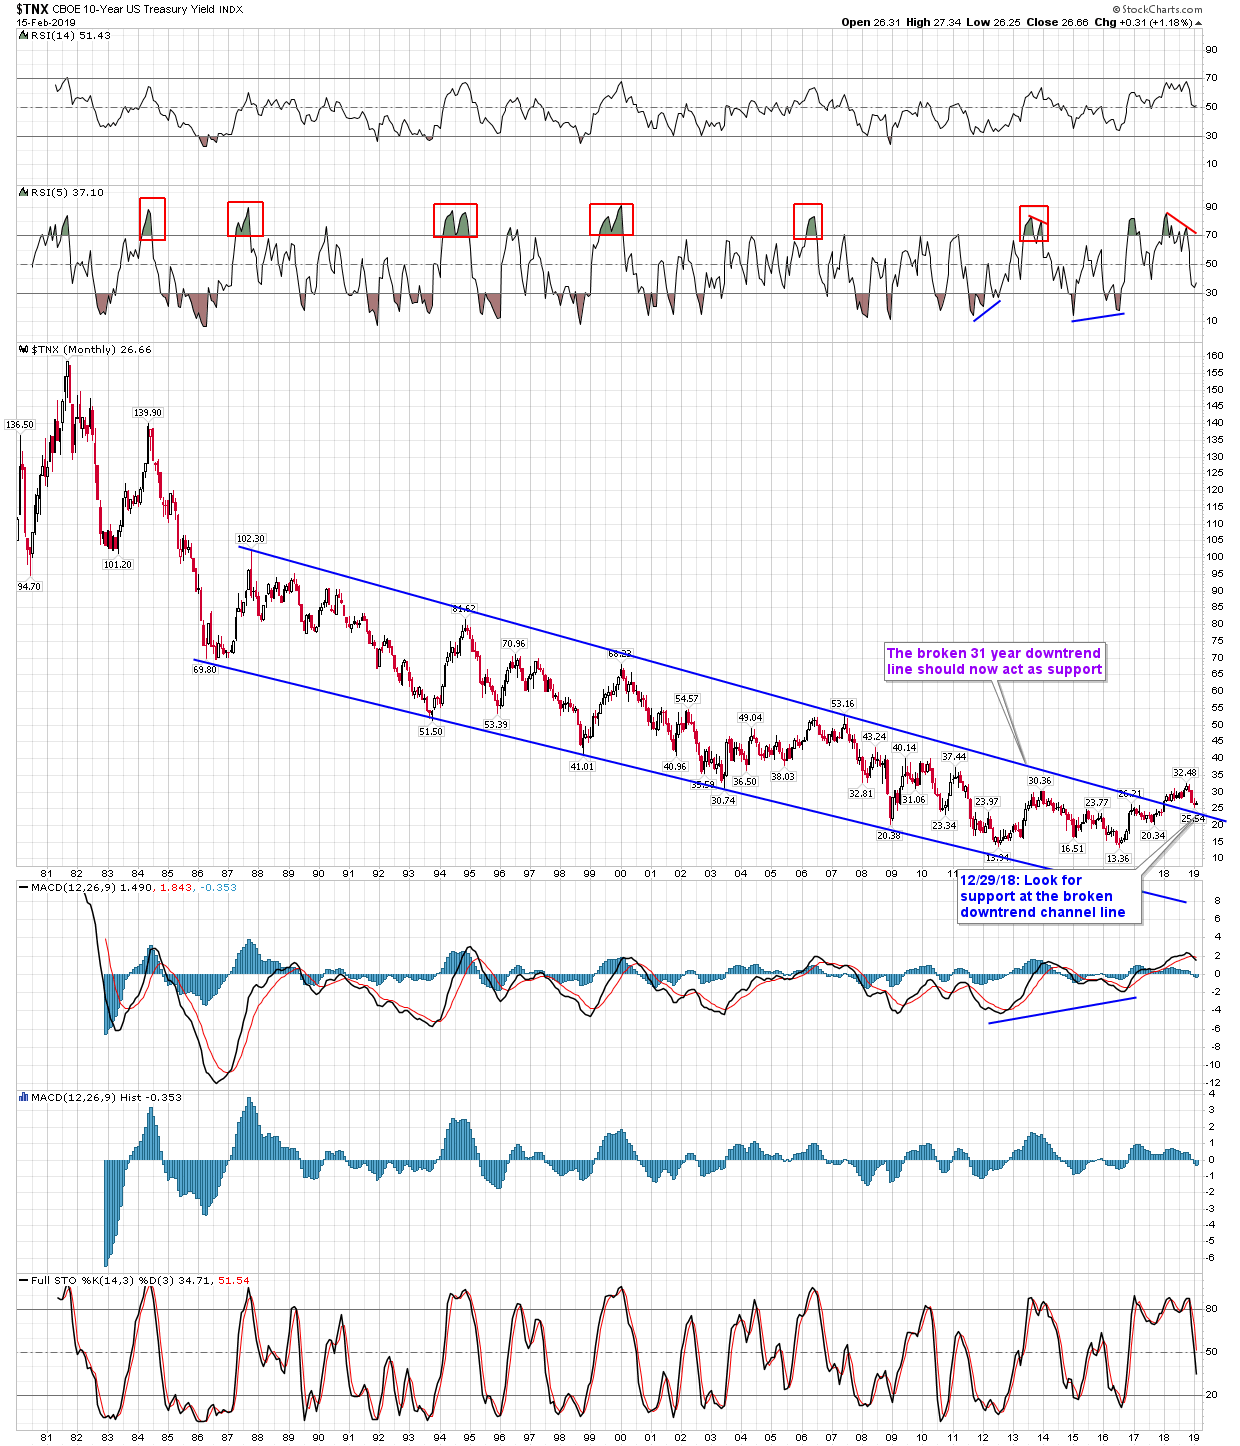
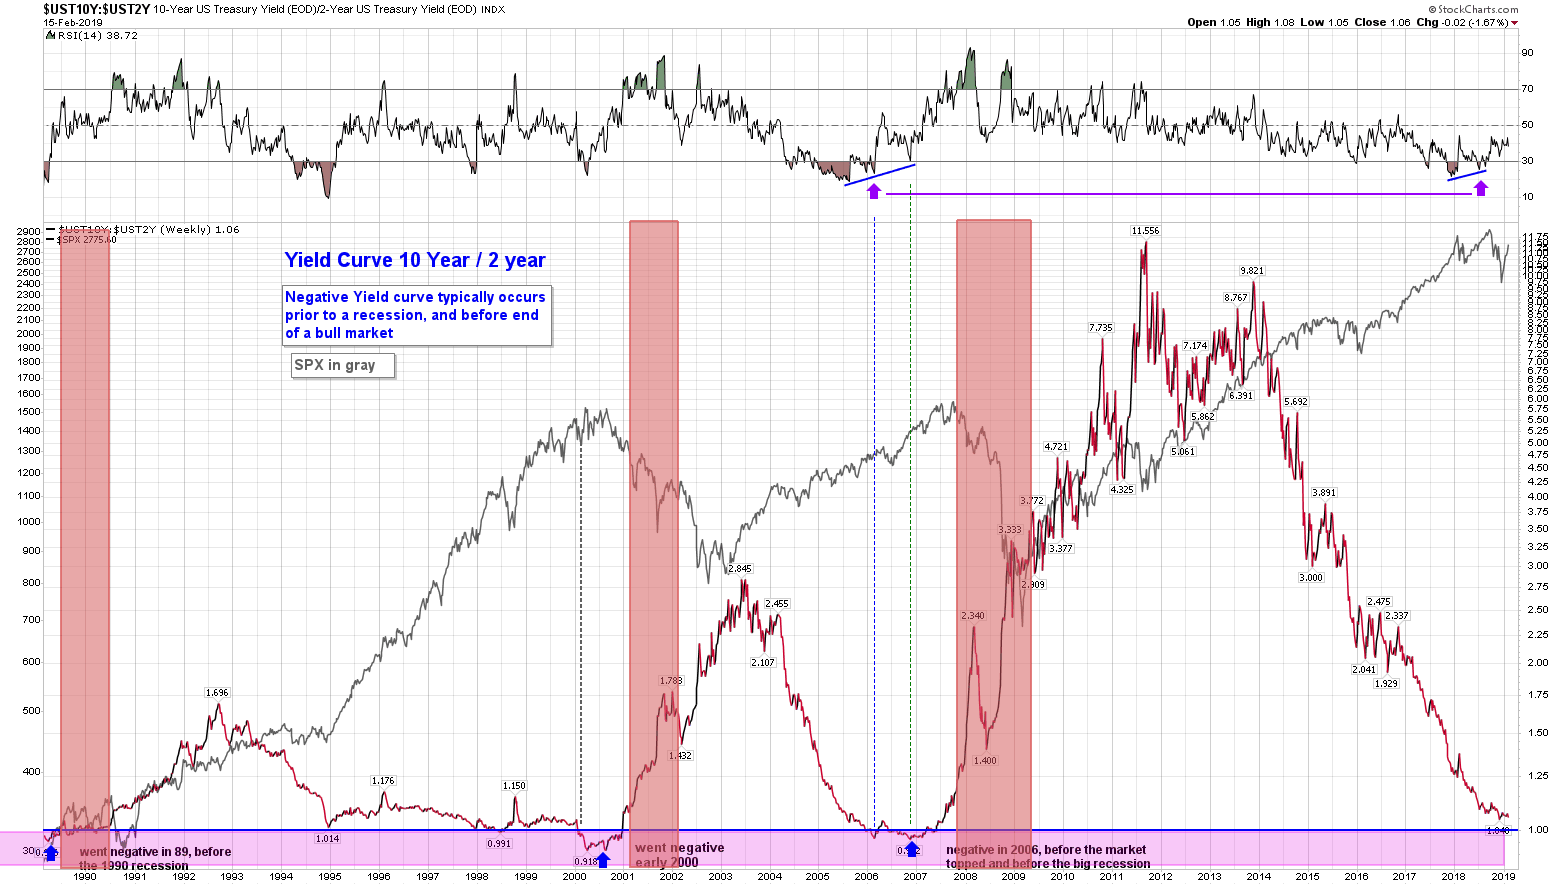
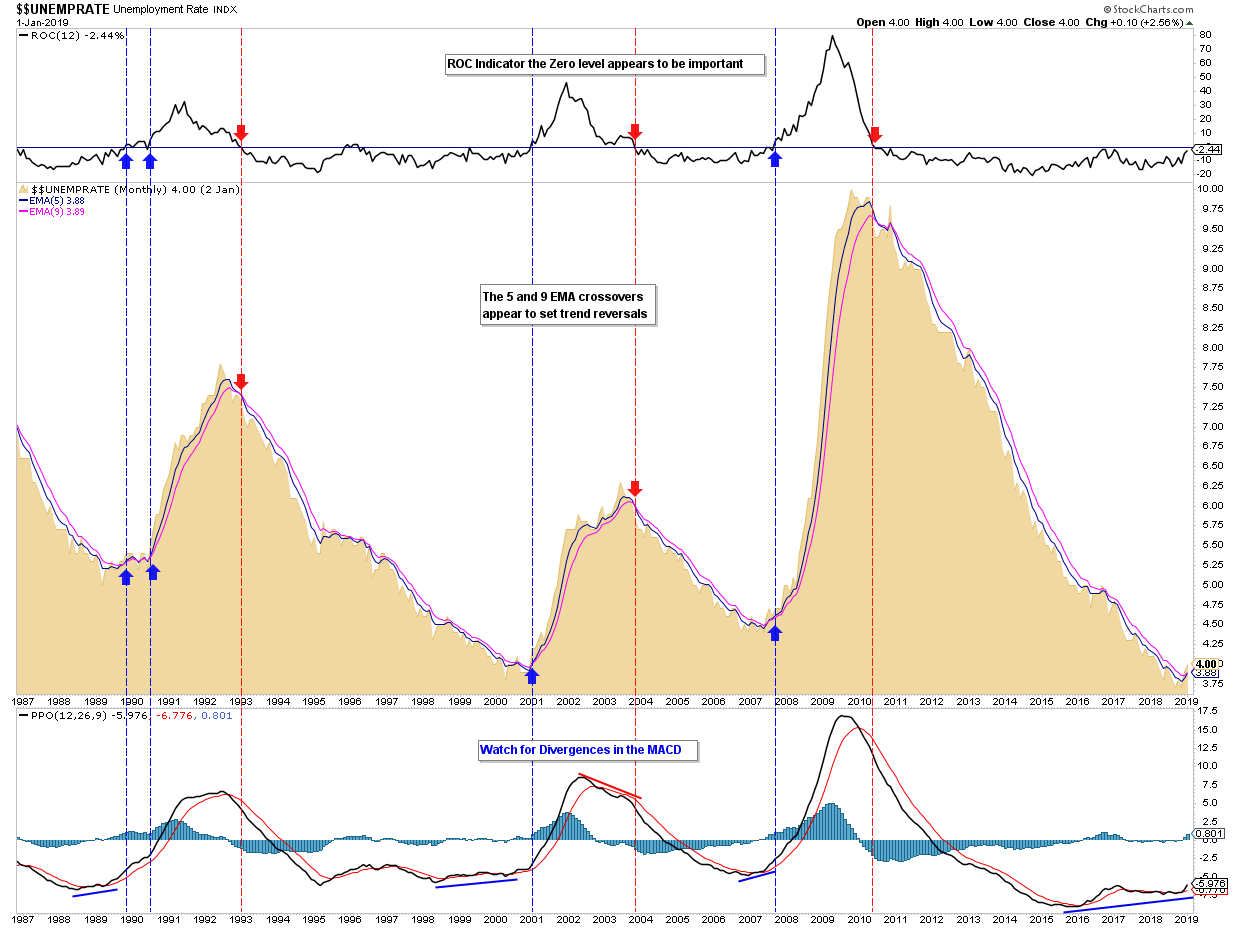
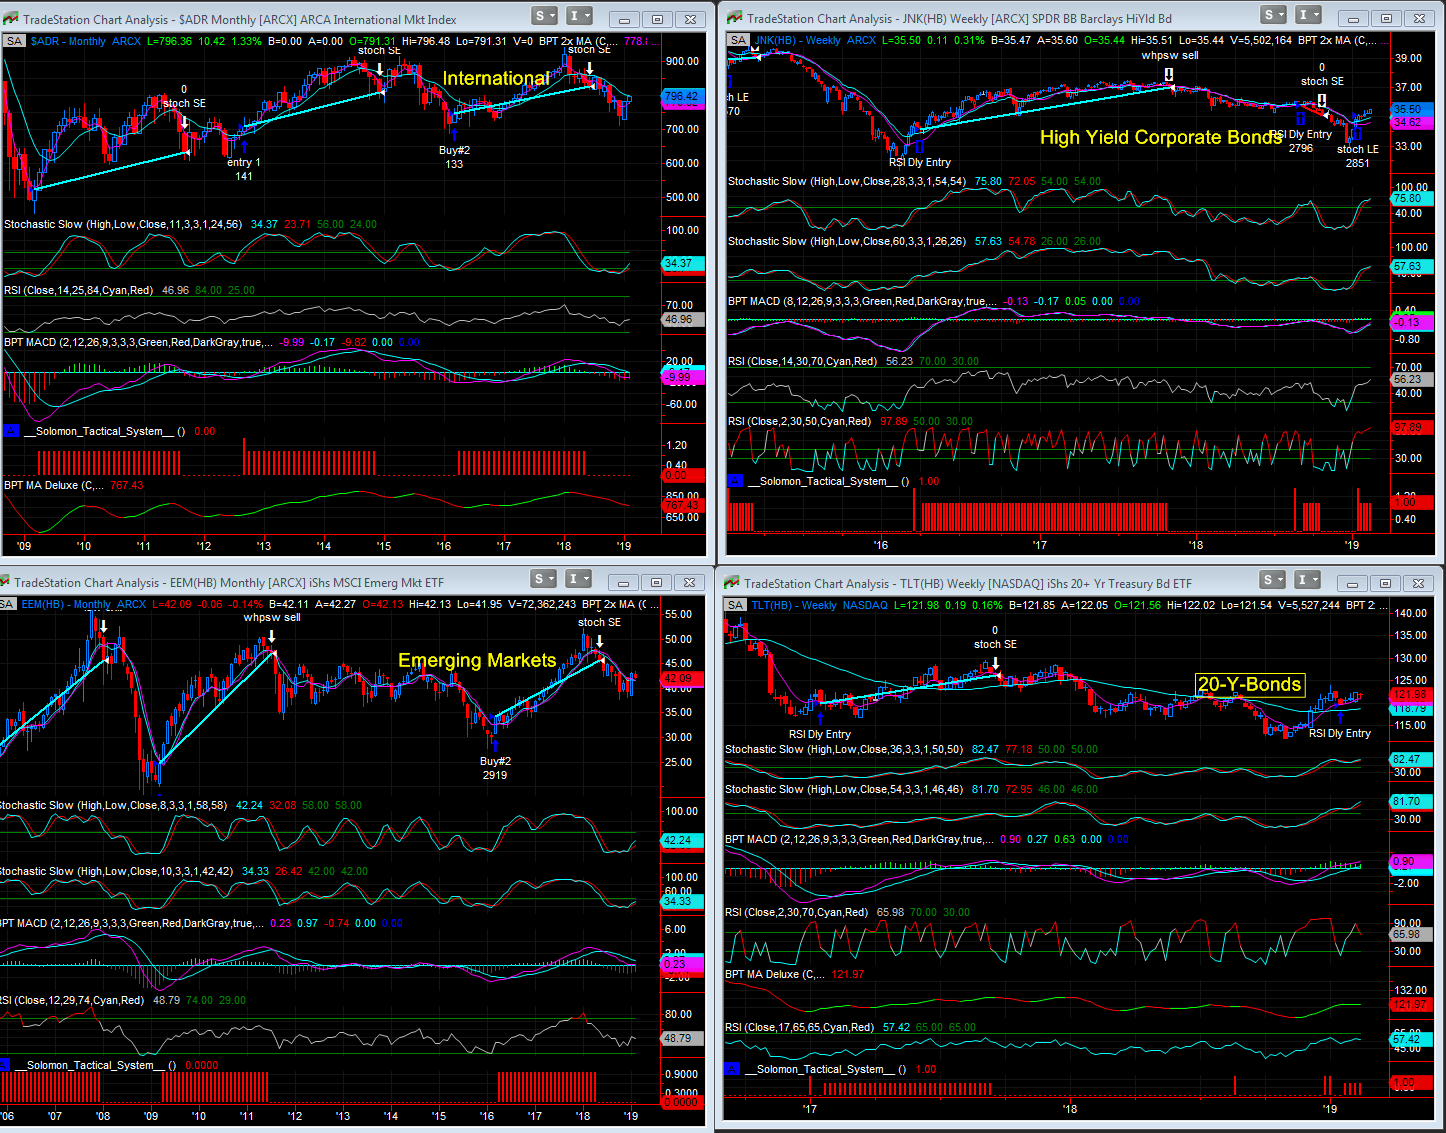
4. Quick Overview of Bonds via TLT and HYG, Yield Curve, Economic Indicators
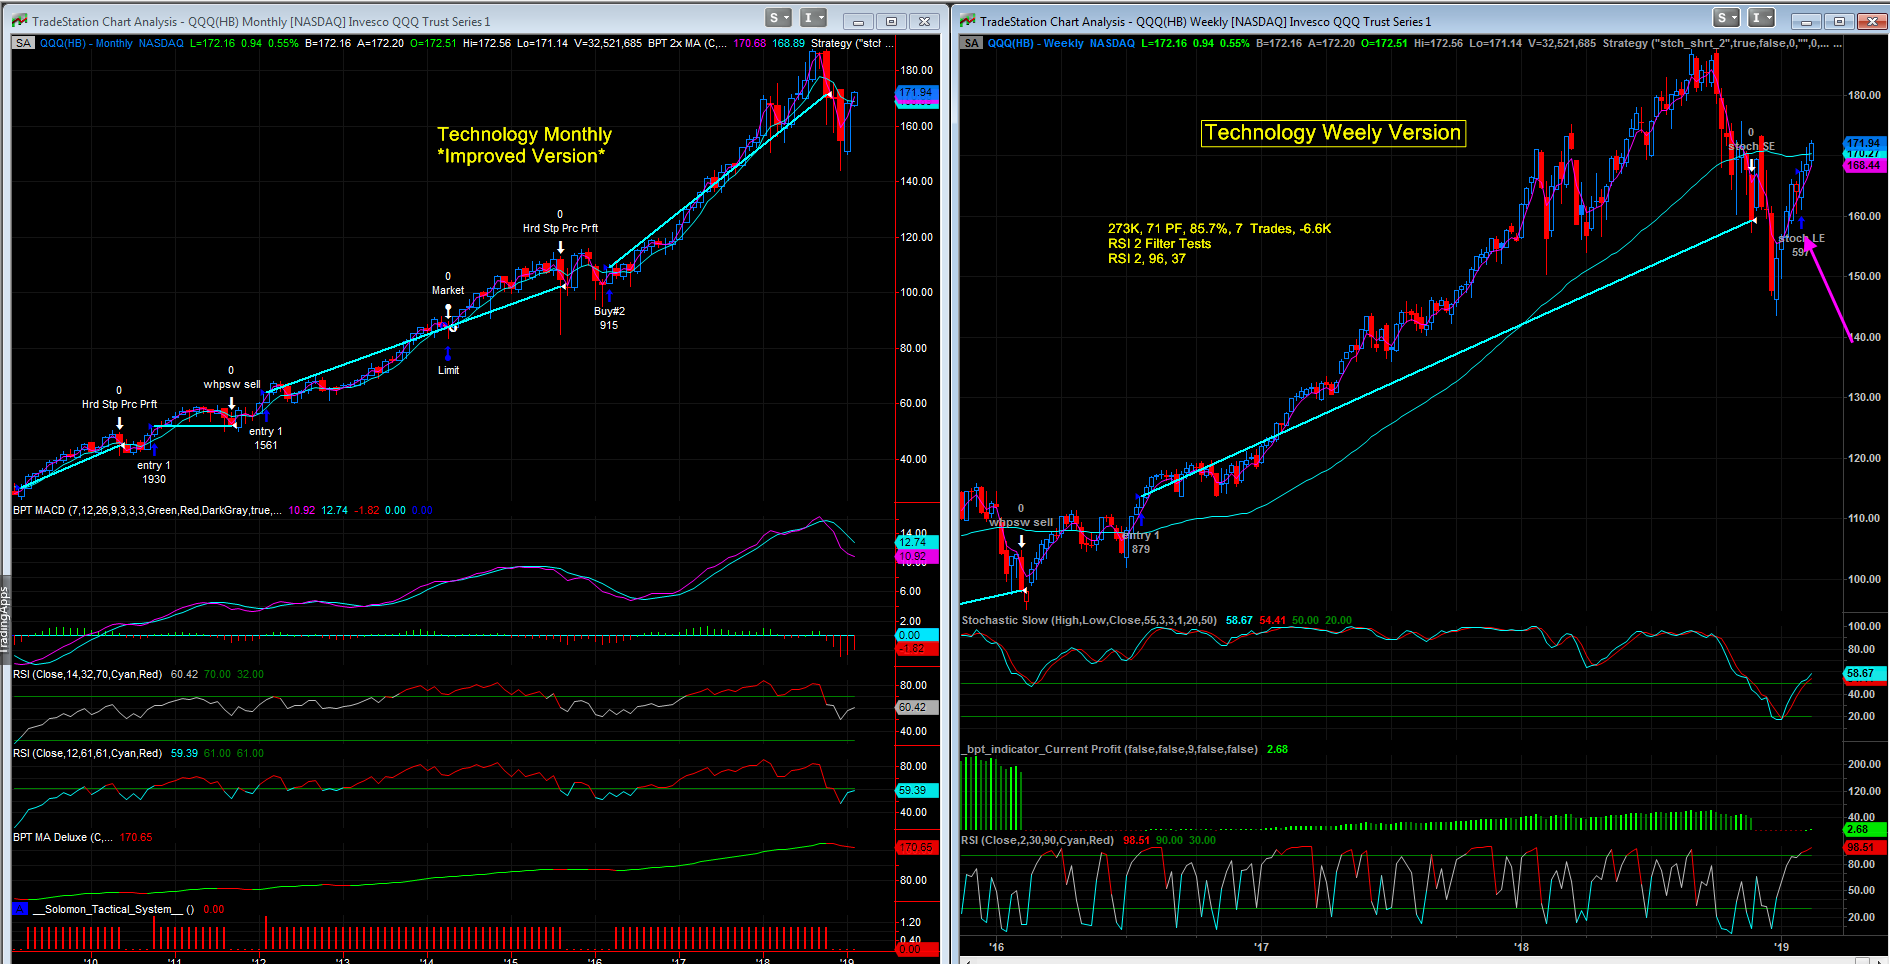
5. Examine Sector Charts
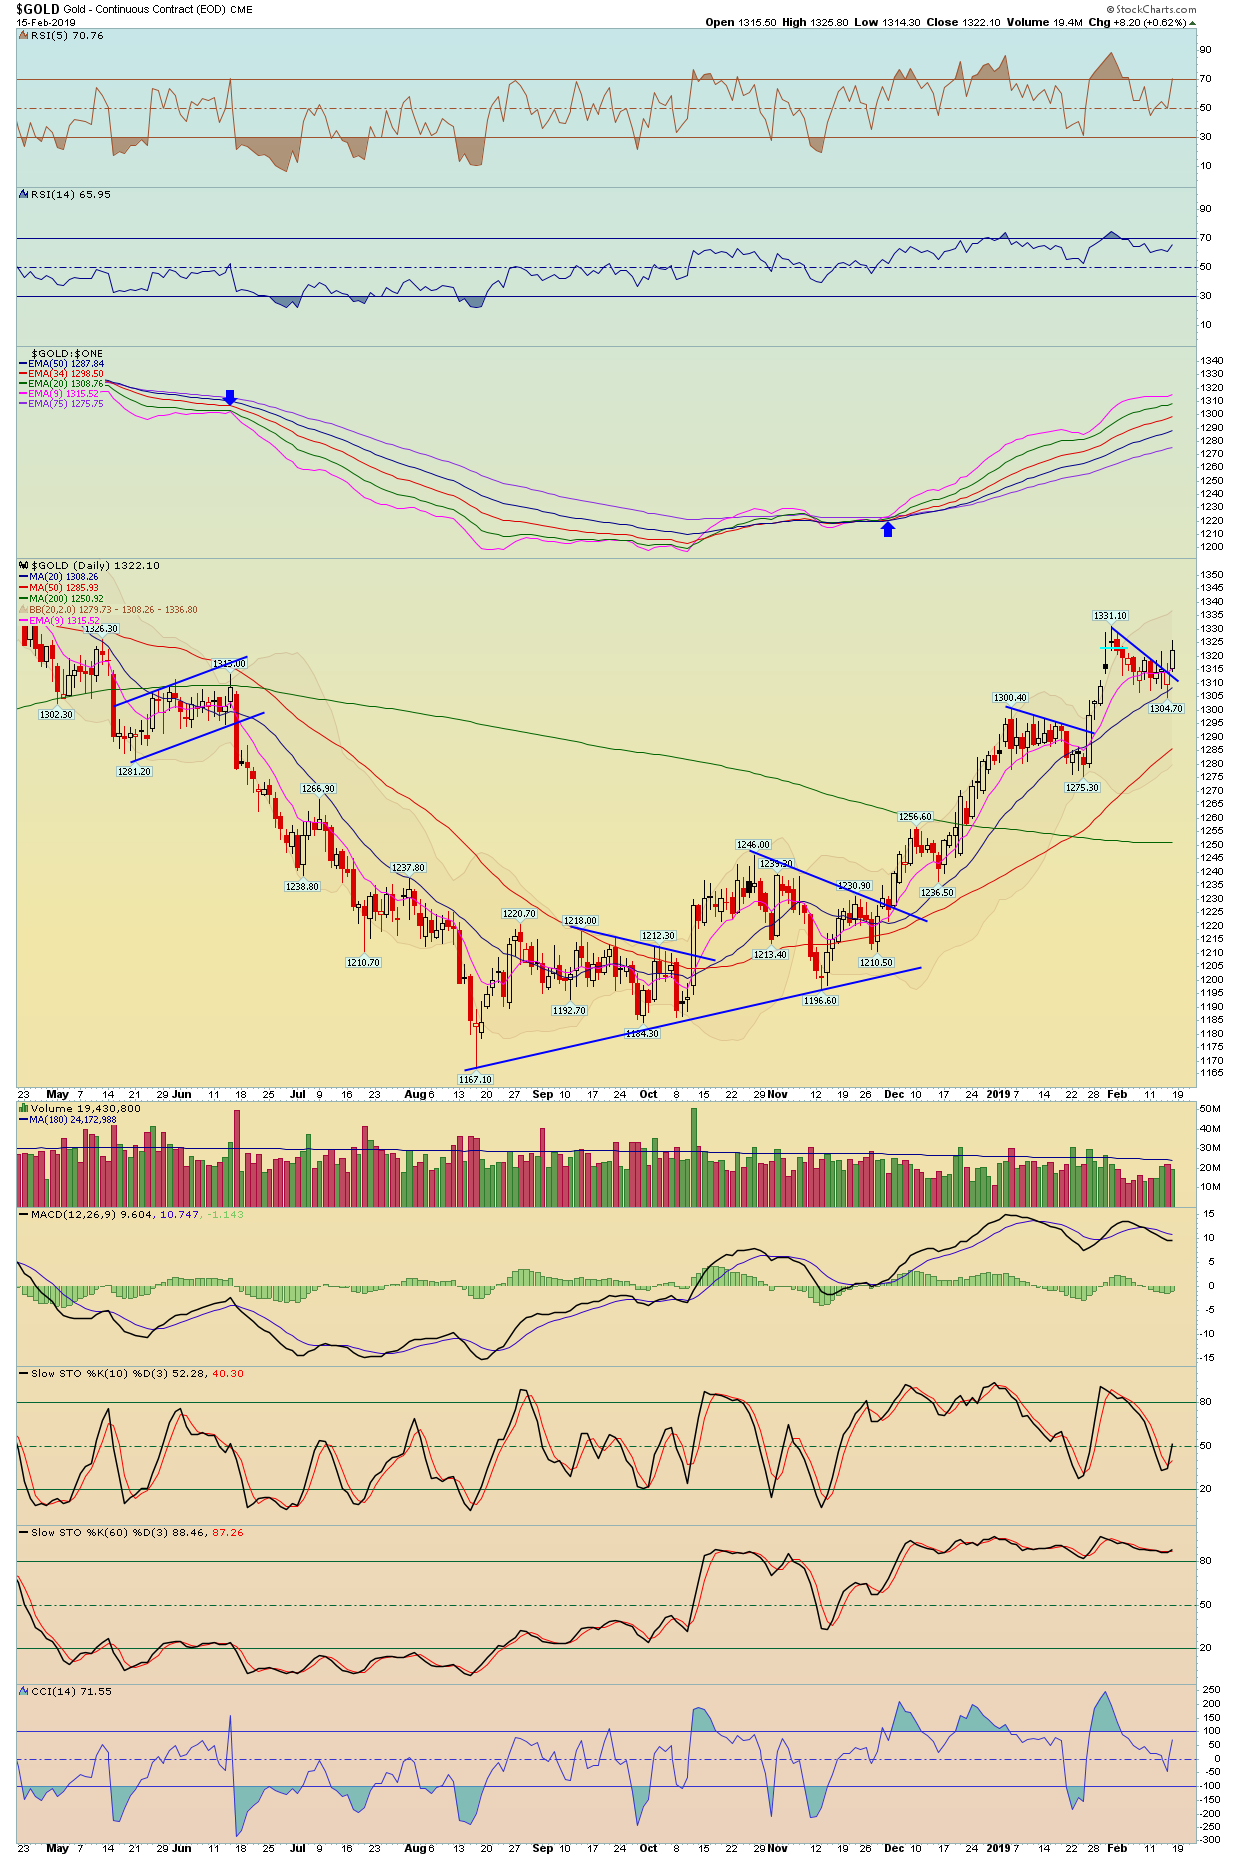
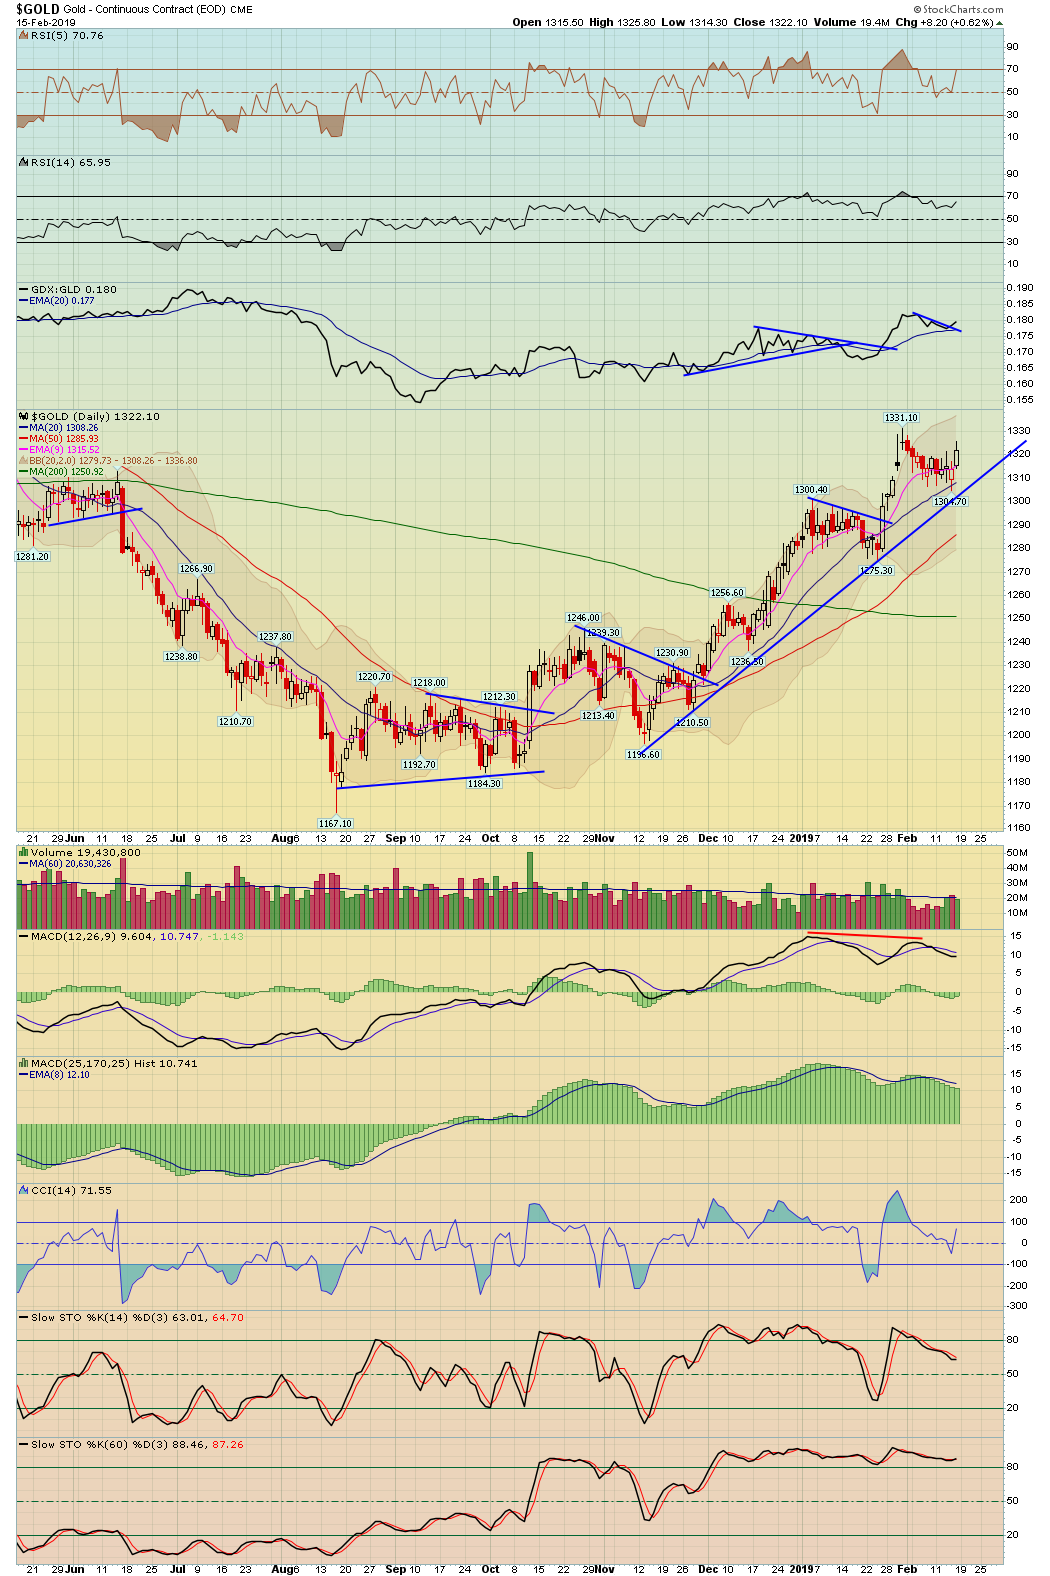
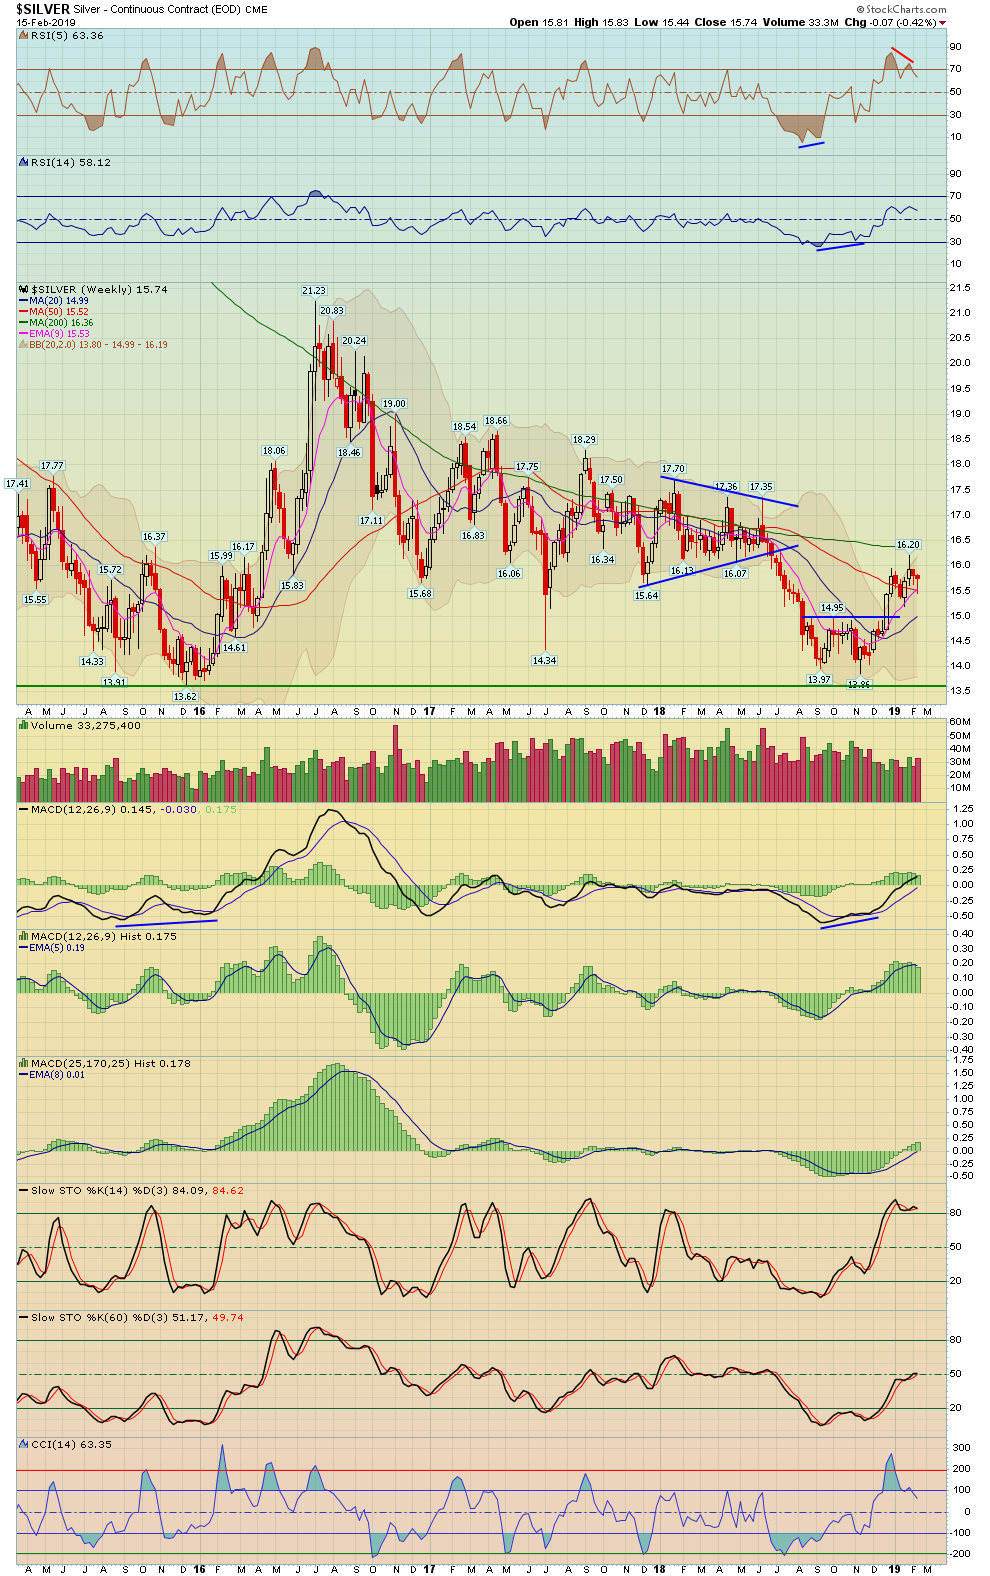
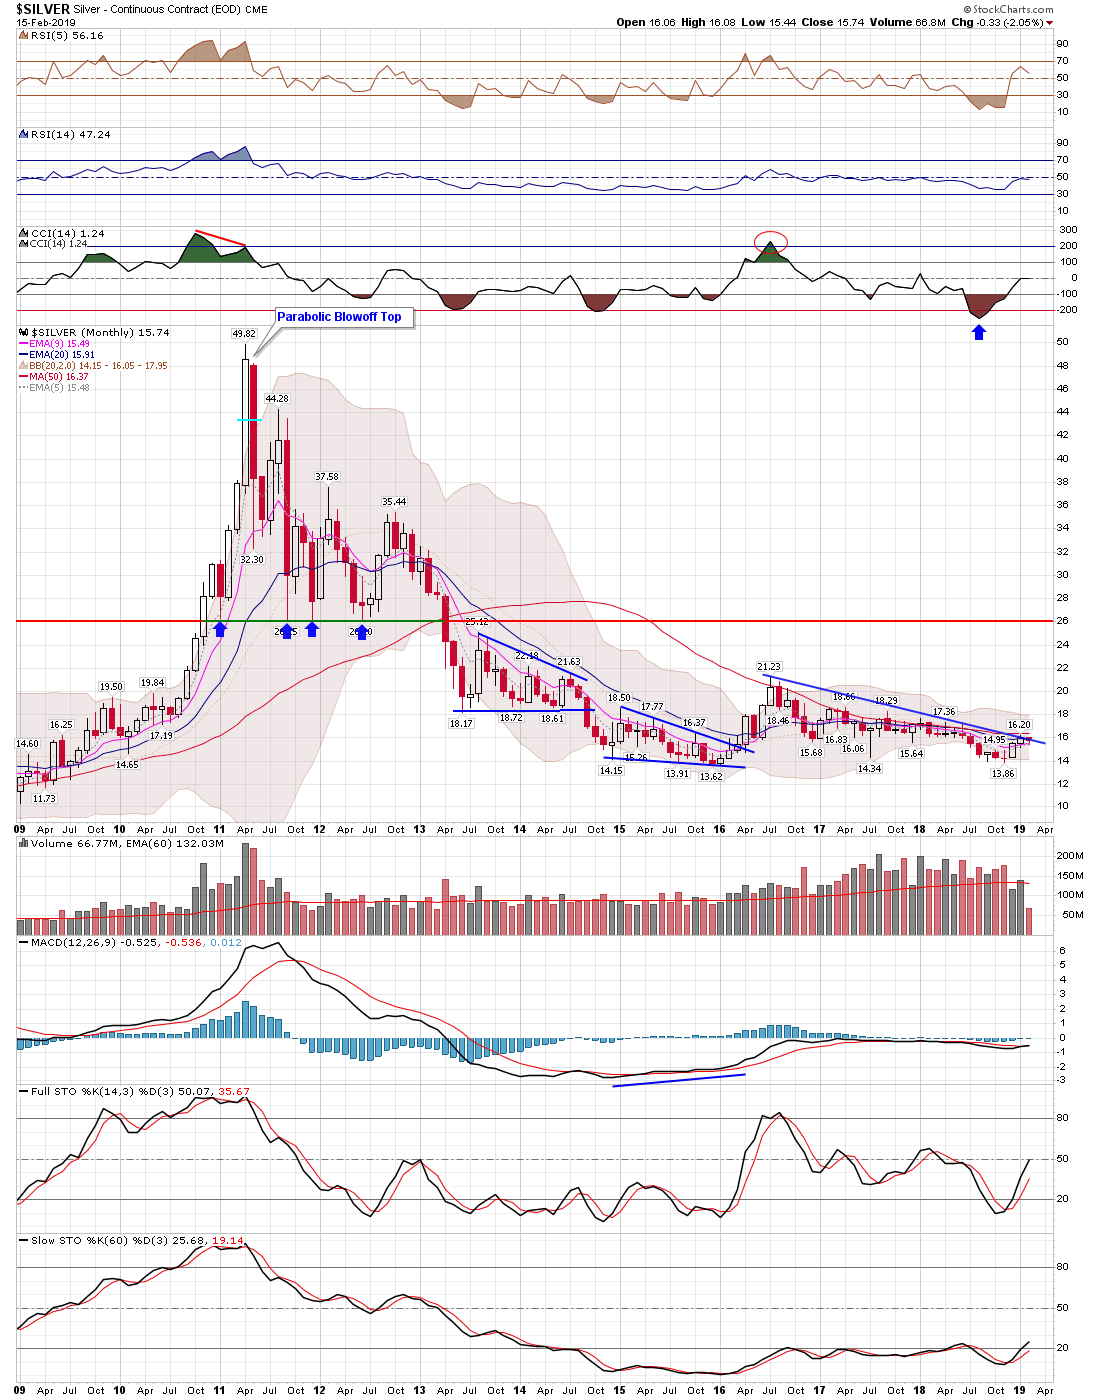
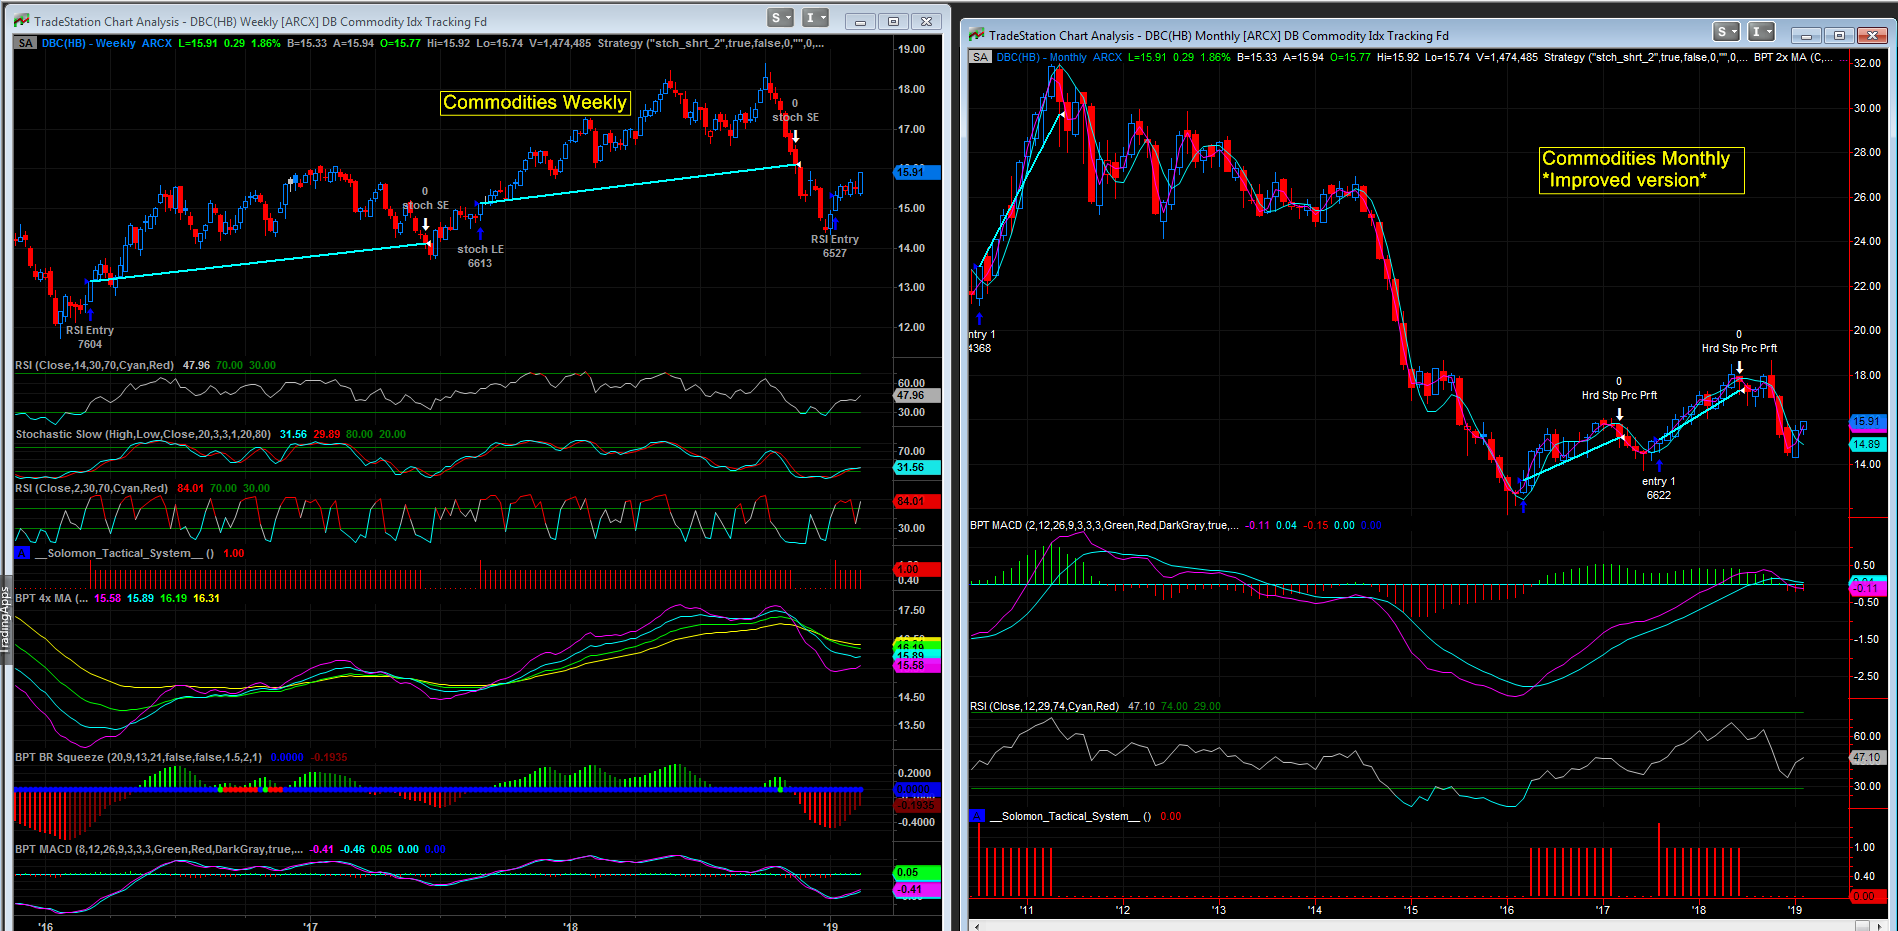
6. Commodities: Crude Oil, Natural Gas, Copper, Corn, US Dollar Precious Metals (Gold, Silver, Palladium, GDX, Gold Stocks)
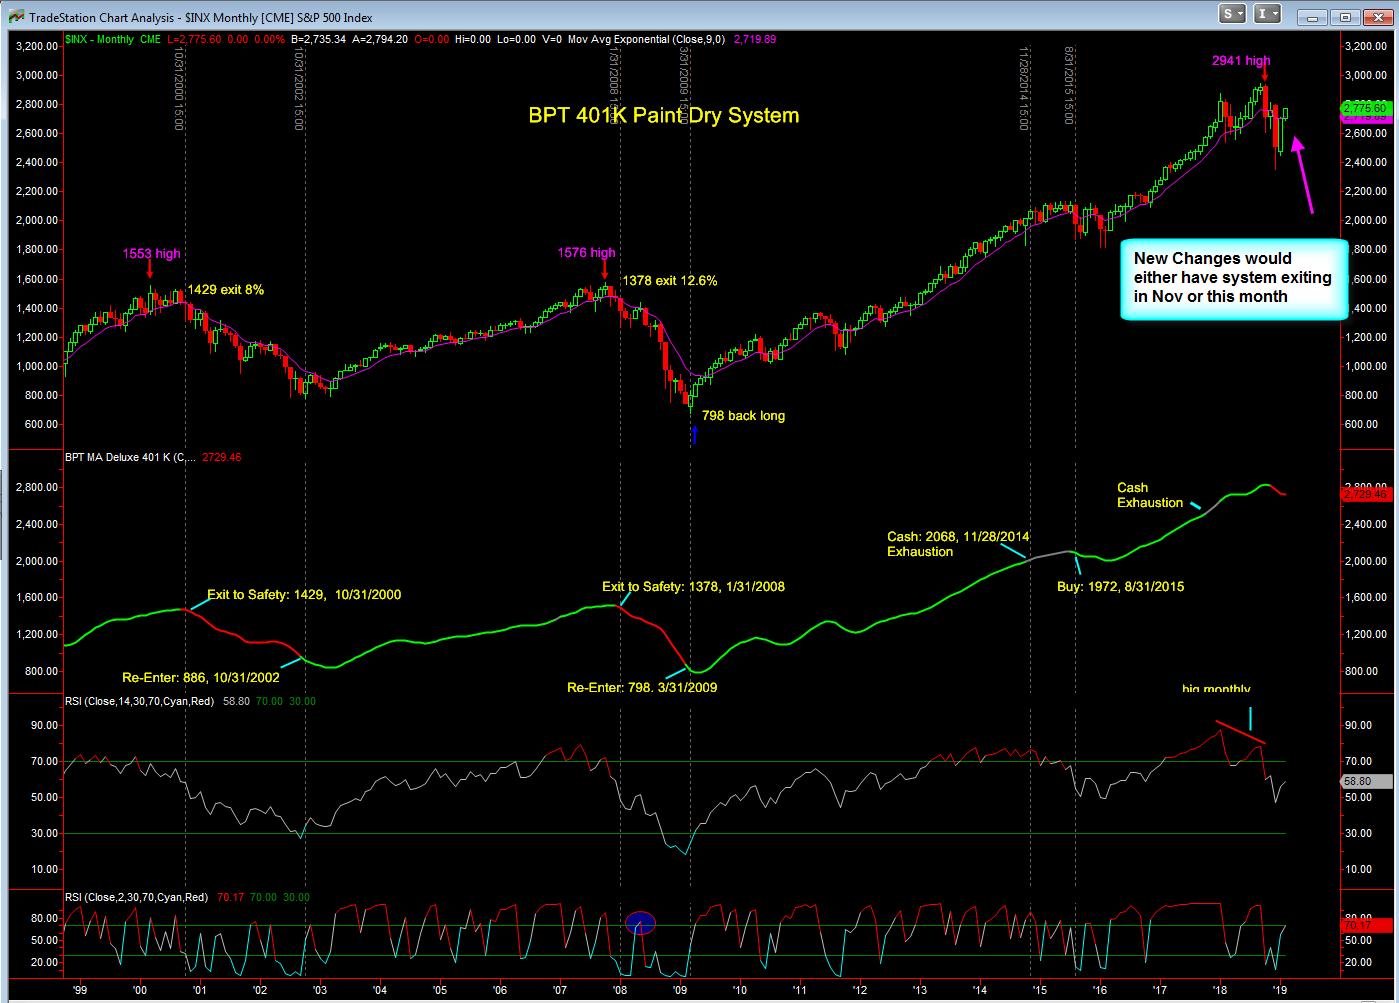
7. 401K System comments and changes
2
| Major Indexes | Index Symbol | ETF Symbol | % G / L Day | % G / L Week | Close |
|---|---|---|---|---|---|
| Dow Jones | INDU - W | DIA - W | 1.74% | 3.09% | 25,883.25 |
| S&P 500 | SPX - W | SPY - W | 1.09% | 2.50% | 2,775.60 |
| Wilshire 5000 | WLSH - W | 1.09% | 2.67% | 28,804.29 | |
| Nasdaq | COMPQ - W | 0.61% | 2.39% | 7,472.41 | |
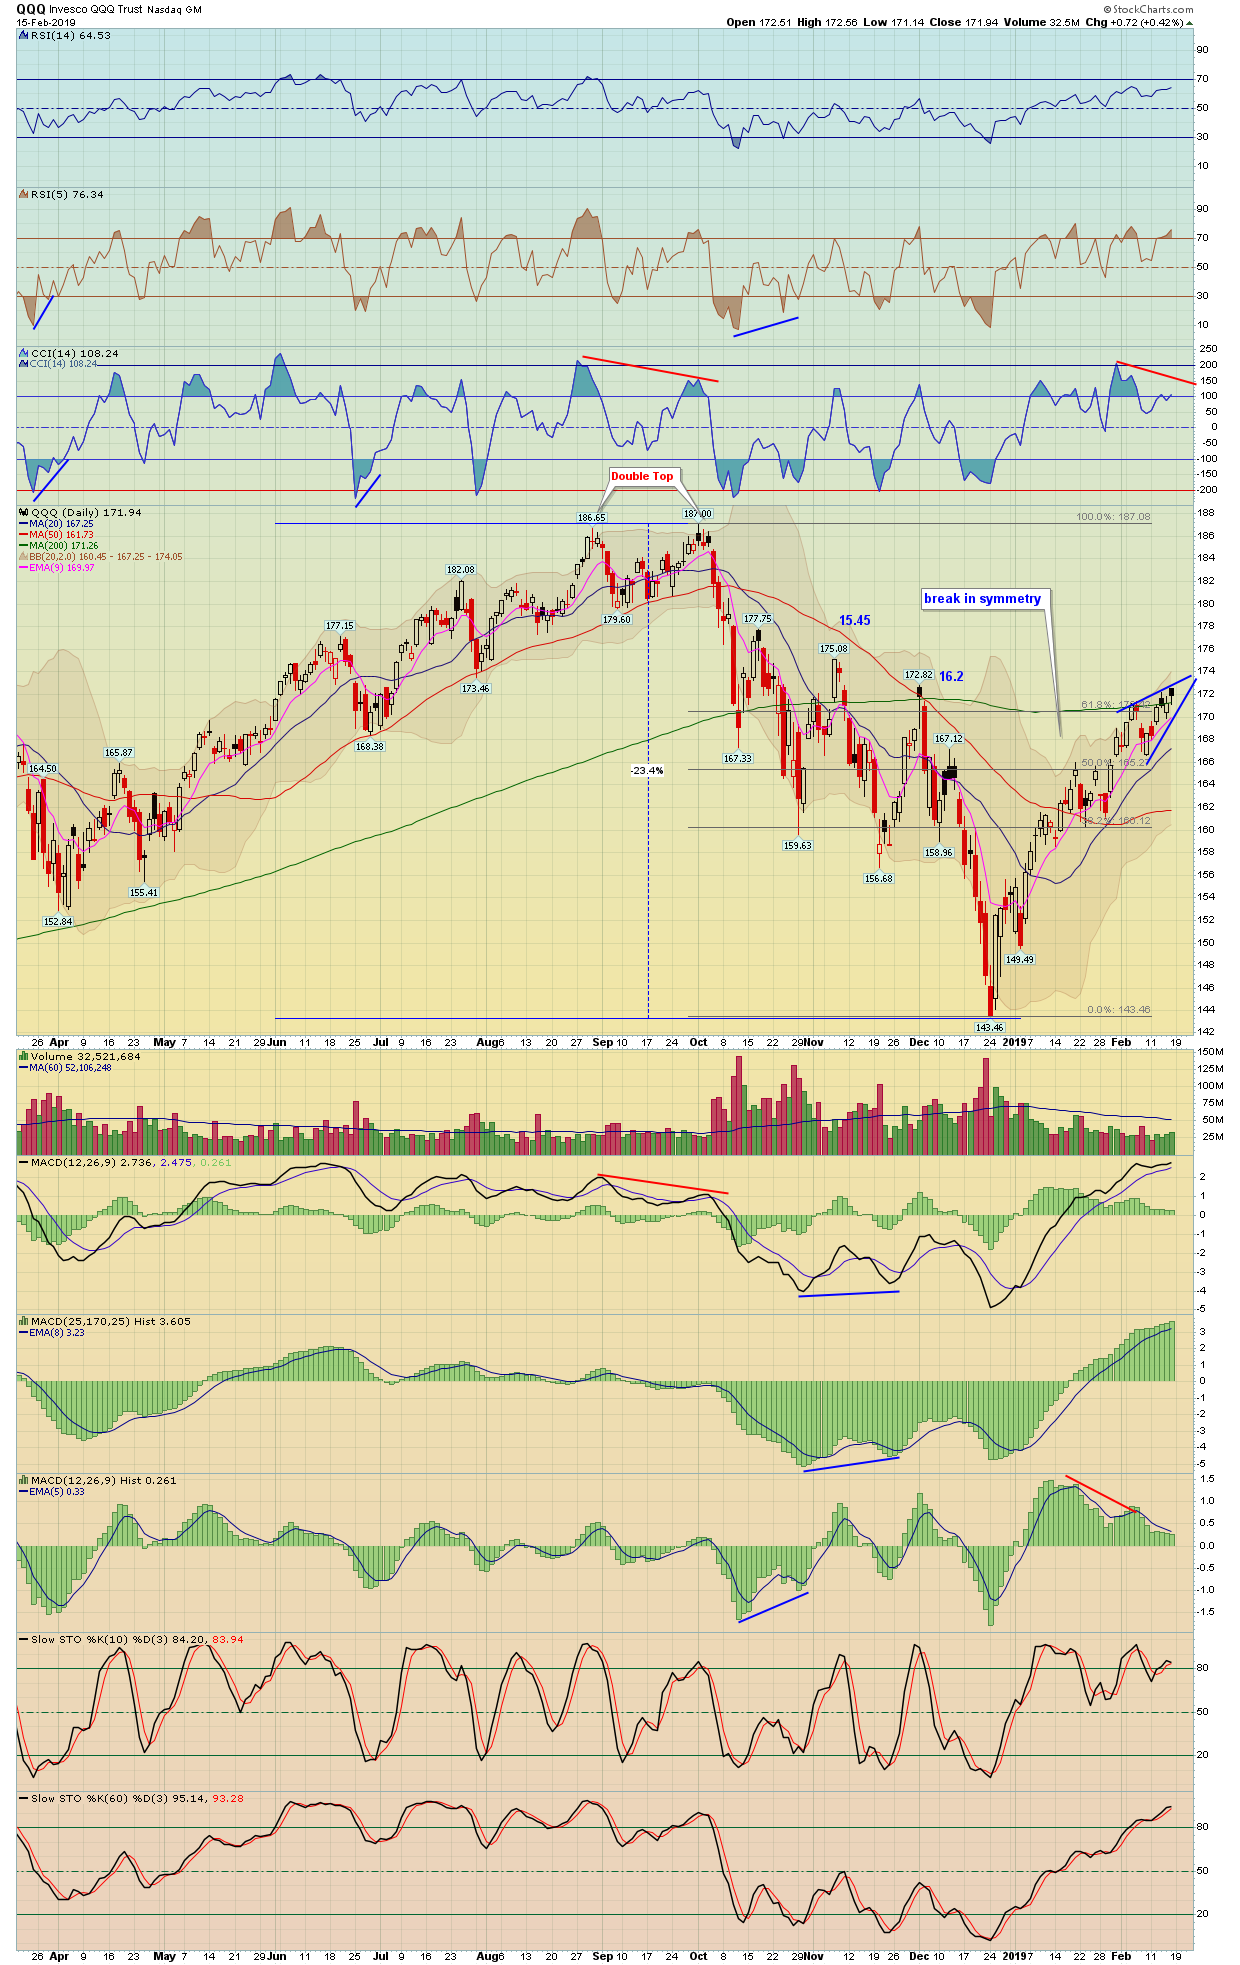
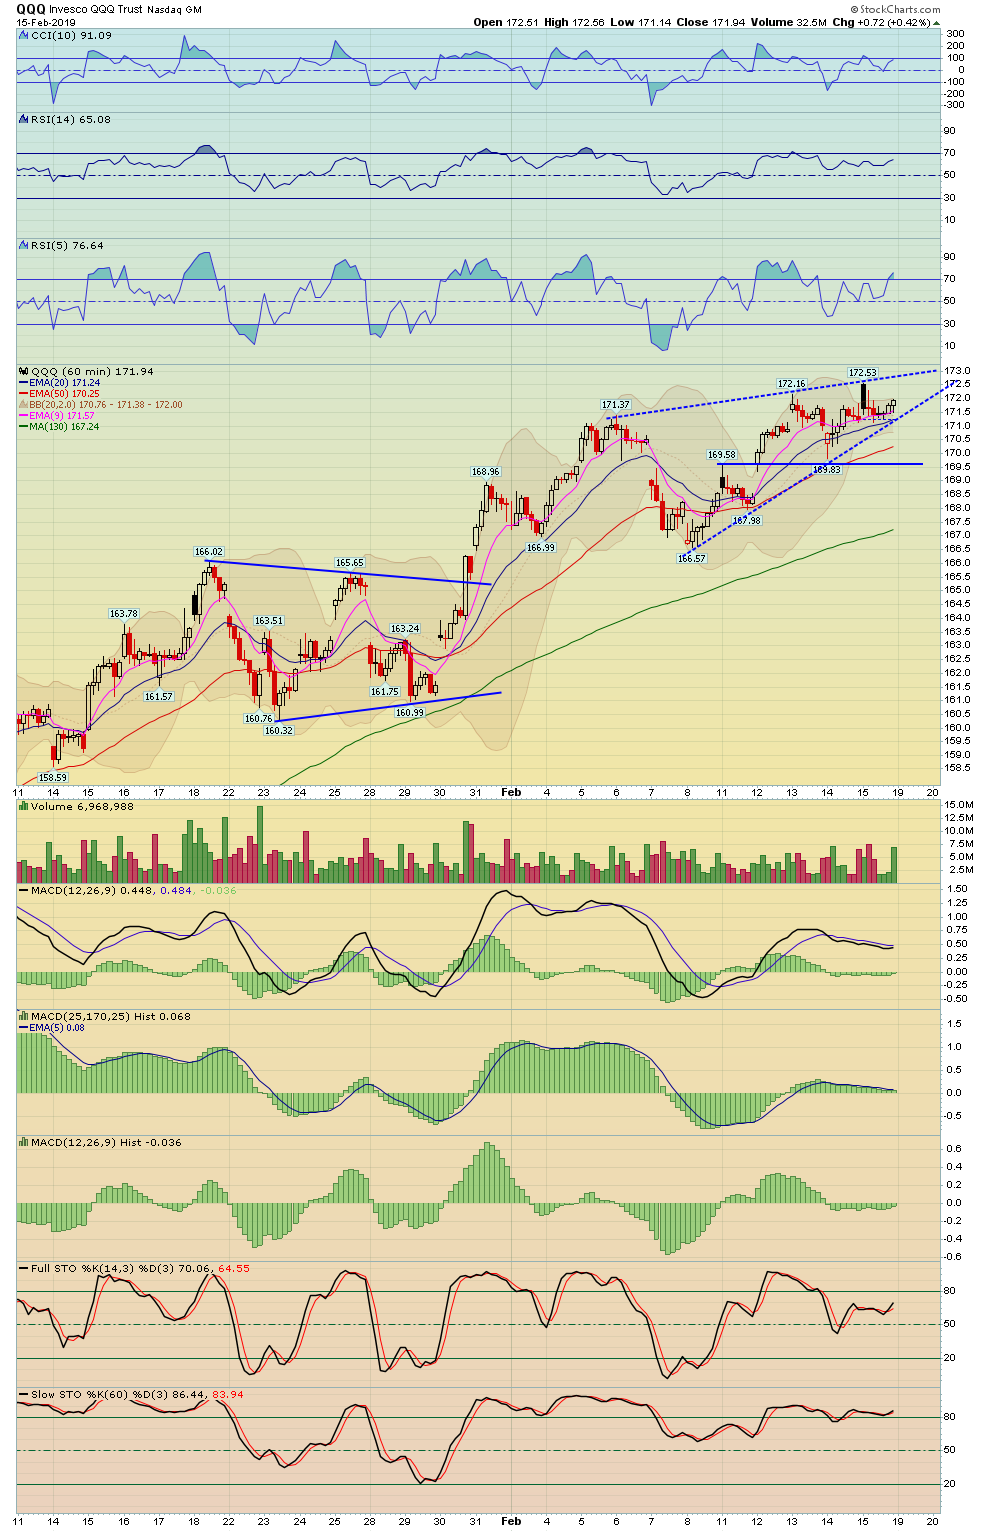
| NDX 100 | NDX - W | QQQ - W | 0.47% | 2.05% | 7,055.18 |
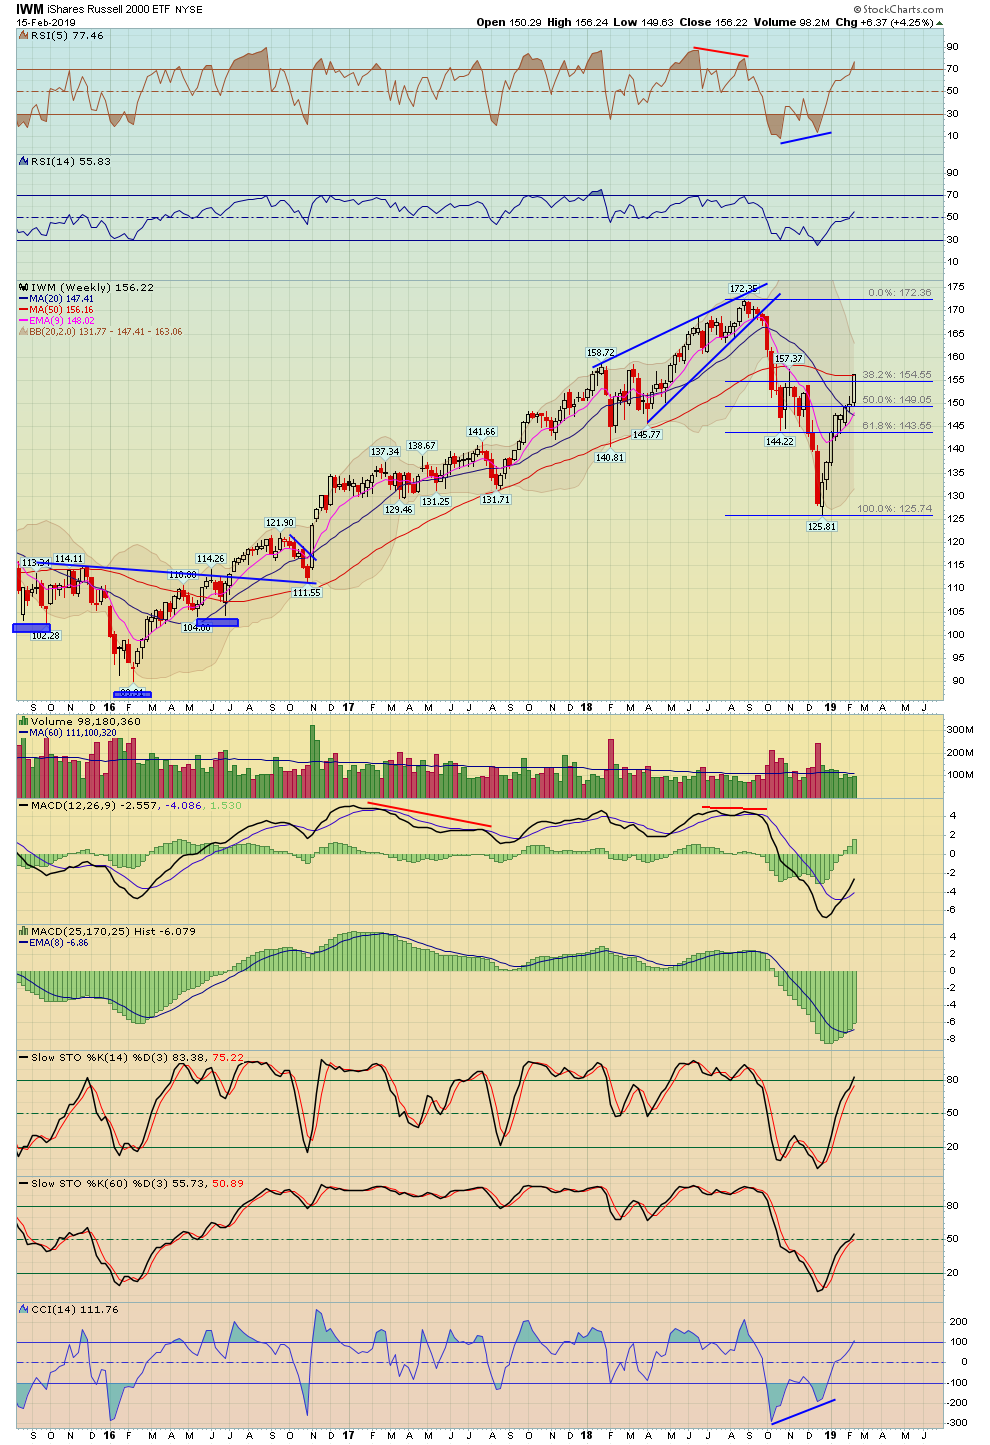
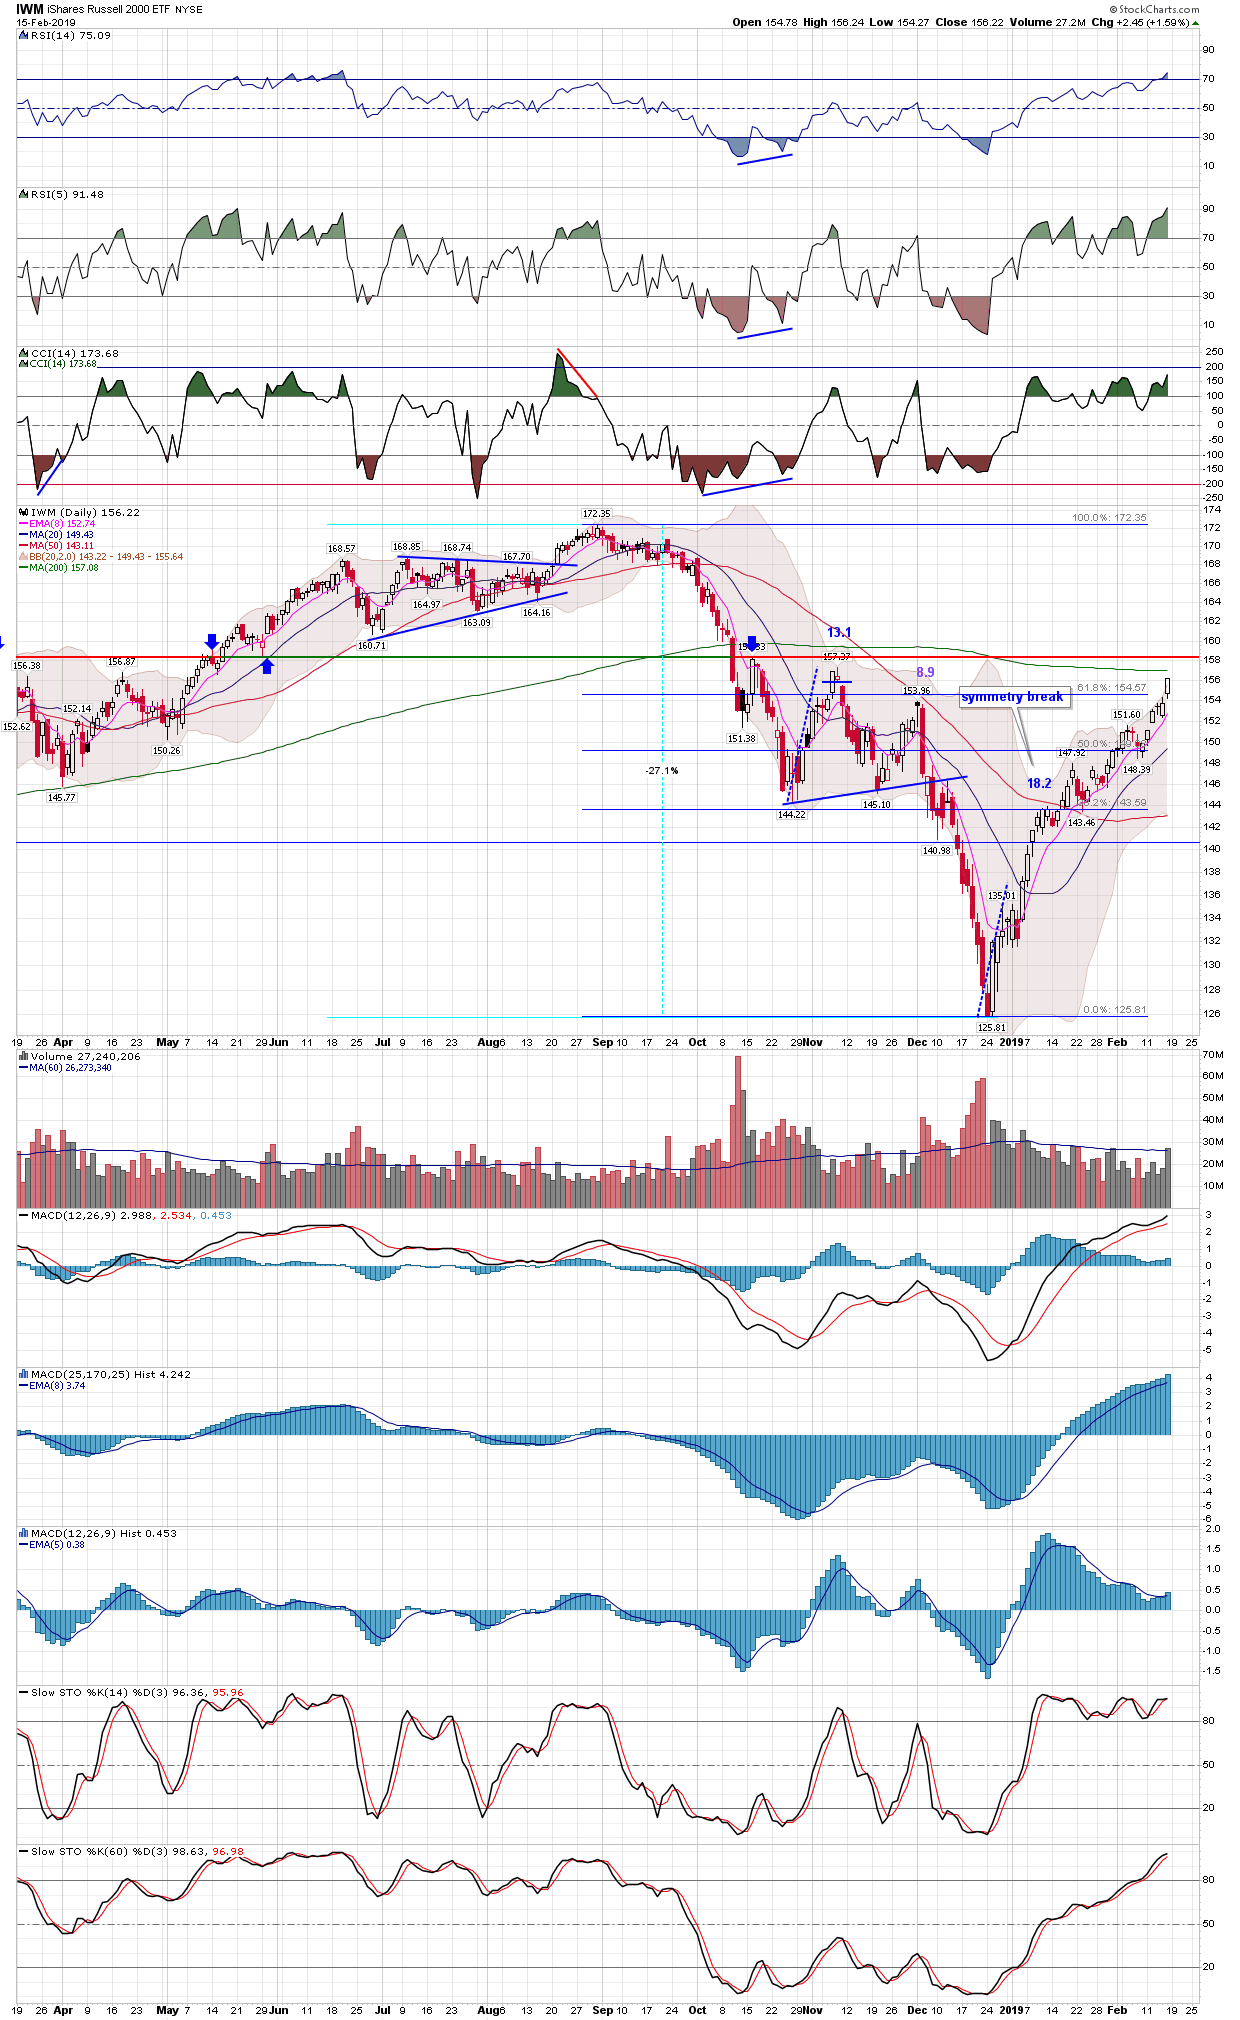
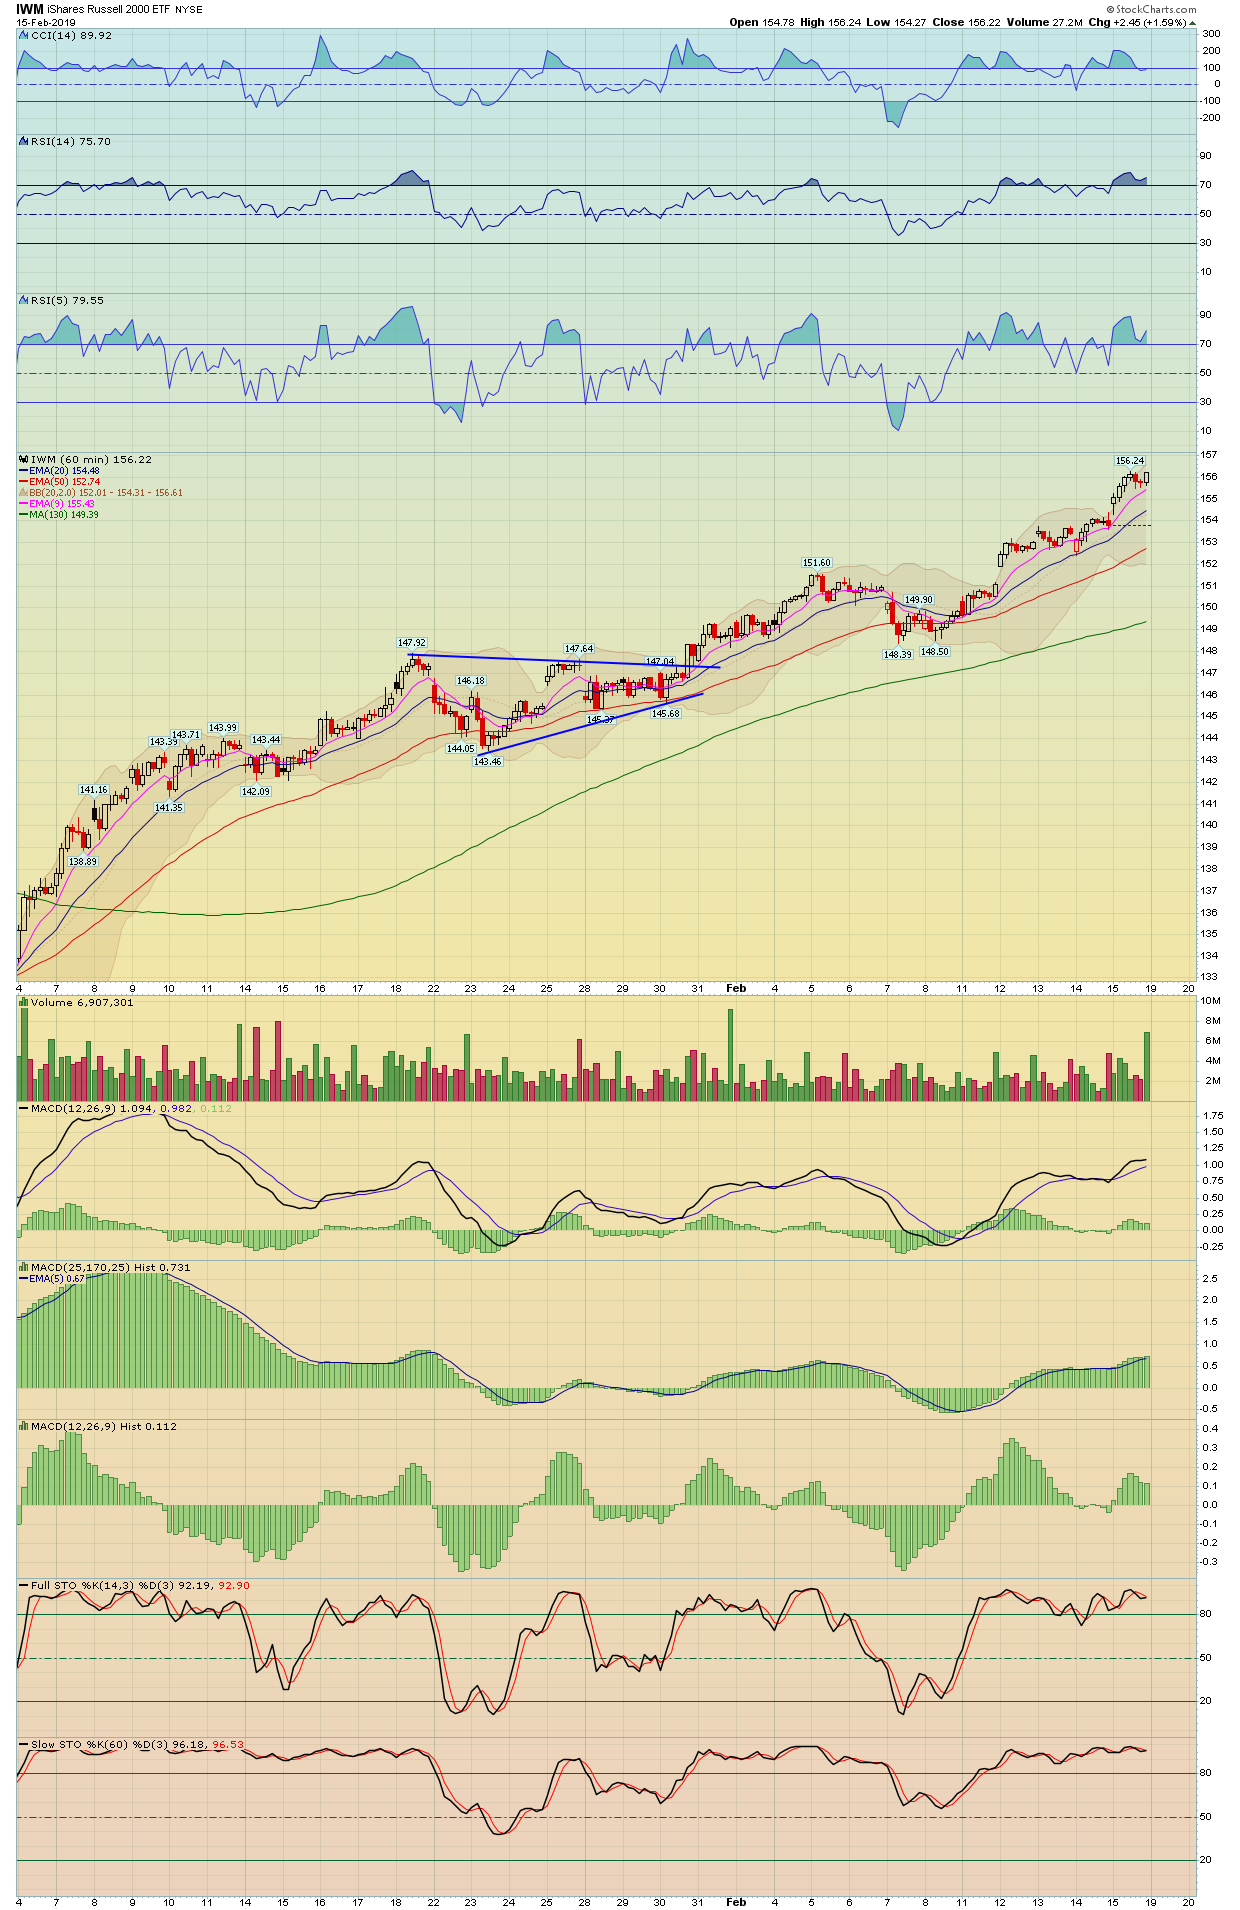
| Russel 2000 (Small Caps) | RUT - W | IWM - W | 1.56% | 4.17% | 1,569.25 |
| Market Sectors | Index Symbol | ETF Symbol | % G / L Day | % G / L Week | Close |
|---|---|---|---|---|---|
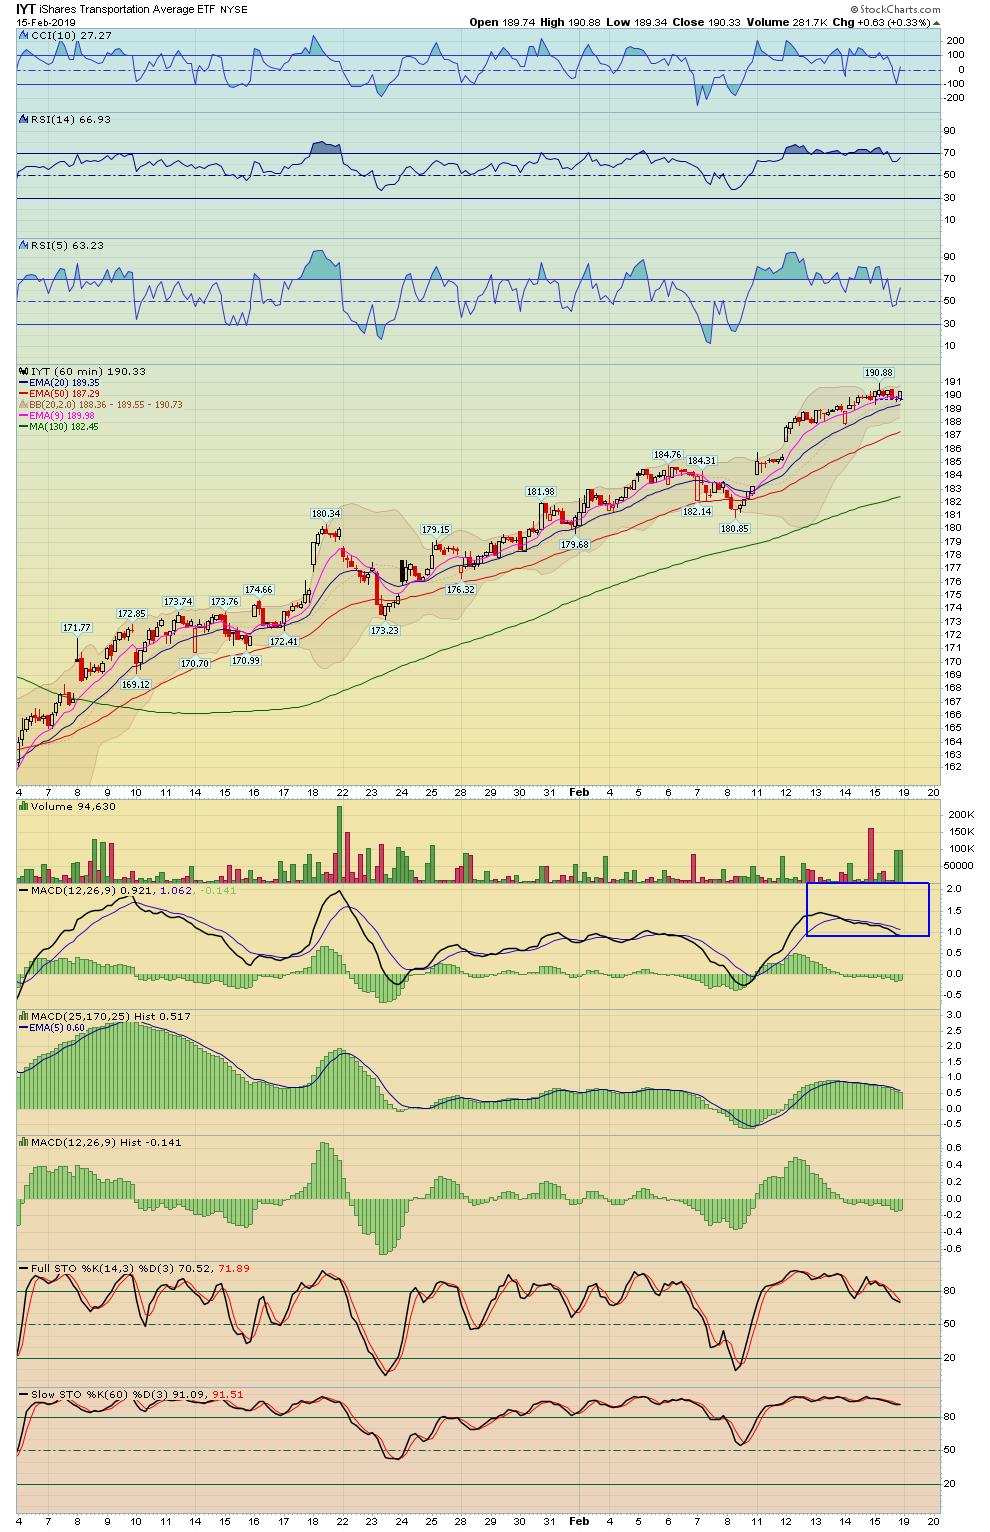
| Transports | TRAN - W | IYT - W | 0.29% | 3.84% | 10,567.69 |
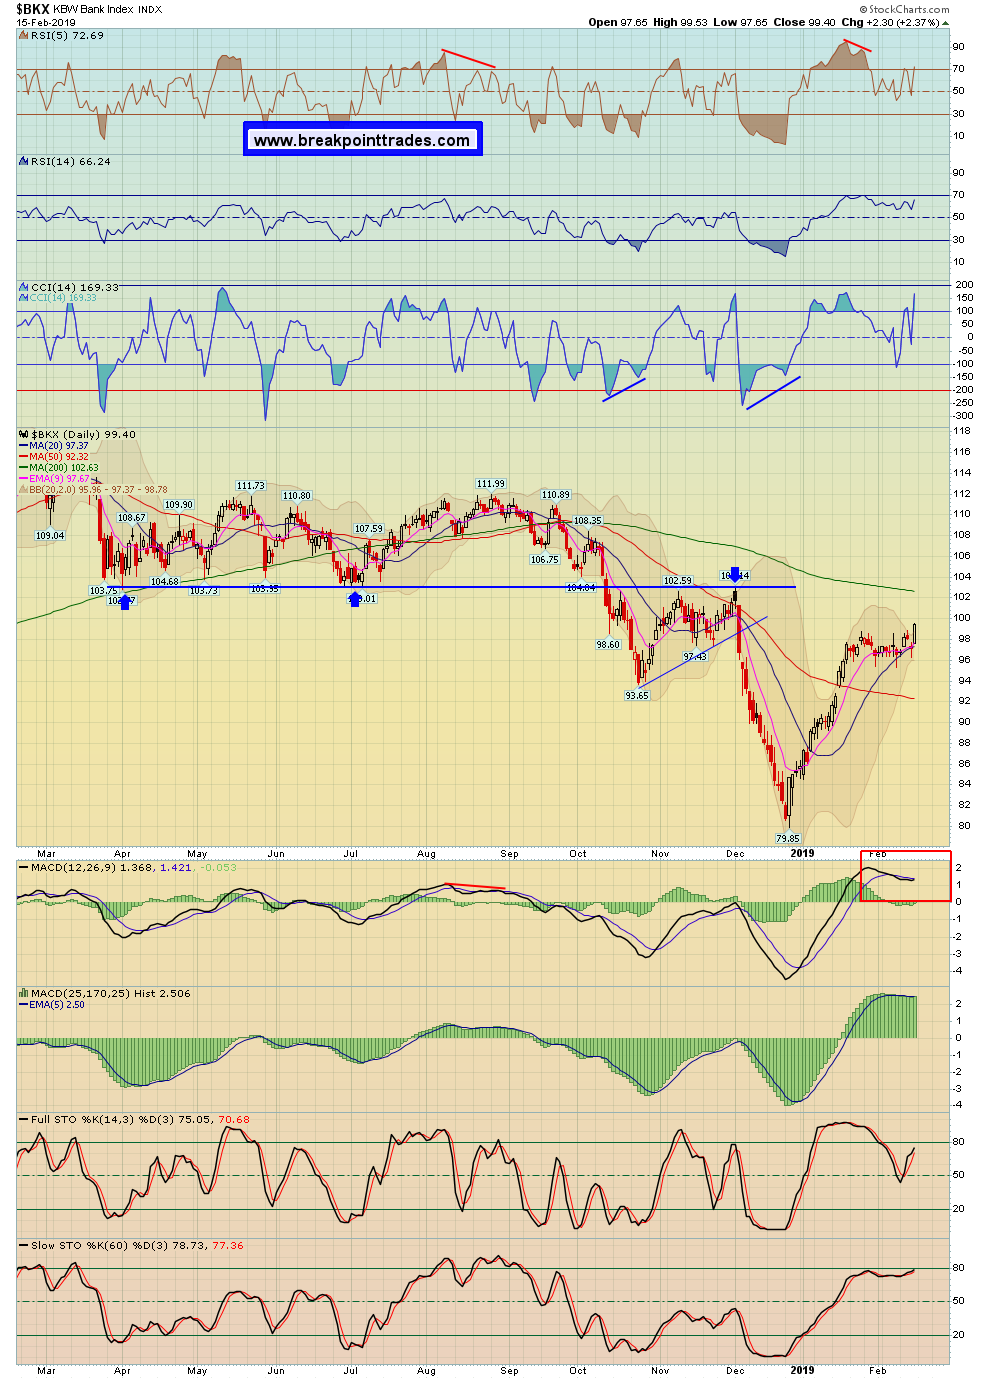
| Banks | BKX - W | 2.37% | 3.00% | 99.40 | |
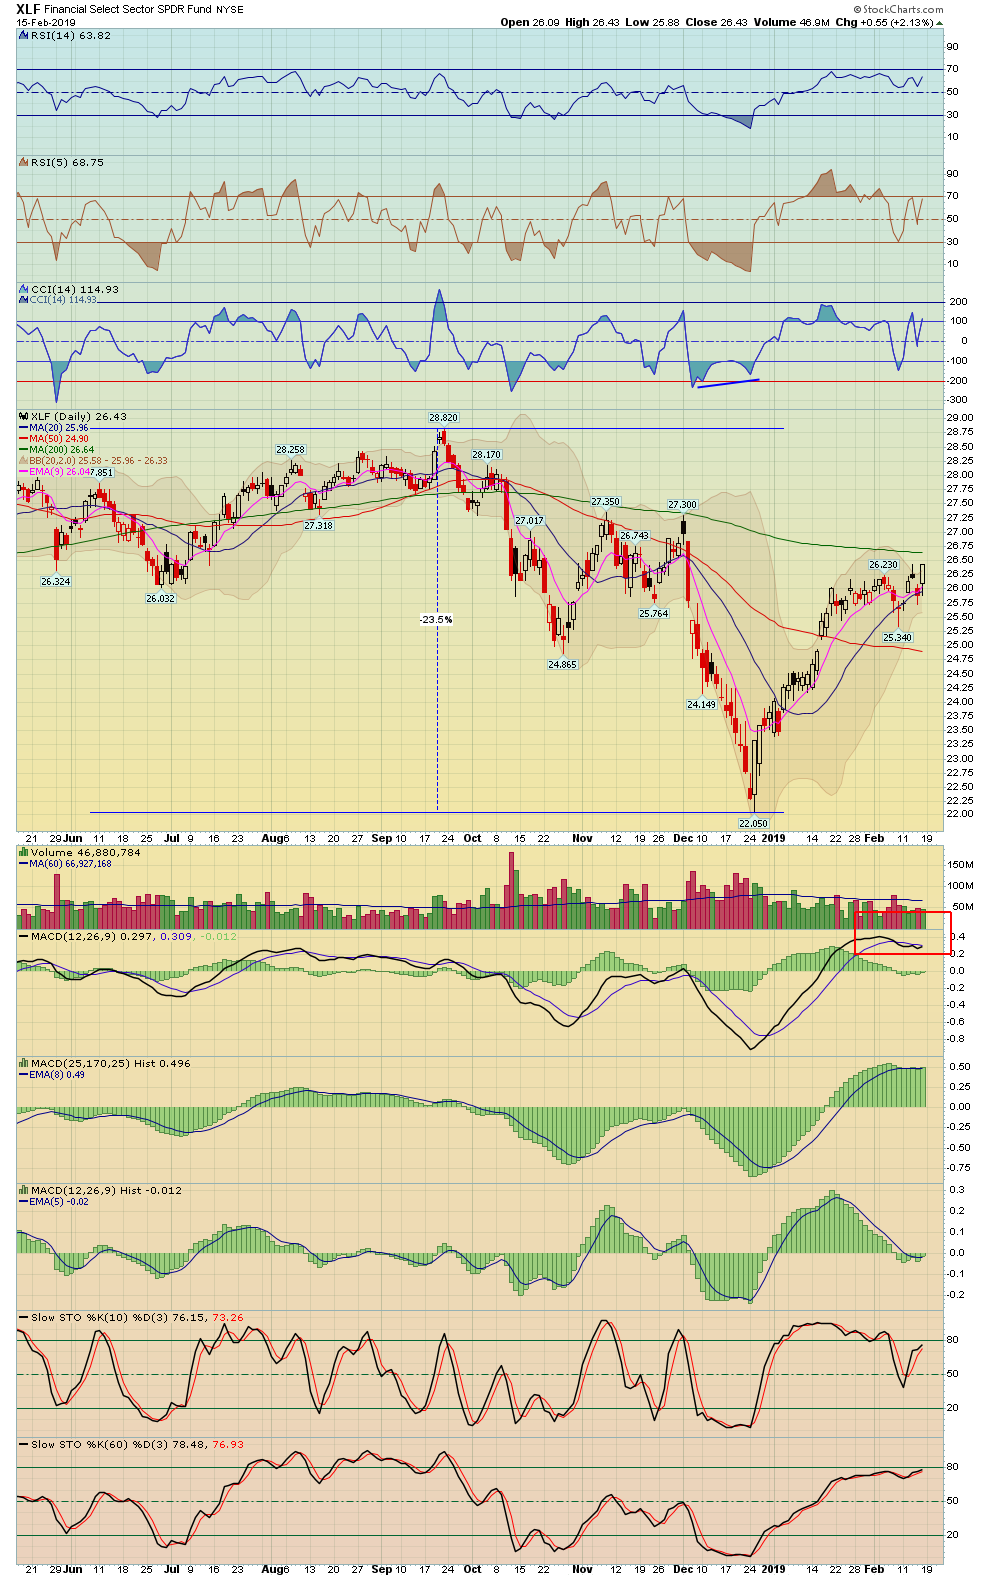
| Financials | XLF - W | 2.13% | 2.96% | 26.43 | |
| Brokers | XBD - W | 1.52% | 2.78% | 266.16 | |
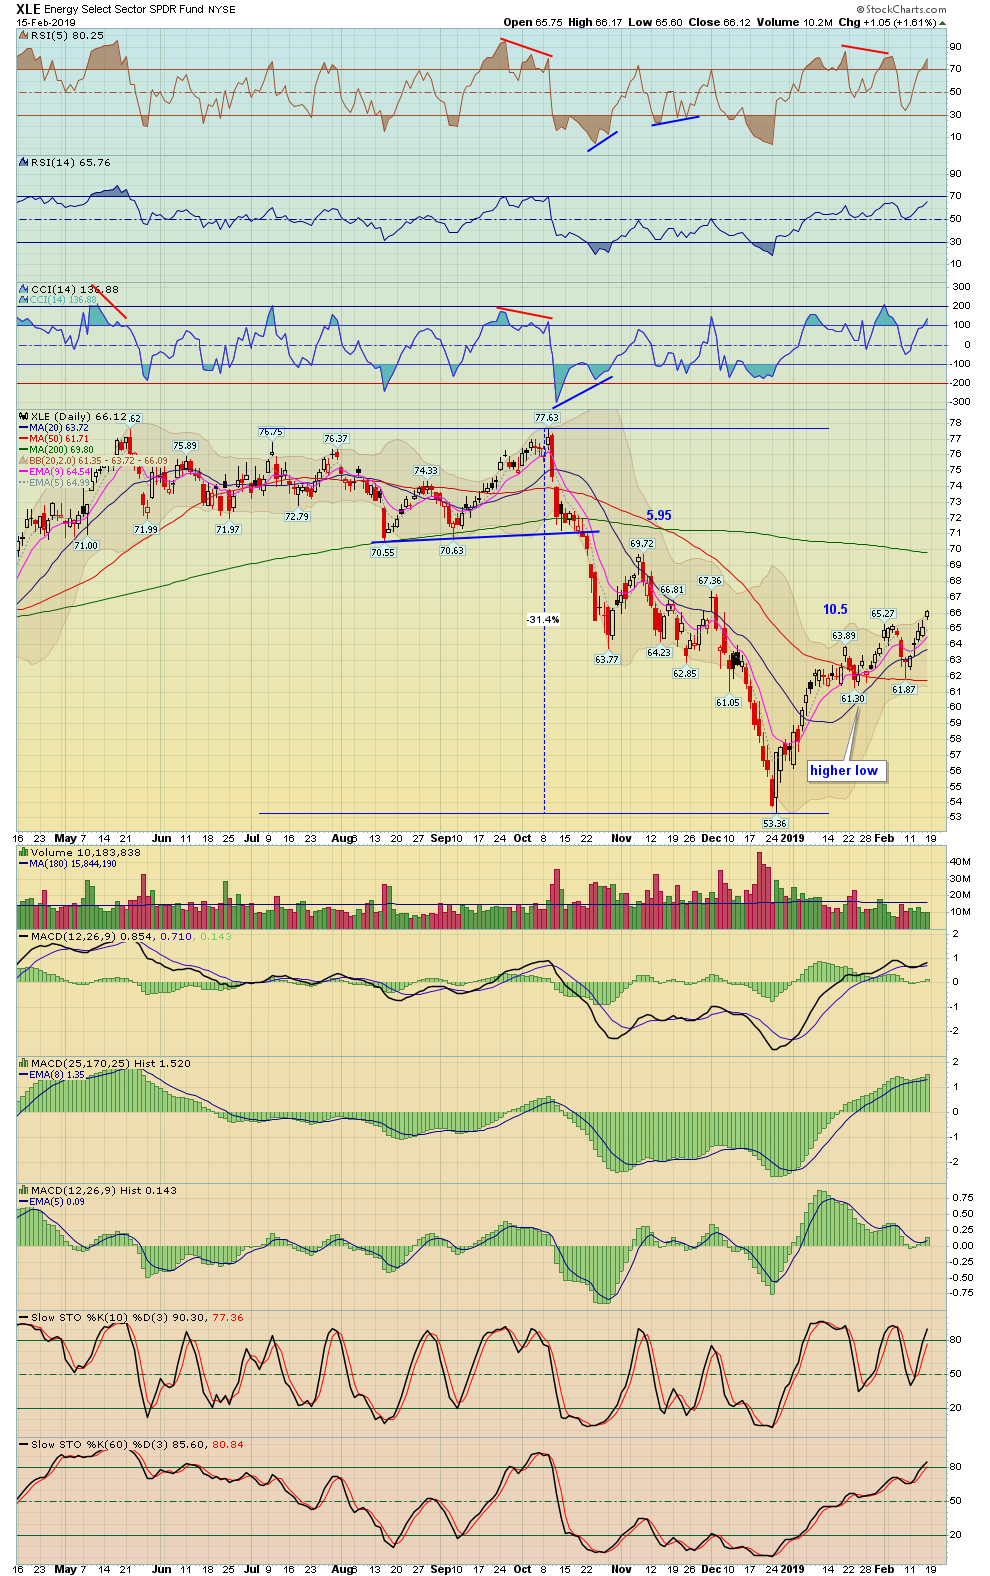
| XLE (Energy Select) | XLE - W | 1.61% | 5.05% | 66.12 | |
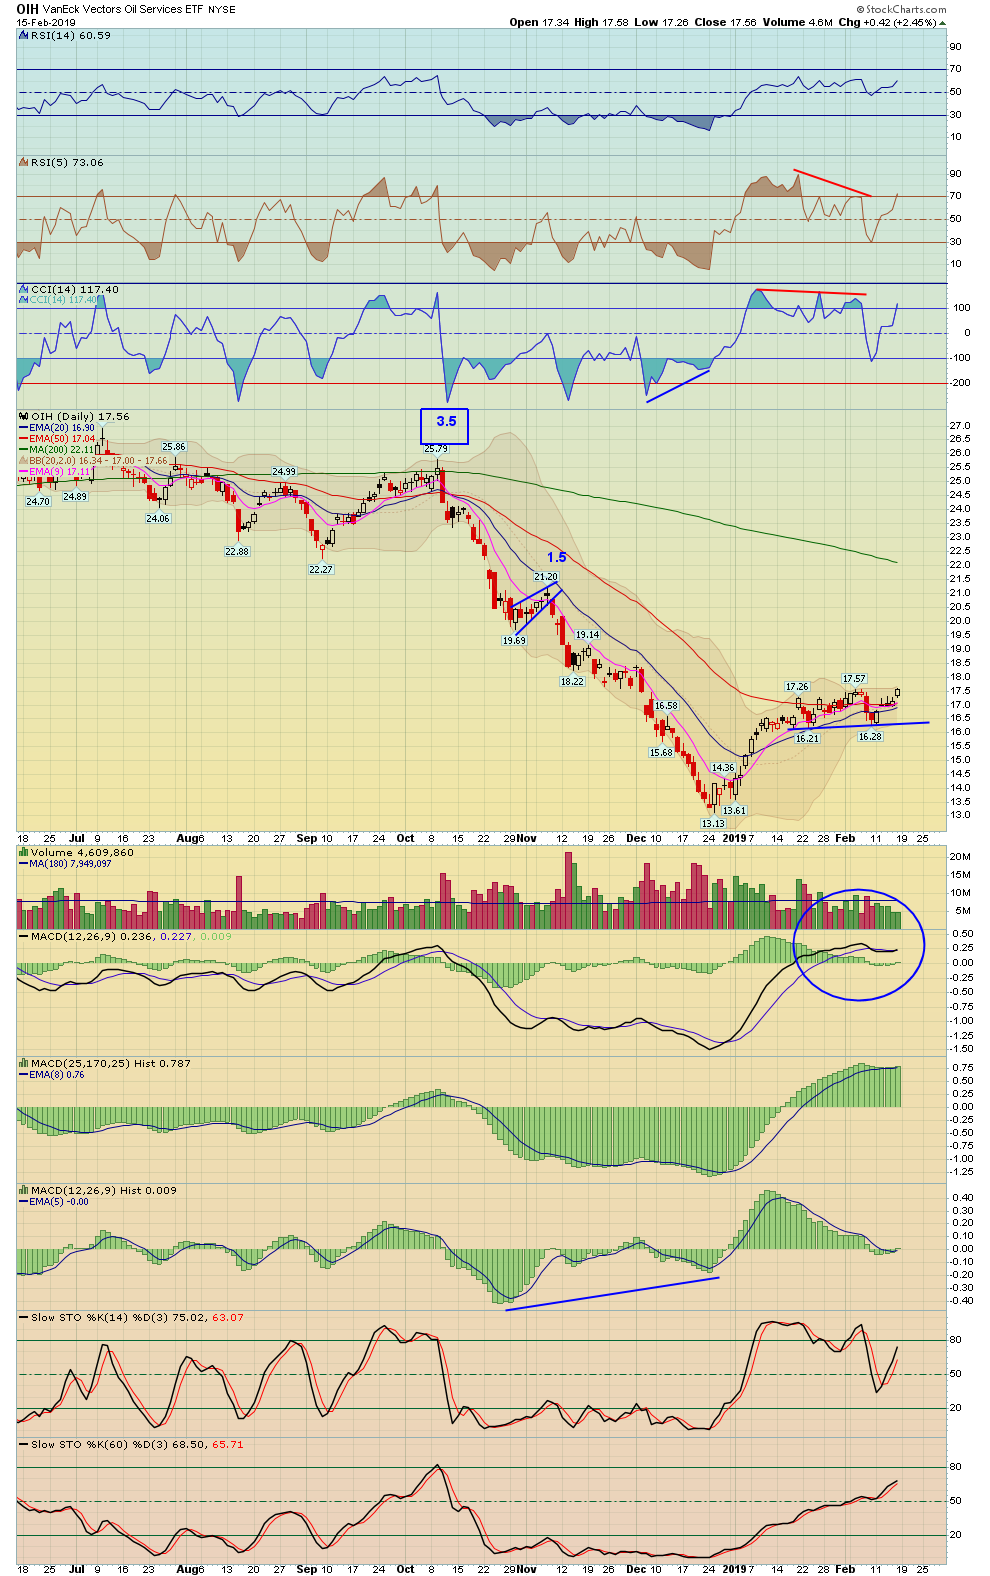
| Oil Service Holders | OIH - W | 2.45% | 6.49% | 17.56 | |
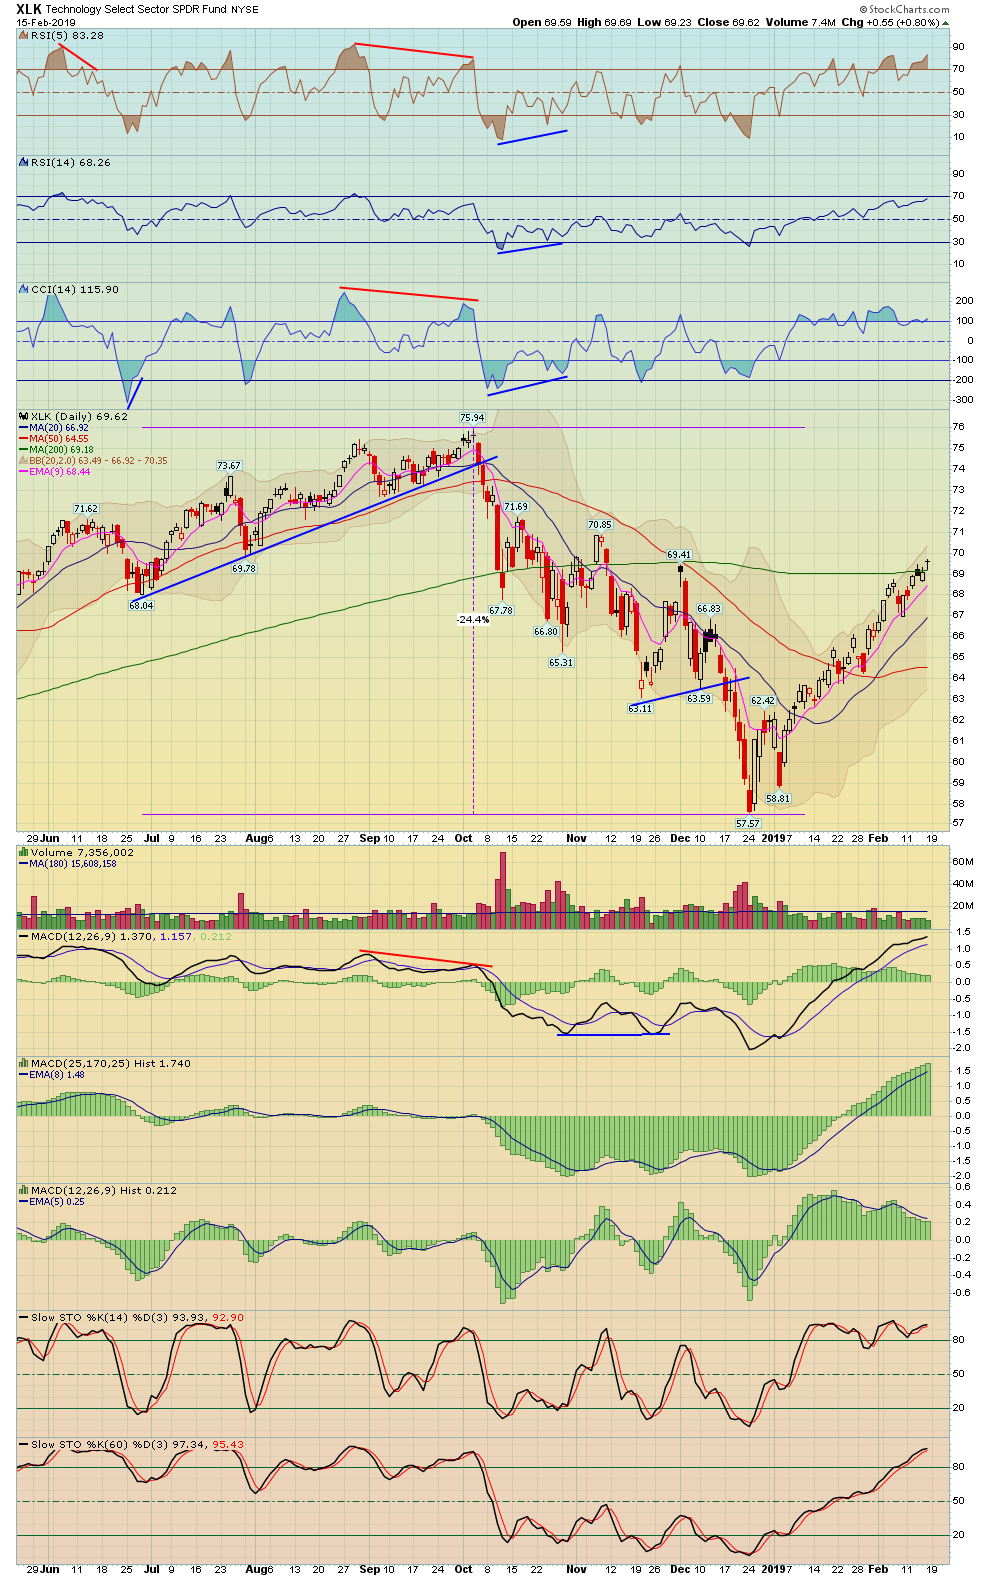
| Technology | XLK - W | 0.80% | 2.40% | 69.62 | |
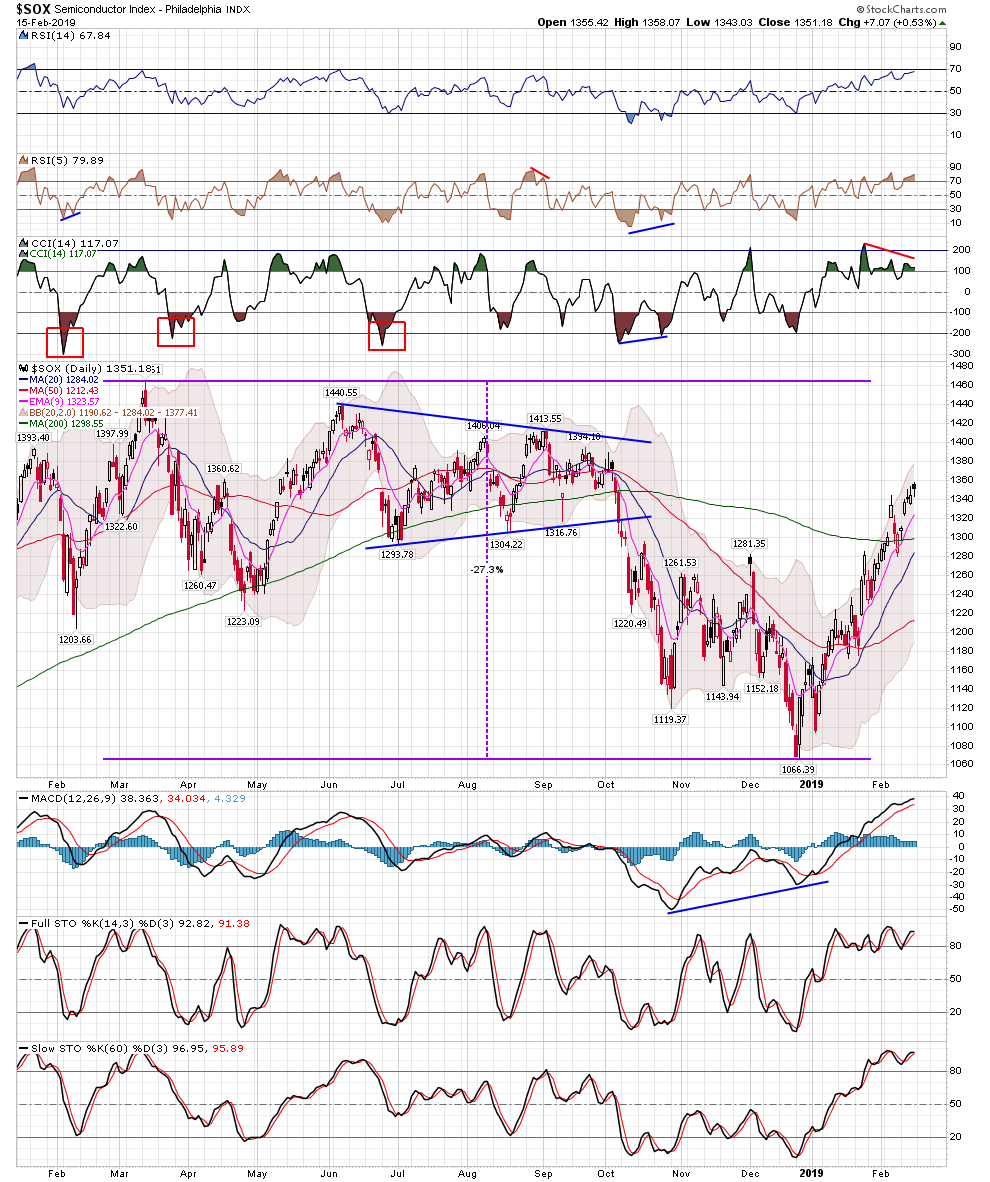
| Semiconductor | SOX - W | SMH - W | 0.53% | 3.74% | 1,351.18 |
| Communication Services | XLC - W | 0.43% | 0.98% | 46.18 | |
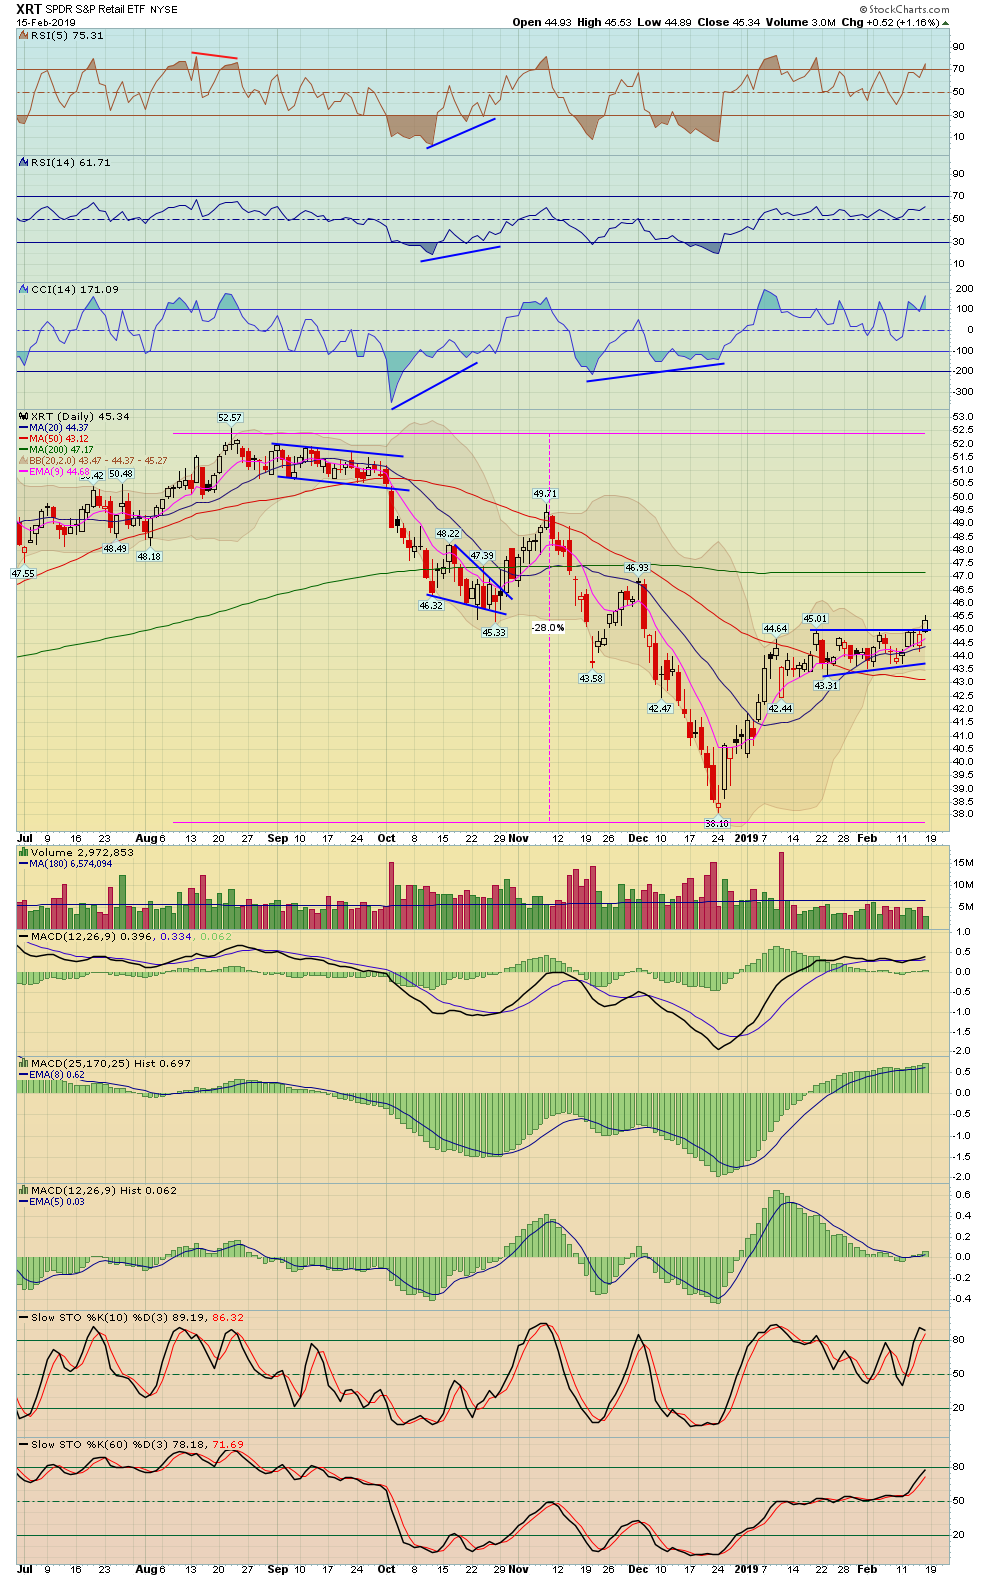
| Retail | XRT - W | 1.16% | 3.23% | 45.34 | |
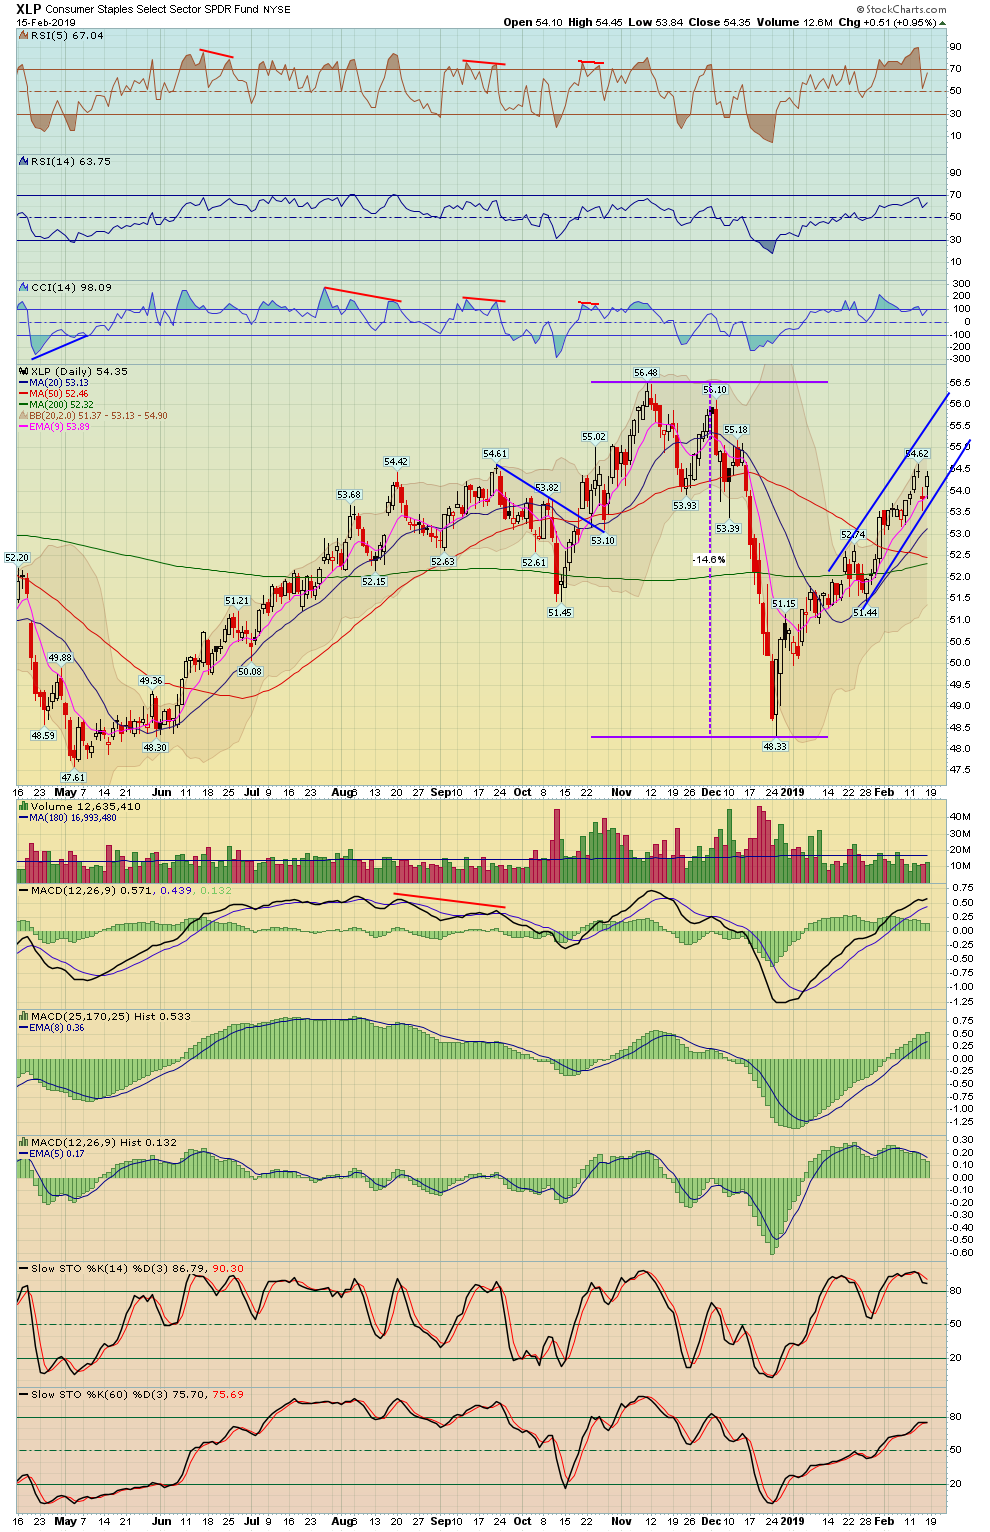
| Consumer Staples | XLP - W | 0.95% | 1.04% | 54.35 | |
| Consumer Discretionary | XLY - W | 0.69% | 2.73% | 110.06 | |
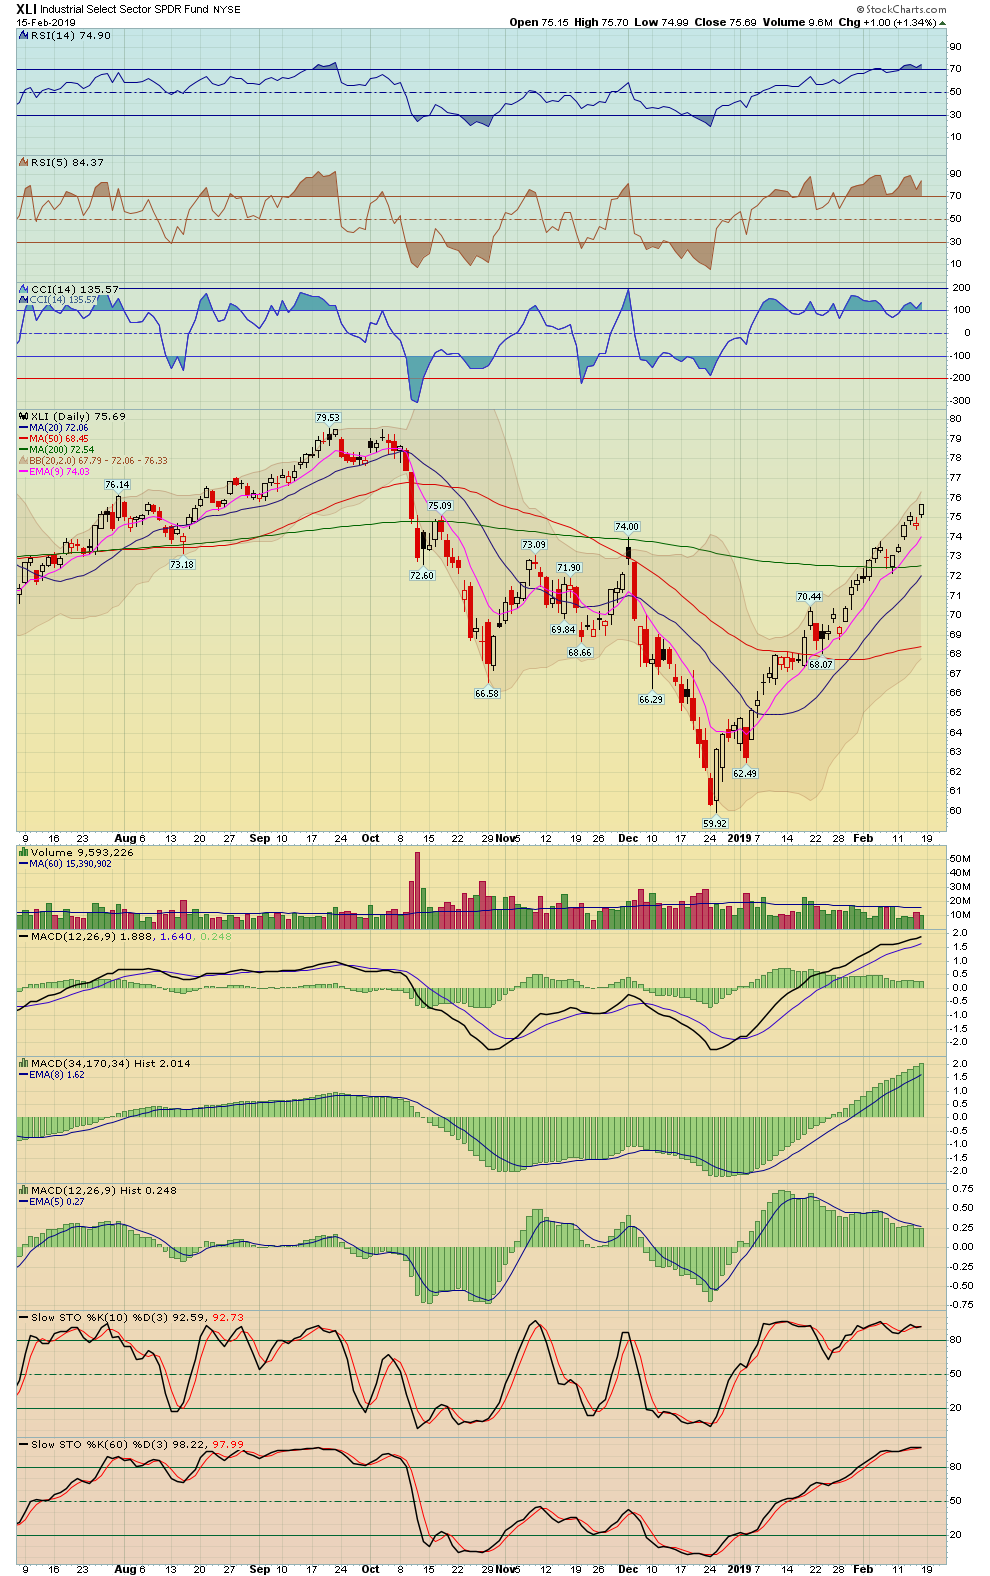
| Industrials | XLI - W | 1.34% | 3.59% | 75.69 | |
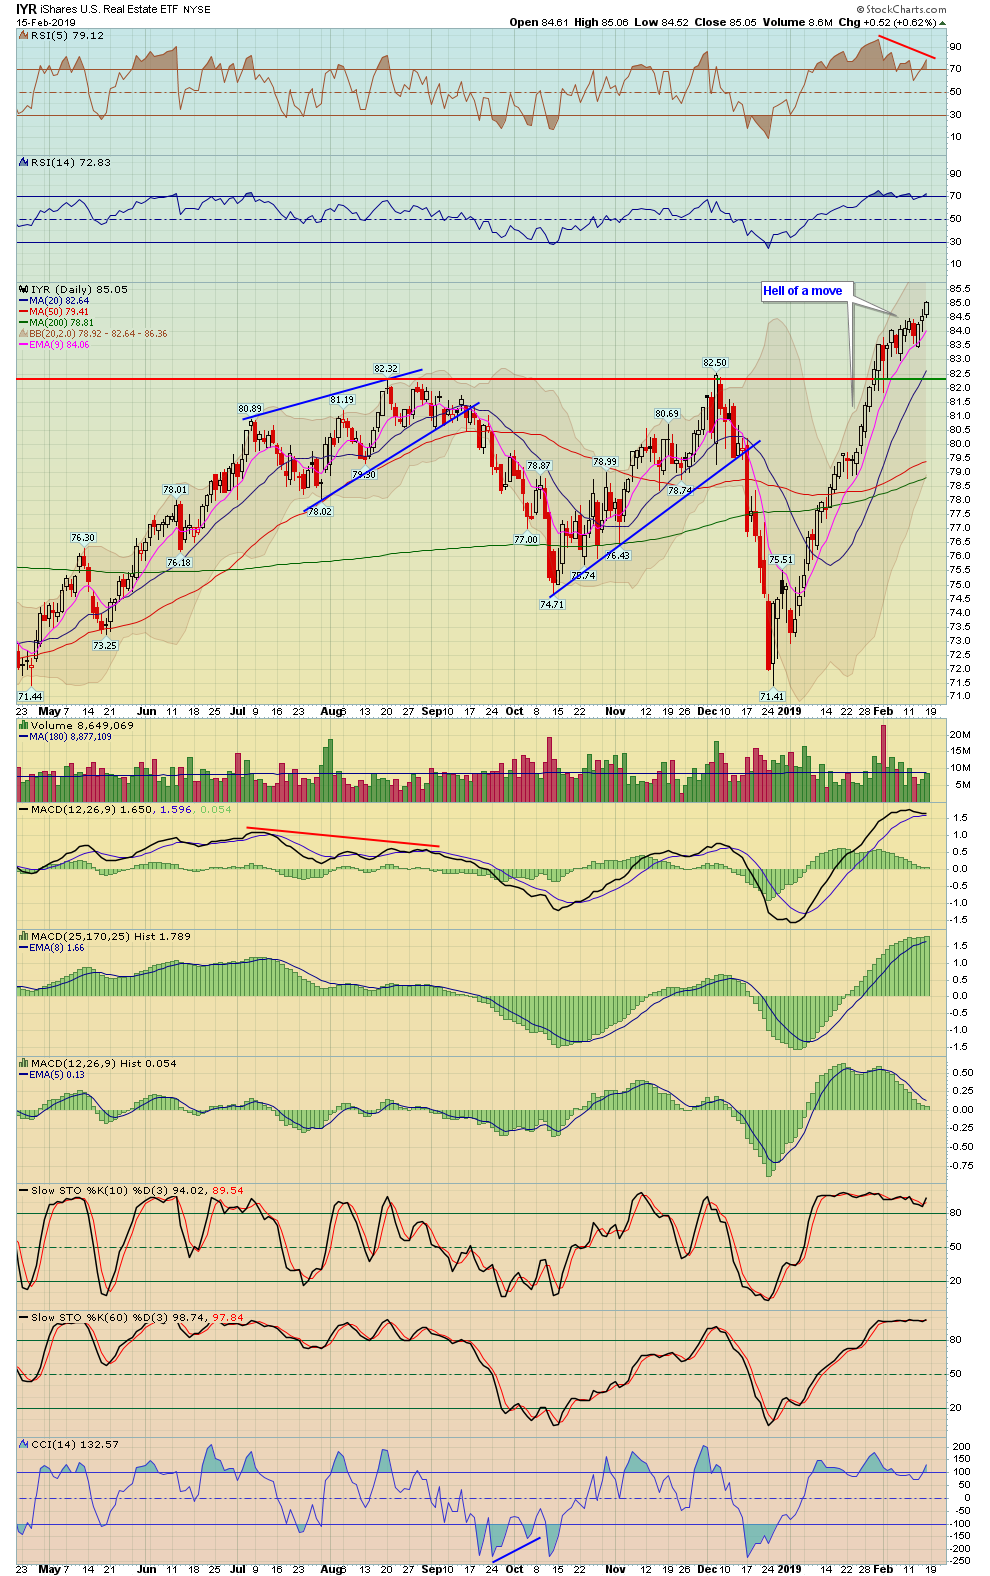
| Real Estate | IYR - W | 0.62% | 1.11% | 85.05 | |
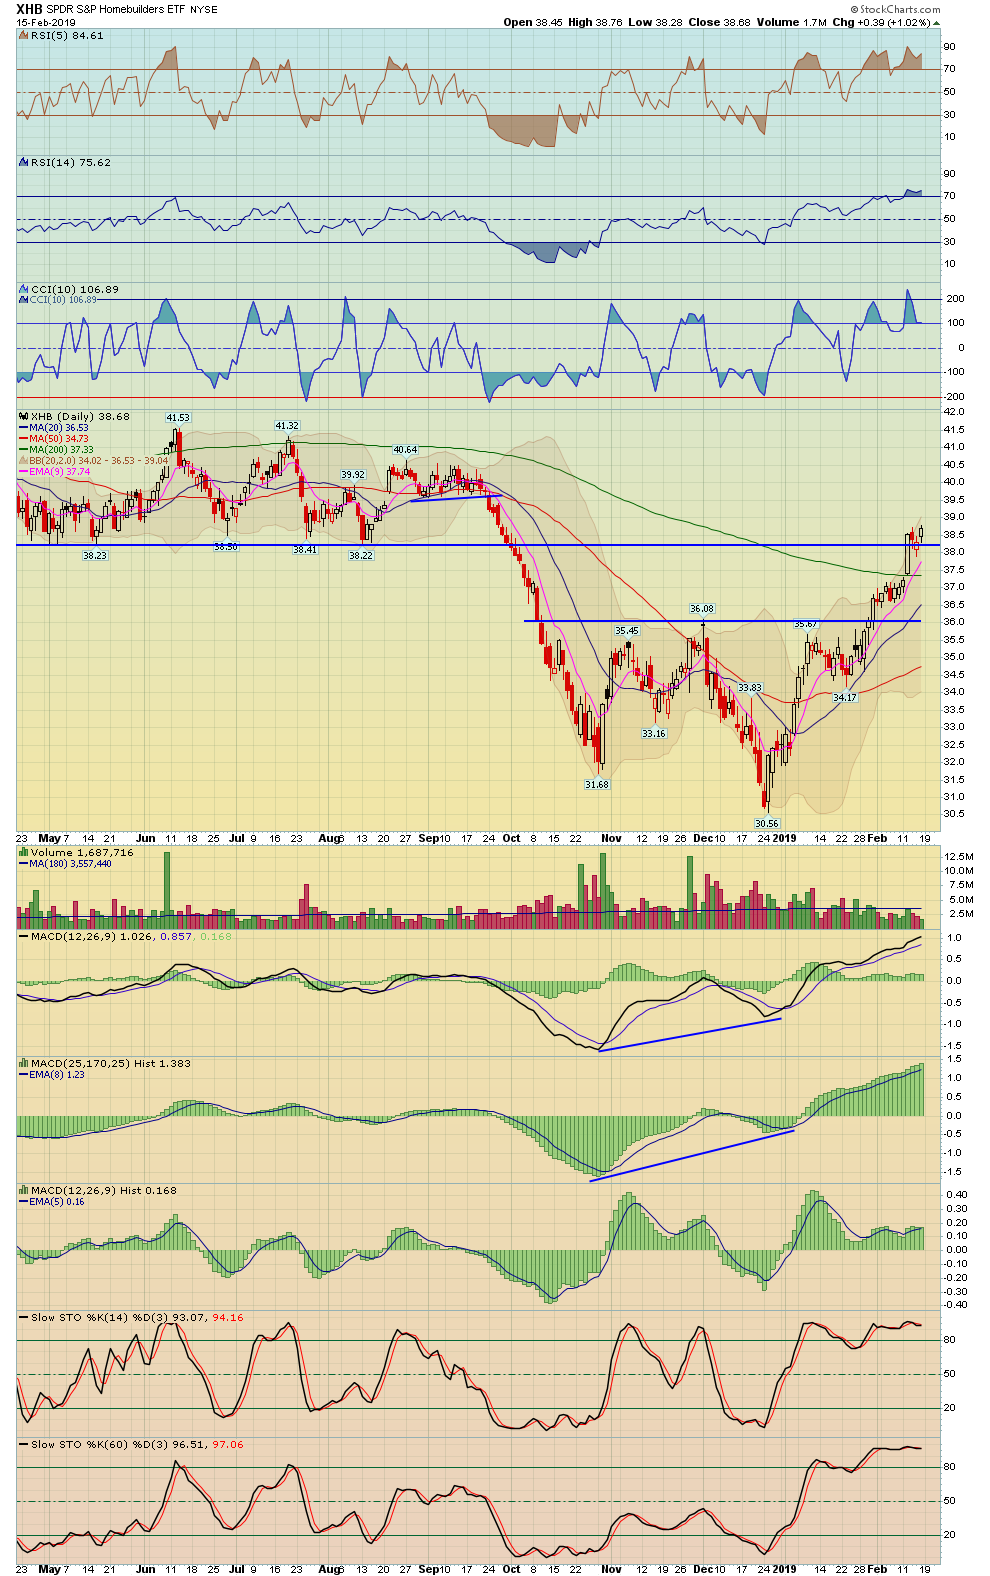
| Homebuilders | HGX - W | XHB - W | 0.88% | 3.90% | 286.15 |
| Materials | XLB - W | 1.36% | 3.38% | 54.48 | |
| Metals And Mining | XME - W | 0.79% | 2.83% | 30.55 | |
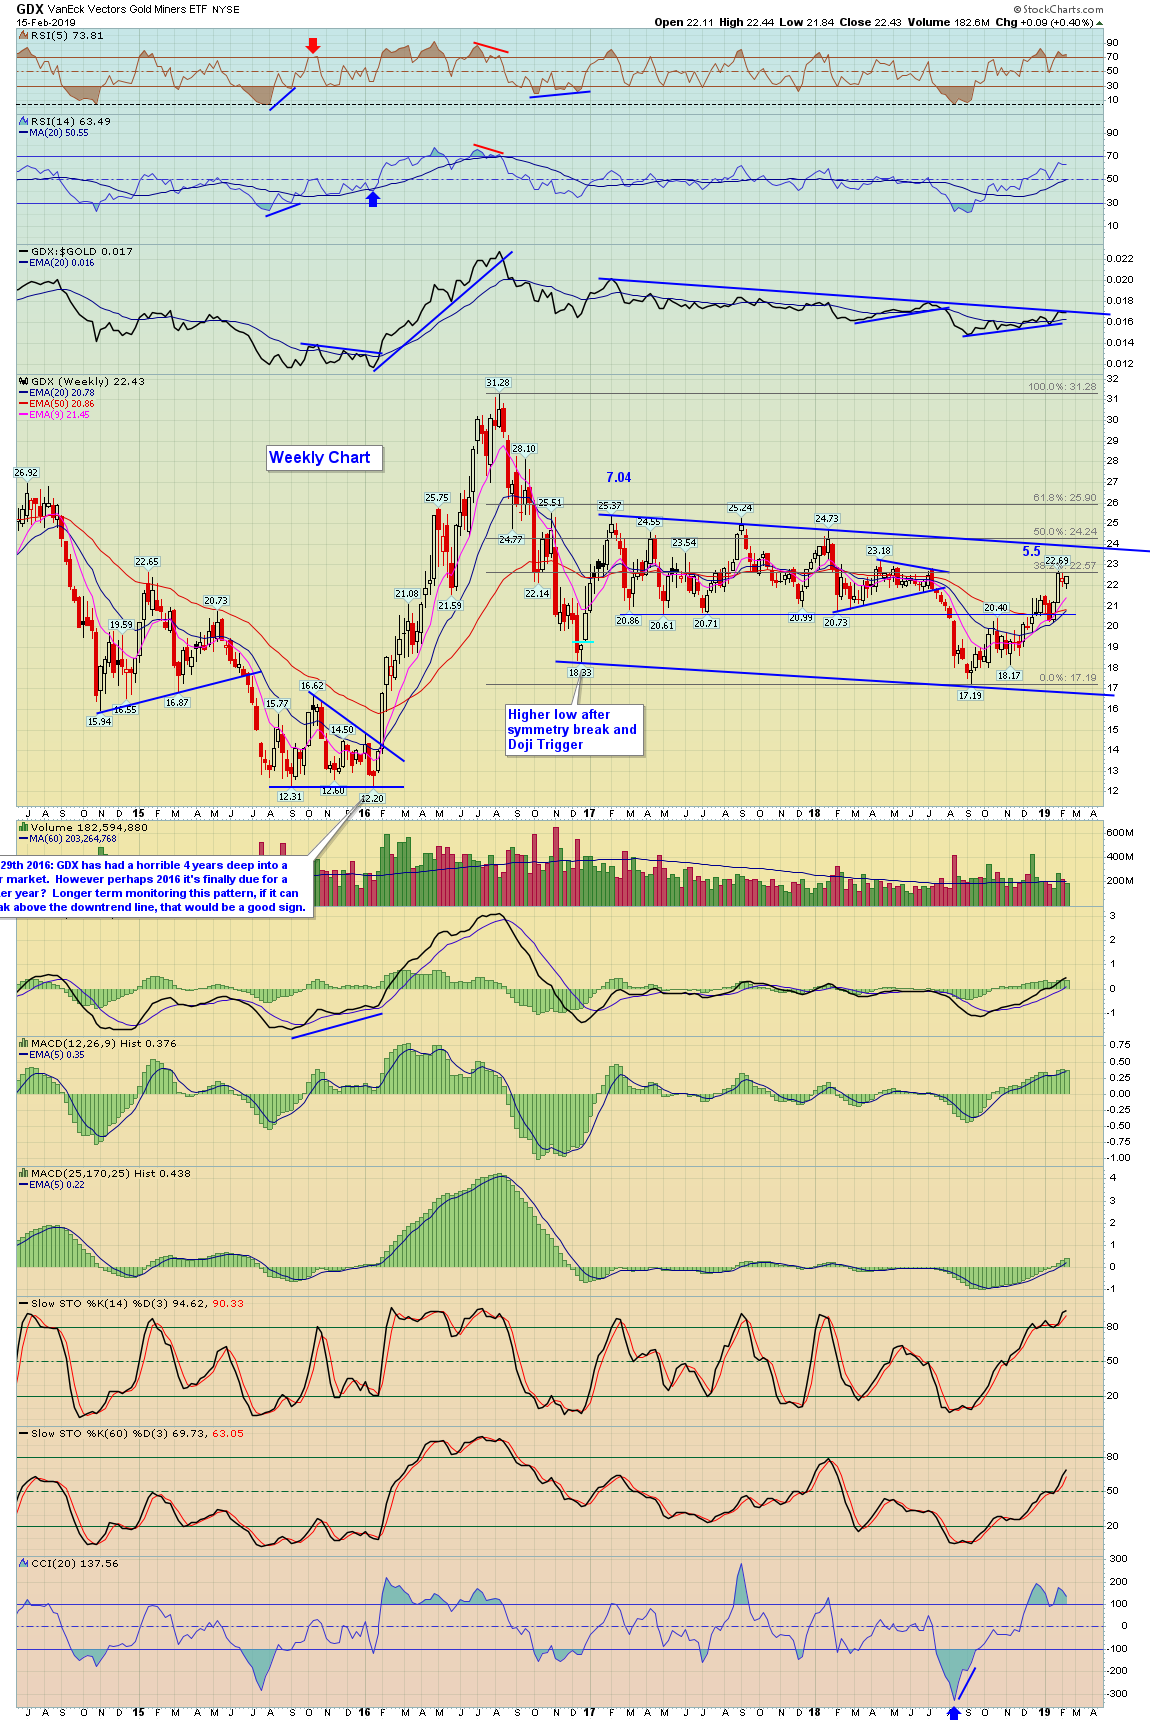
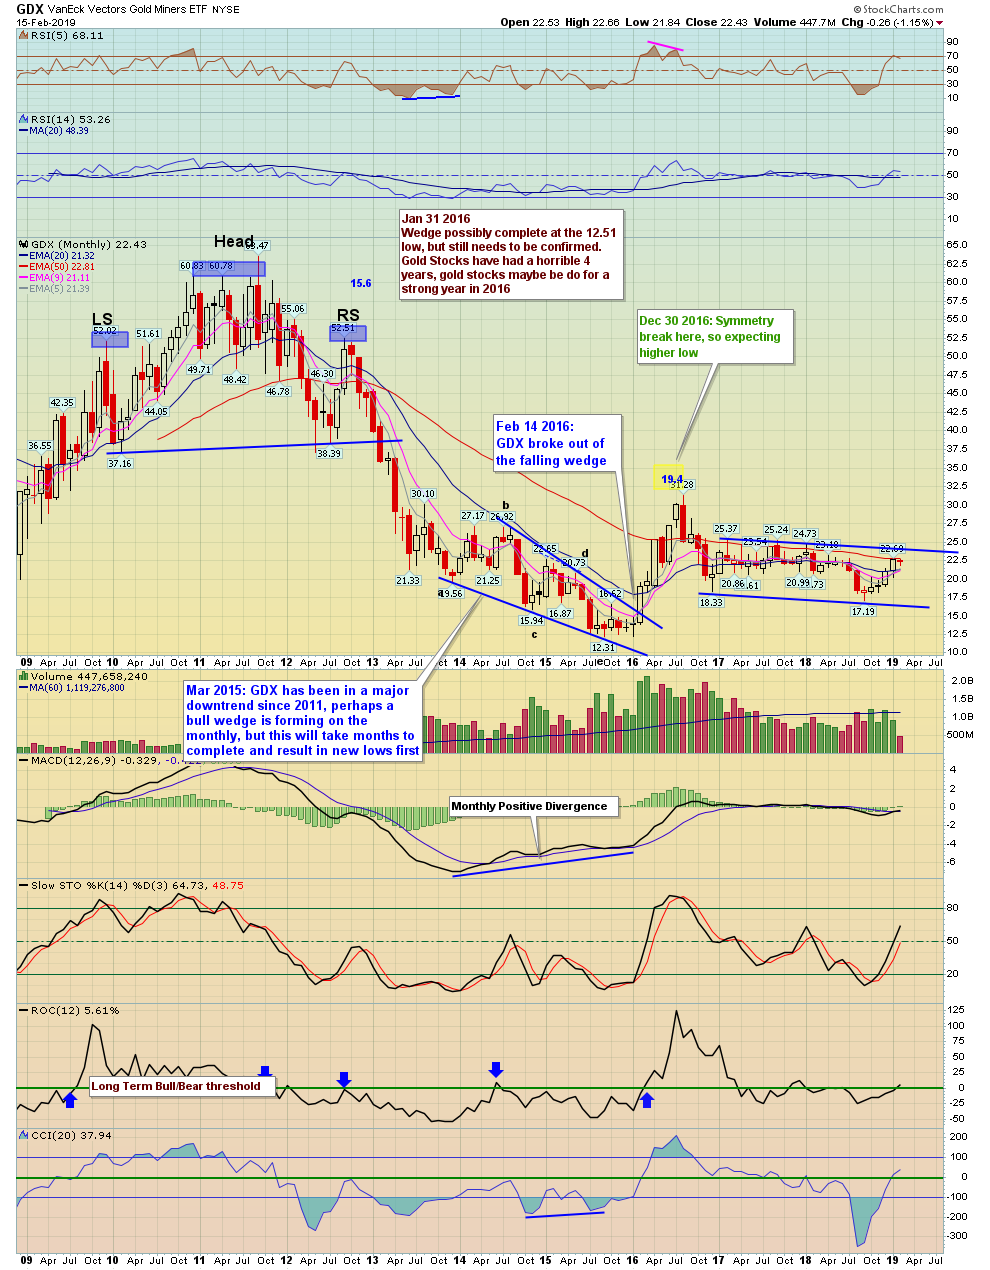
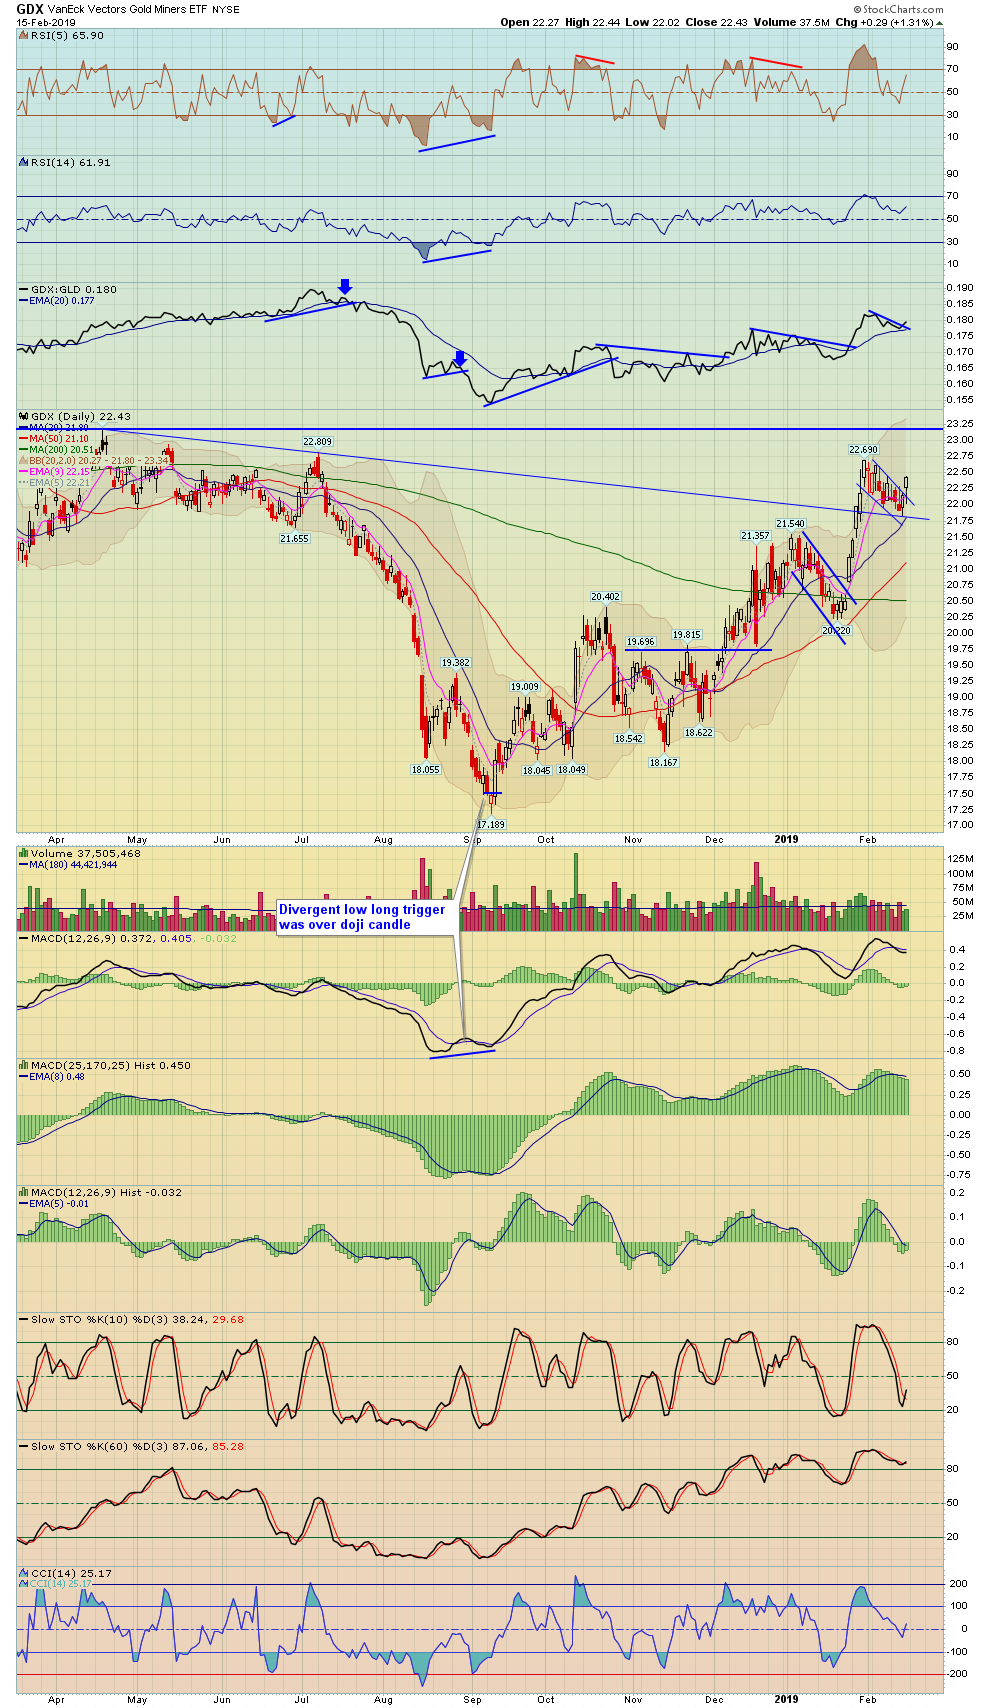
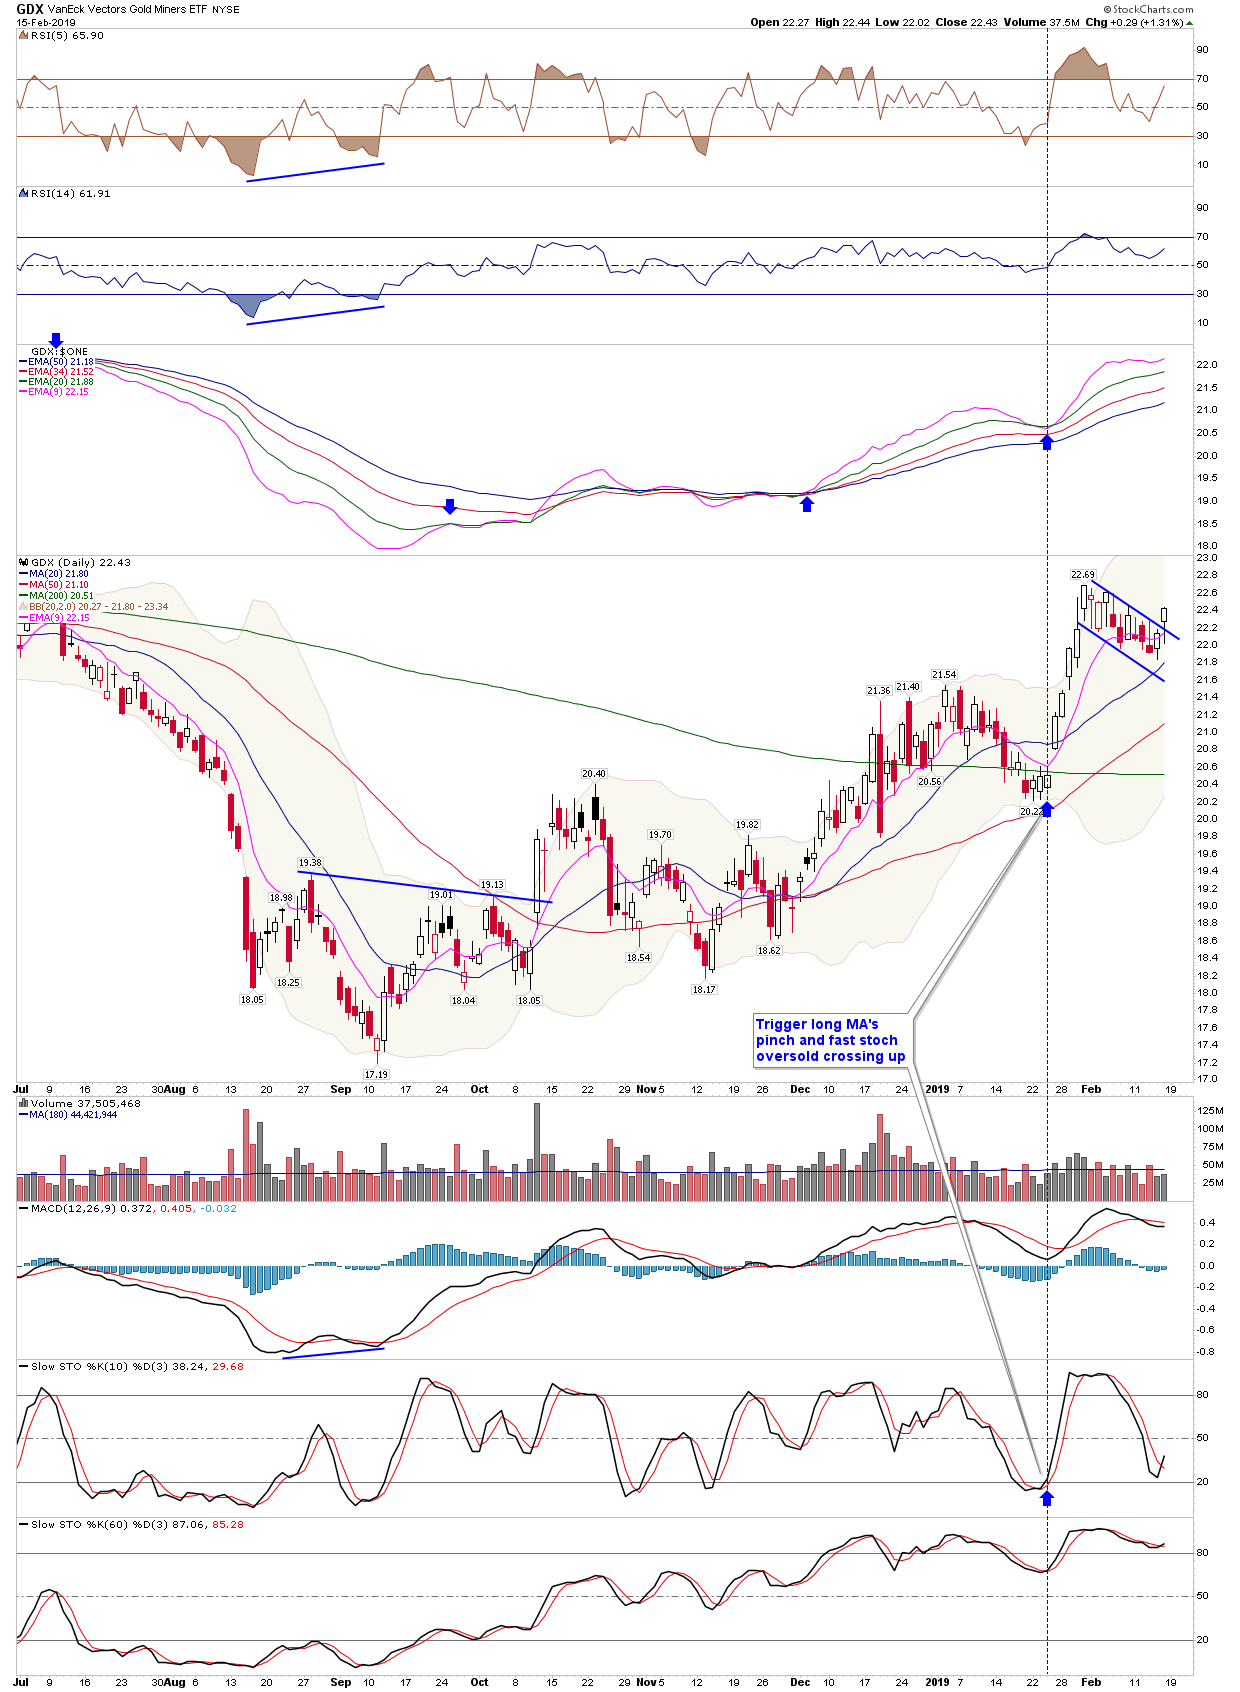
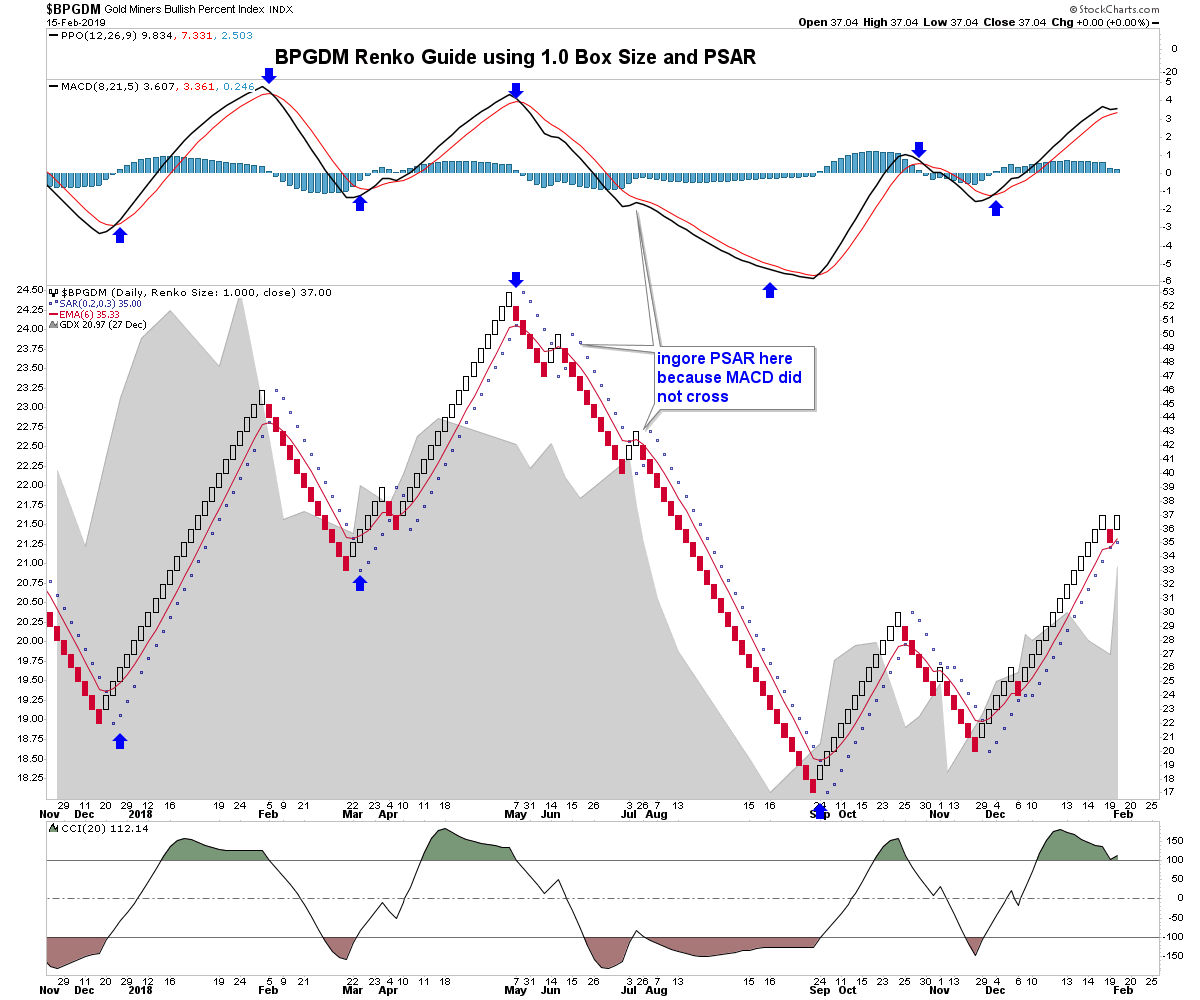
| GDX Gold Miners ETF | GDX - W | 1.31% | 0.40% | 22.43 | |
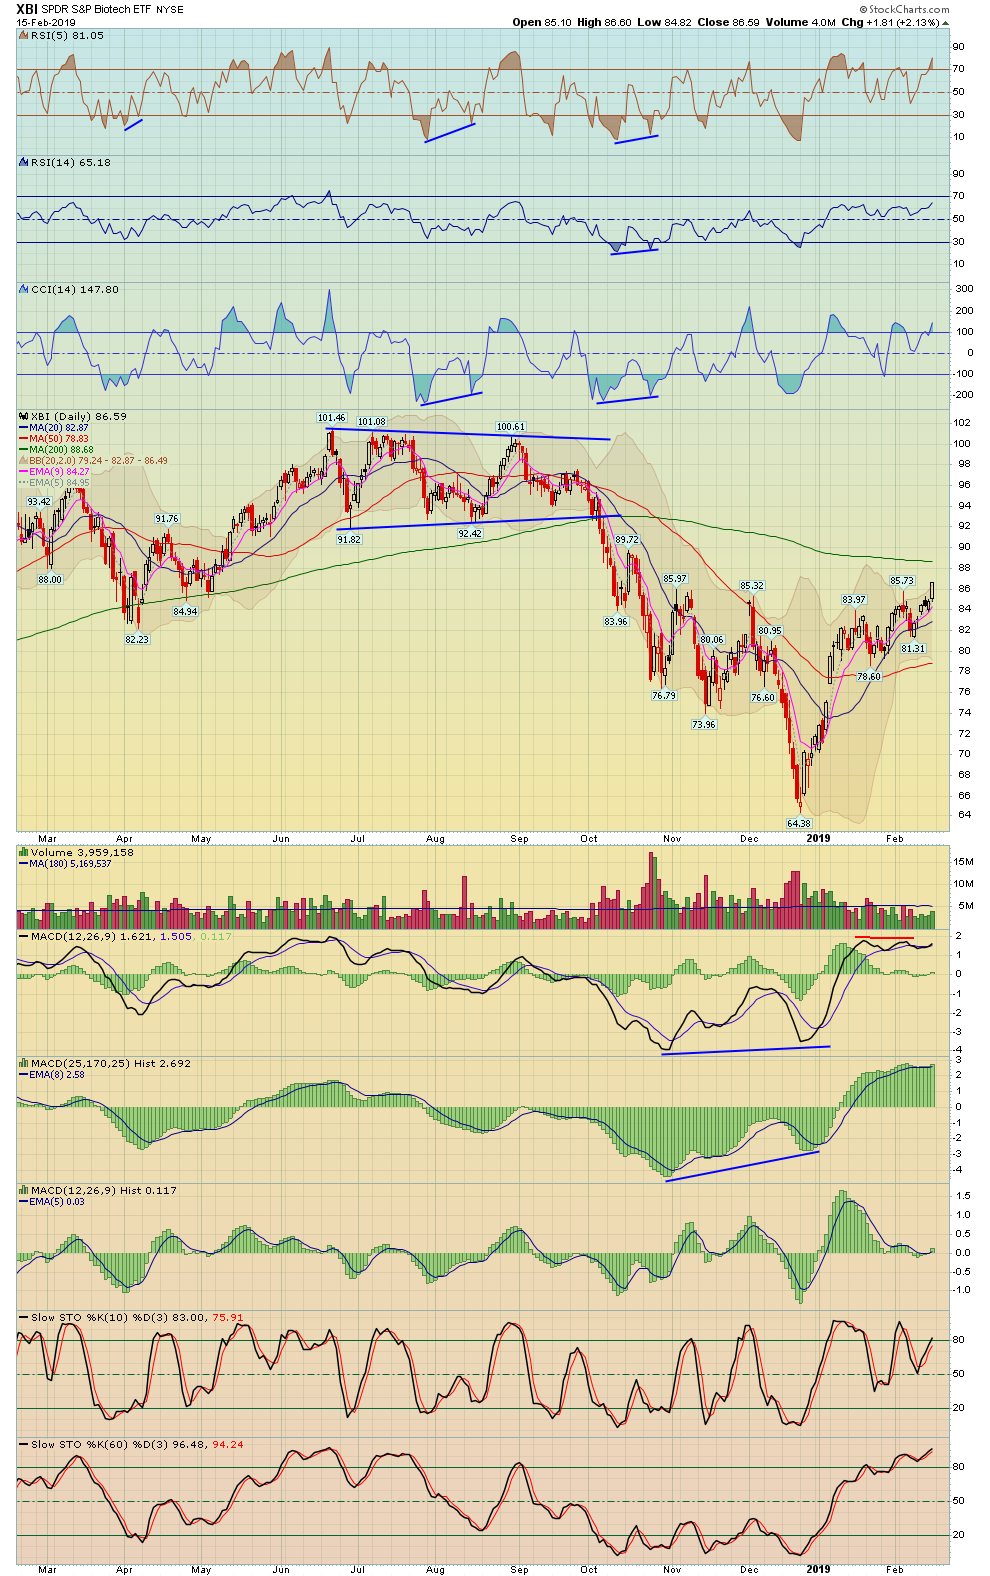
| Biotechnology | BTK - W | XBI - W | 1.62% | 4.45% | 5,000.56 |
| Healthcare | XLV - W | 1.51% | 3.24% | 92.85 | |
| Drugs | DRG - W | 1.32% | 2.54% | 587.91 | |
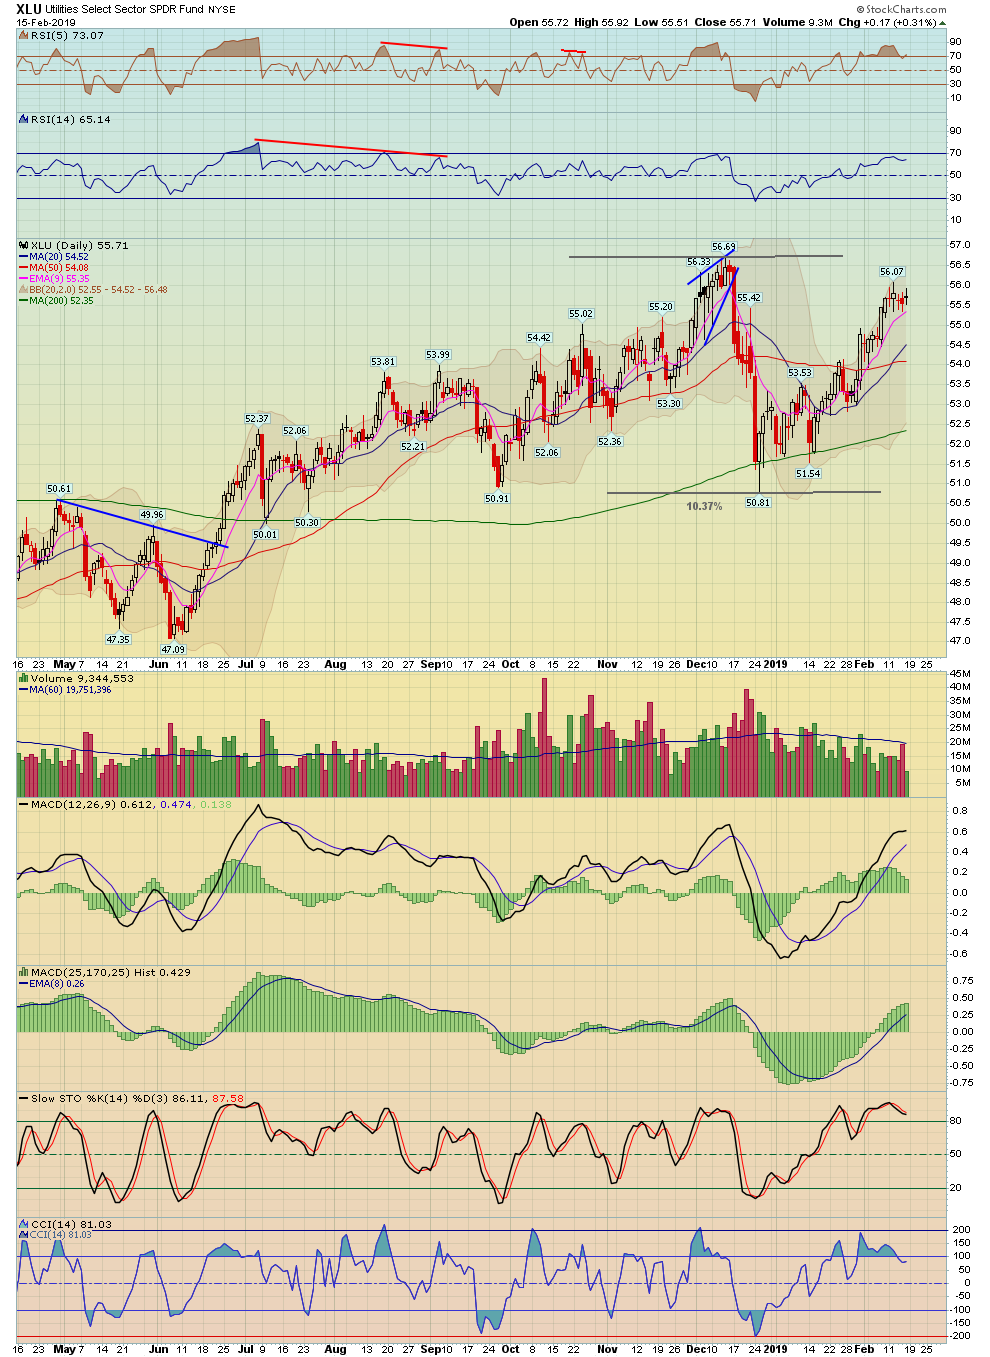
| Utilities | UTIL - W | XLU - W | 0.42% | -0.18% | 738.52 |
| Currencies | Index Symbol | ETF Symbol | % G / L Day | % G / L Week | Close |
|---|---|---|---|---|---|
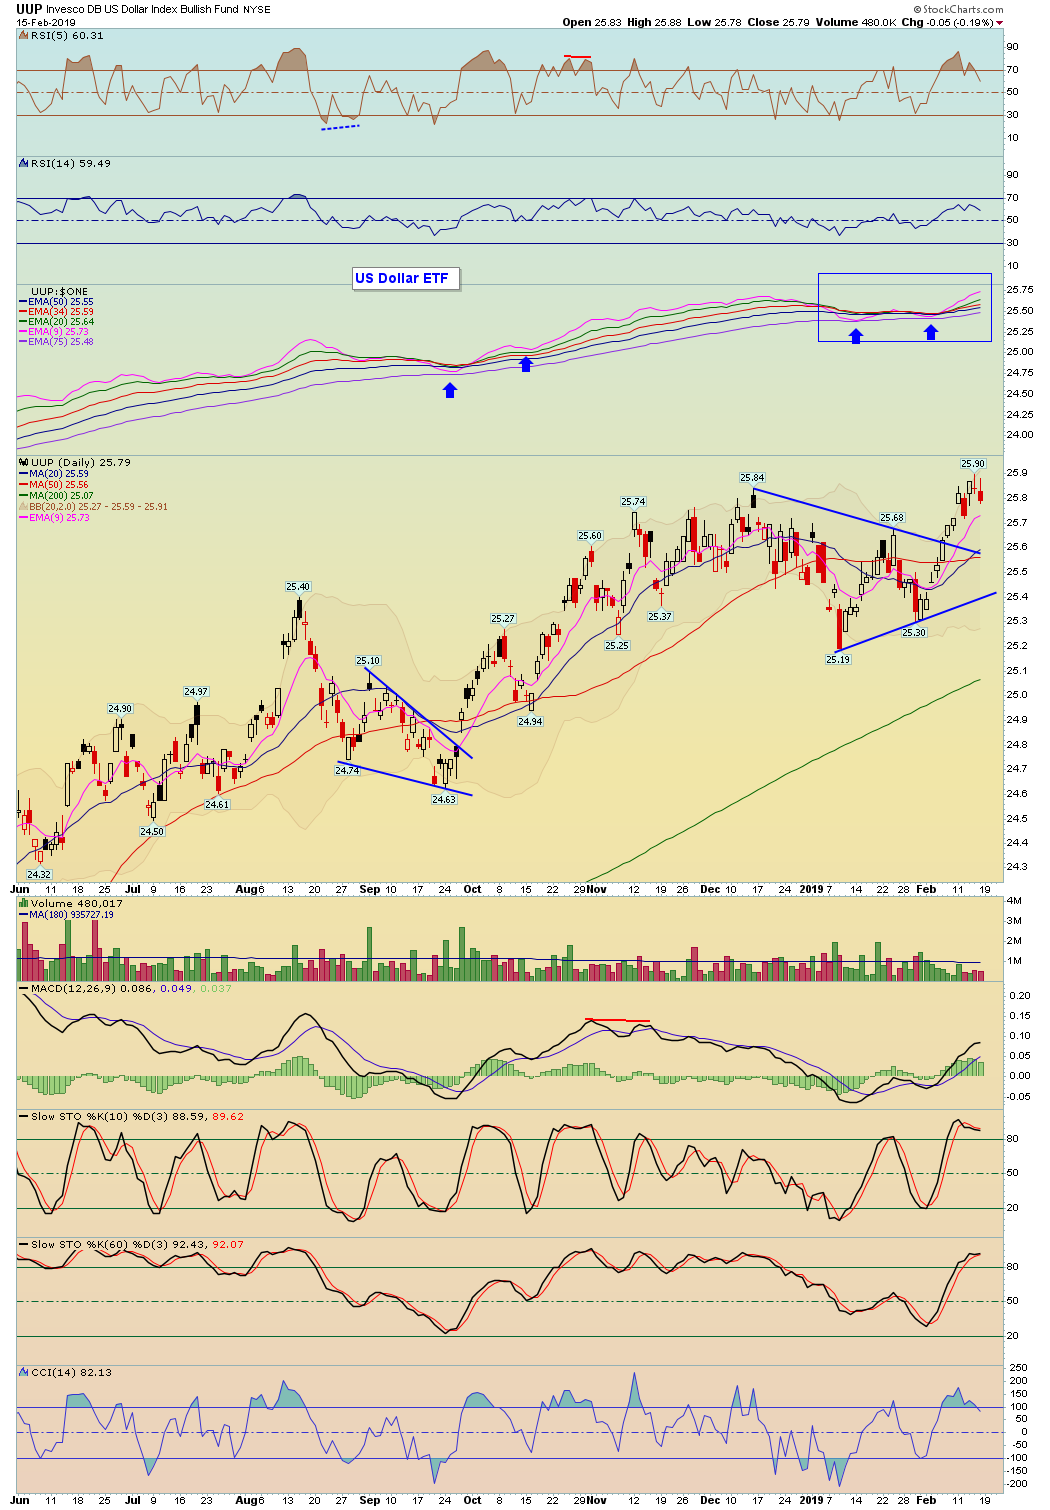
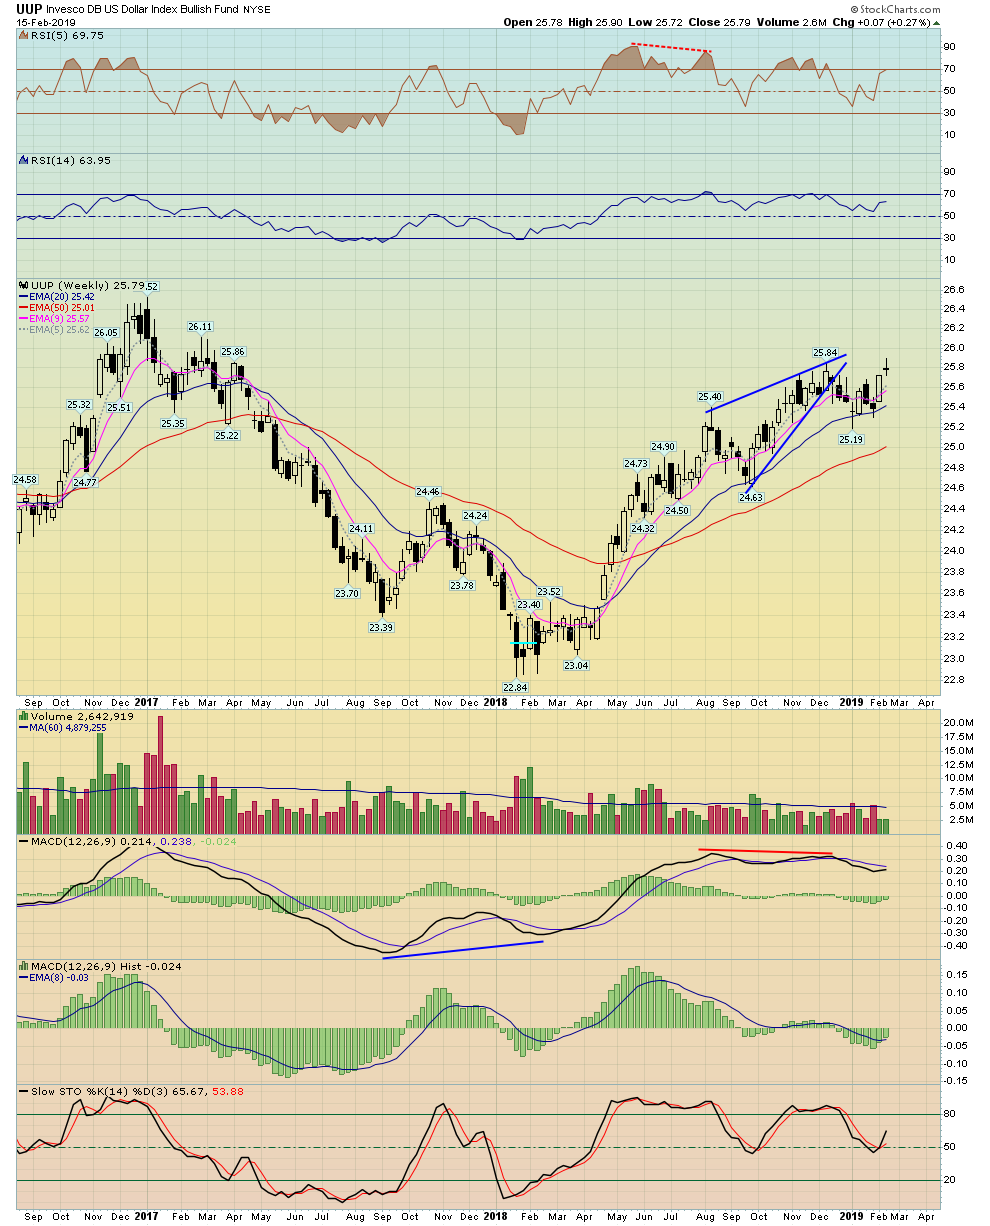
| US Dollar | UUP - W | -0.19% | 0.27% | 25.79 | |
| Euro | XEU - W | FXE - W | -0.04% | -0.52% | 112.92 |
| Yen | XJY - W | FXY - W | -0.06% | -0.80% | 90.46 |
| Australian | XAD - W | FXA - W | 0.50% | 0.57% | 71.41 |
| British Pound | XBP - W | FXB - W | 0.66% | -0.42% | 128.89 |
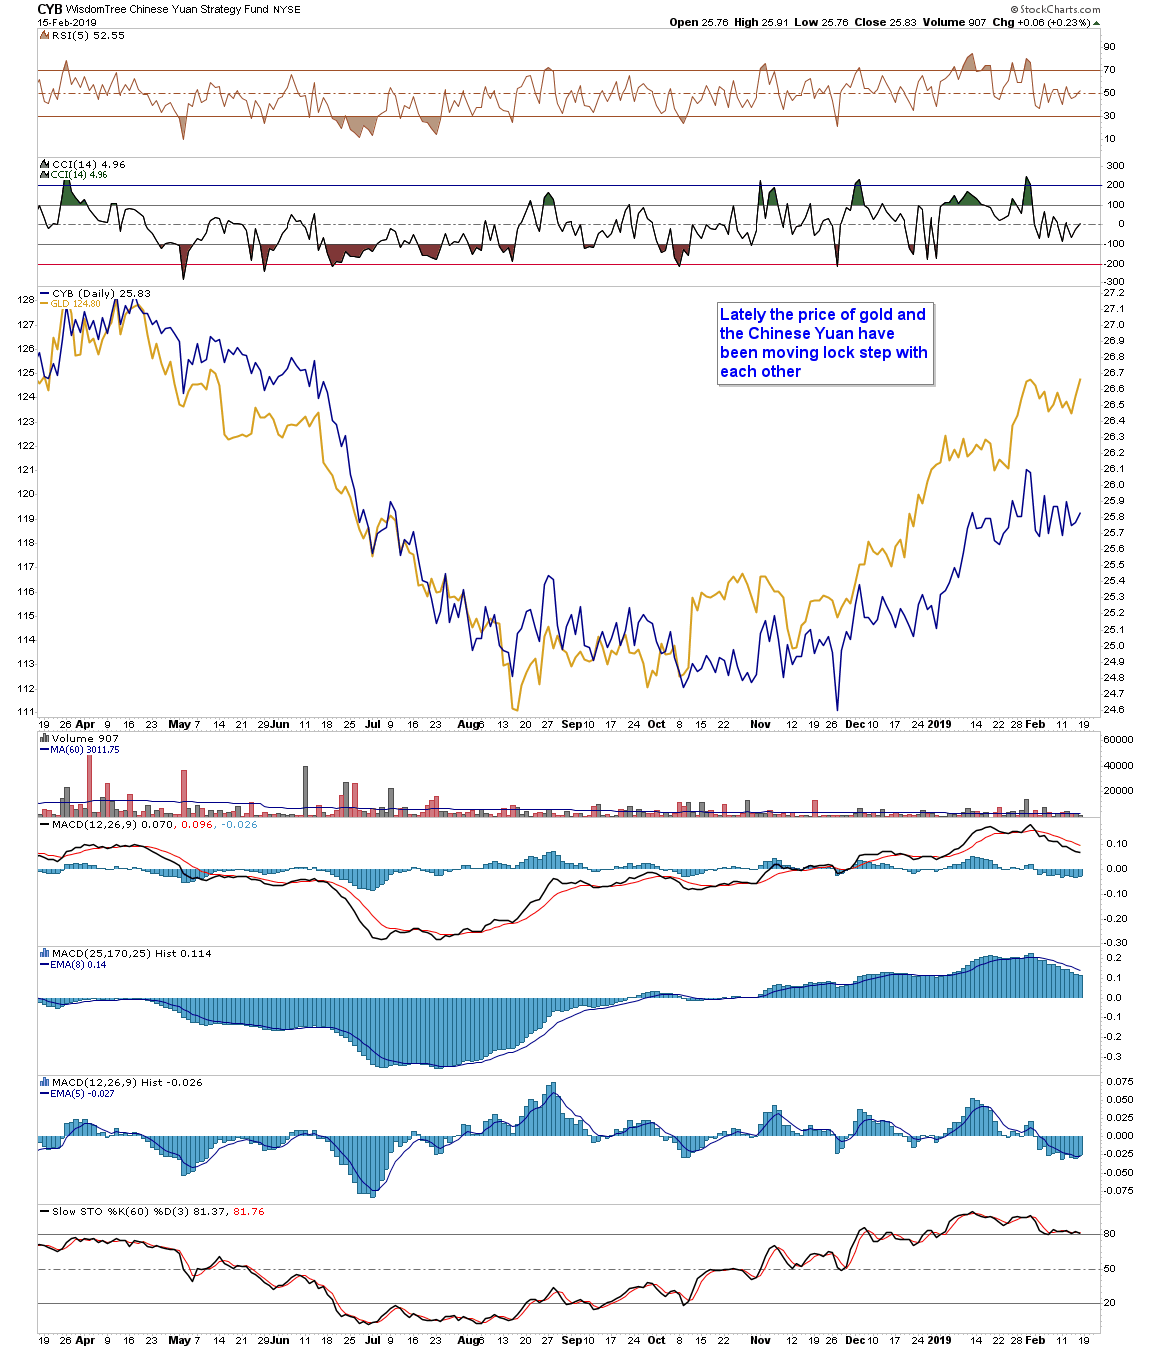
| Chinese Yuan | CYB - W | 0.23% | -0.15% | 25.83 | |
| Canadian Dollar | CDW - W | FXC - W | 0.36% | 0.25% | 75.50 |
| Swiss Franc | XSF - W | FXF - W | -0.05% | -0.48% | 99.47 |
| Commodities | Index Symbol | ETF Symbol | % G / L Day | % G / L Week | Close |
|---|---|---|---|---|---|
| Commodities | DBC - W | 1.86% | 2.71% | 15.91 | |
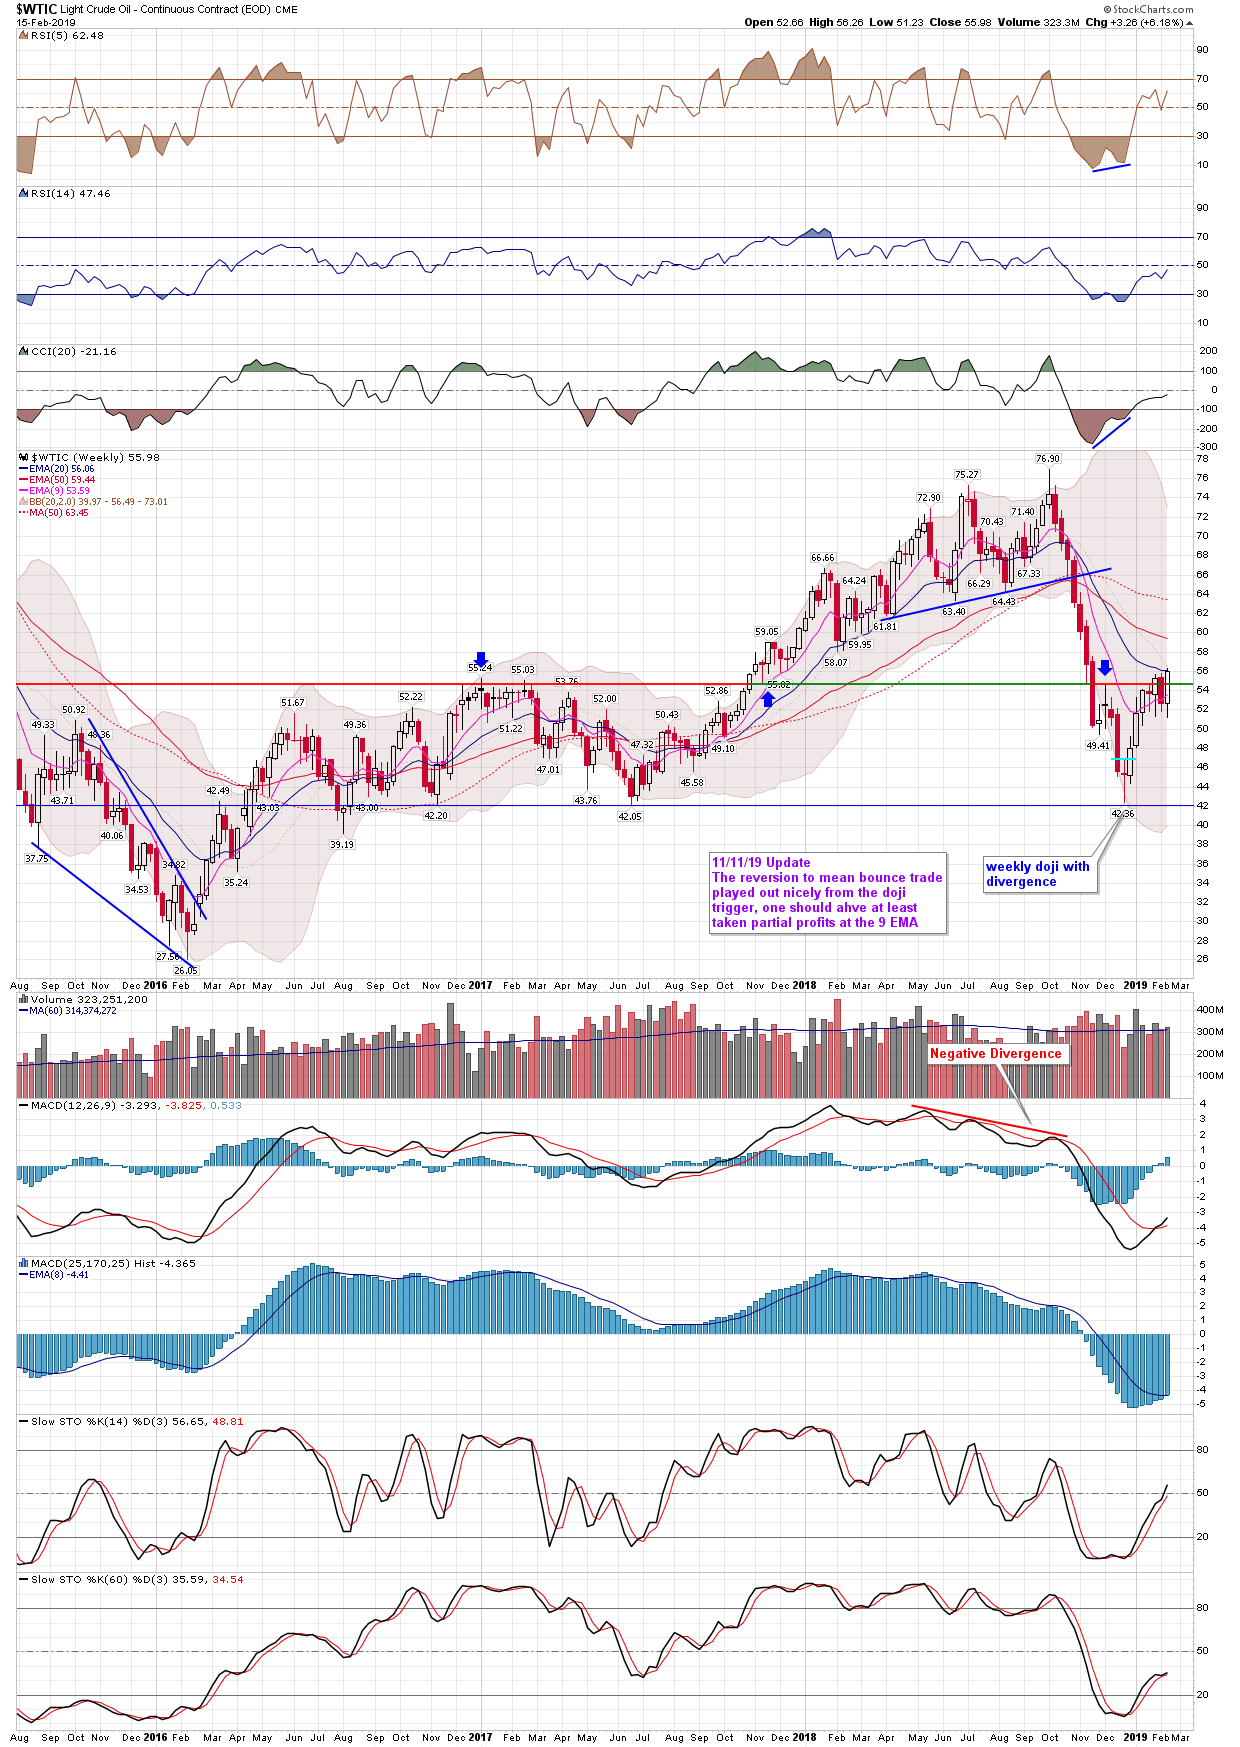
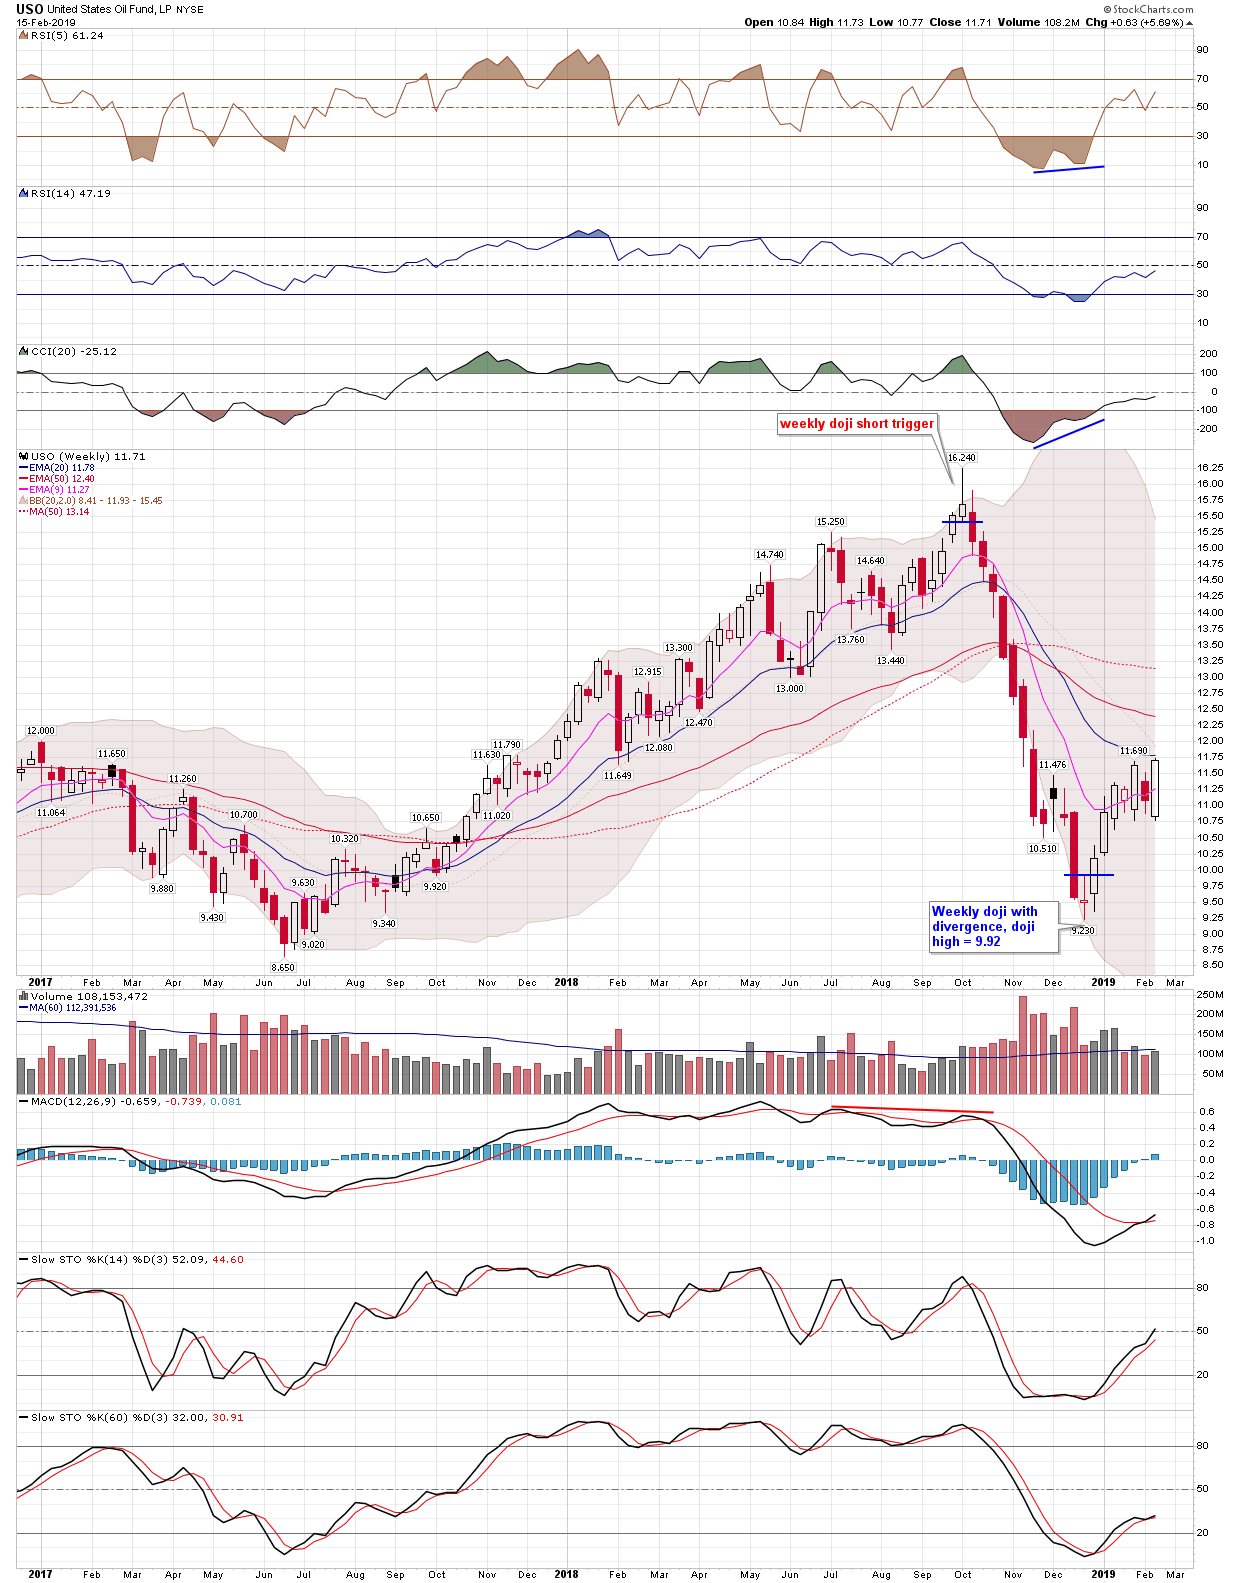
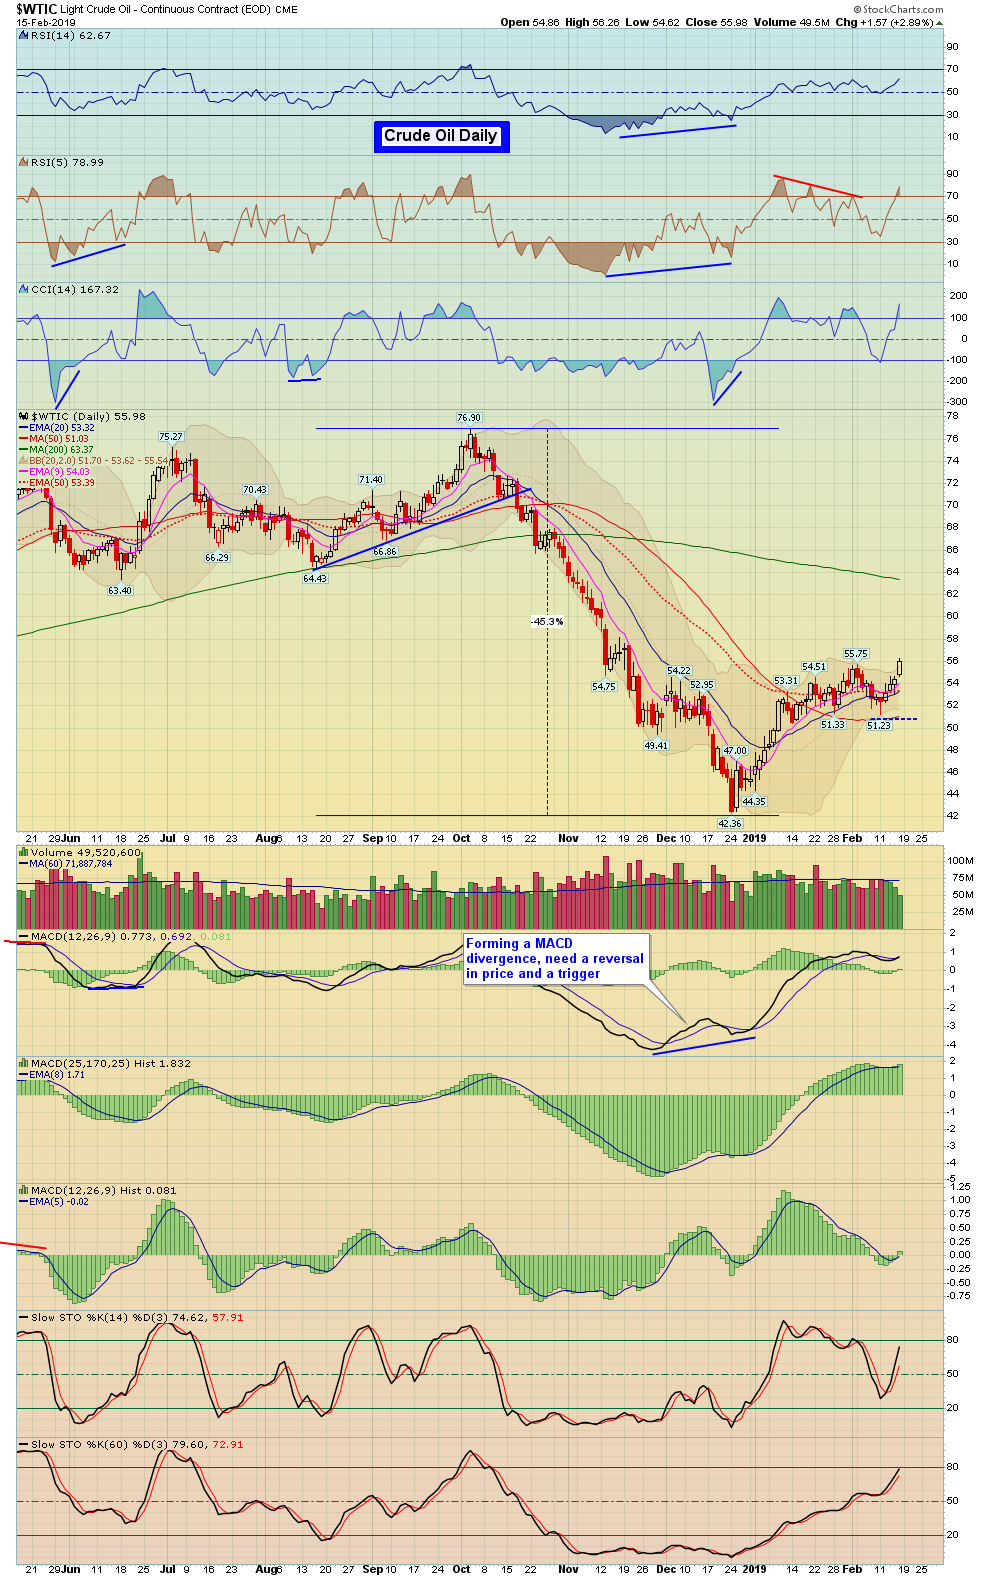
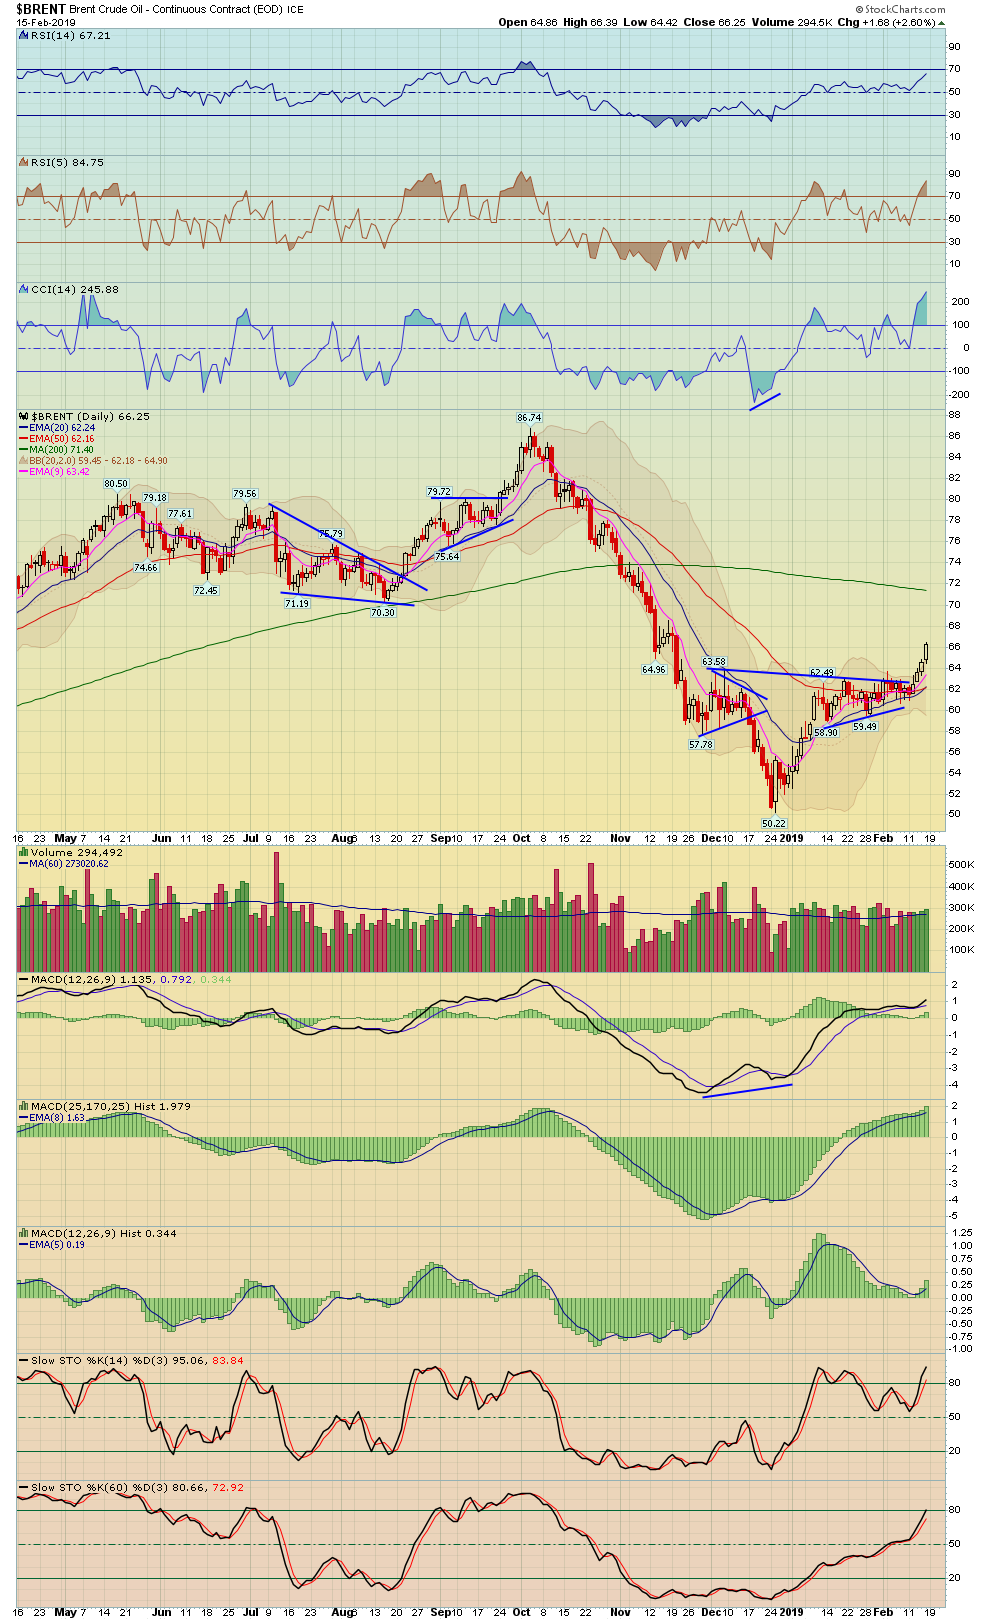
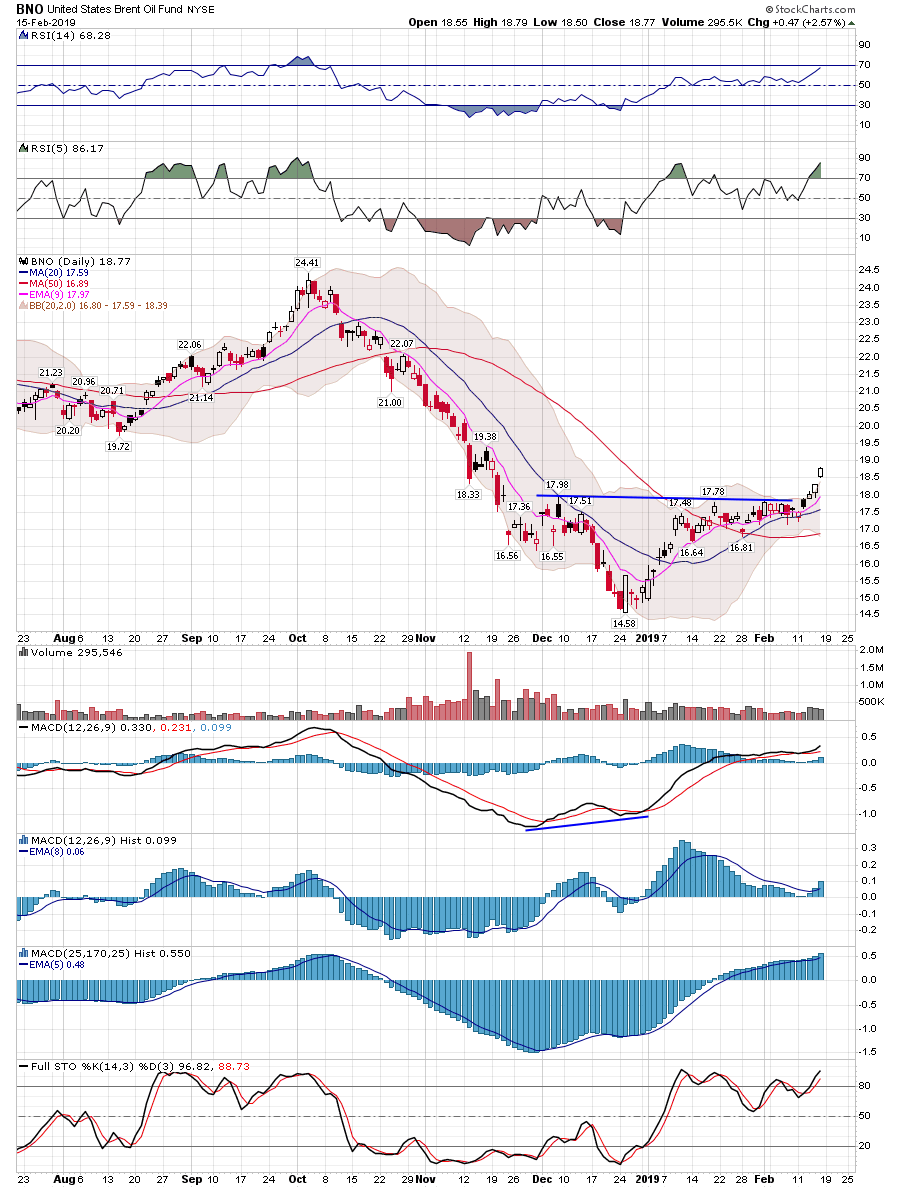
| Crude Oil | WTIC - W | USO - W | 2.89% | 6.18% | 55.98 |
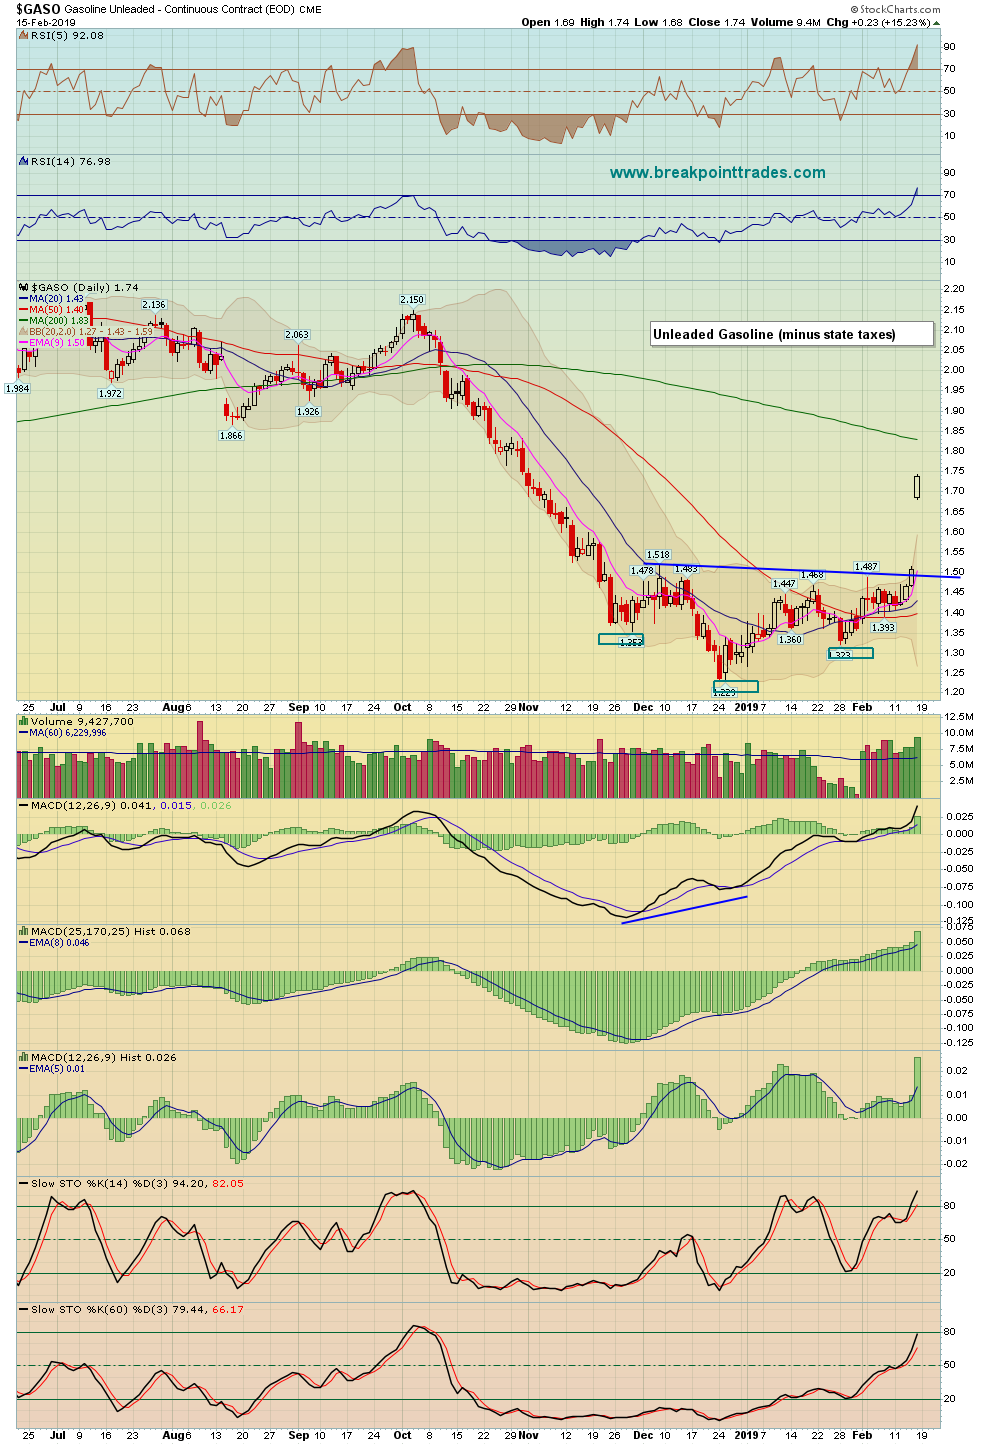
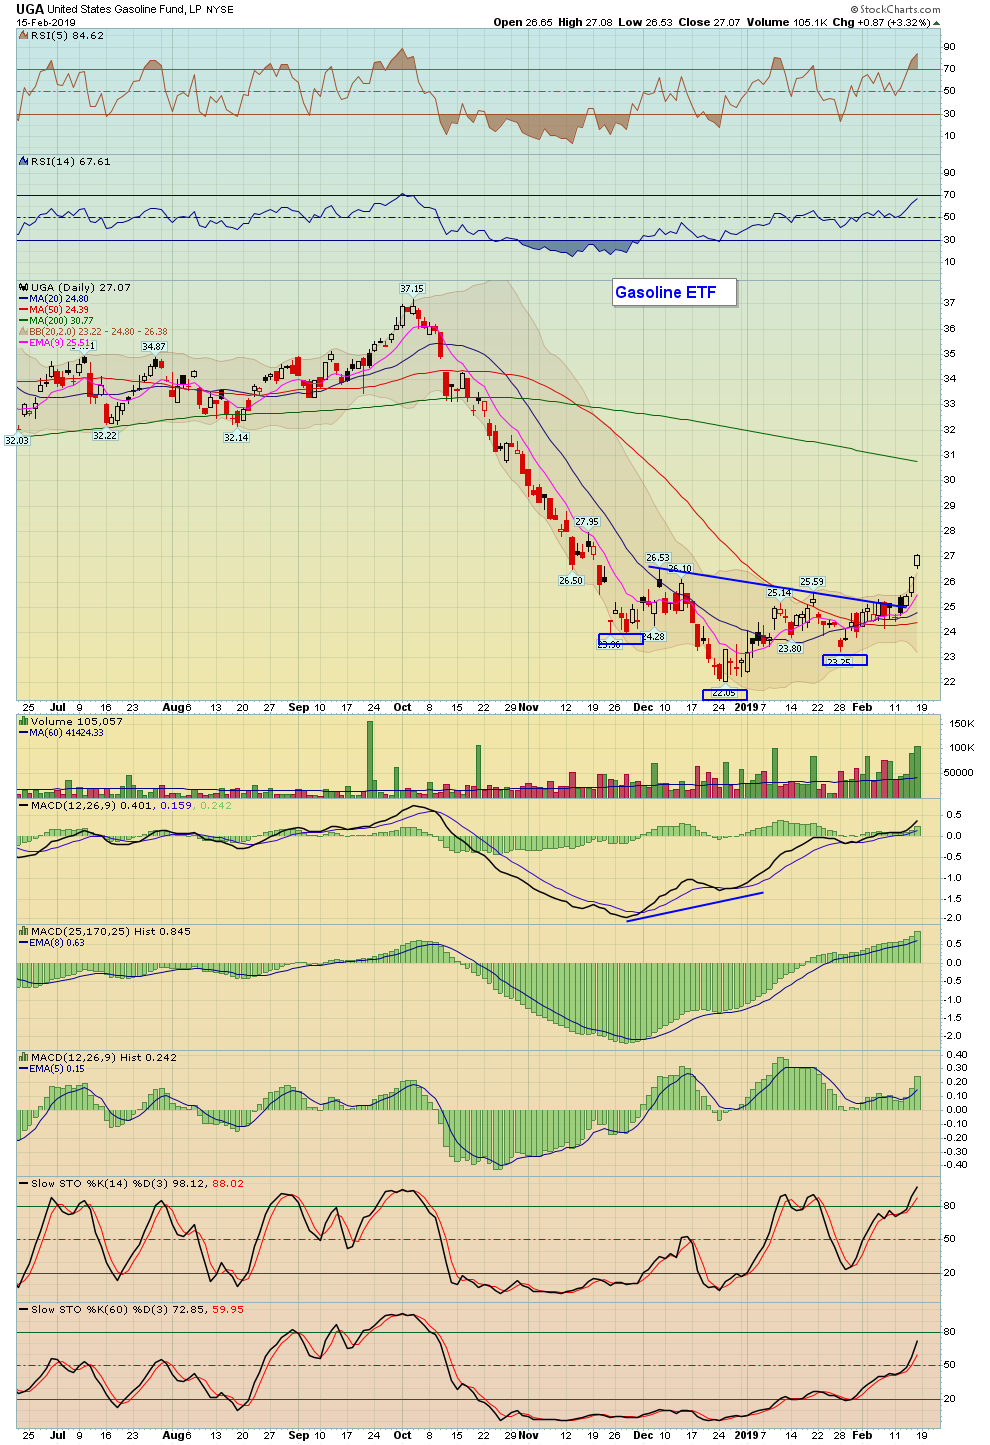
| Gasoline | GASO - W | 15.23% | 20.17% | 1.74 | |
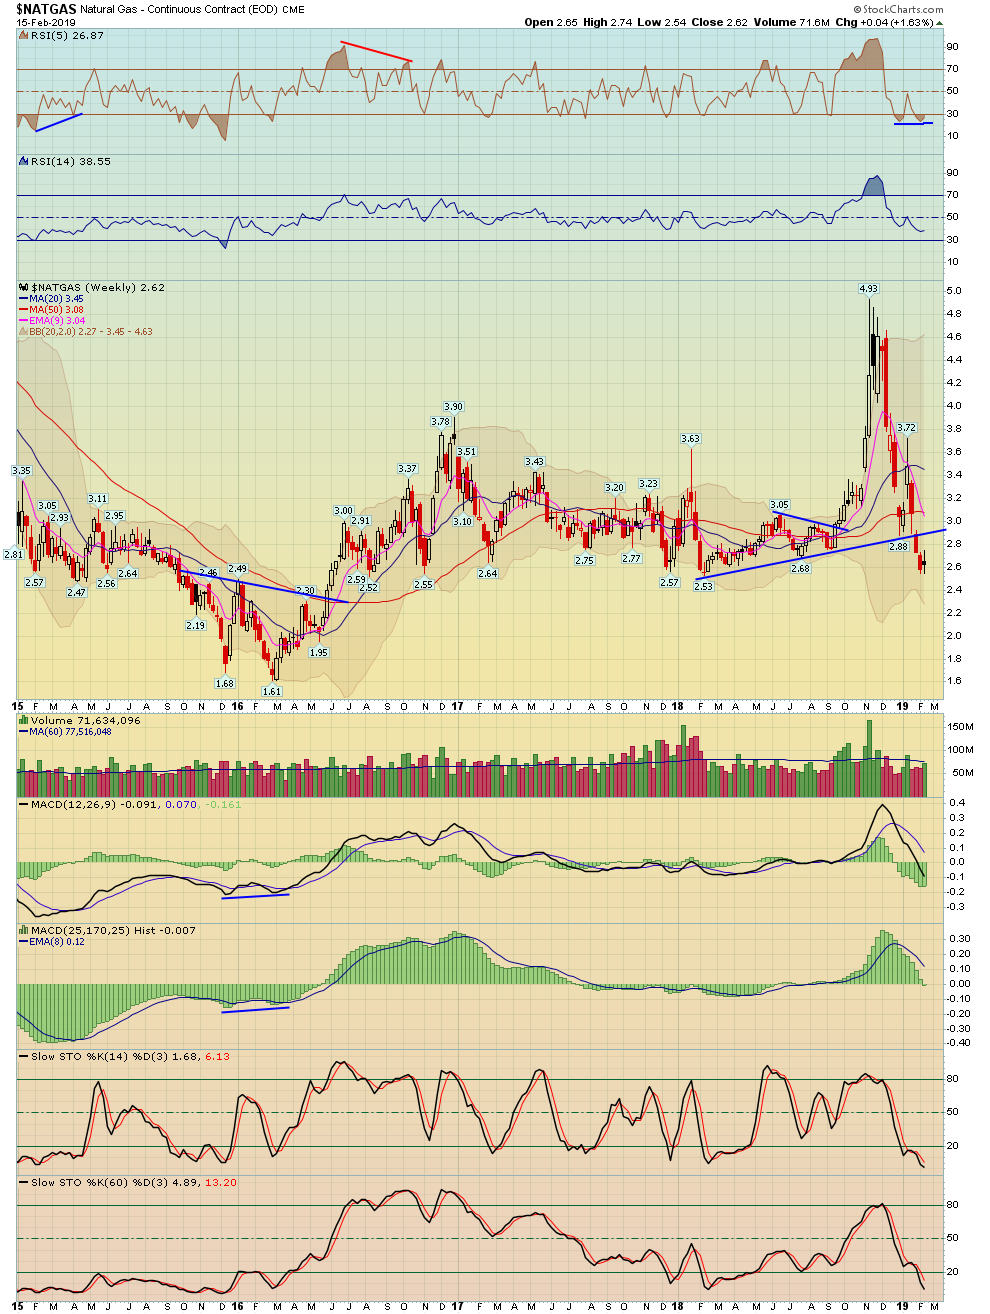
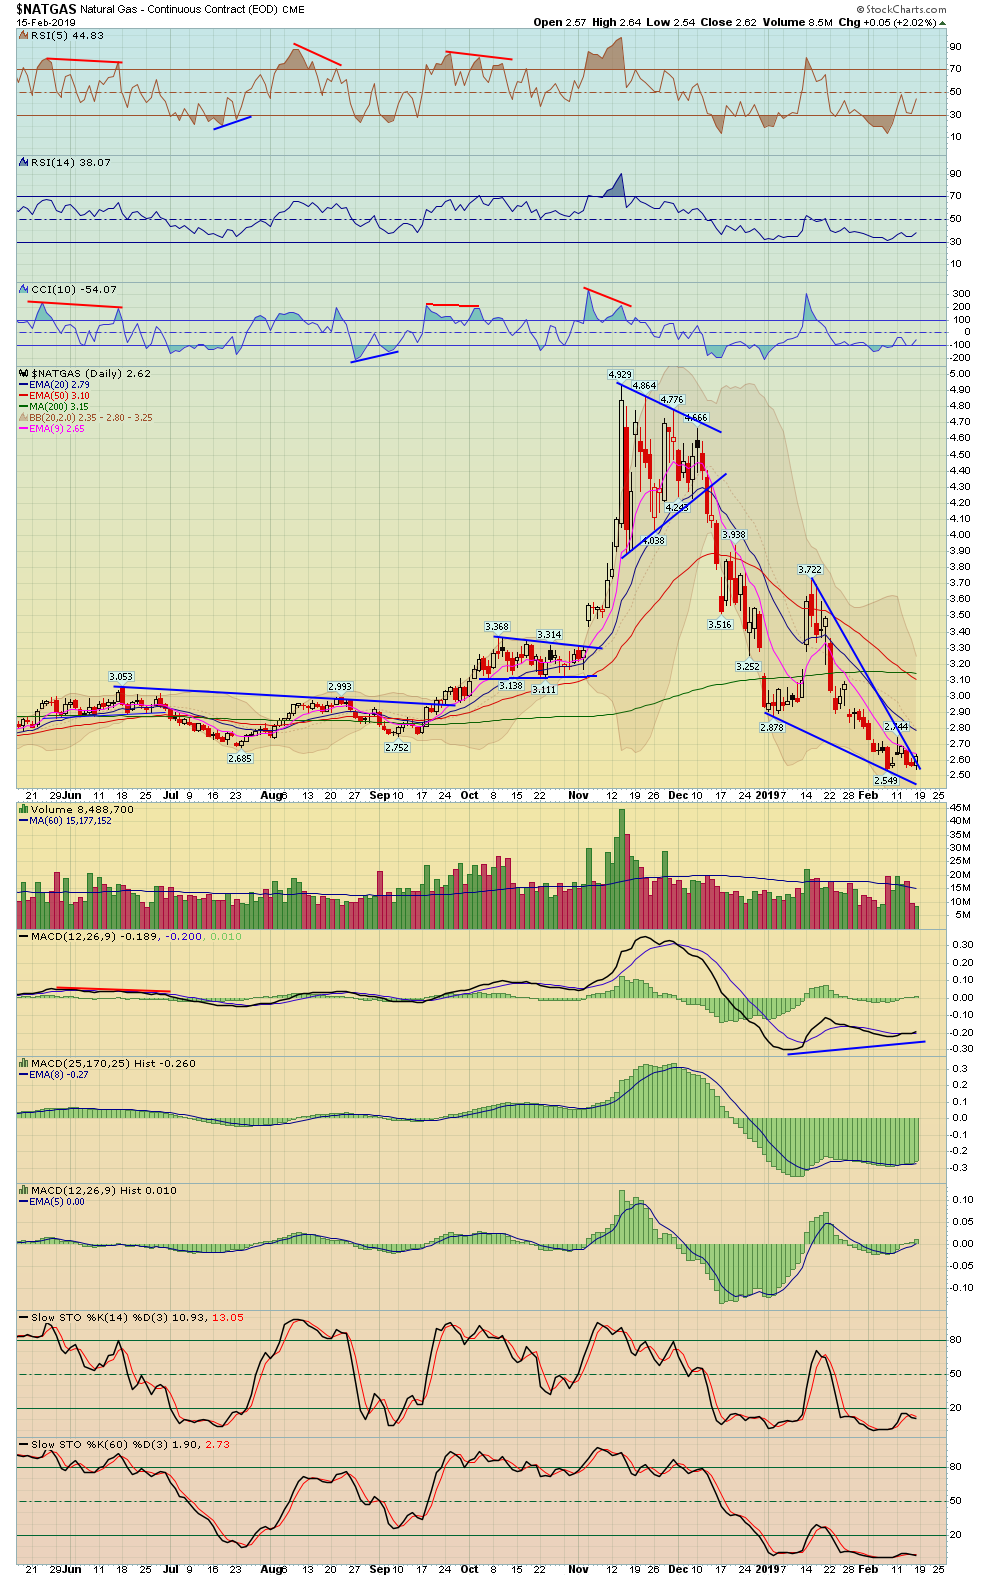
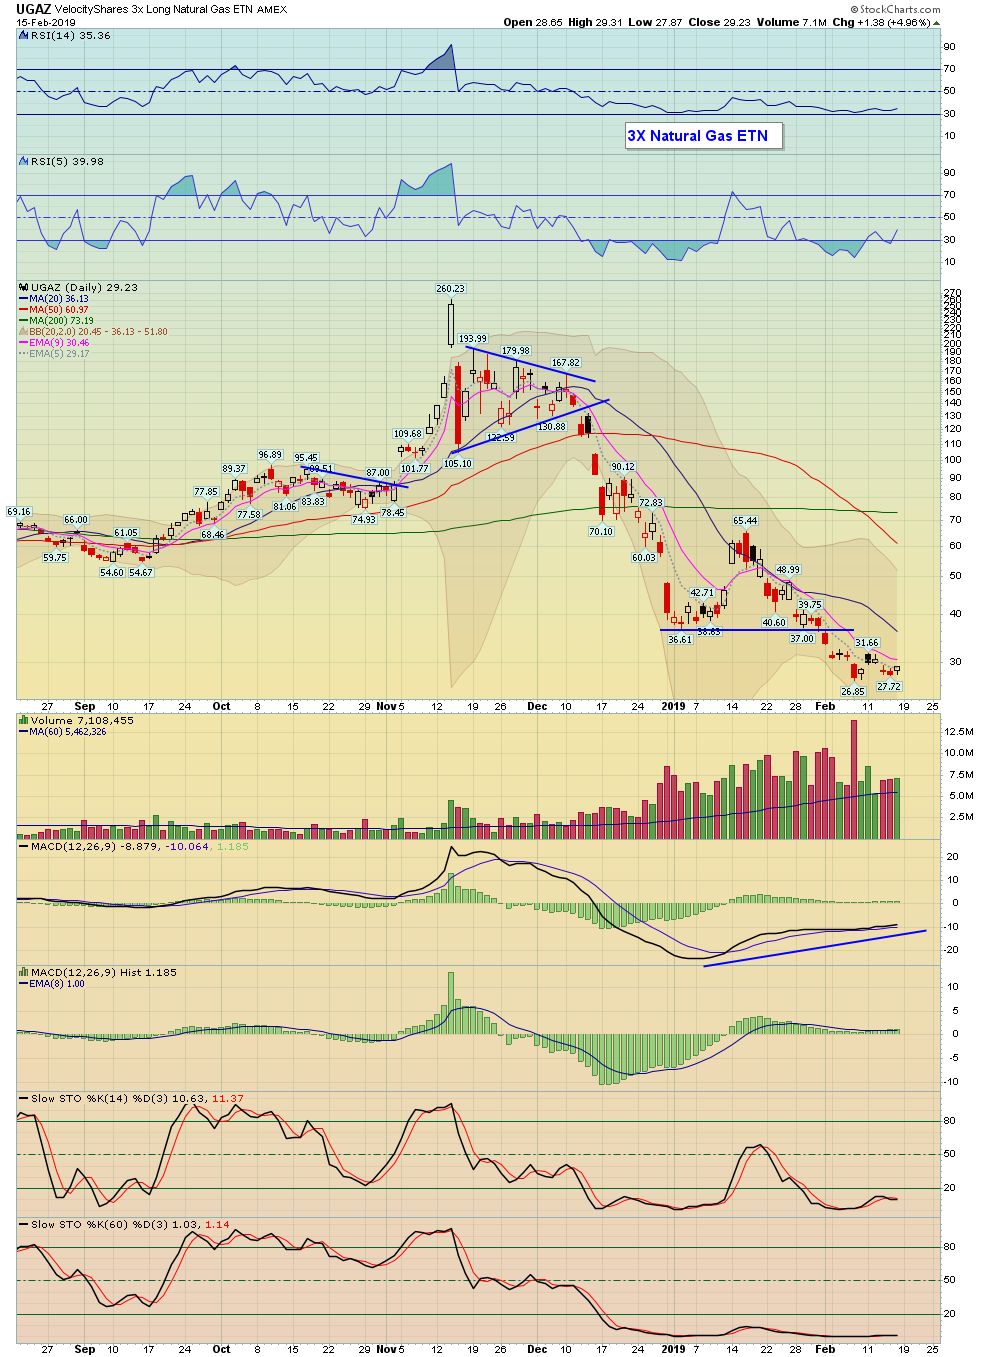
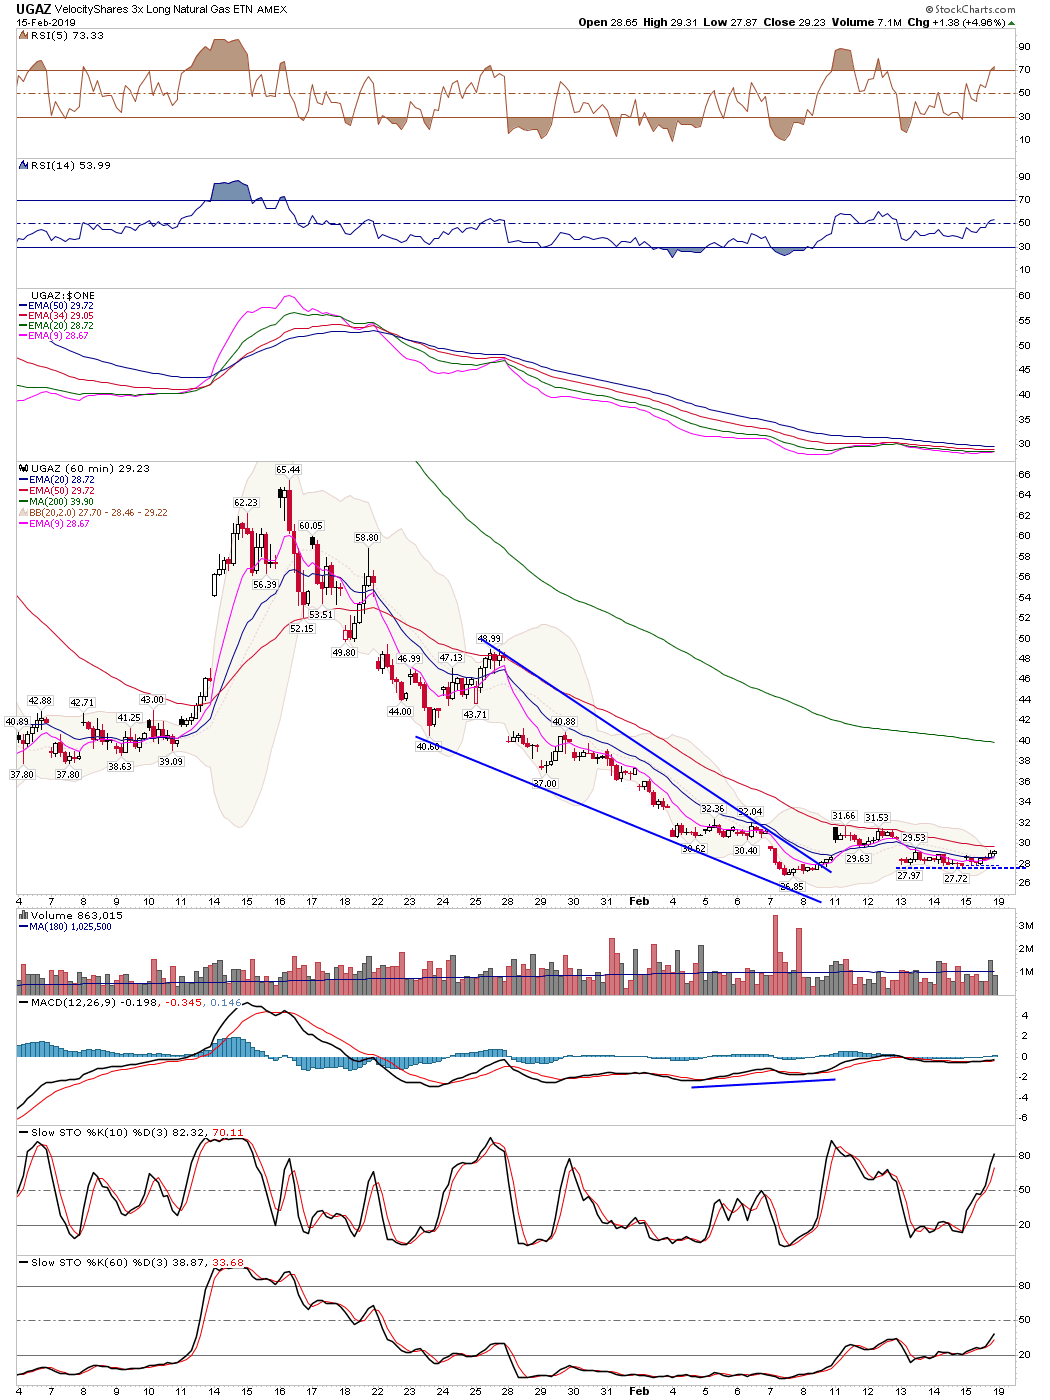
| Natural Gas | NATGAS - W | UNG - W | 2.02% | 1.63% | 2.63 |
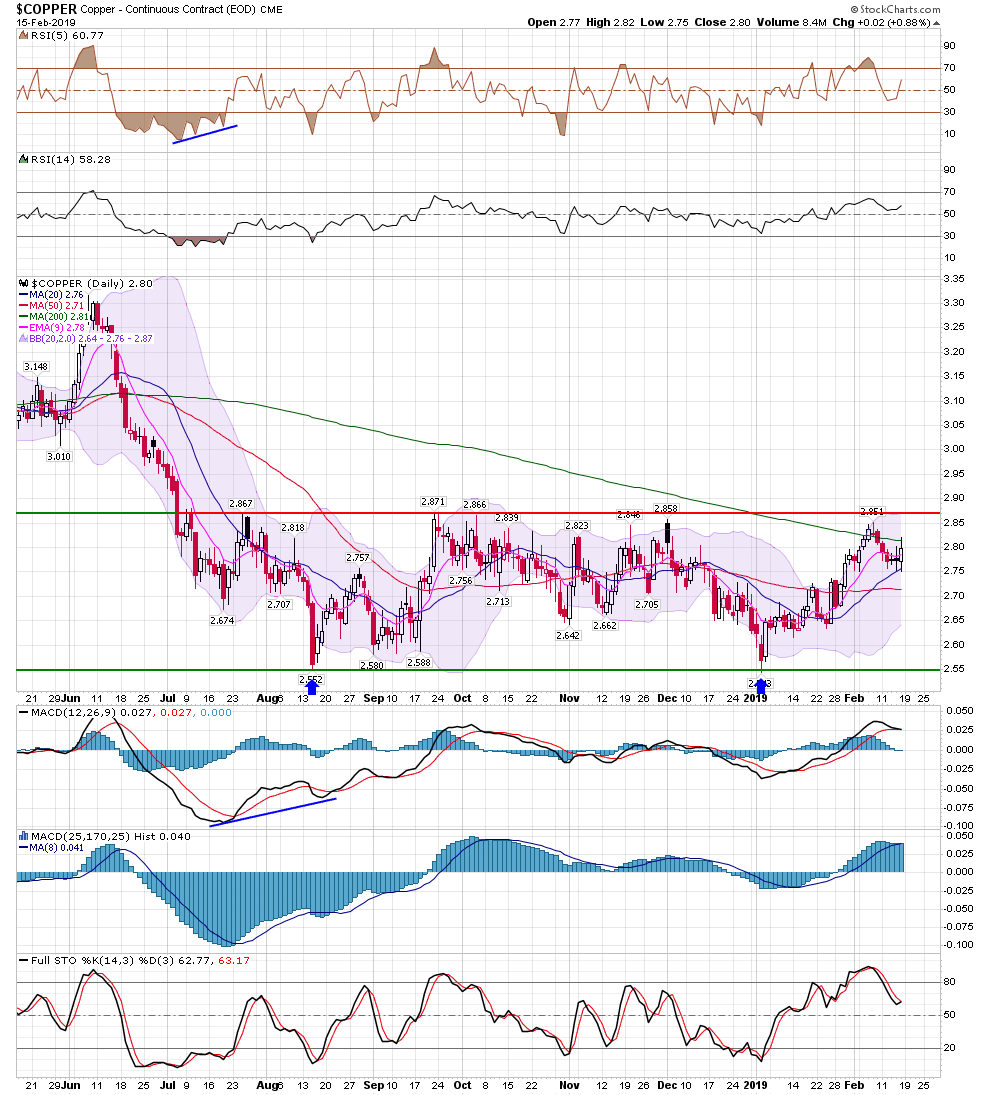
| Copper | COPPER - W | JJCB - W | 0.88% | -0.43% | 2.80 |
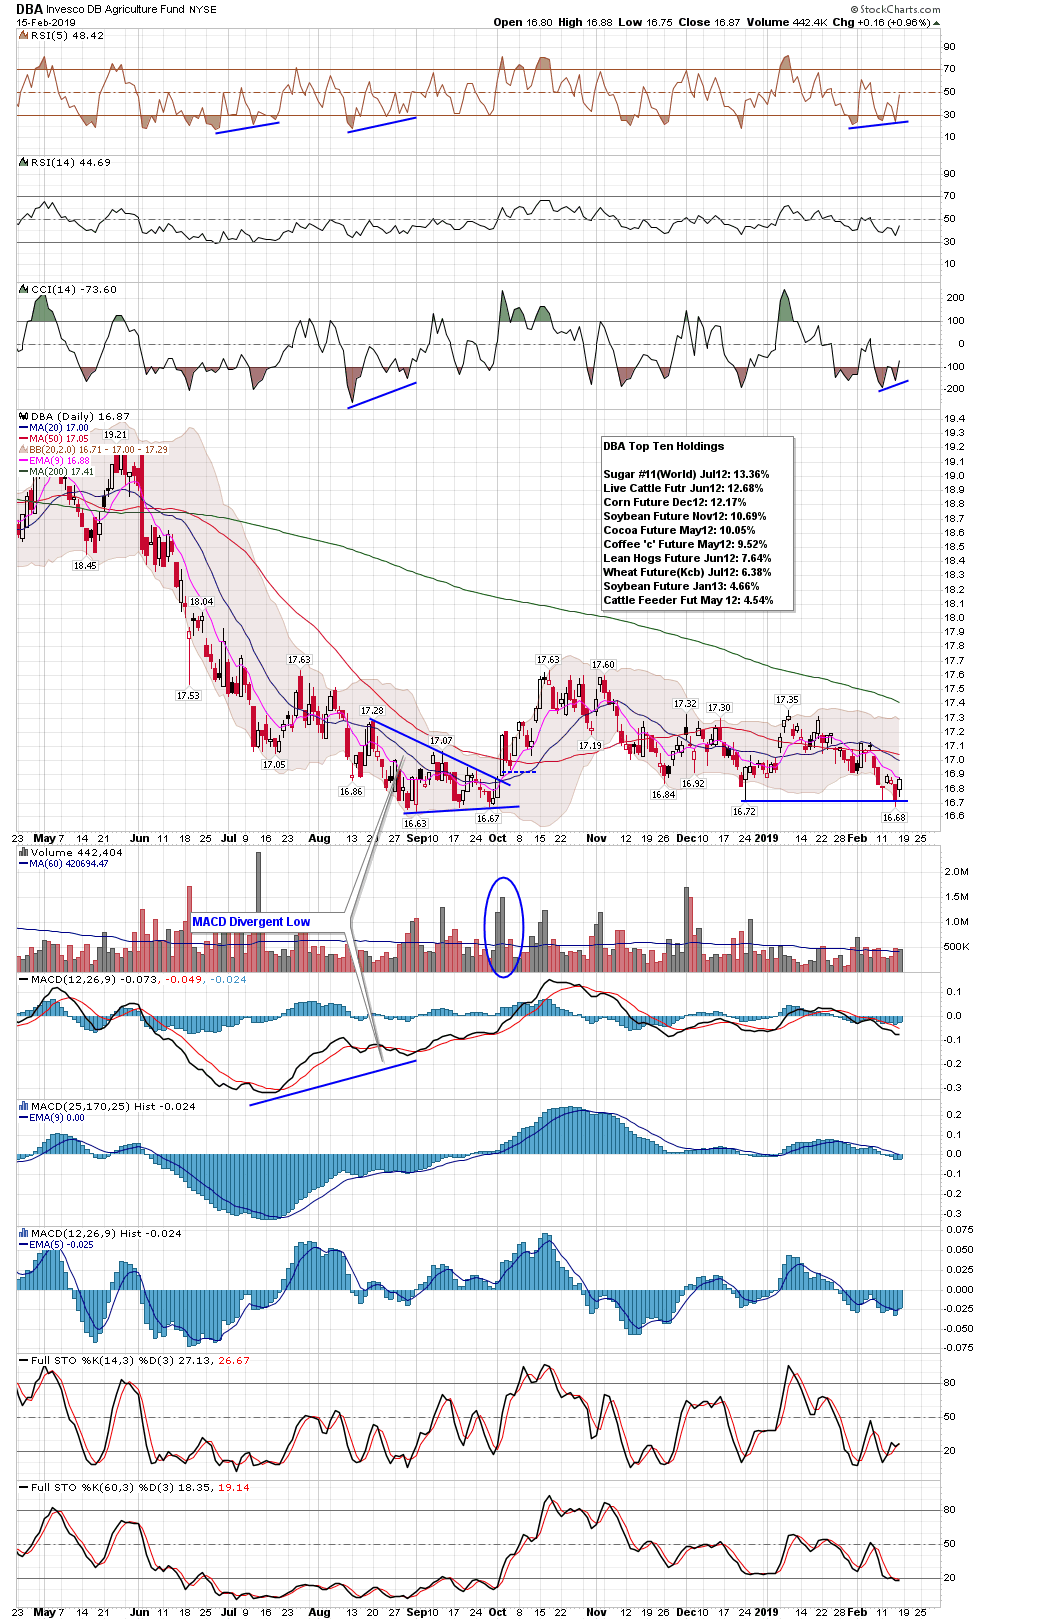
| Agriculture | DBA - W | 0.96% | 0.24% | 16.87 | |
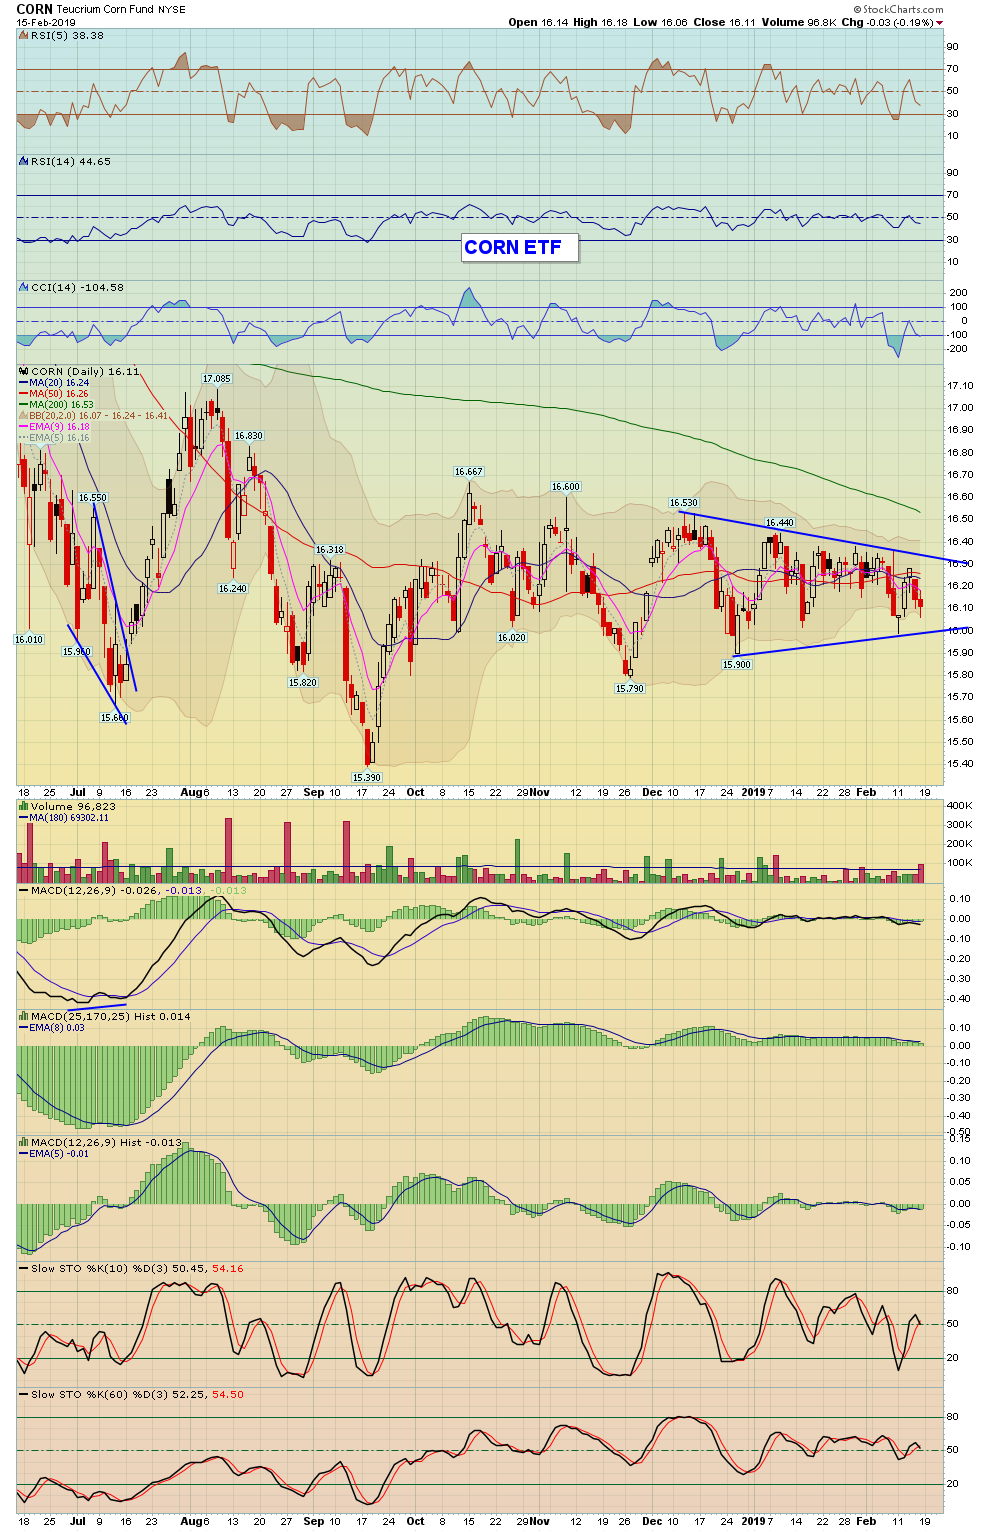
| Corn | CORN - W | CORN - W | 0.00% | 0.13% | 374.75 |
| Wheat | WHEAT - W | WEAT - W | -0.54% | -2.51% | 504.25 |
| Coffee | BJO - W | -2.04% | -3.06% | 41.78 | |
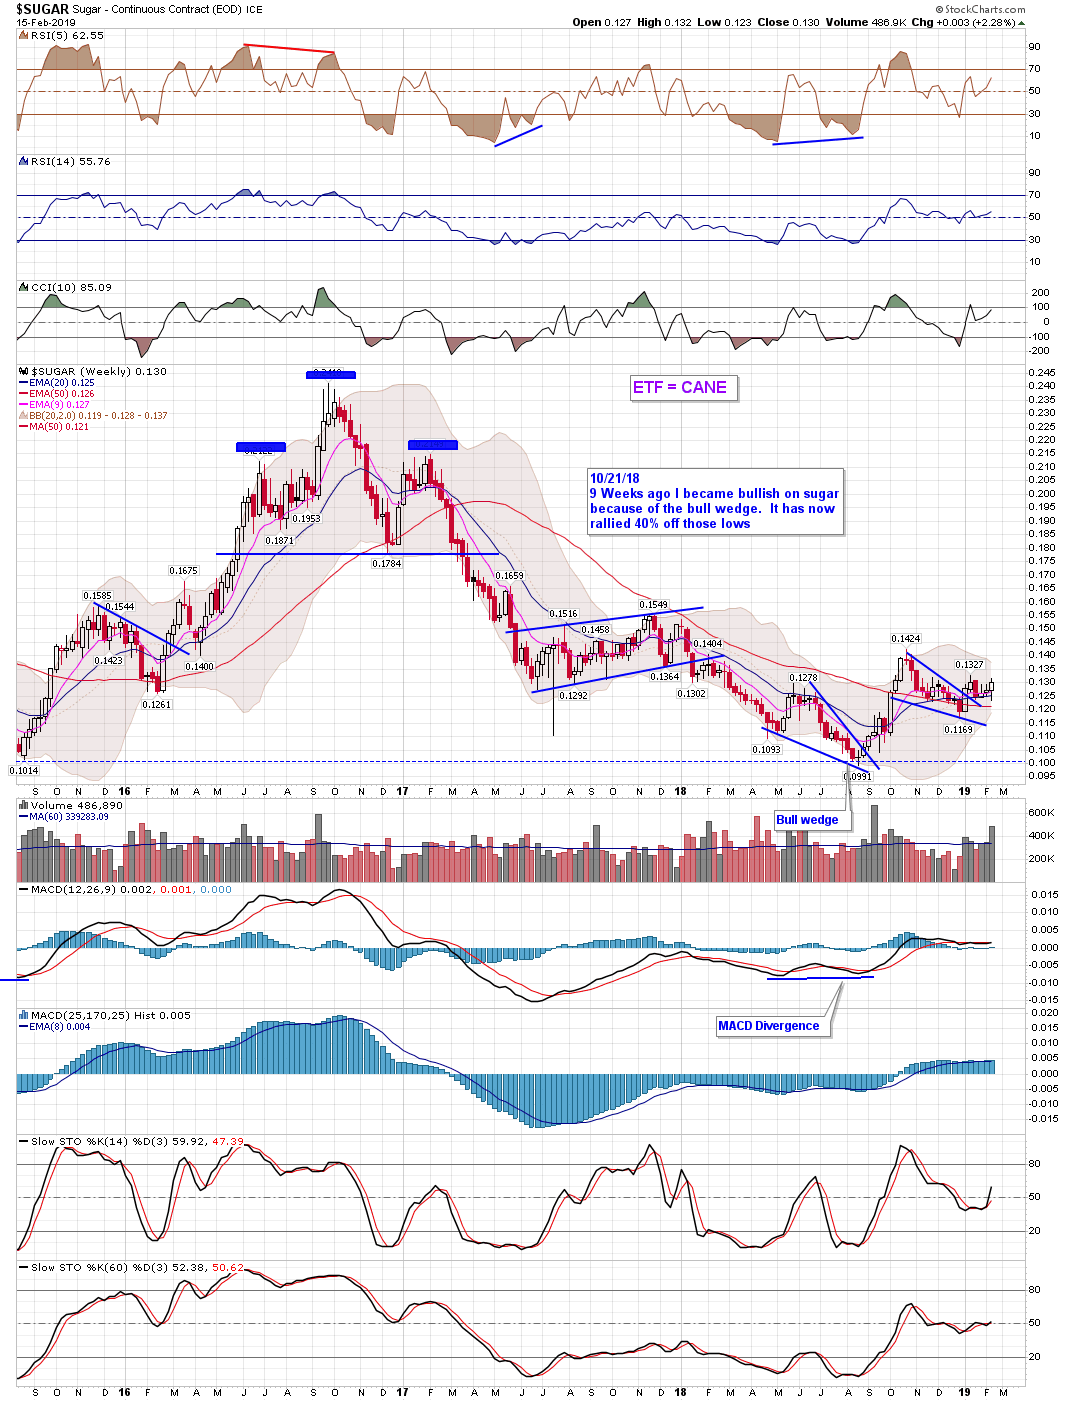
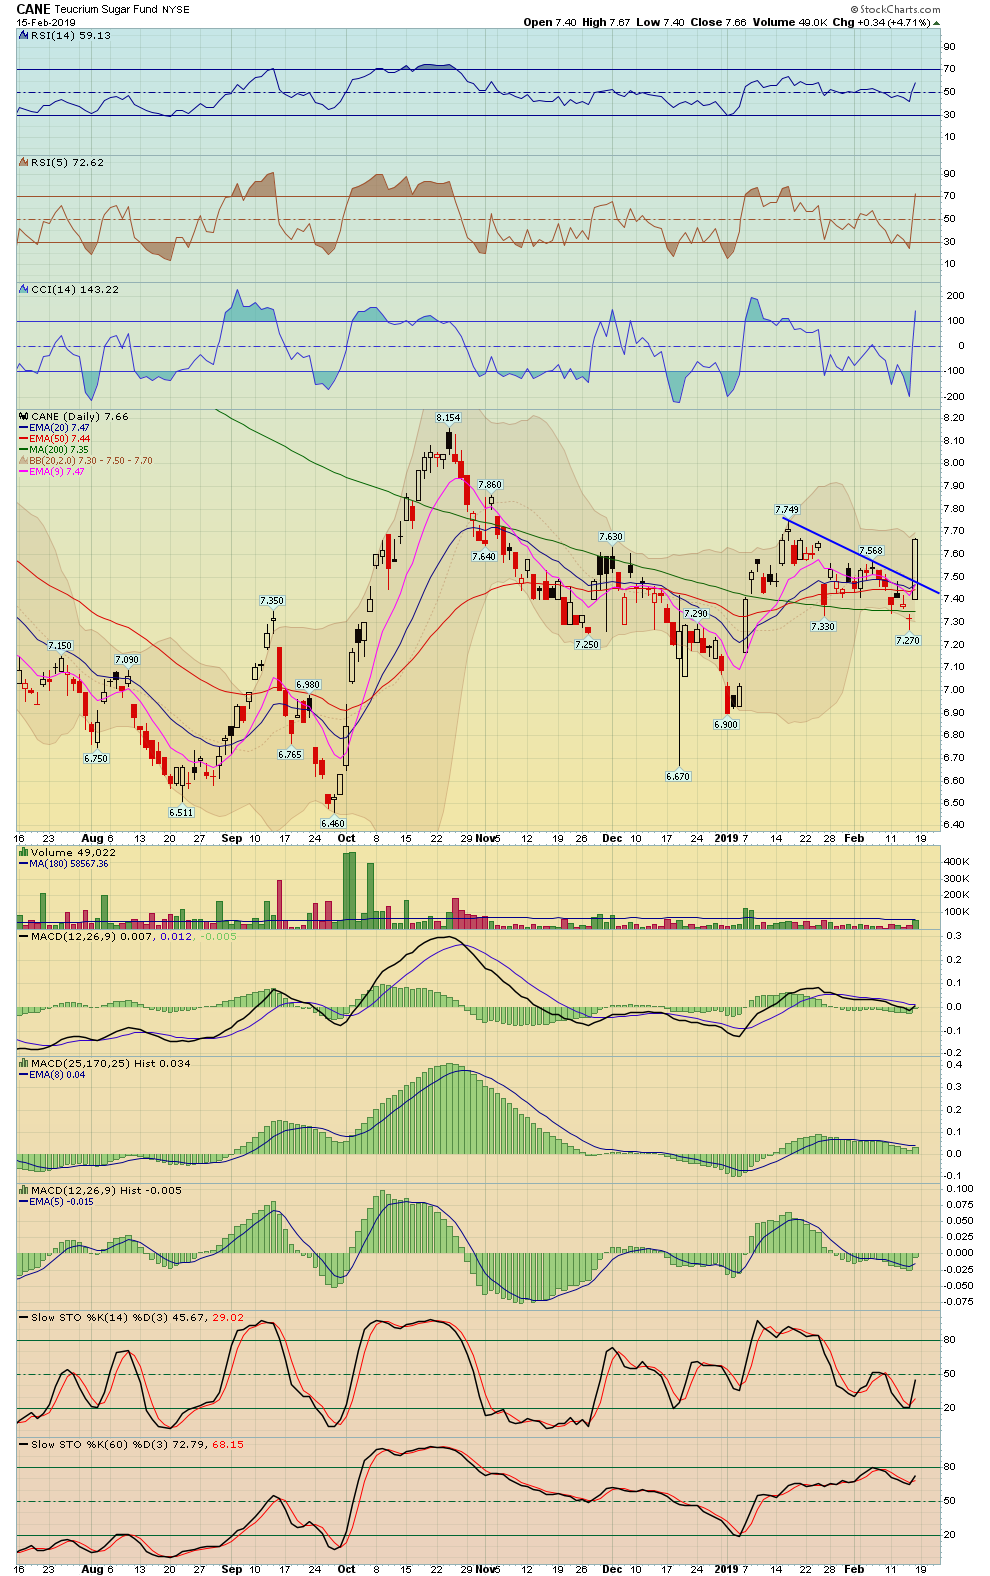
| Sugar | CANE - W | 4.71% | 2.75% | 7.67 |
| Precious Metals | Index Symbol | ETF Symbol | % G / L Day | % G / L Week | Close |
|---|---|---|---|---|---|
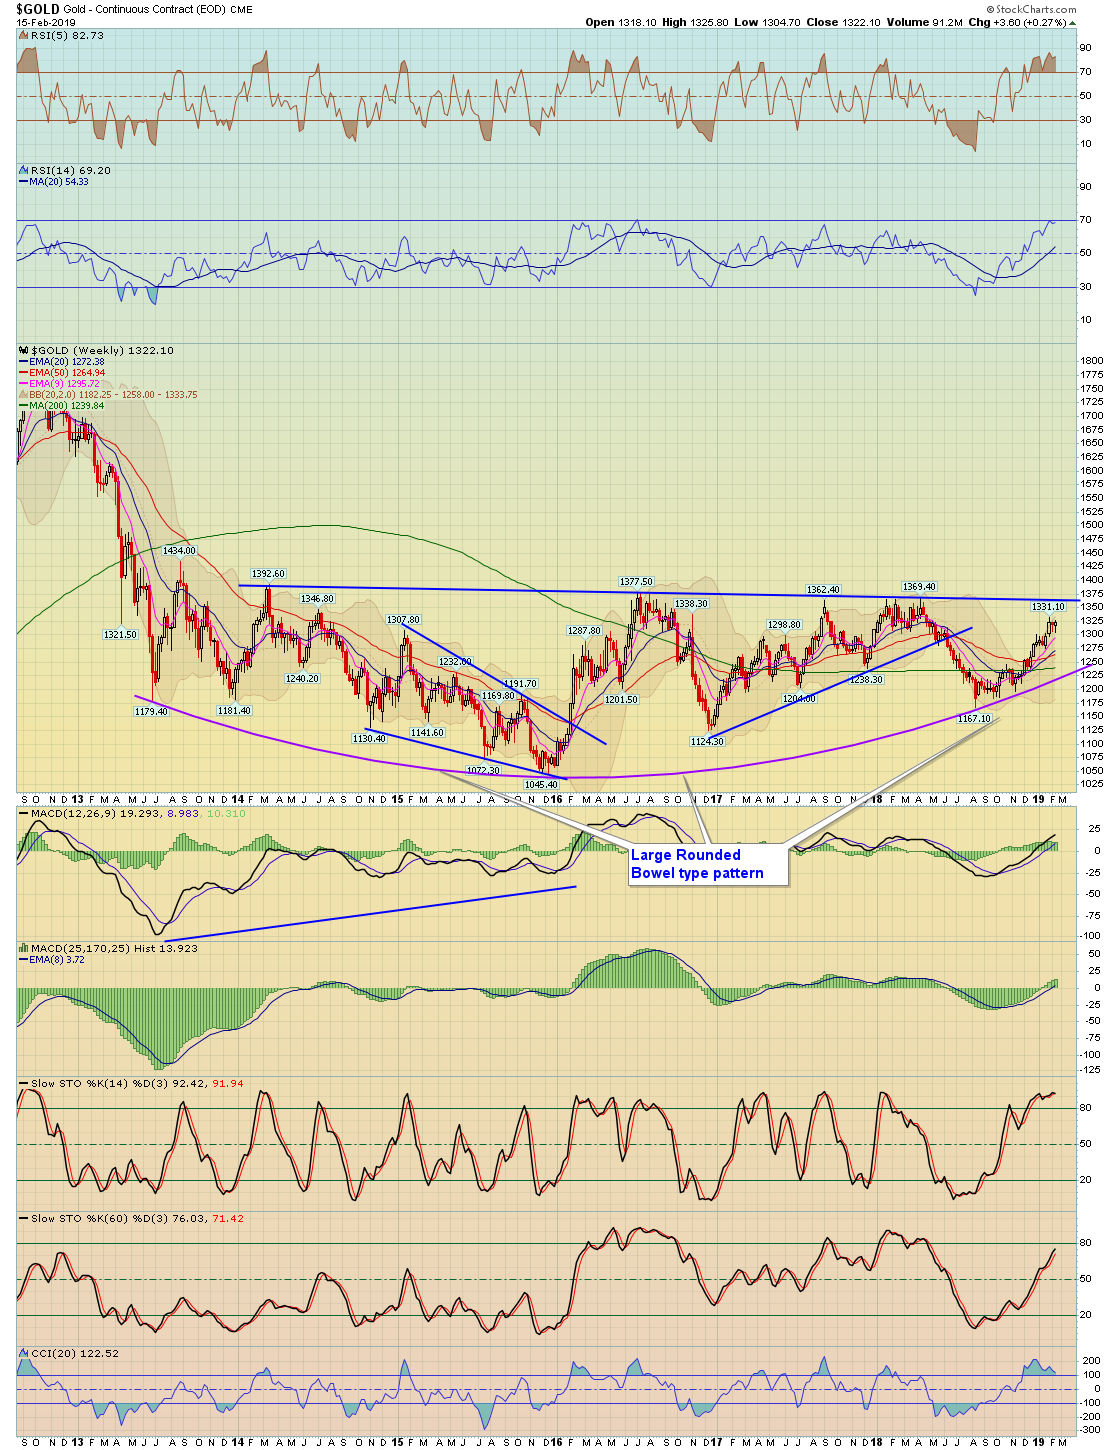
| Gold Metal | GLD - W | 0.60% | 0.48% | 124.80 | |
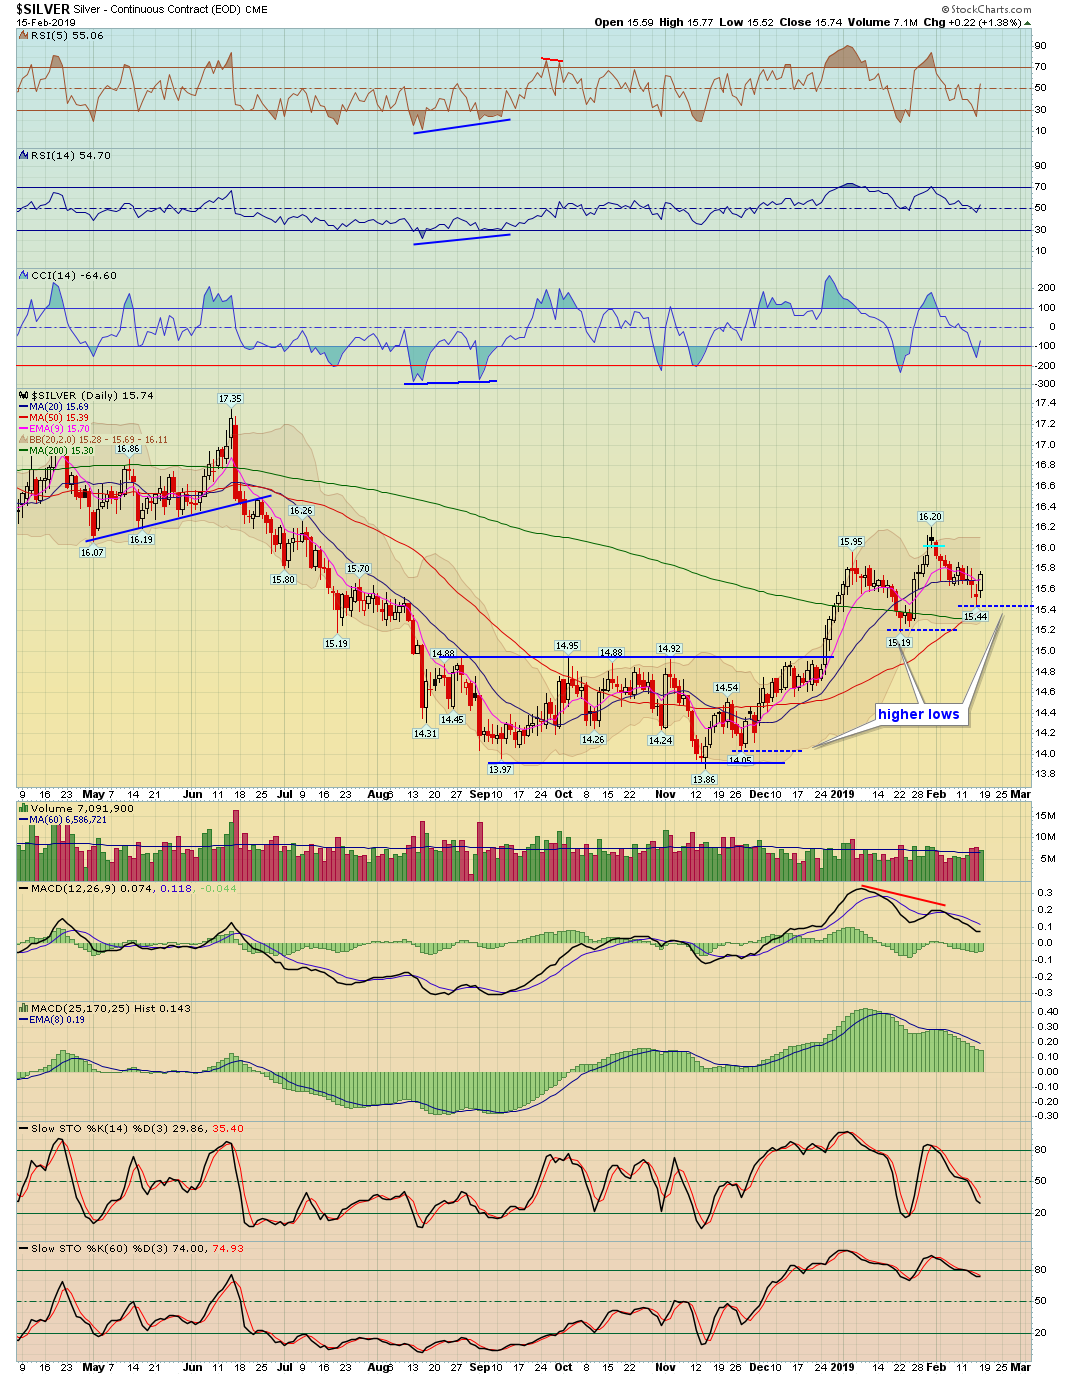
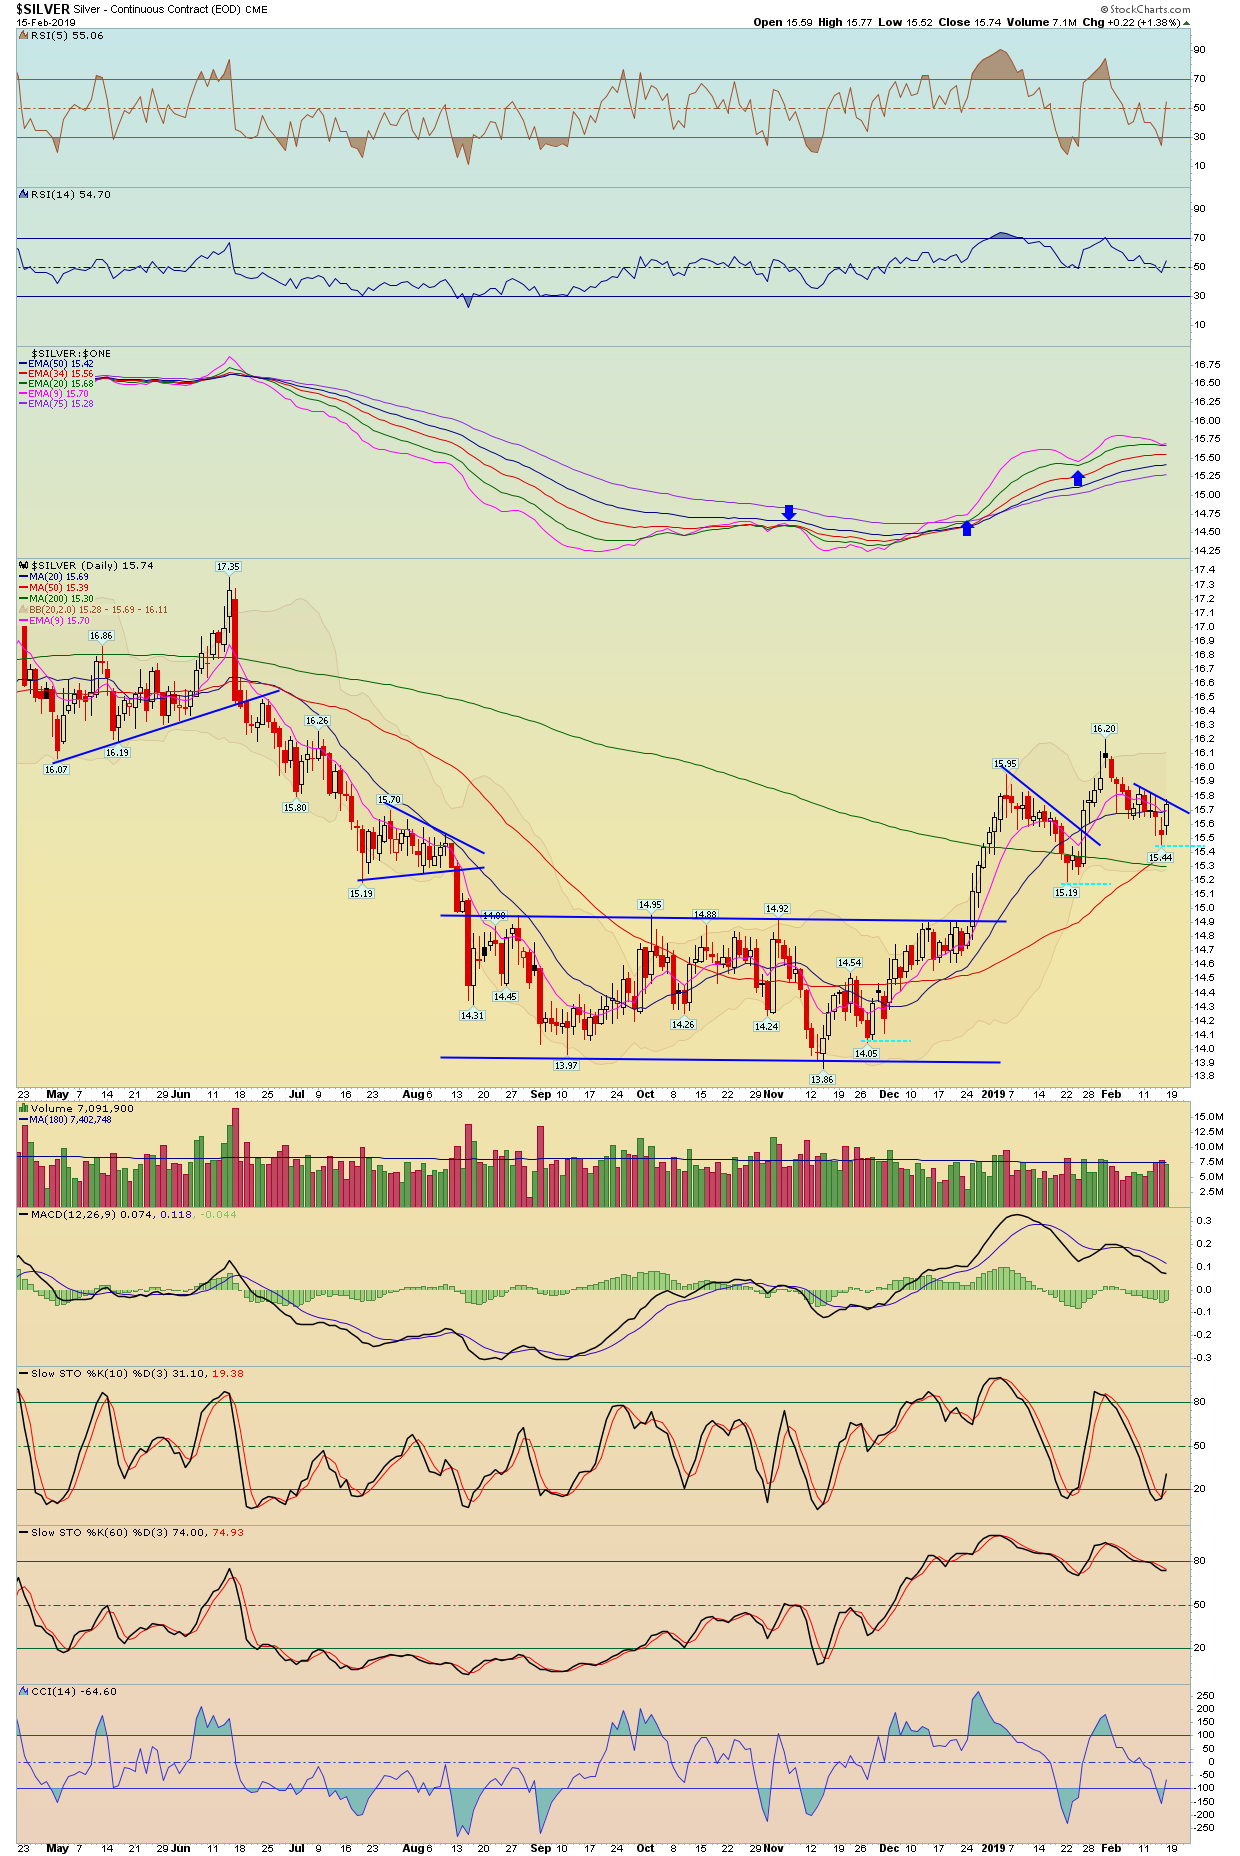
| Silver | SLV - W | 1.16% | -0.07% | 14.82 | |
| Platinum | PPLT - W | 2.57% | 0.90% | 76.52 | |
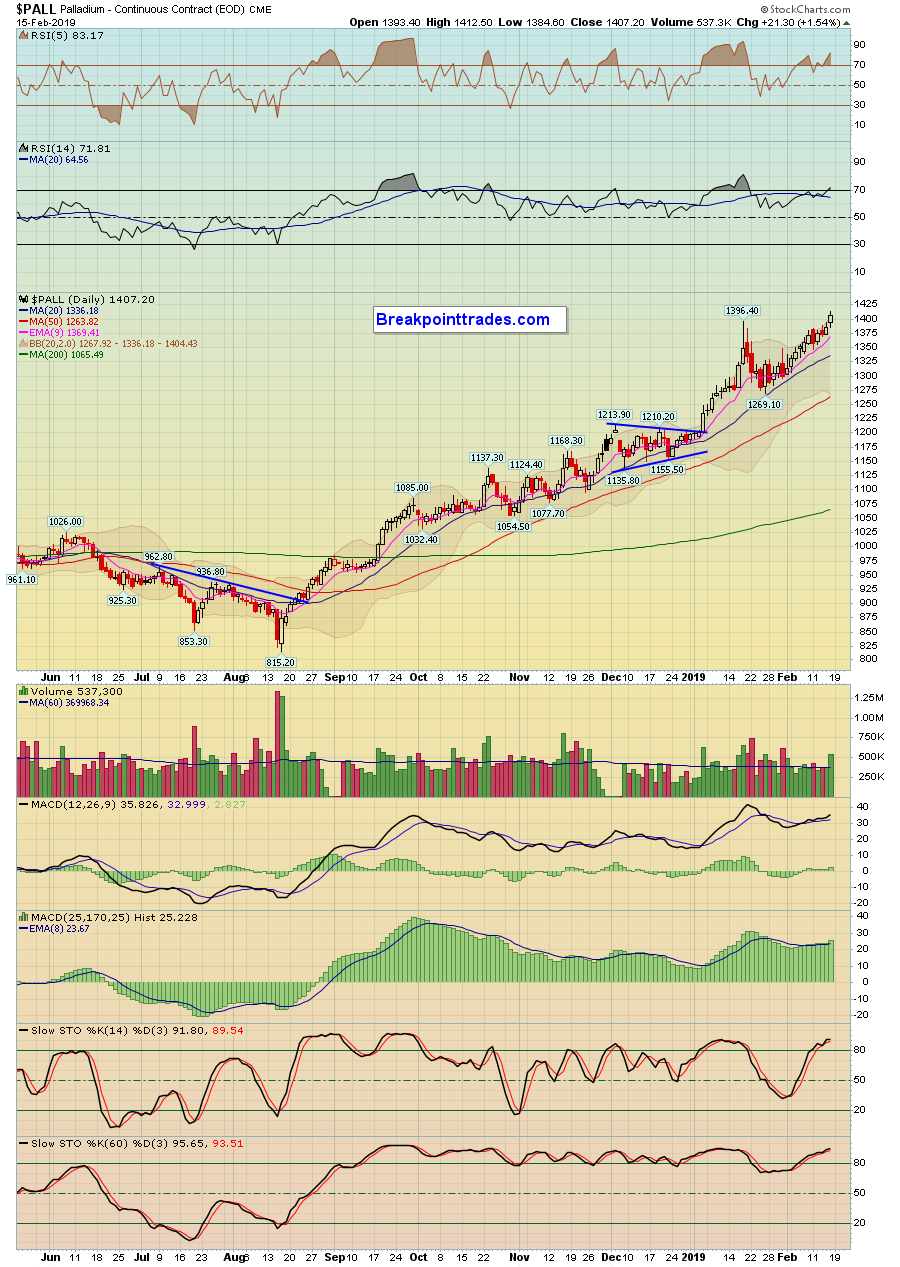
| Palladium | PALL - W | 1.14% | 2.85% | 136.54 | |
| GDX Gold Miners ETF | GDX - W | 1.31% | 0.40% | 22.43 |
| Bonds | Index Symbol | ETF Symbol | % G / L Day | % G / L Week | Close |
|---|---|---|---|---|---|
| High Yield Corporate Bond | HYG - W | 0.32% | 0.72% | 85.40 | |
| TLT 20 Year Bond ETF | TLT - W | 0.16% | -0.30% | 121.98 | |
| 10 Year Treasury Yield | TNX - W | 0.34% | 1.29% | 26.66 | |
| 30 Year Treasury Yield | TYX - W | -0.33% | 0.71% | 29.97 |
3
Week of February 18 - February 22
| Date | ET | Release | For | Actual | Briefing.com Forecast | Briefing.com Consensus | Prior | Revised From |
|---|---|---|---|---|---|---|---|---|
| Feb 19 | 10:00 | NAHB Housing Market Index | Feb | 59 | 59 | 58 | ||
| Feb 20 | 07:00 | MBA Mortgage Applications Index | 02/16 | NA | NA | -3.7% | ||
| Feb 20 | 14:00 | FOMC Minutes | Jan | NA | NA | NA | ||
| Feb 21 | 08:30 | Durable Orders | Dec | 1.7% | 1.3% | 0.8% | ||
| Feb 21 | 08:30 | Durable Goods ex-transportation | Dec | 0.3% | 0.2% | -0.3% | ||
| Feb 21 | 08:30 | Initial Claims | 02/16 | 231K | 225K | 239K | ||
| Feb 21 | 08:30 | Continuing Claims | 02/09 | NA | NA | 1773K | ||
| Feb 21 | 08:30 | Philadelphia Fed Index | Feb | 14 | 12 | 17.0 | ||
| Feb 21 | 10:00 | Existing Home Sales | Jan | 5.1M | 5.05M | 4.99M | ||
| Feb 21 | 10:00 | Leading Indicators | Jan | 0.1% | 0.1% | -0.1% | ||
| Feb 21 | 10:30 | EIA Natural Gas Inventories | 02/16 | NA | NA | -78 bcf | ||
| Feb 21 | 11:00 | EIA Crude Oil Inventories | 02/16 | NA | NA | +3.6M |

Stock Earnings Calender:
Click here for a list of Stocks that are reporting Earnings
**Generally we never hold a position into earnings since the risk/reward is too great
4 - View Live Chart
5 - View Live Chart
6 - View Live Chart
7 - View Live Chart
8 - View Live Chart
9 - View Live Chart
10 - View Live Chart
11 - View Live Chart
12 - View Live Chart
13 - View Live Chart
14 - View Live Chart
15
16
17 - View Live Chart
18 - View Live Chart
19 - View Live Chart
20 - View Live Chart
21 - View Live Chart
22 - View Live Chart
23 - View Live Chart
24 - View Live Chart
25 - View Live Chart
26 - View Live Chart
27 - View Live Chart
28 - View Live Chart
29 - View Live Chart
30 - View Live Chart
31 - View Live Chart
32 - View Live Chart
33 - View Live Chart
34 - View Live Chart
35 - View Live Chart
36 - View Live Chart
37 - View Live Chart
38 - View Live Chart
39 - View Live Chart
40 - View Live Chart
41 - View Live Chart
42 - View Live Chart
43 - View Live Chart
44 - View Live Chart
45 - View Live Chart
46 - View Live Chart
47 - View Live Chart
48 - View Live Chart
49 - View Live Chart
50 - View Live Chart
51 - View Live Chart
52 - View Live Chart
53 - View Live Chart
54 - View Live Chart
55 - View Live Chart
56 - View Live Chart
57 - View Live Chart
58 - View Live Chart
59 - View Live Chart
60 - View Live Chart
61 - View Live Chart
62 - View Live Chart
63 - View Live Chart
64 - View Live Chart
65 - View Live Chart
66 - View Live Chart
67 - View Live Chart
68 - View Live Chart
69 - View Live Chart
70 - View Live Chart
71 - View Live Chart
72 - View Live Chart
73 - View Live Chart
74 - View Live Chart
75 - View Live Chart
76 - View Live Chart
77 - View Live Chart
78 - View Live Chart
79 - View Live Chart
80 - View Live Chart
81 - View Live Chart
82 - View Live Chart
83 - View Live Chart
84 - View Live Chart
85 - View Live Chart
86 - View Live Chart
87 - View Live Chart
88 - View Live Chart
89 - View Live Chart
90 - View Live Chart
91 - View Live Chart
92 - View Live Chart
93 - View Live Chart
94 - View Live Chart
95 - View Live Chart
96 - View Live Chart
97 - View Live Chart
98 - View Live Chart
99 - View Live Chart
100 - View Live Chart
101 - View Live Chart
102 - View Live Chart
103 - View Live Chart
104 - View Live Chart
105 - View Live Chart
106 - View Live Chart
107 - View Live Chart
108 - View Live Chart
109 - View Live Chart
110
111
112
113
114
115
116
- Hide Player Link to Newsletter Audio
Update Required
To play the media you will need to either update your browser to a recent version or update your Flash plugin.
- Hide Player Link to Newsletter Audio
Update Required
To play the media you will need to either update your browser to a recent version or update your Flash plugin.
- Hide Player Link to Newsletter Audio
Update Required
To play the media you will need to either update your browser to a recent version or update your Flash plugin.