Thursday December 13th, 2018 Newsletter - free
Disclaimer: Intraday Chart Links will show up as daily charts unless you have an active stockcharts.com membership and are signed in, you can sign up here.
1
Table of Contents:
1. General Market Analysis: SPX and Other Major Indices
2. Review of Select Sectors
3. Glance at Currencies and Commodities
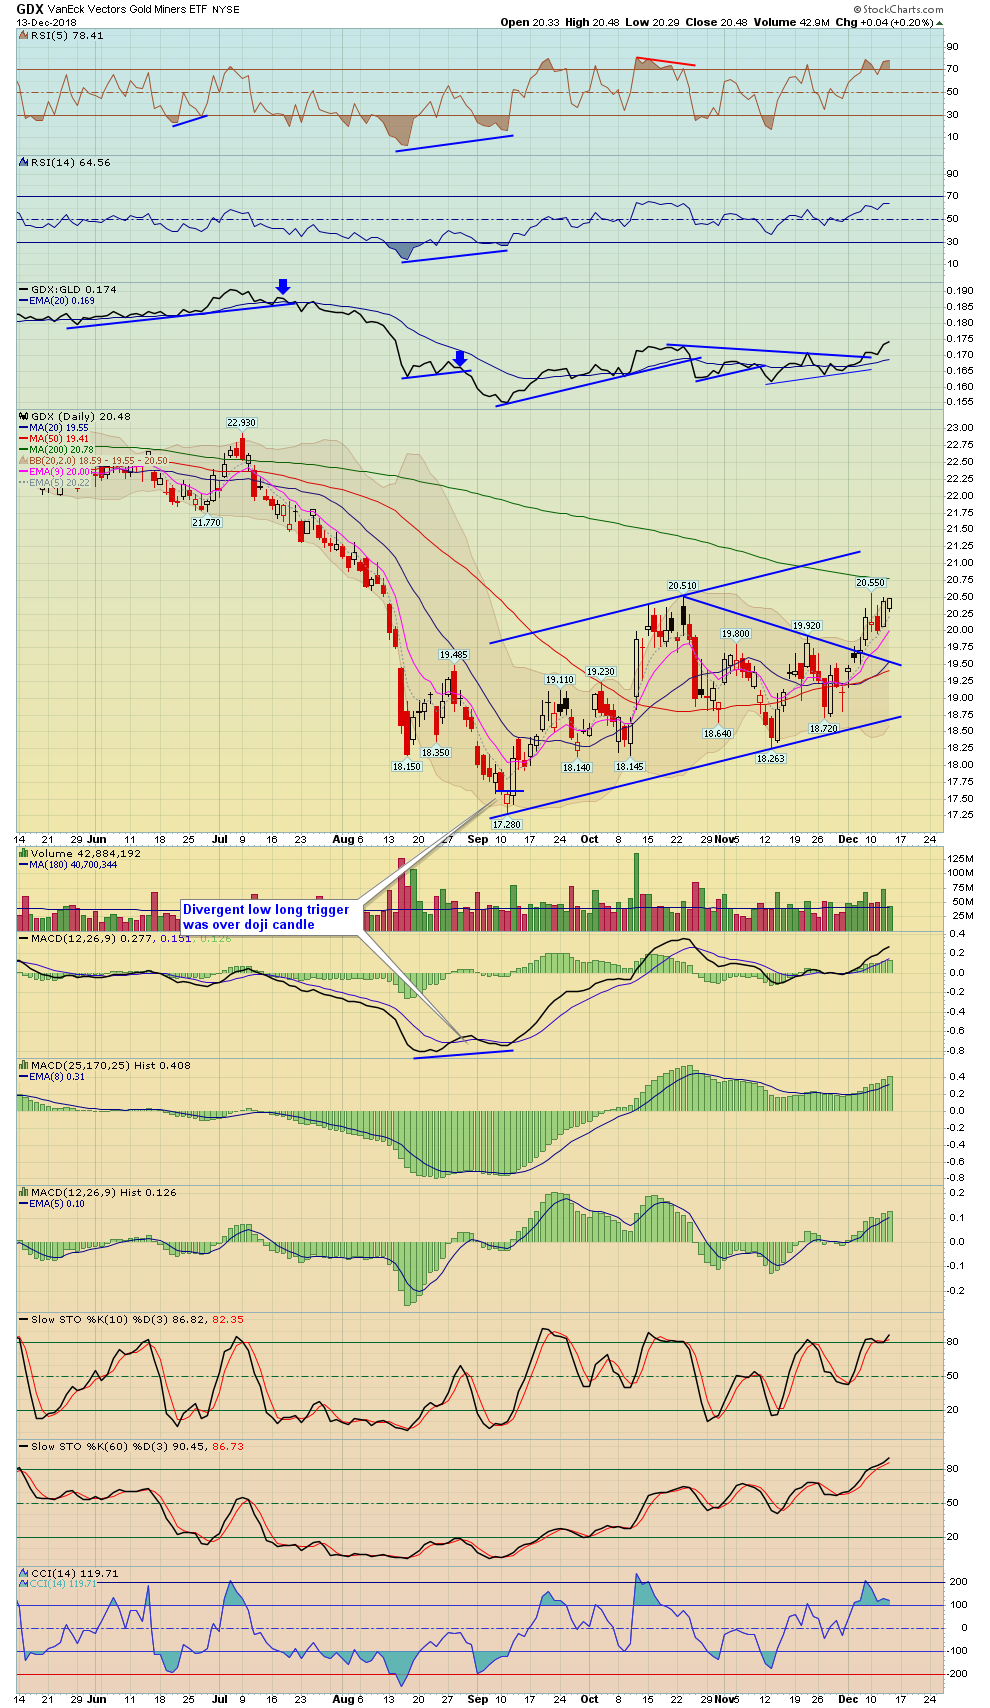
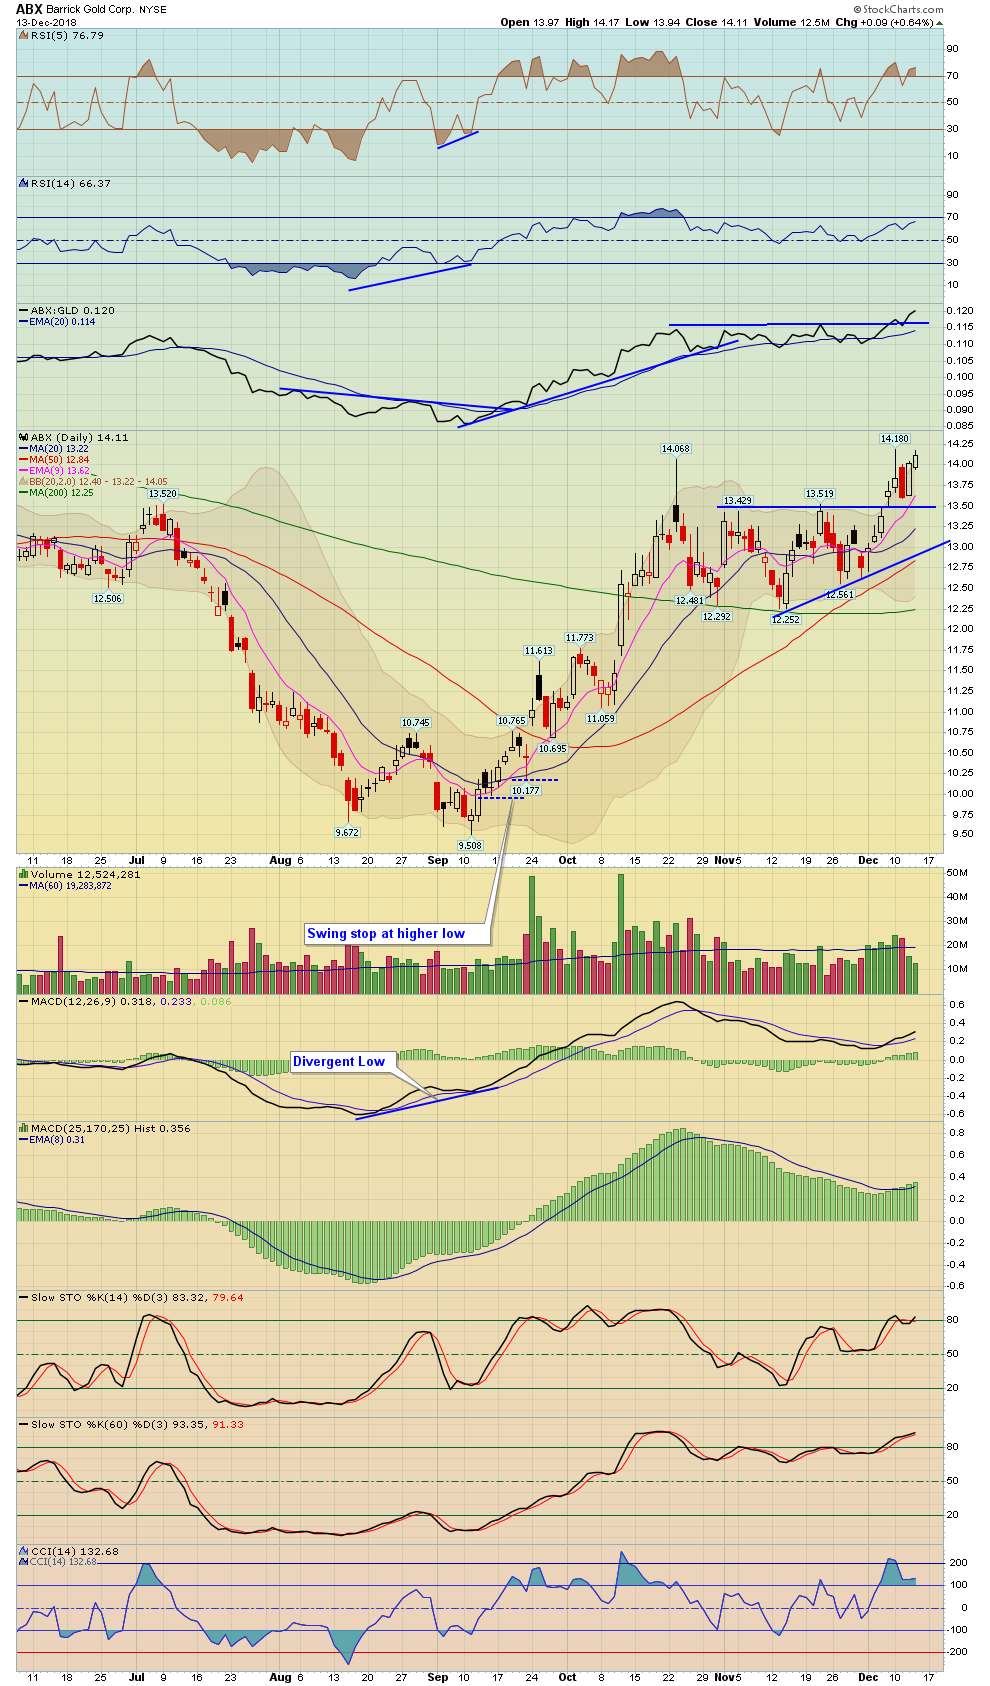
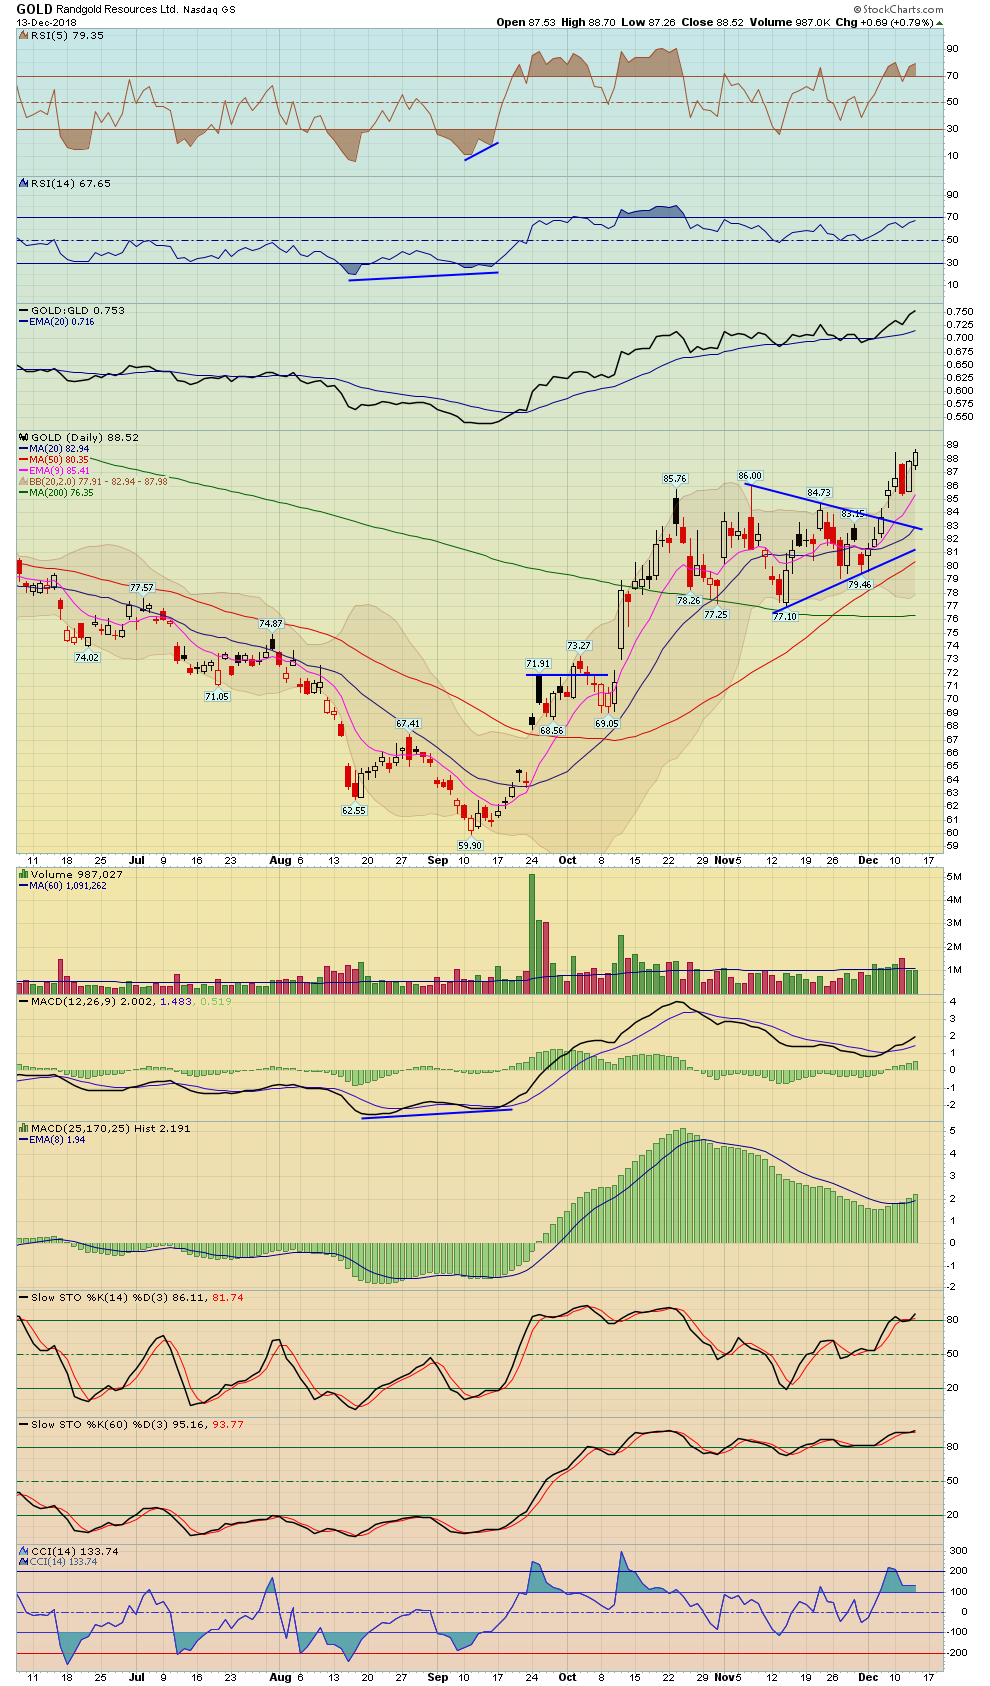
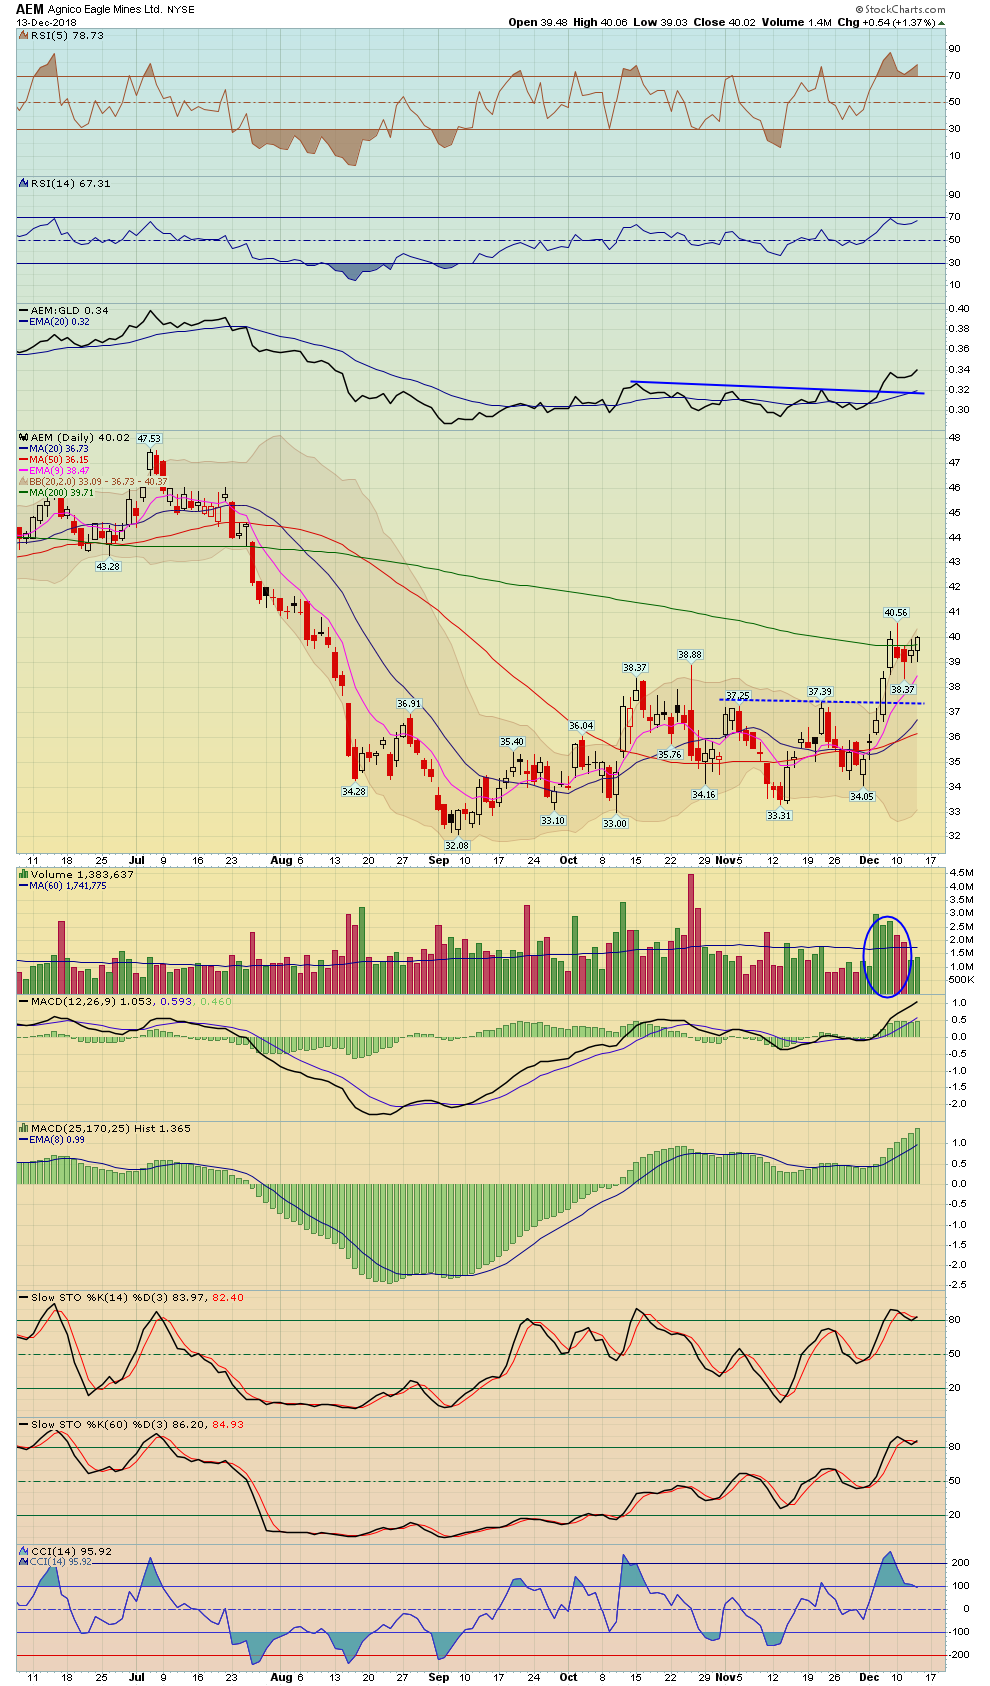
4. Precious Metals and GDX
5. Trade Ideas
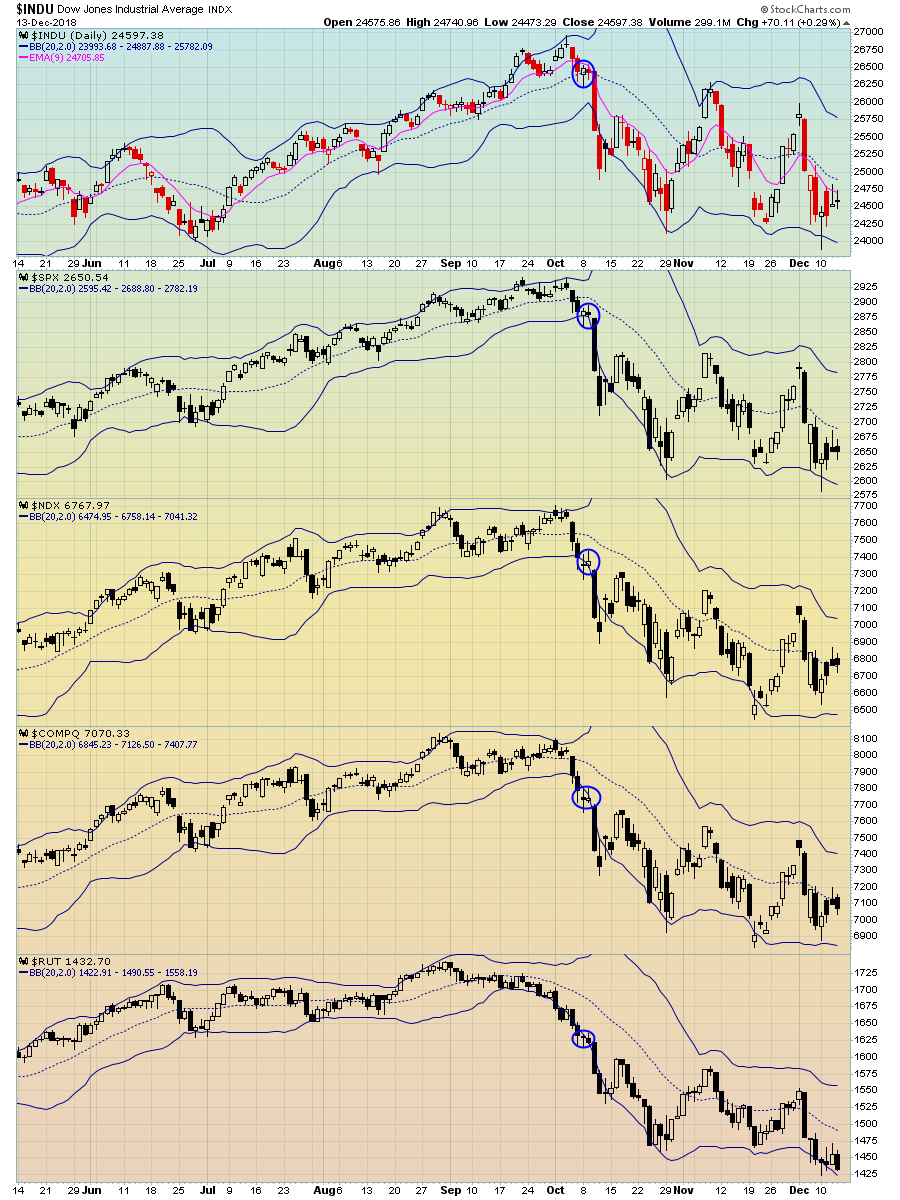
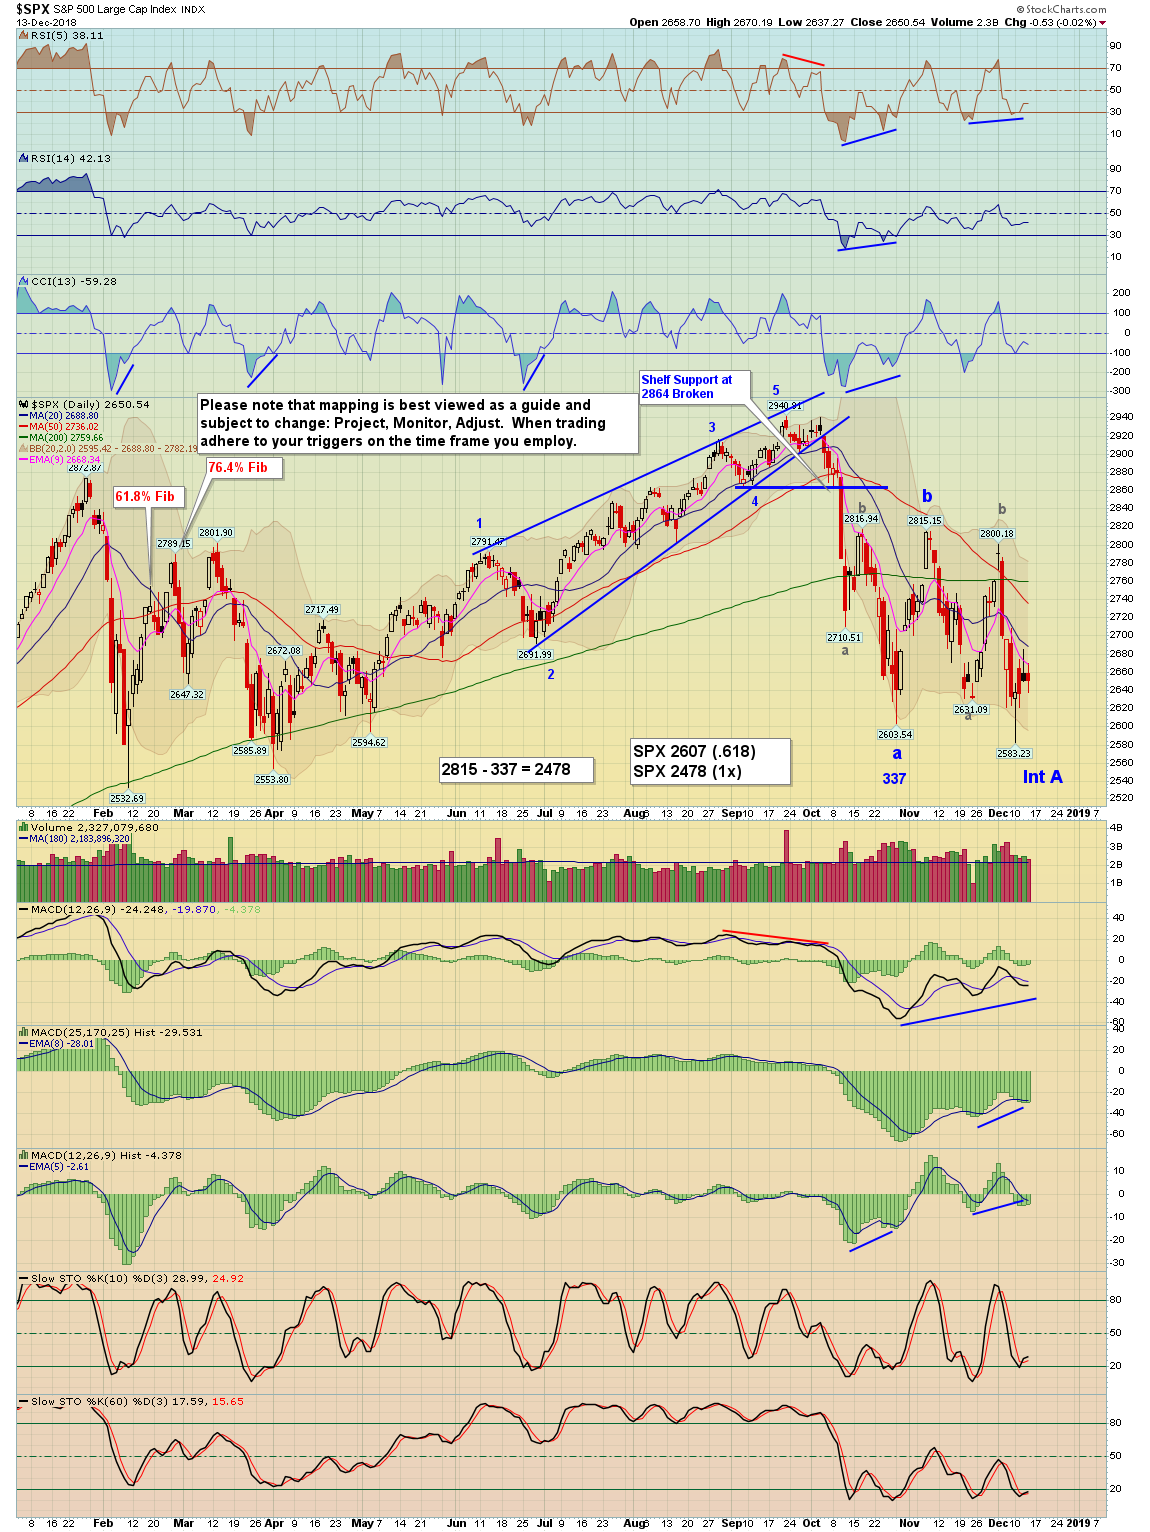
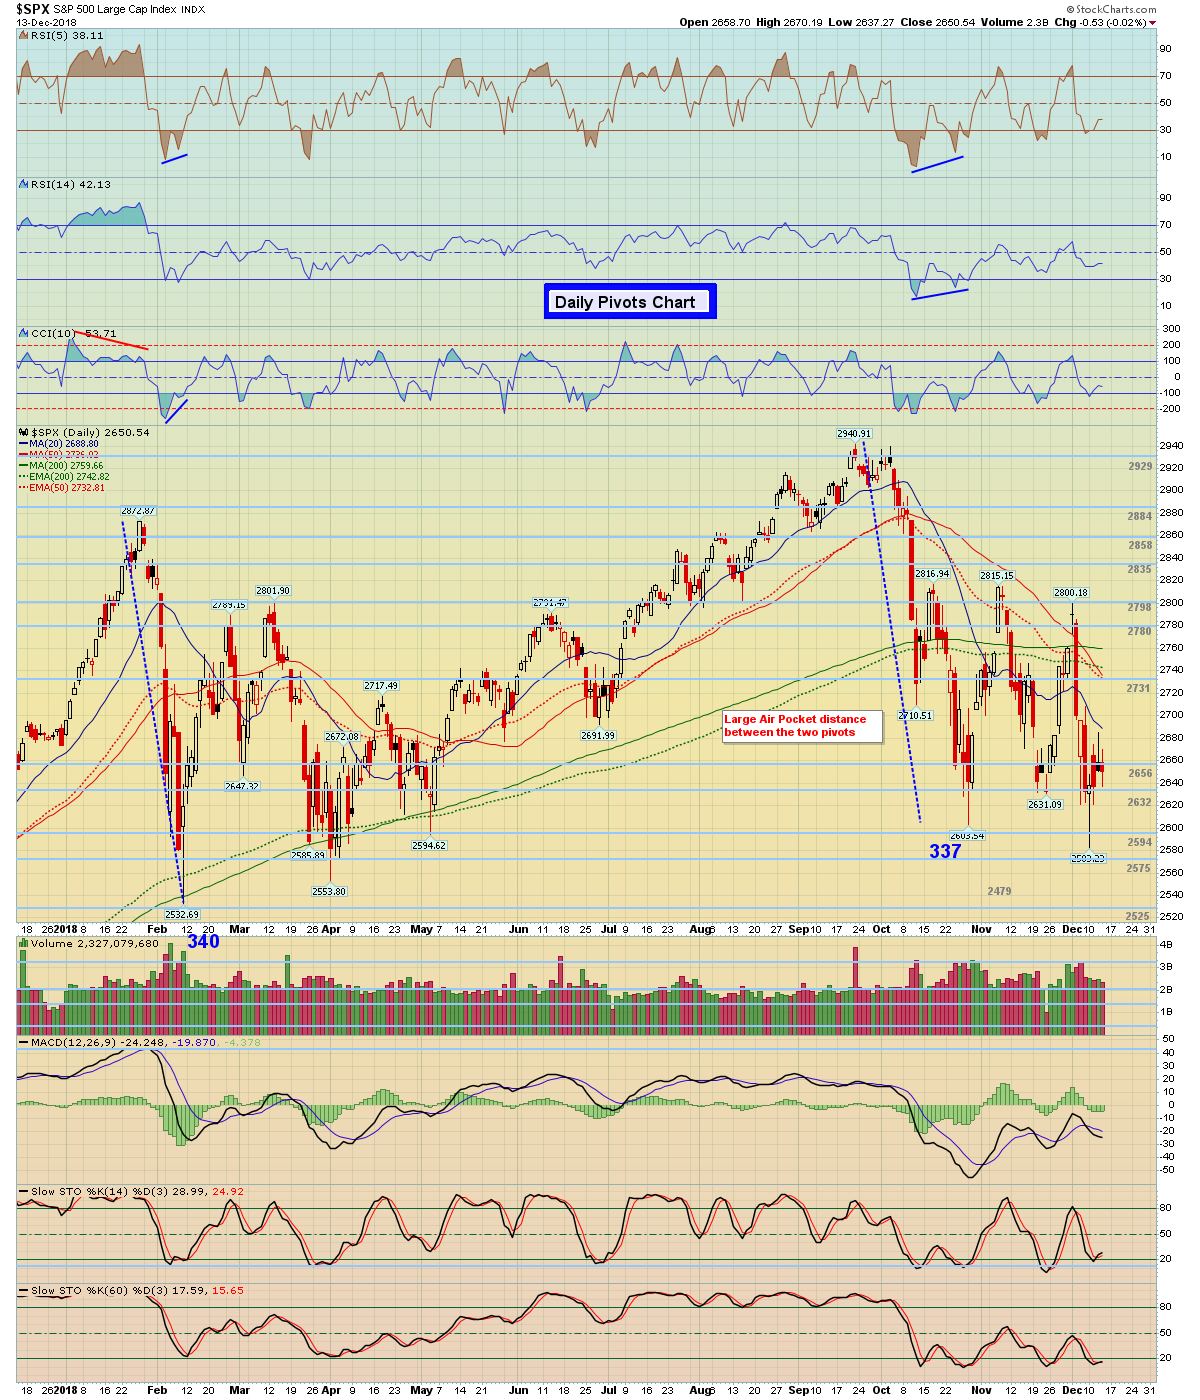
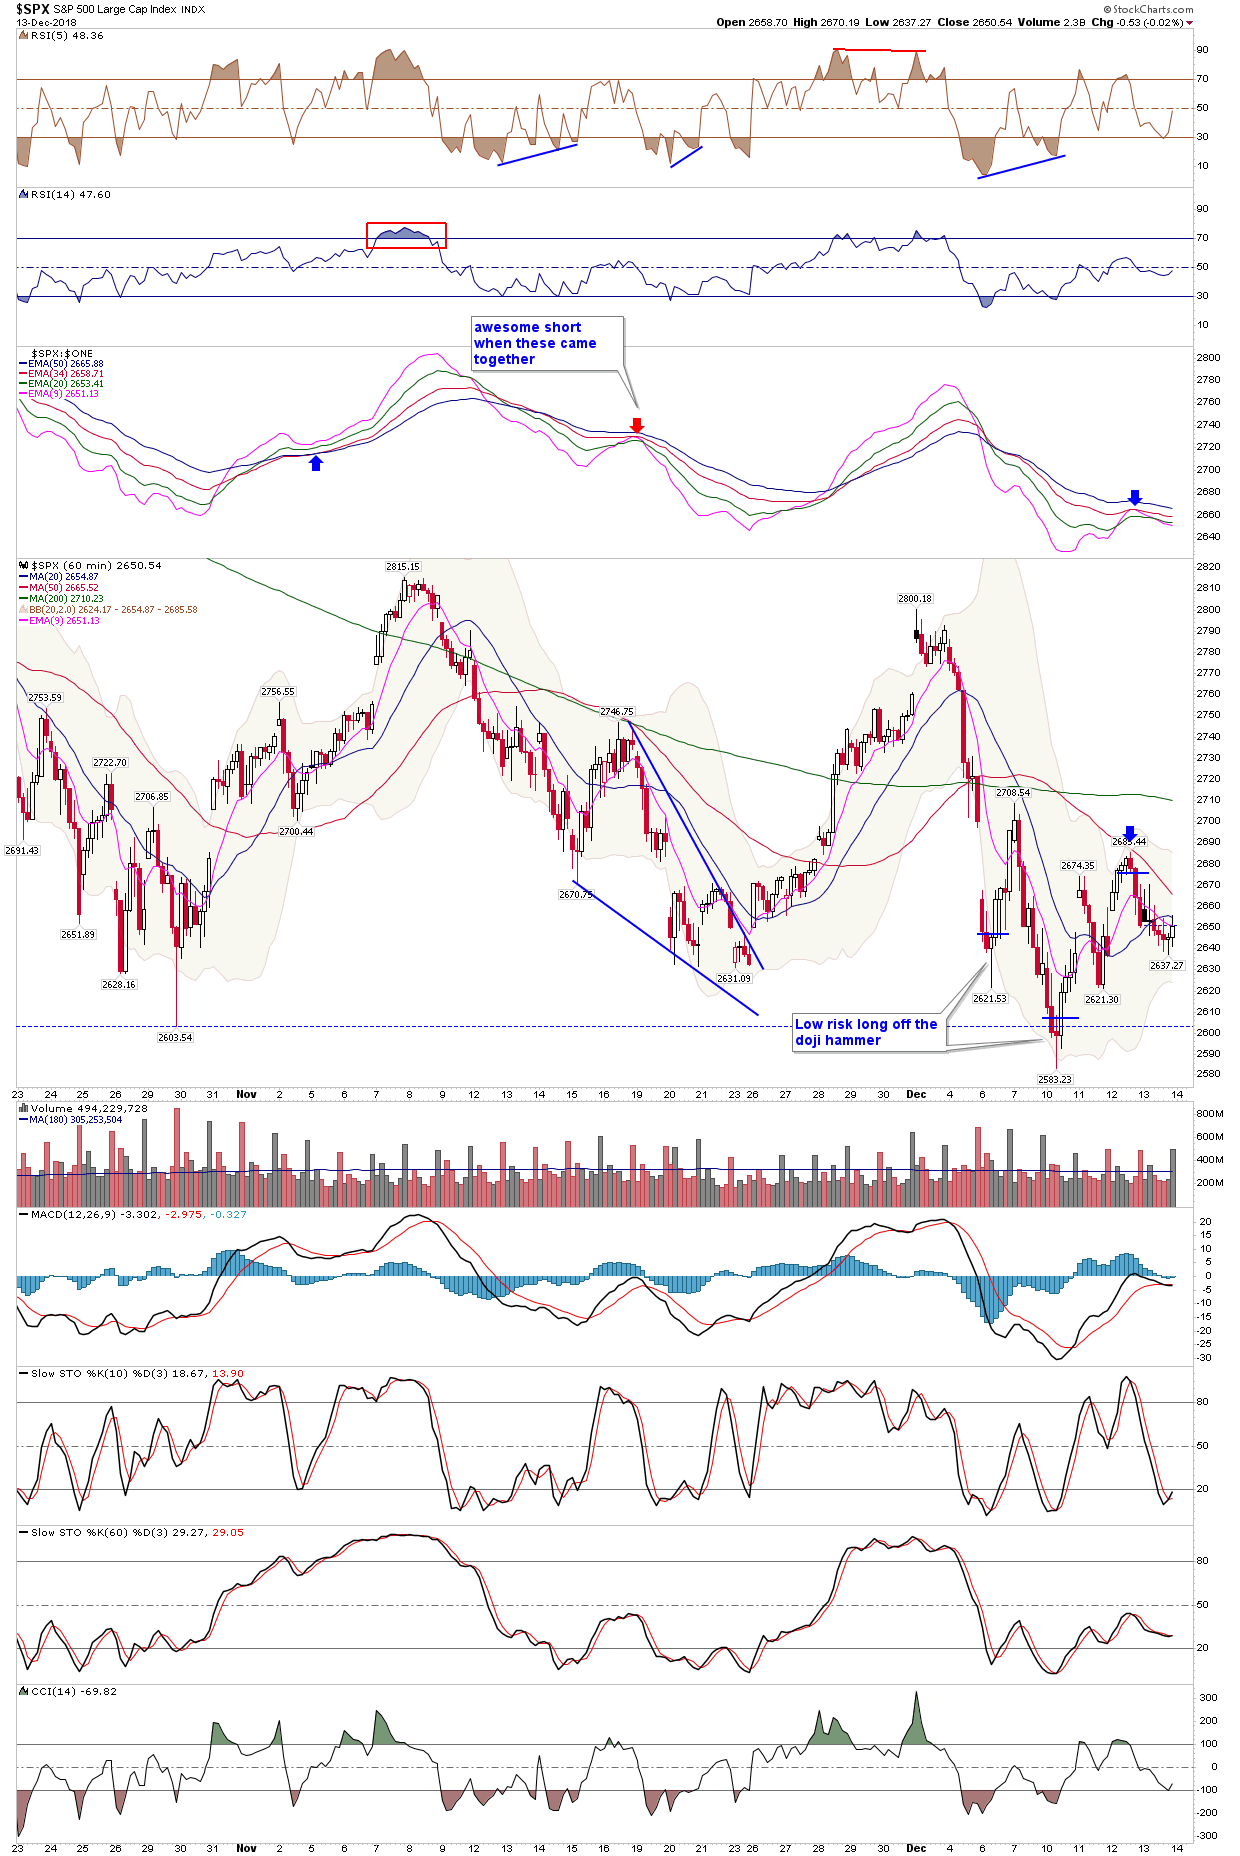
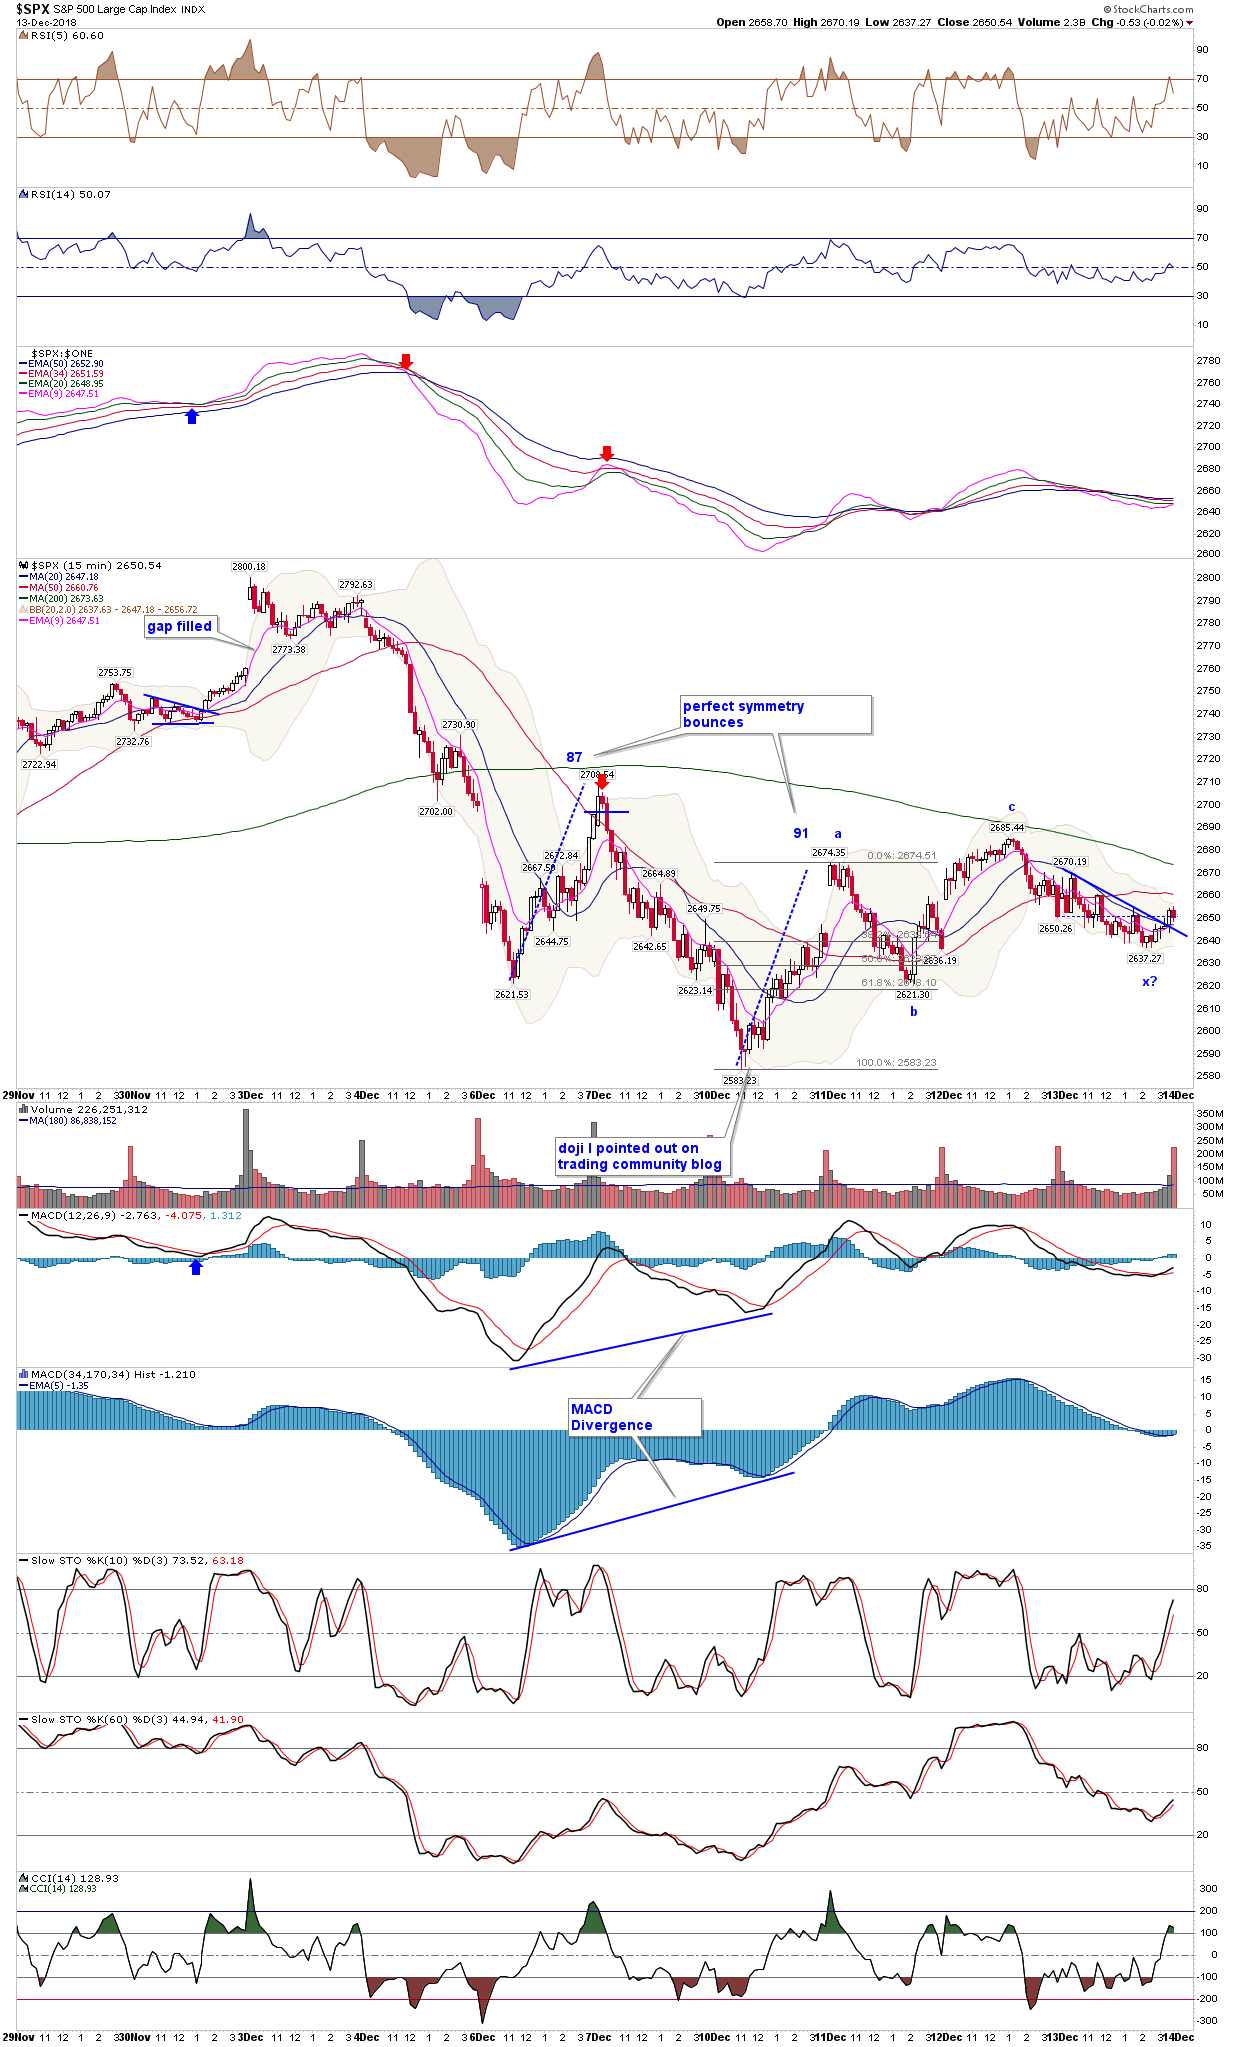
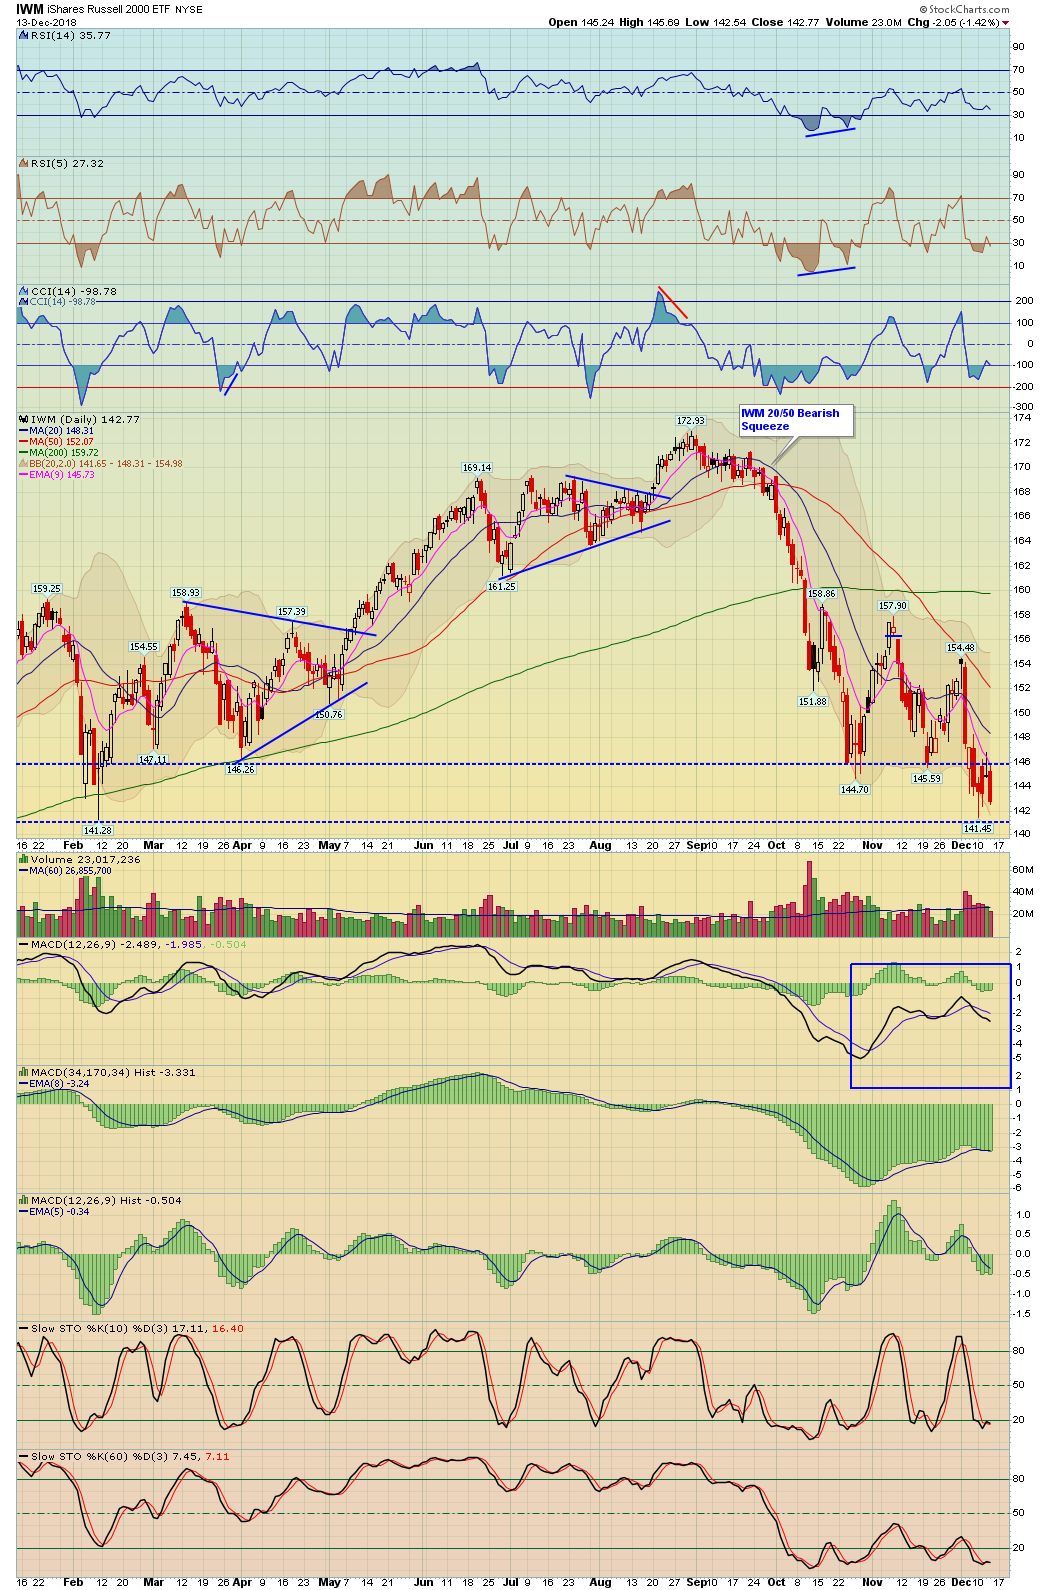
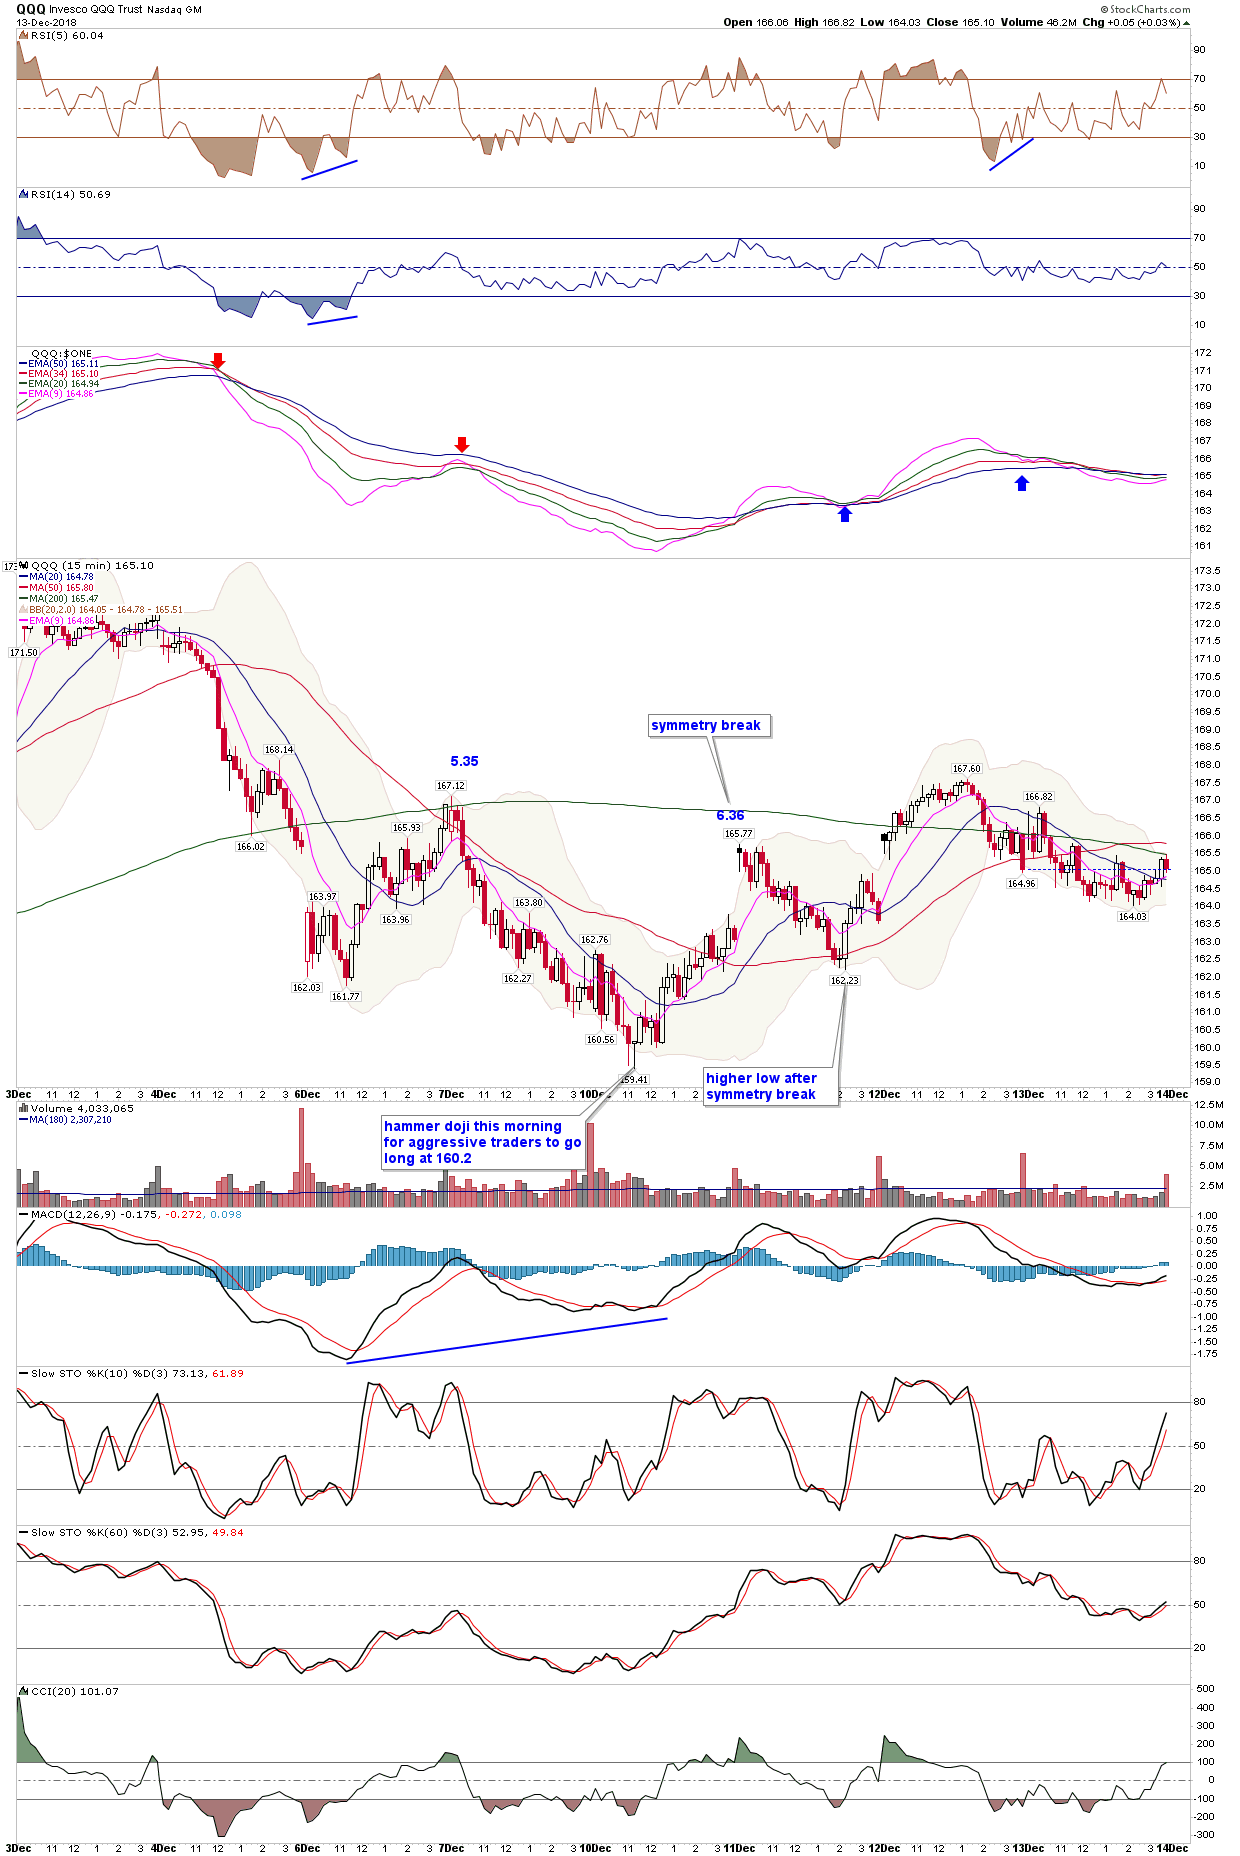
The market continues it's frustrating grind and chop. The Russell 2000 small caps remains very weak, in fact 1 out of 4 of the stocks in that index were down over 3% today! Otherwise in the very short term the market has done pretty much what we pointed out - it went up in a small abc pattern and then after completing that c wave high yesterday has been selling off again. See the 15 min SPX chart (Chart #10 below). Also news related items can quickly move the market up and down in fast violent ways as we've seen.
Anyway nothing changes today technically: It's still possible that Monday's low put in an Int Wave a low and the market is simply grinding it's way higher, albeit in a very choppy manner, in that Int wave B. If Int wave B is in, then the market should form a higher low sometime on this pullback, moving in complex abc type patterns. Or it's possible that the wave A wasn't put in at Monday's low! Again tough market, my suggestion if you are trying to trade all these 'wiggles' then day trade. If you are long from Monday, stay long with a stop you are comfortable with. Let's not over complicate it!
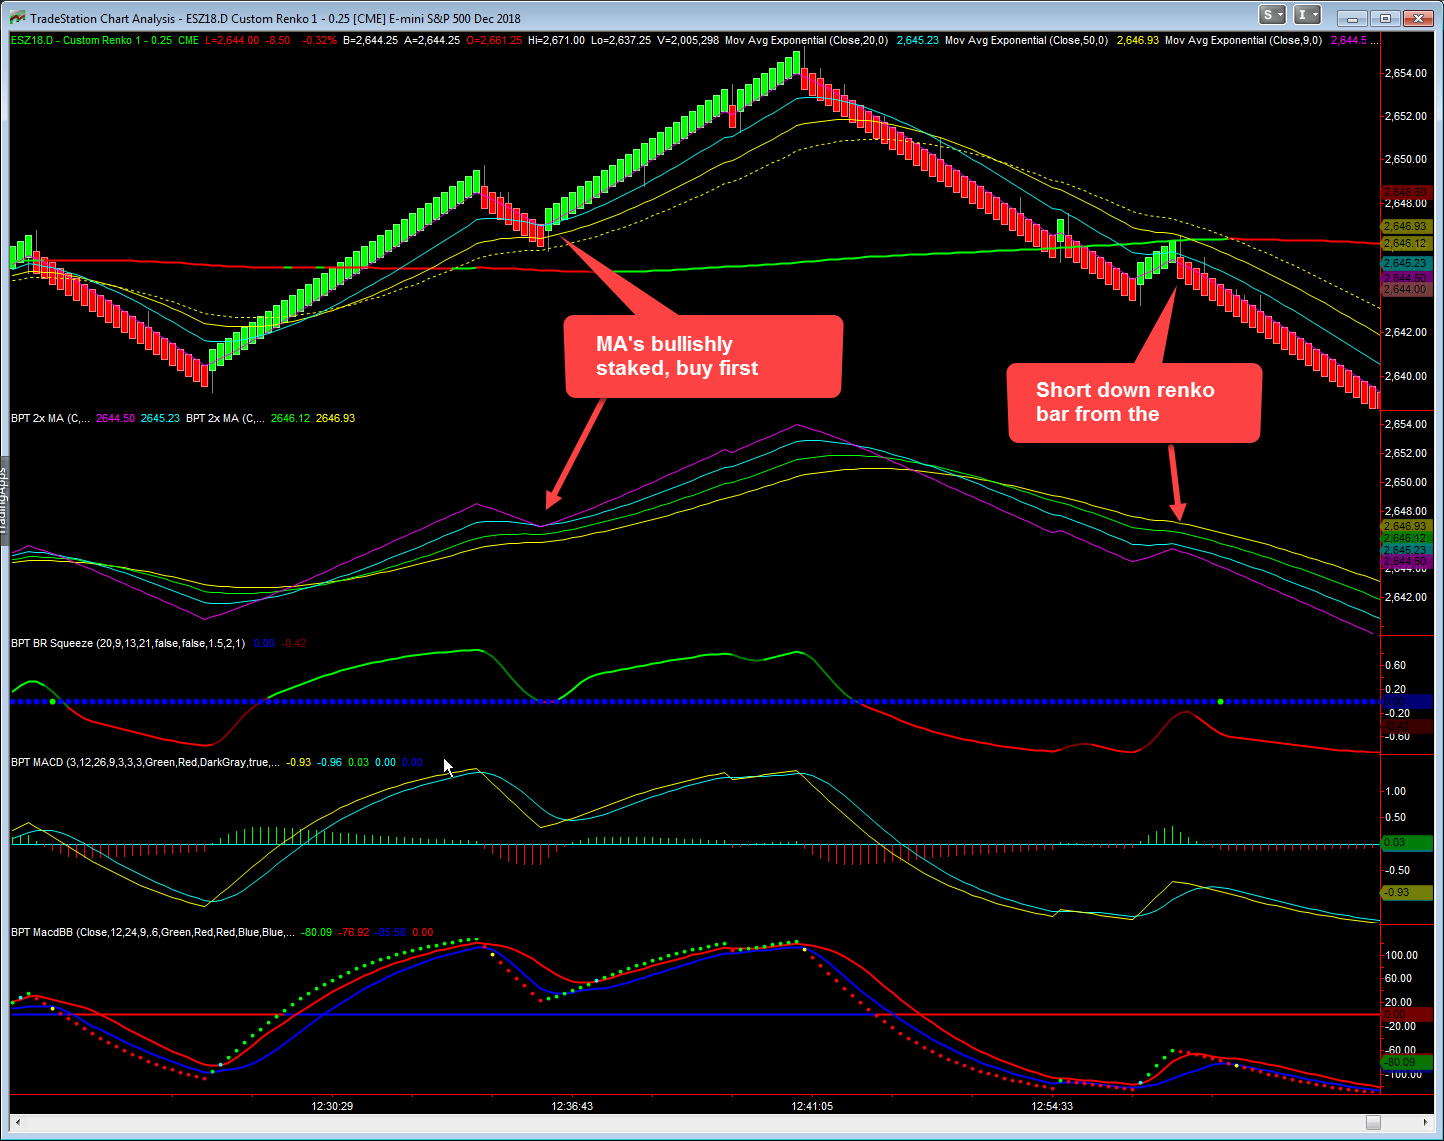
Again guys like I stated last night, it's times like this when you should be focusing on capital preservation and keeping what you have, and if you do trade, focus on 1 or 2 items at most! And if you can day trade, there's plenty of opportunity for that, you can simply choose to focus on a 5 min chart of a volatile ETF with standard indicators. Or if you work a busy day job, stay on the sidelines, cash is a position! Below is a chart I've been trading, it's a specialized Renko chart on ES. Again in this volatility find something and laser focus on that or sit on sidelines.
2
3
| Major Indexes | Index Symbol | ETF Symbol | % G / L Day | % G / L Week | Close |
|---|---|---|---|---|---|
| Dow Jones | INDU - W | DIA - W | 0.29% | 0.85% | 24,597.38 |
| S&P 500 | SPX - W | SPY - W | -0.02% | 0.66% | 2,650.54 |
| Wilshire 5000 | WLSH - W | -0.23% | 0.35% | 27,240.02 | |
| Nasdaq | COMPQ - W | -0.39% | 1.45% | 7,070.33 | |
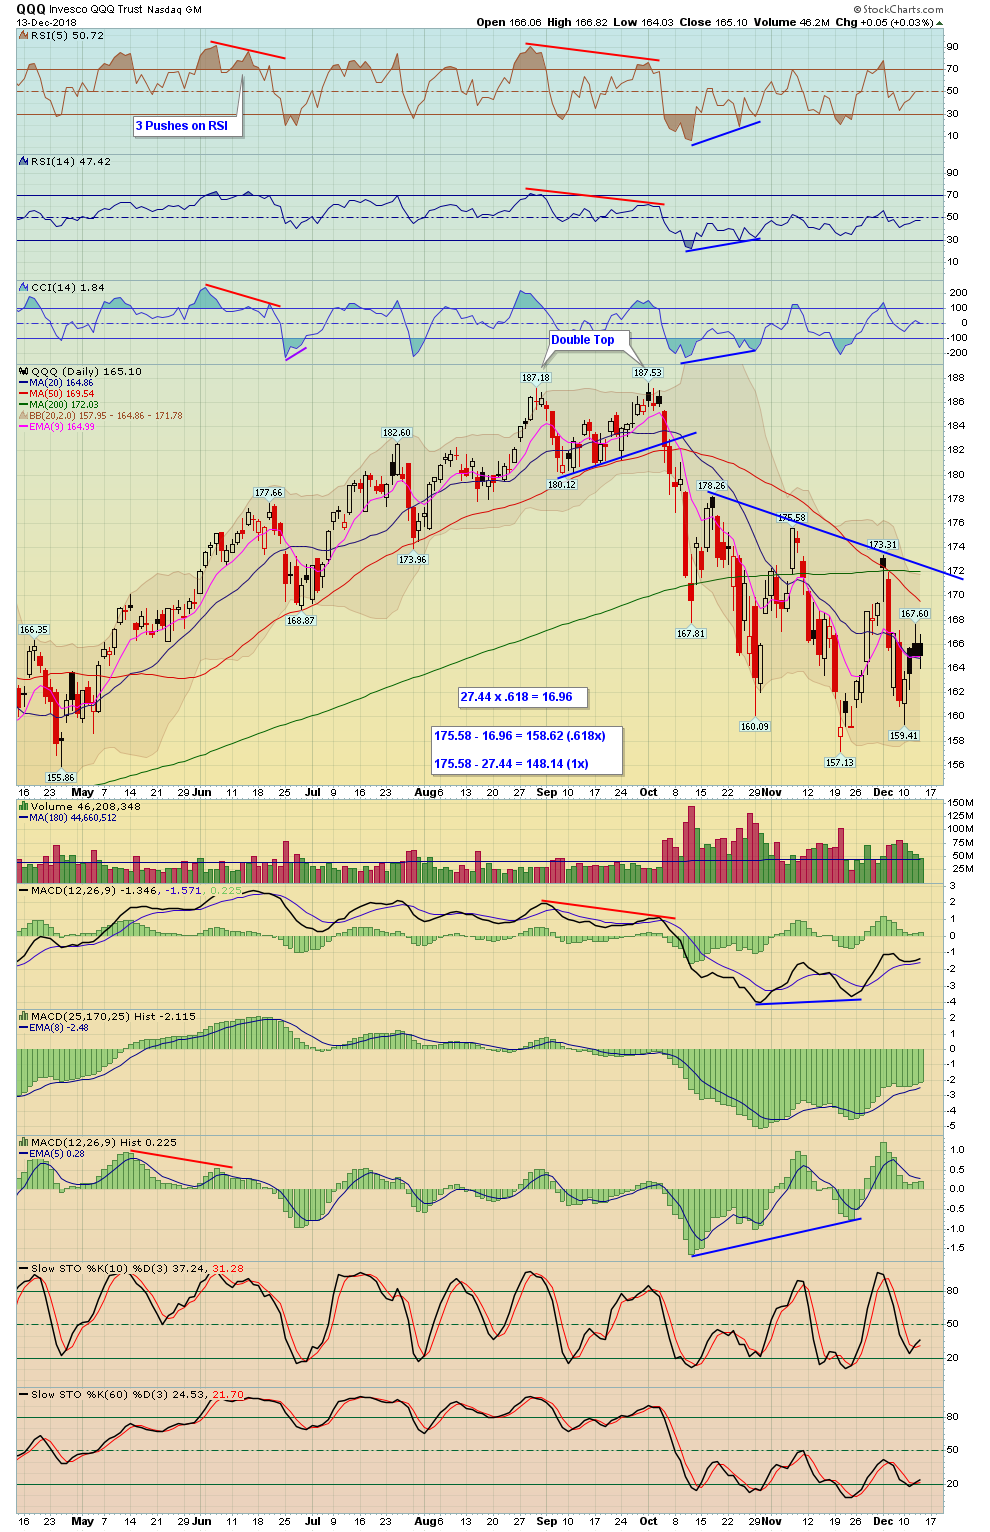
| NDX 100 | NDX - W | QQQ - W | 0.06% | 2.34% | 6,767.97 |
| Russel 2000 (Small Caps) | RUT - W | IWM - W | -1.55% | -1.06% | 1,432.70 |
| Market Sectors | Index Symbol | ETF Symbol | % G / L Day | % G / L Week | Close |
|---|---|---|---|---|---|
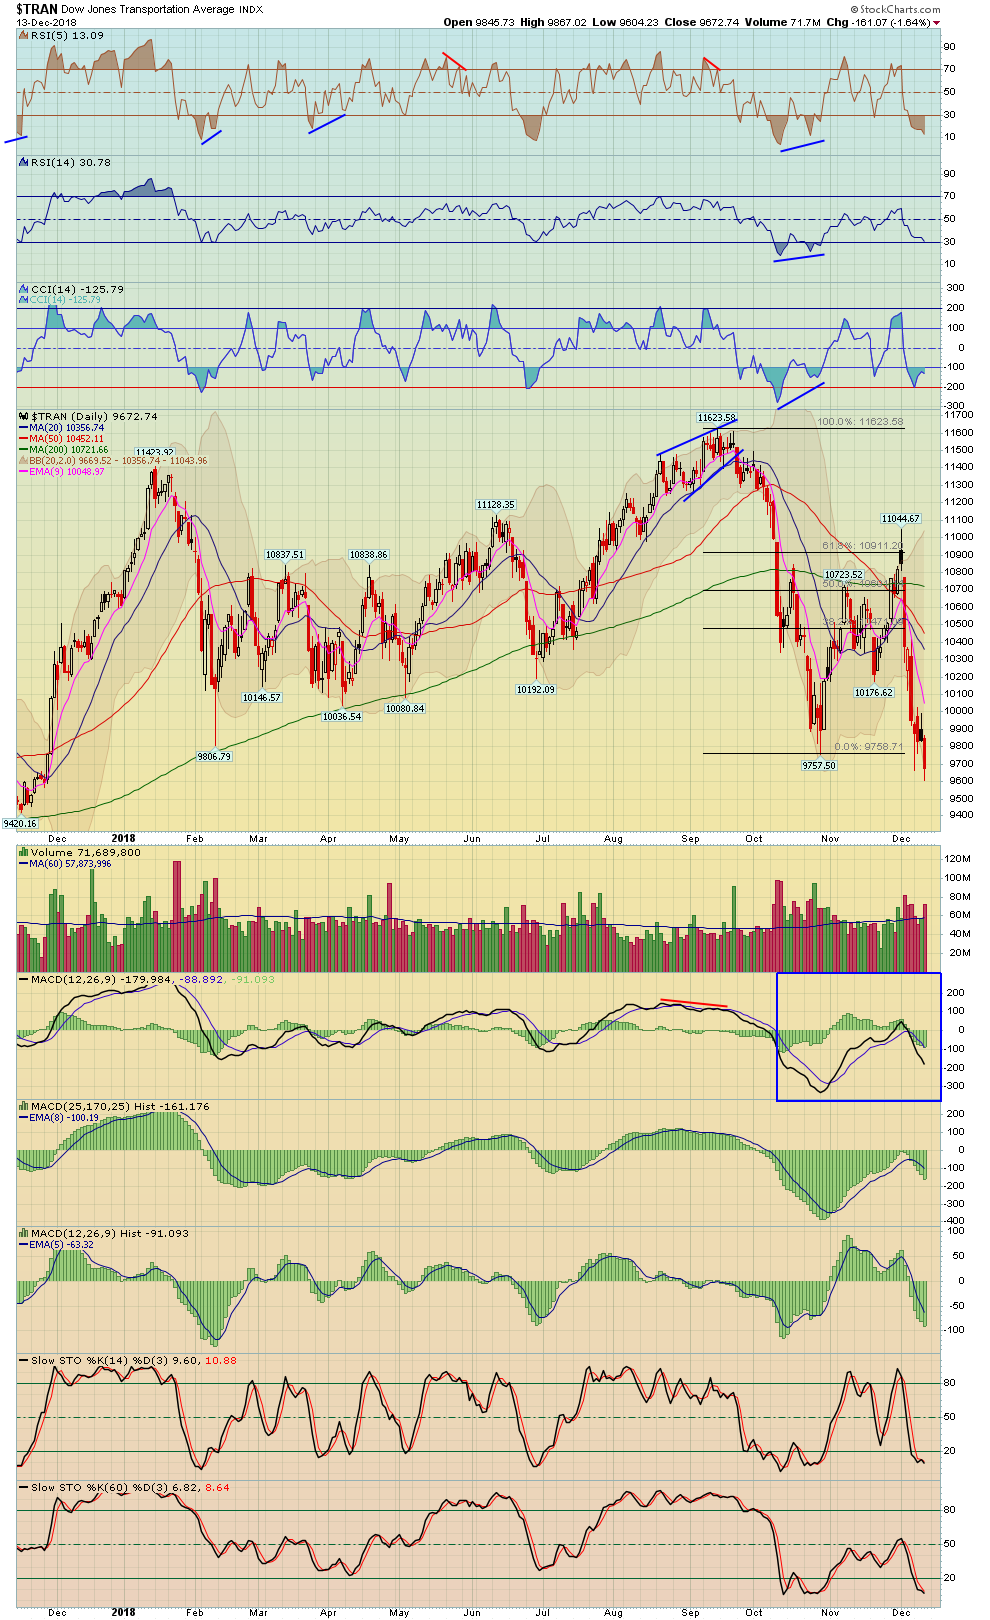
| Transports | TRAN - W | IYT - W | -1.64% | -2.80% | 9,672.74 |
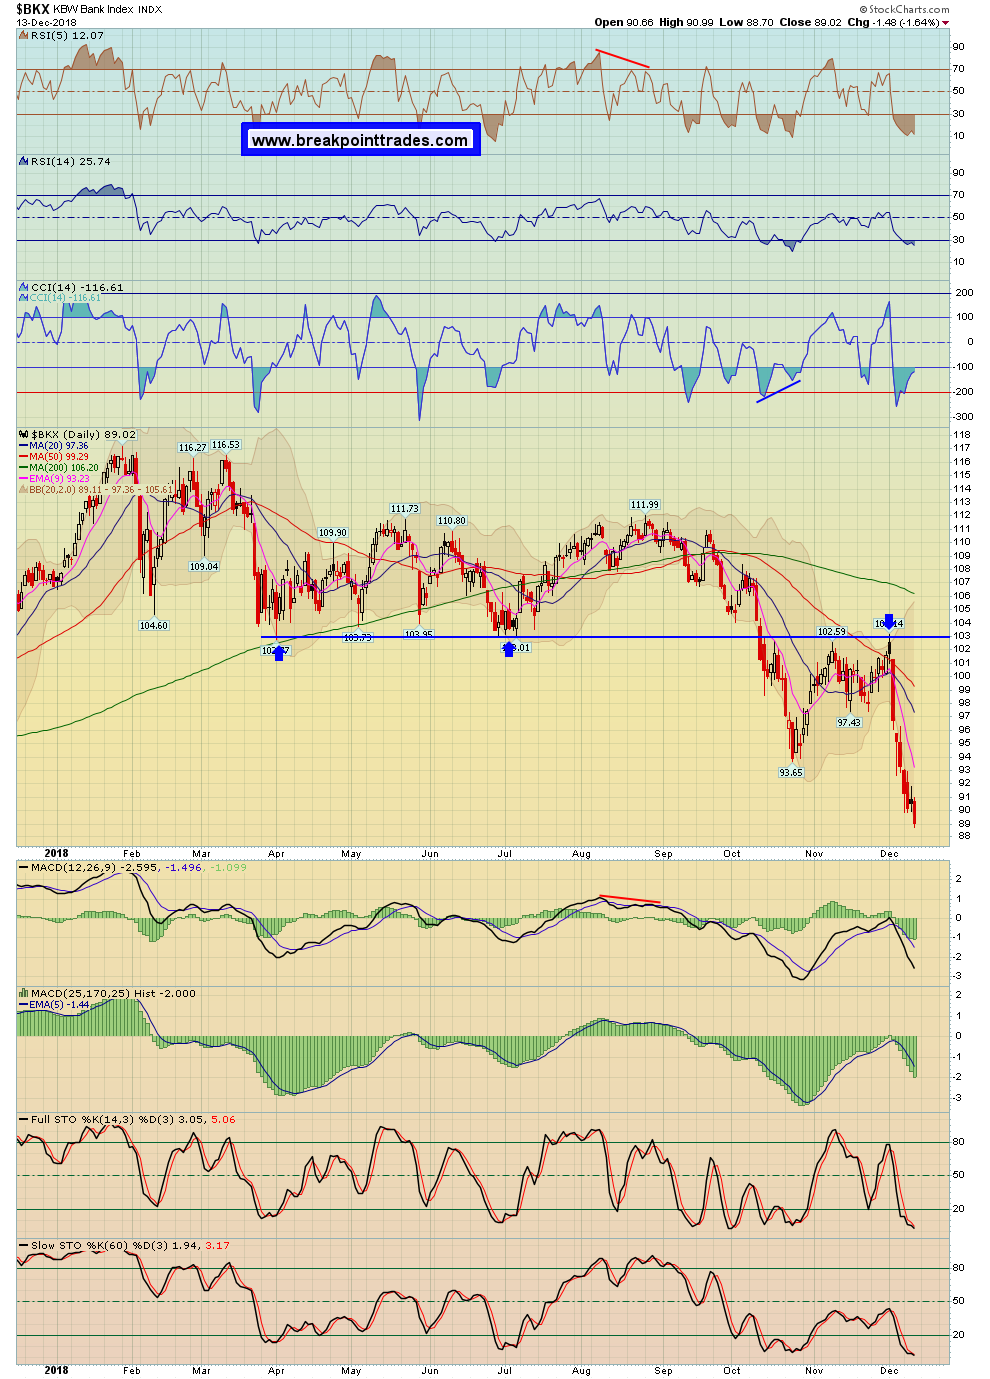
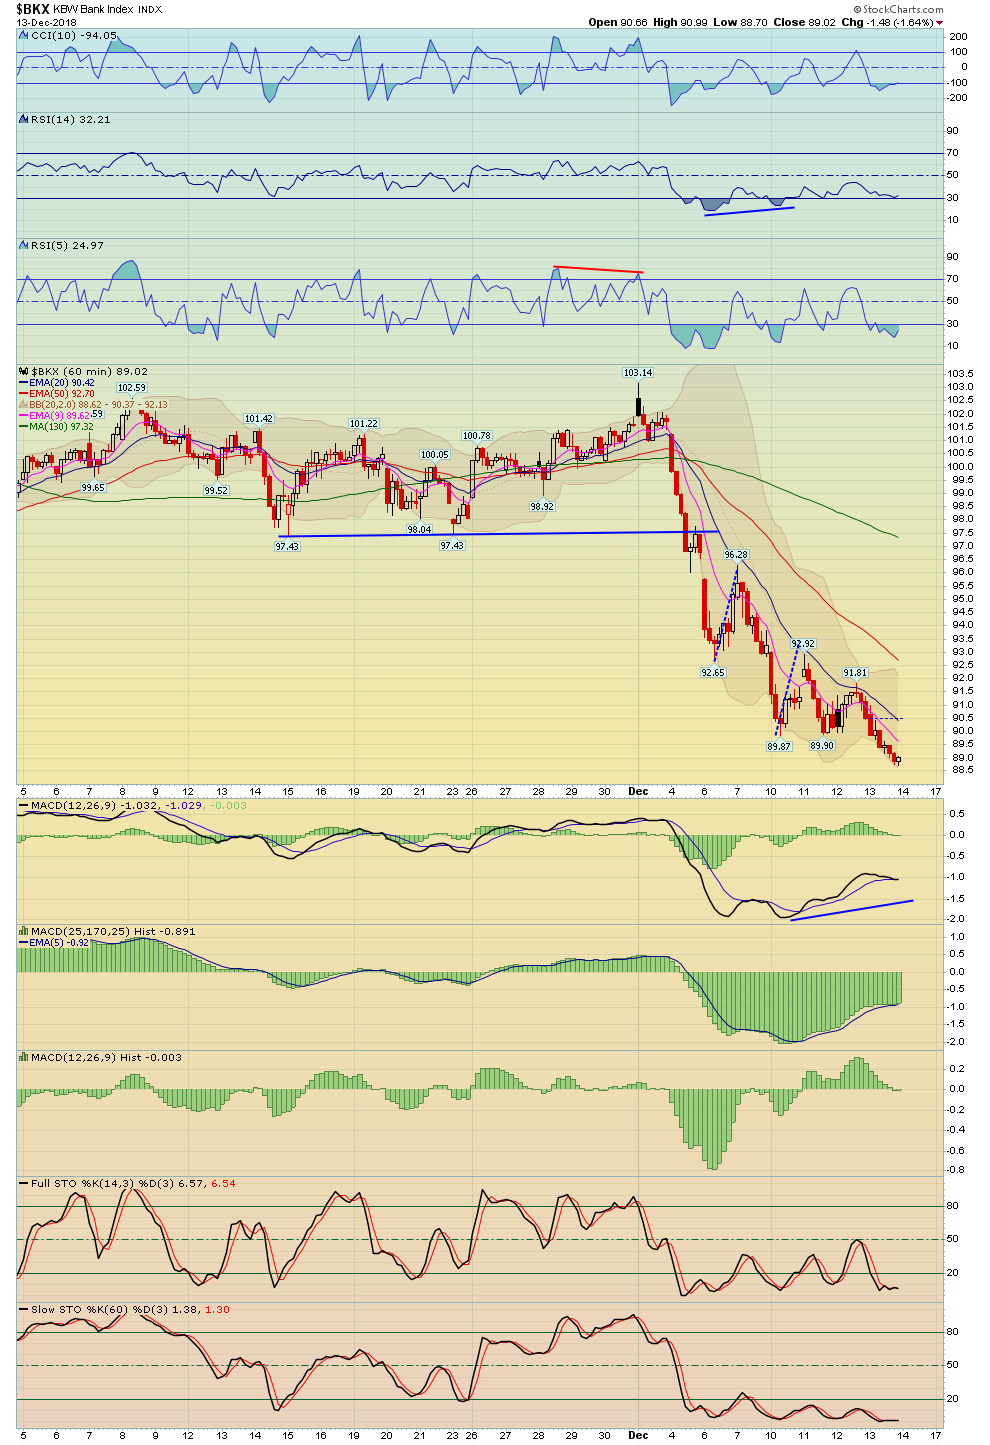
| Banks | BKX - W | -1.64% | -4.55% | 89.02 | |
| Financials | XLF - W | -0.73% | -2.51% | 24.48 | |
| Brokers | XBD - W | -1.40% | -1.26% | 243.76 | |
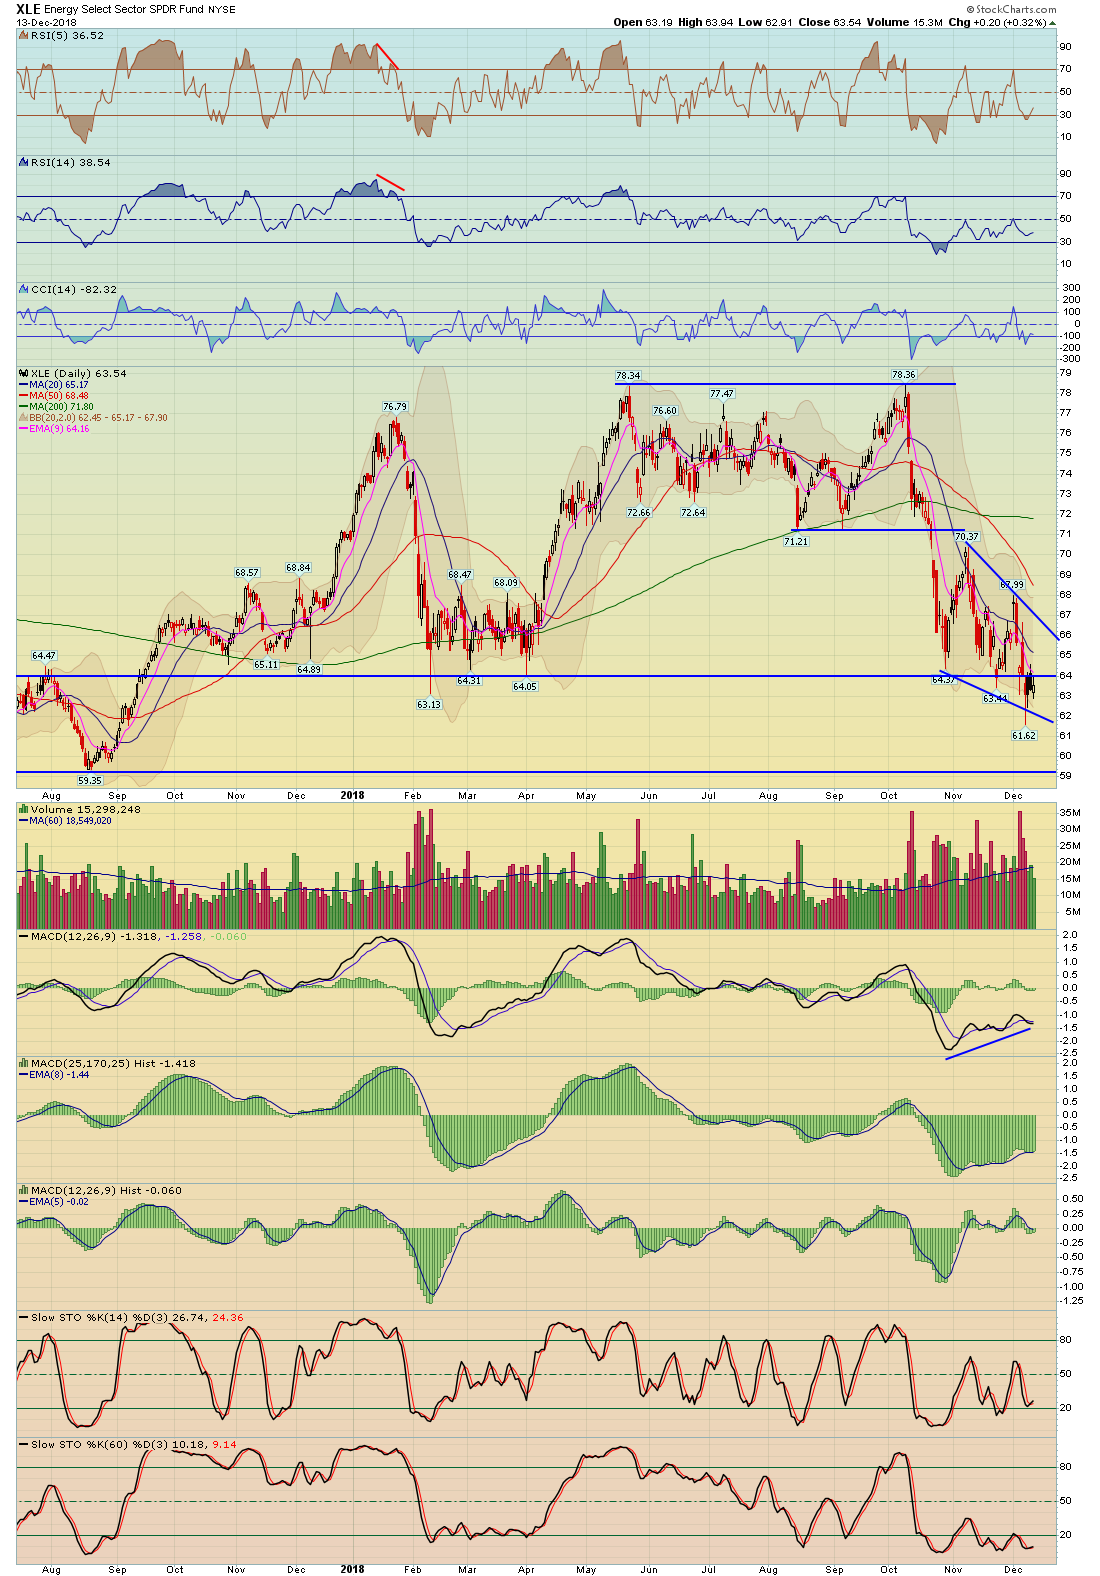
| XLE (Energy Select) | XLE - W | 0.32% | -0.83% | 63.54 | |
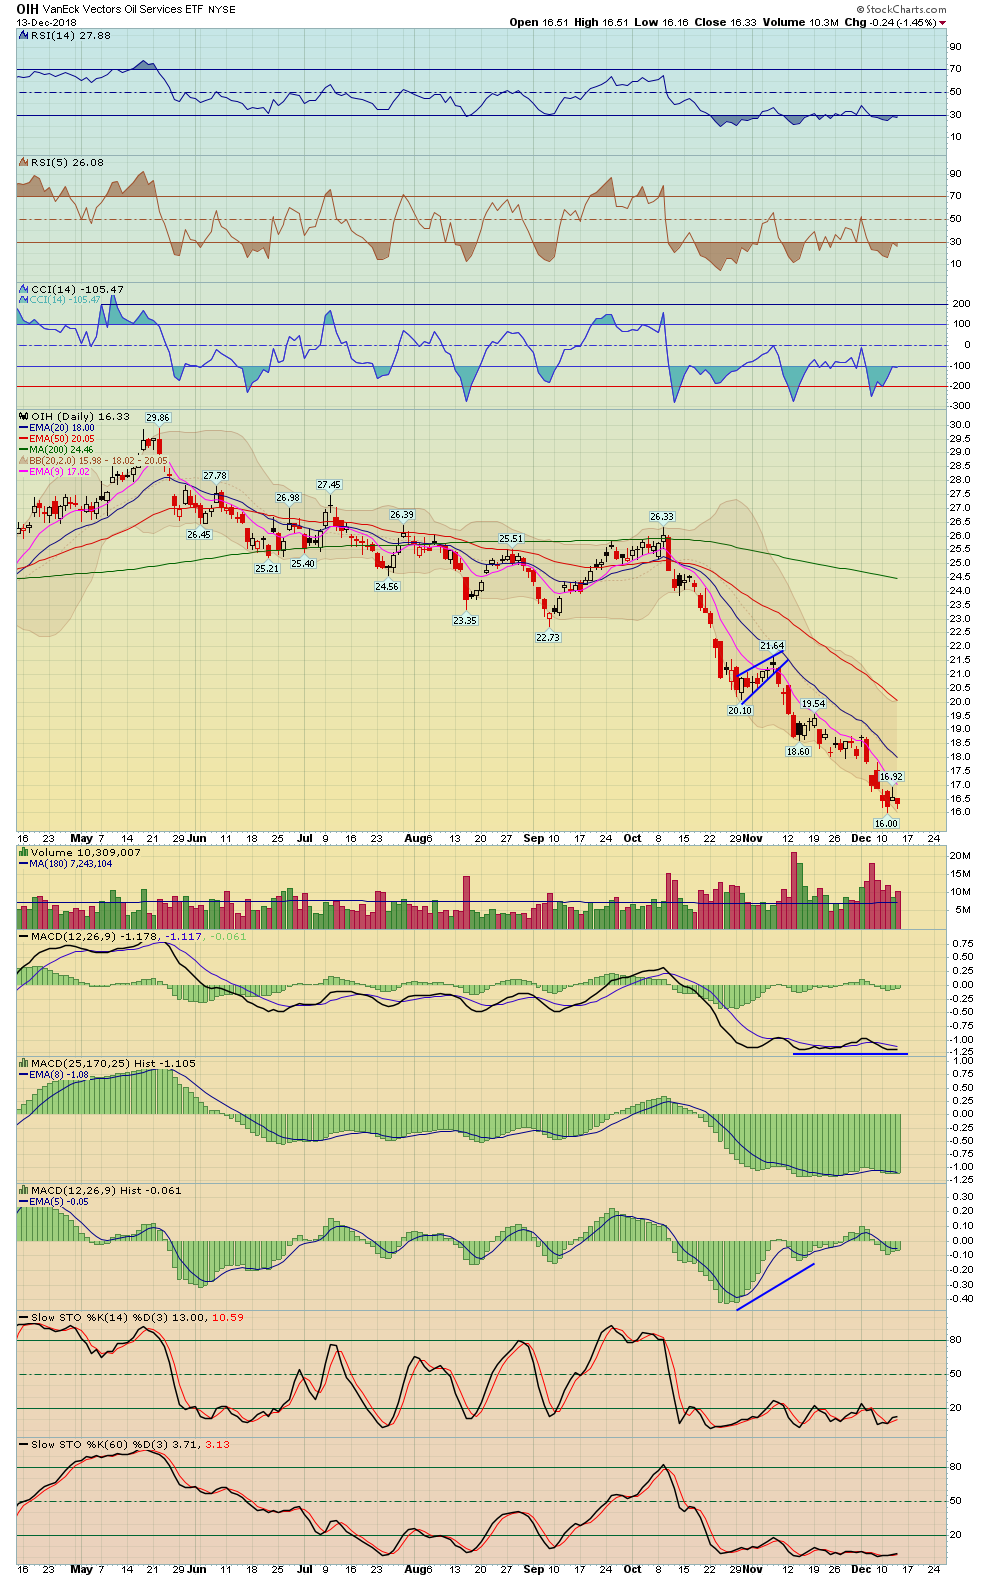
| Oil Service Holders | OIH - W | -1.45% | -3.32% | 16.33 | |
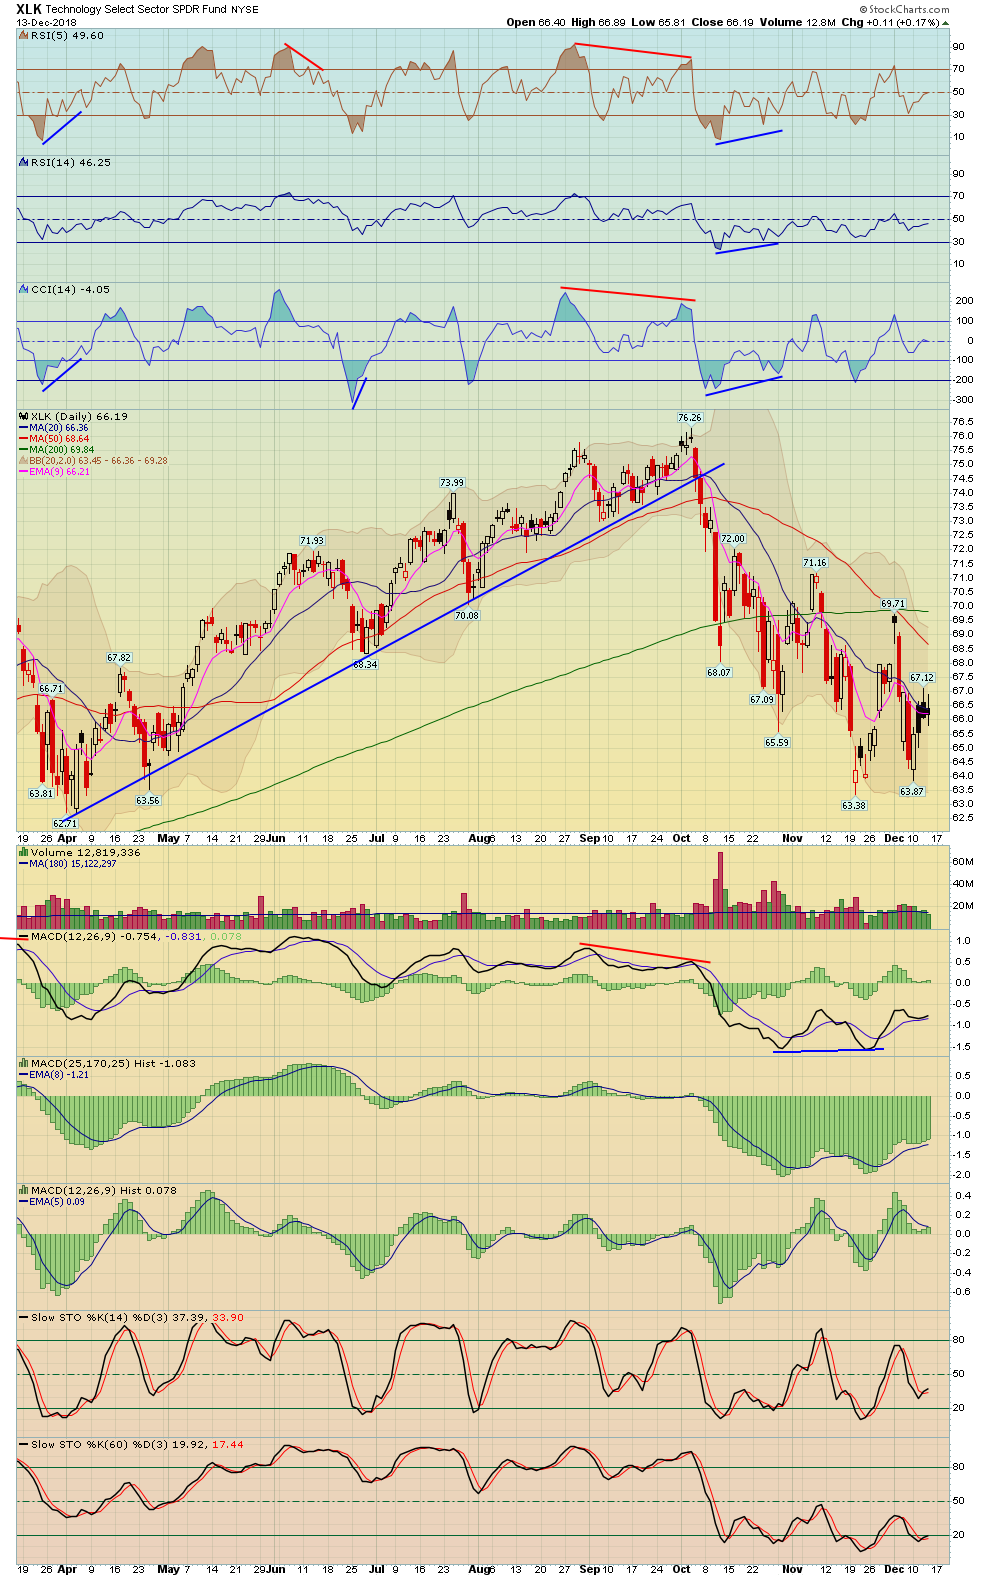
| Technology | XLK - W | 0.17% | 2.46% | 66.19 | |
| Semiconductor | SOX - W | SMH - W | -0.36% | 3.17% | 1,194.59 |
| Communication Services | XLC - W | -0.45% | 1.47% | 44.04 | |
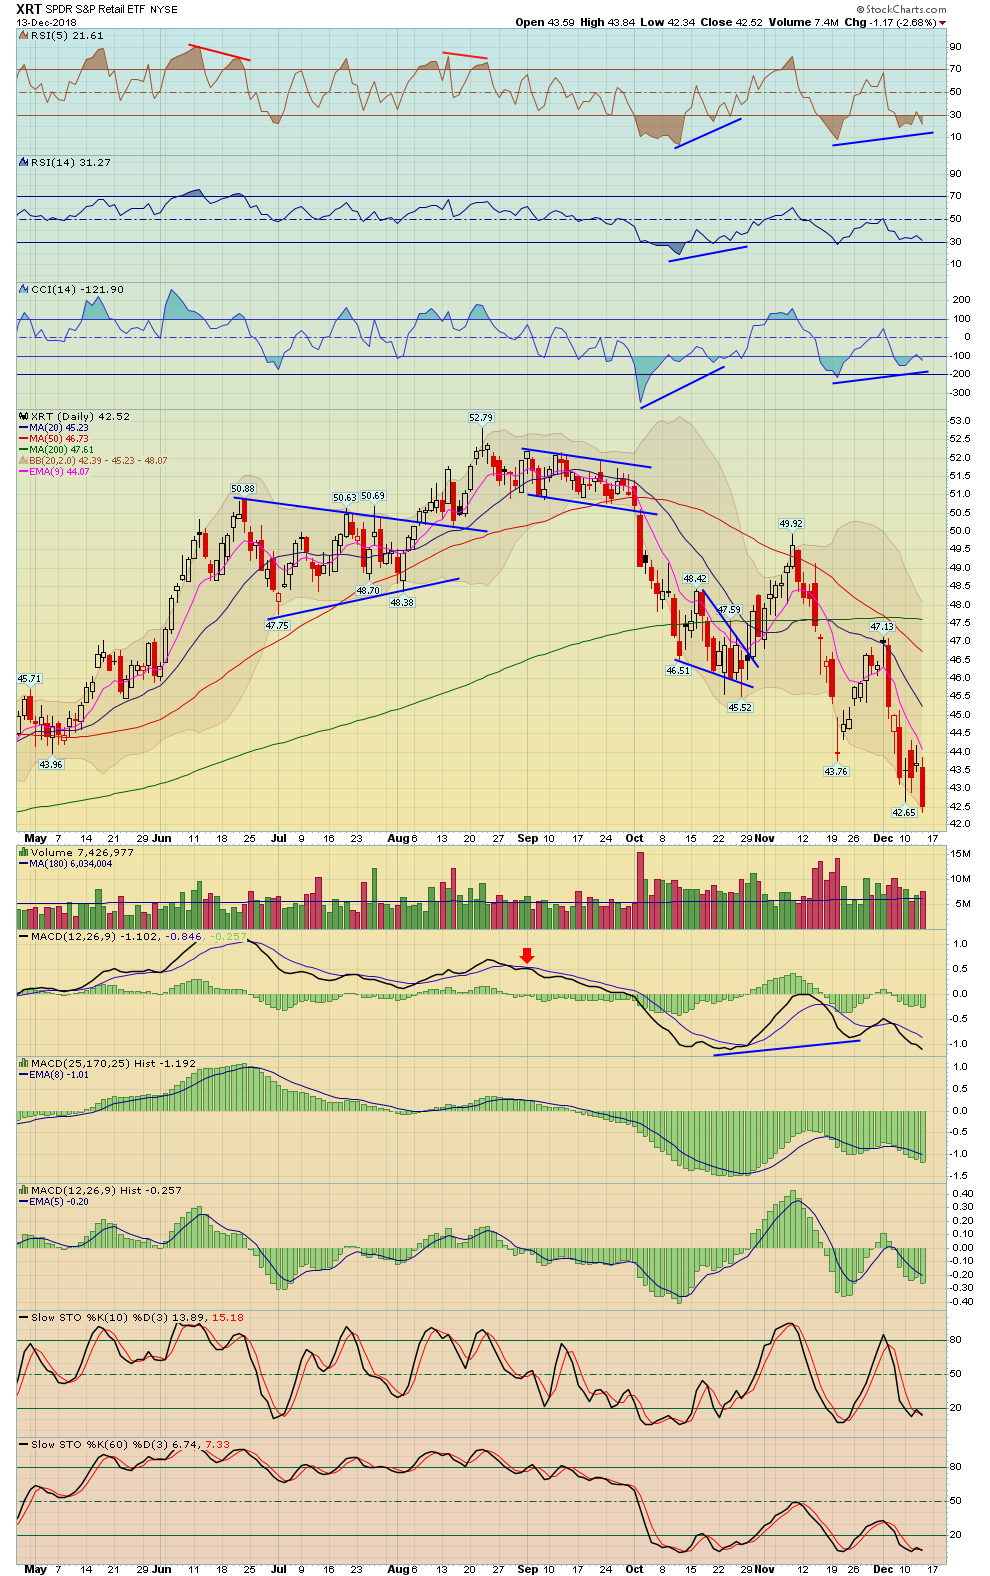
| Retail | XRT - W | -2.68% | -1.82% | 42.52 | |
| Consumer Staples | XLP - W | 0.62% | 1.32% | 55.44 | |
| Consumer Discretionary | XLY - W | -0.50% | 0.67% | 104.06 | |
| Industrials | XLI - W | -0.28% | -0.06% | 67.99 | |
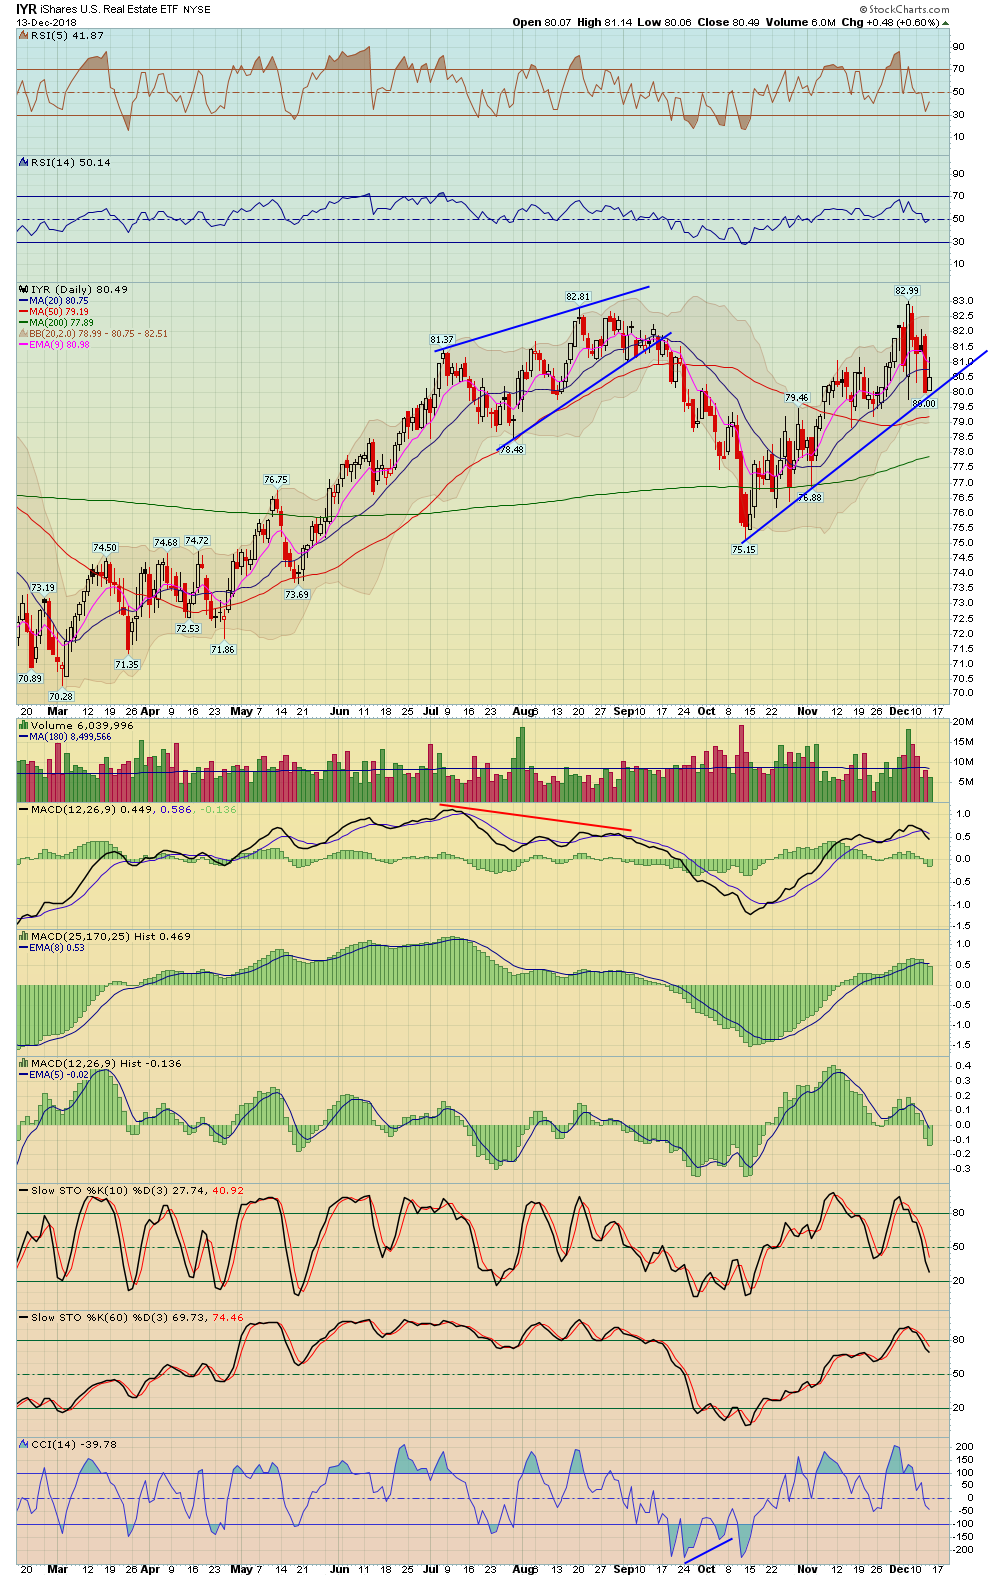
| Real Estate | IYR - W | 0.60% | -1.54% | 80.49 | |
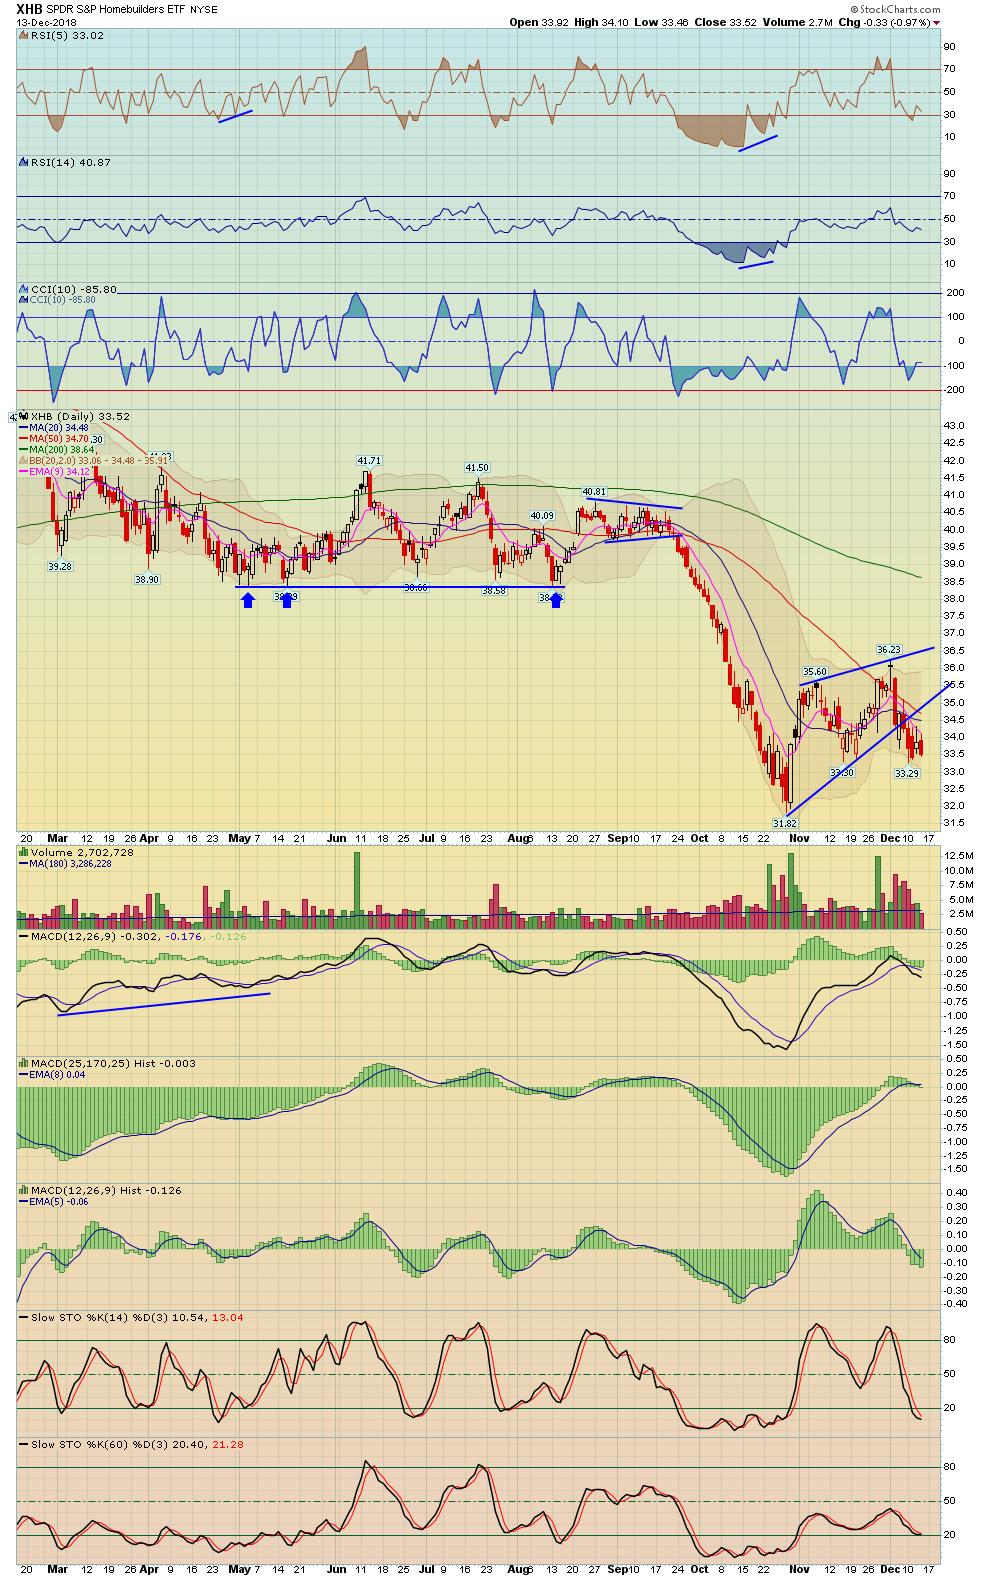
| Homebuilders | HGX - W | XHB - W | -0.91% | -2.30% | 250.42 |
| Materials | XLB - W | -1.17% | -0.37% | 51.72 | |
| Metals And Mining | XME - W | -0.57% | -1.07% | 27.76 | |
| GDX Gold Miners ETF | GDX - W | 0.20% | 1.39% | 20.48 | |
| Biotechnology | BTK - W | XBI - W | -1.90% | 0.66% | 4,497.42 |
| Healthcare | XLV - W | 0.10% | 1.66% | 92.06 | |
| Drugs | DRG - W | 0.41% | 1.78% | 593.99 | |
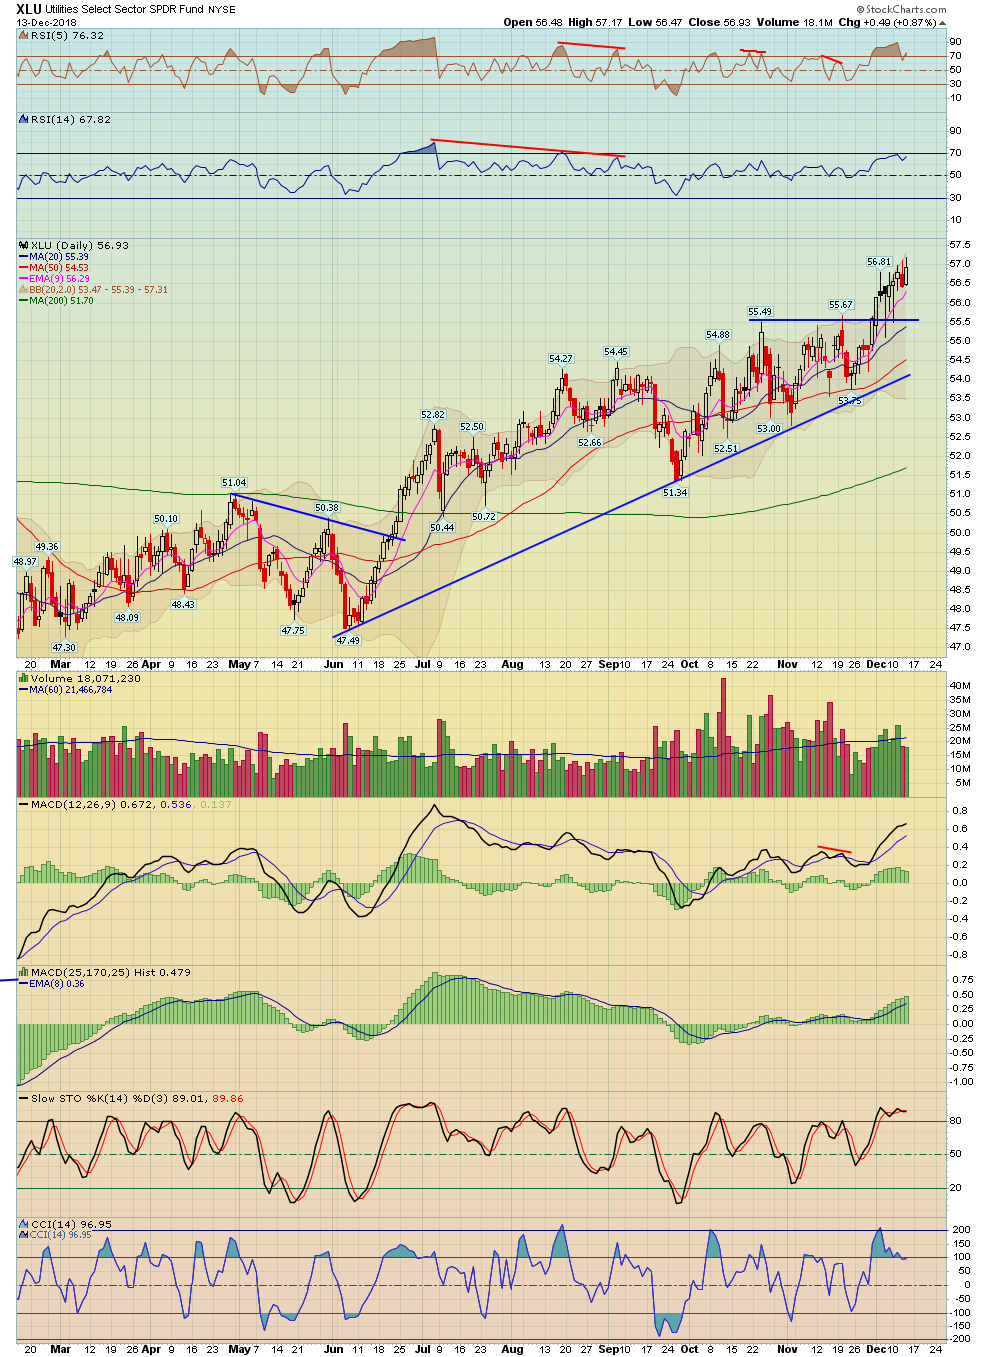
| Utilities | UTIL - W | XLU - W | 0.80% | 0.80% | 759.55 |
| Currencies | Index Symbol | ETF Symbol | % G / L Day | % G / L Week | Close |
|---|---|---|---|---|---|
| US Dollar | UUP - W | 0.00% | 0.54% | 25.94 | |
| Euro | XEU - W | FXE - W | -0.09% | -0.23% | 113.58 |
| Yen | XJY - W | FXY - W | -0.30% | -0.77% | 88.01 |
| Australian | XAD - W | FXA - W | 0.12% | 0.30% | 72.26 |
| British Pound | XBP - W | FXB - W | 0.23% | -0.59% | 126.56 |
| Chinese Yuan | CYB - W | -0.21% | 0.29% | 25.55 | |
| Canadian Dollar | CDW - W | FXC - W | 0.03% | -0.20% | 74.90 |
| Swiss Franc | XSF - W | FXF - W | -0.07% | -0.33% | 100.61 |
| Commodities | Index Symbol | ETF Symbol | % G / L Day | % G / L Week | Close |
|---|---|---|---|---|---|
| Commodities | DBC - W | 1.29% | -0.06% | 15.69 | |
| Crude Oil | WTIC - W | USO - W | 2.80% | -0.06% | 52.58 |
| Gasoline | GASO - W | 4.07% | -0.51% | 1.48 | |
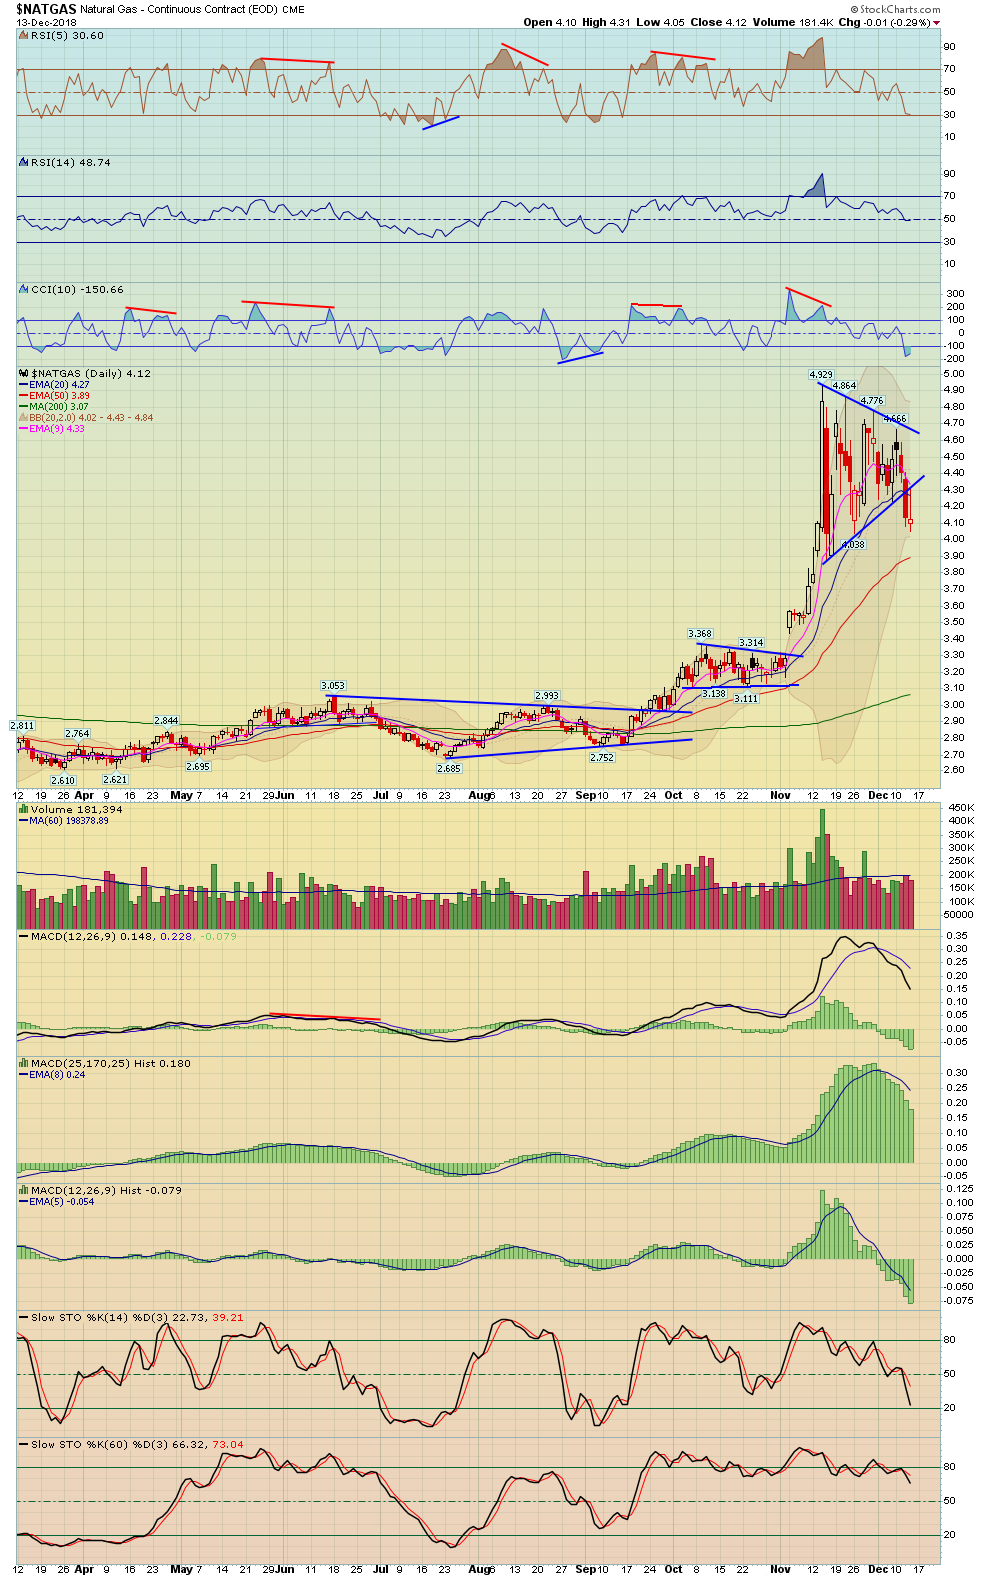
| Natural Gas | NATGAS - W | UNG - W | -0.29% | -8.11% | 4.12 |
| Copper | COPPER - W | JJCB - W | -0.11% | 0.27% | 2.77 |
| Agriculture | DBA - W | 0.46% | 0.00% | 17.41 | |
| Corn | CORN - W | CORN - W | -0.26% | -0.32% | 384.25 |
| Wheat | WHEAT - W | WEAT - W | 1.80% | 0.89% | 536.00 |
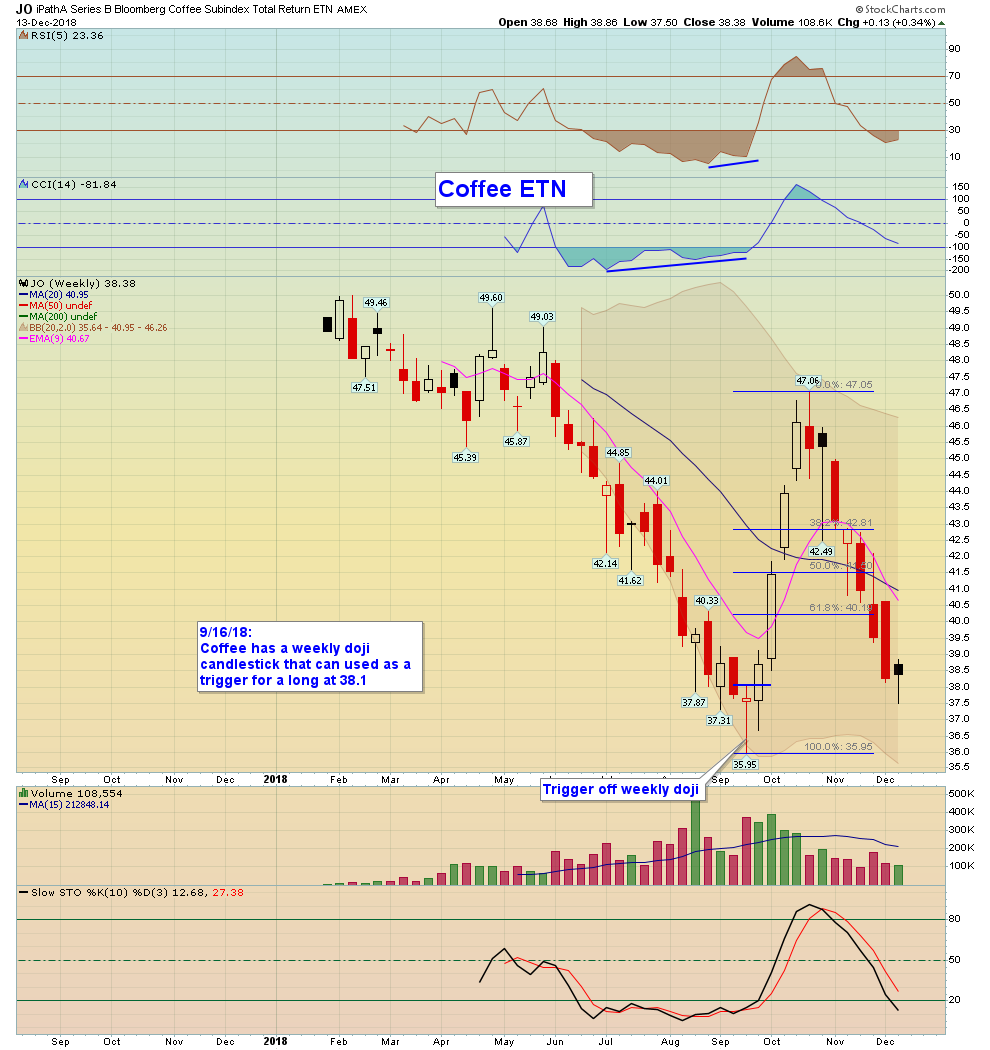
| Coffee | BJO - W | -2.04% | -3.06% | 41.78 | |
| Sugar | CANE - W | -0.27% | -1.20% | 7.43 |
| Precious Metals | Index Symbol | ETF Symbol | % G / L Day | % G / L Week | Close |
|---|---|---|---|---|---|
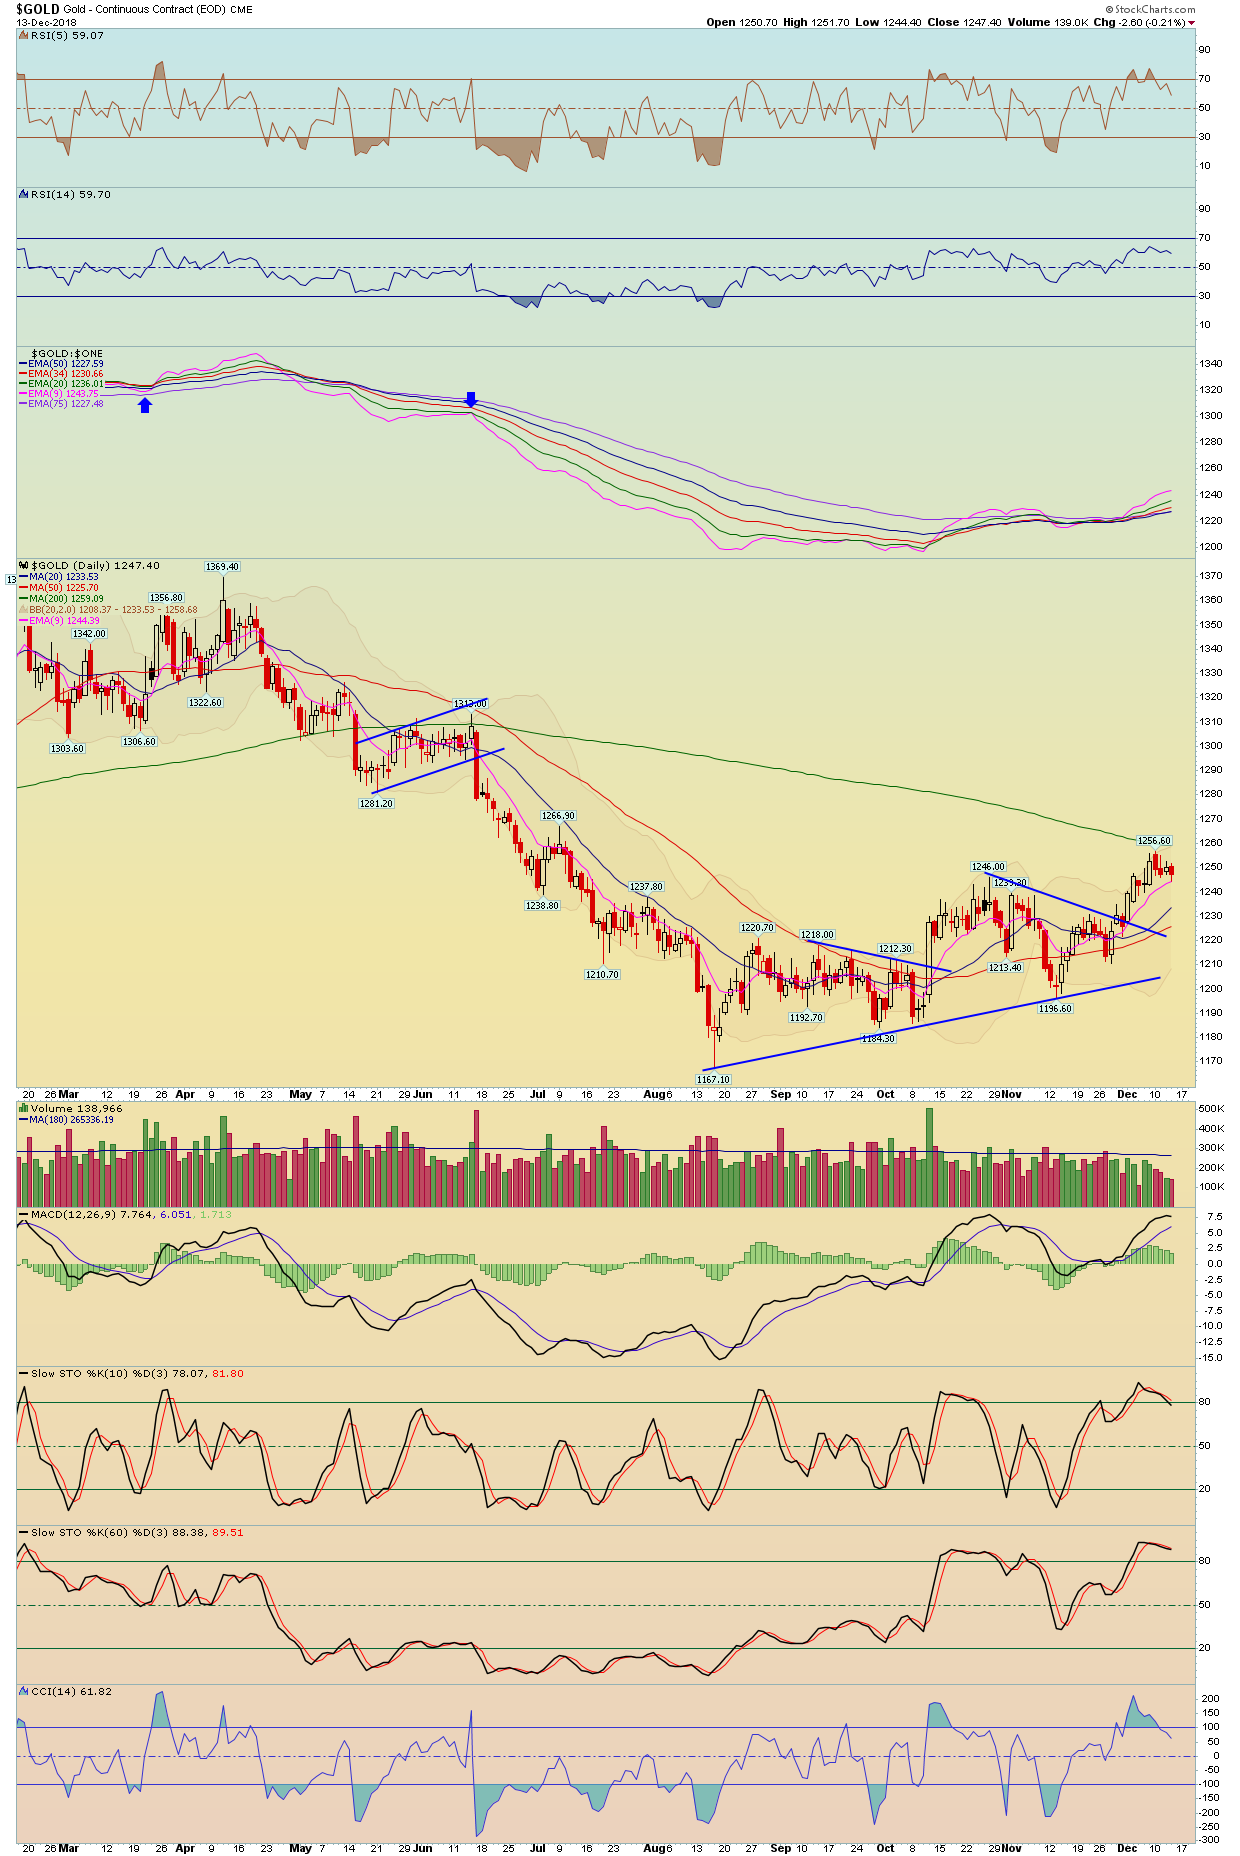
| Gold Metal | GLD - W | -0.22% | -0.47% | 117.53 | |
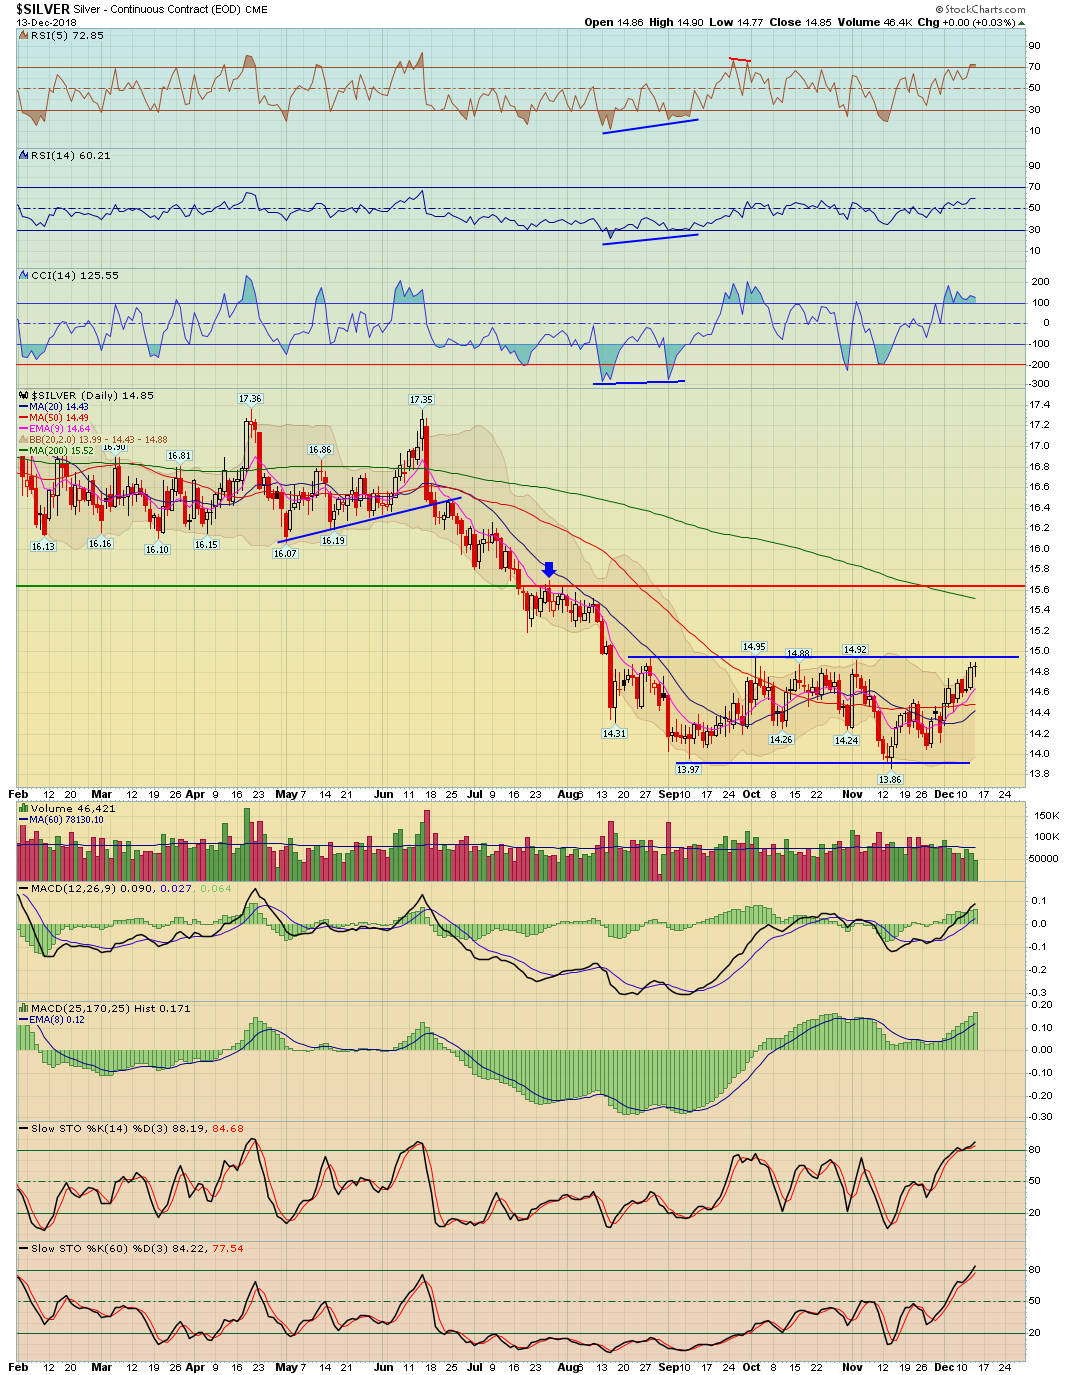
| Silver | SLV - W | 0.29% | 0.95% | 13.86 | |
| Platinum | PPLT - W | -0.68% | 0.51% | 75.54 | |
| Palladium | PALL - W | 1.52% | 5.55% | 123.65 | |
| GDX Gold Miners ETF | GDX - W | 0.20% | 1.39% | 20.48 |
| Bonds | Index Symbol | ETF Symbol | % G / L Day | % G / L Week | Close |
|---|---|---|---|---|---|
| High Yield Corporate Bond | HYG - W | 0.24% | 0.82% | 83.51 | |
| TLT 20 Year Bond ETF | TLT - W | -0.24% | -0.29% | 118.07 | |
| 10 Year Treasury Yield | TNX - W | 0.17% | 2.14% | 29.11 | |
| 30 Year Treasury Yield | TYX - W | 0.48% | 0.64% | 31.63 |
4
| Date | ET | Release | For | Actual | Briefing.com Forecast | Briefing.com Consensus | Prior | Revised From |
|---|---|---|---|---|---|---|---|---|
| Dec 10 | 10:00 | JOLTS - Job Openings | Oct | 7.079M | NA | NA | 6.960M | 7.009M |
| Dec 11 | 06:00 | NFIB Small Business Optimism Index | Nov | 104.8 | NA | NA | 107.4 | |
| Dec 11 | 08:30 | PPI | Nov | 0.1% | -0.2% | 0.0% | 0.6% | |
| Dec 11 | 08:30 | Core PPI | Nov | 0.3% | 0.1% | 0.1% | 0.5% | |
| Dec 12 | 07:00 | MBA Mortgage Applications Index | 12/08 | 1.6% | NA | NA | 2.0% | |
| Dec 12 | 08:30 | CPI | Nov | 0.0% | 0.0% | 0.0% | 0.3% | |
| Dec 12 | 08:30 | Core CPI | Nov | 0.2% | 0.2% | 0.2% | 0.2% | |
| Dec 12 | 10:30 | EIA Crude Inventories | 12/08 | -1.2M | NA | NA | -7.3M | |
| Dec 13 | 08:30 | Export Prices | Nov | -0.9% | NA | NA | 0.5% | 0.4% |
| Dec 13 | 08:30 | Export Prices ex-ag. | Nov | -1.0% | NA | NA | 0.5% | |
| Dec 13 | 08:30 | Import Prices | Nov | -1.6% | NA | NA | 0.5% | |
| Dec 13 | 08:30 | Import Prices ex-oil | Nov | -0.3% | NA | NA | 0.1% | 0.2% |
| Dec 13 | 08:30 | Initial Claims | 12/08 | 206K | 225K | 228K | 233K | 231K |
| Dec 13 | 08:30 | Continuing Claims | 12/01 | 1661K | NA | NA | 1636K | 1631K |
| Dec 13 | 10:30 | Natural Gas Inventories | 12/08 | -77 bcf | NA | NA | -63 bcf | |
| Dec 13 | 14:00 | Treasury Budget | Nov | -$204.9B | NA | NA | -$138.5B | |
| Dec 14 | 08:30 | Retail Sales | Nov | 0.3% | 0.2% | 0.8% | ||
| Dec 14 | 08:30 | Retail Sales ex-auto | Nov | 0.4% | 0.3% | 0.7% | ||
| Dec 14 | 09:15 | Industrial Production | Nov | 0.3% | 0.3% | 0.1% | ||
| Dec 14 | 09:15 | Capacity Utilization | Nov | 78.5% | 78.6% | 78.4% | ||
| Dec 14 | 10:00 | Business Inventories | Oct | 0.6% | 0.5% | 0.3% |

Stock Earnings Calender:
Click here for a list of Stocks that are reporting Earnings
**Generally we never hold a position into earnings since the risk/reward is too great
5 - View Live Chart
6 - View Live Chart
7 - View Live Chart
8 - View Live Chart
9 - View Live Chart
10 - View Live Chart
11 - View Live Chart
12 - View Live Chart
13 - View Live Chart
14 - View Live Chart
15 - View Live Chart
16 - View Live Chart
17 - View Live Chart
18 - View Live Chart
19 - View Live Chart
20 - View Live Chart
21 - View Live Chart
22 - View Live Chart
23 - View Live Chart
24 - View Live Chart
25 - View Live Chart
26 - View Live Chart
27 - View Live Chart
28 - View Live Chart
29 - View Live Chart
30 - View Live Chart
31 - View Live Chart
32 - View Live Chart
33 - View Live Chart
34 - View Live Chart
35 - View Live Chart
36 - View Live Chart
37 - View Live Chart
38 - View Live Chart
39 - View Live Chart
40 - View Live Chart
41 - View Live Chart
42 - View Live Chart
43 - View Live Chart
44 - View Live Chart
45 - View Live Chart
46 - View Live Chart
47 - View Live Chart
48 - View Live Chart
49 - View Live Chart
50 - View Live Chart
51 - View Live Chart
52 - View Live Chart
53 - View Live Chart
- Hide Player Link to Newsletter Audio
- Hide Player Link to Newsletter Audio