Market Newsletter for Wednesday Dec 5th, 2018 - free
Disclaimer: Intraday Chart Links will show up as daily charts unless you have an active stockcharts.com membership and are signed in, you can sign up here.
1
Table of Contents:
1. General Market Analysis: SPX and Other Major Indices
2. Review of Select Sectors
3. Glance at Currencies and Commodities
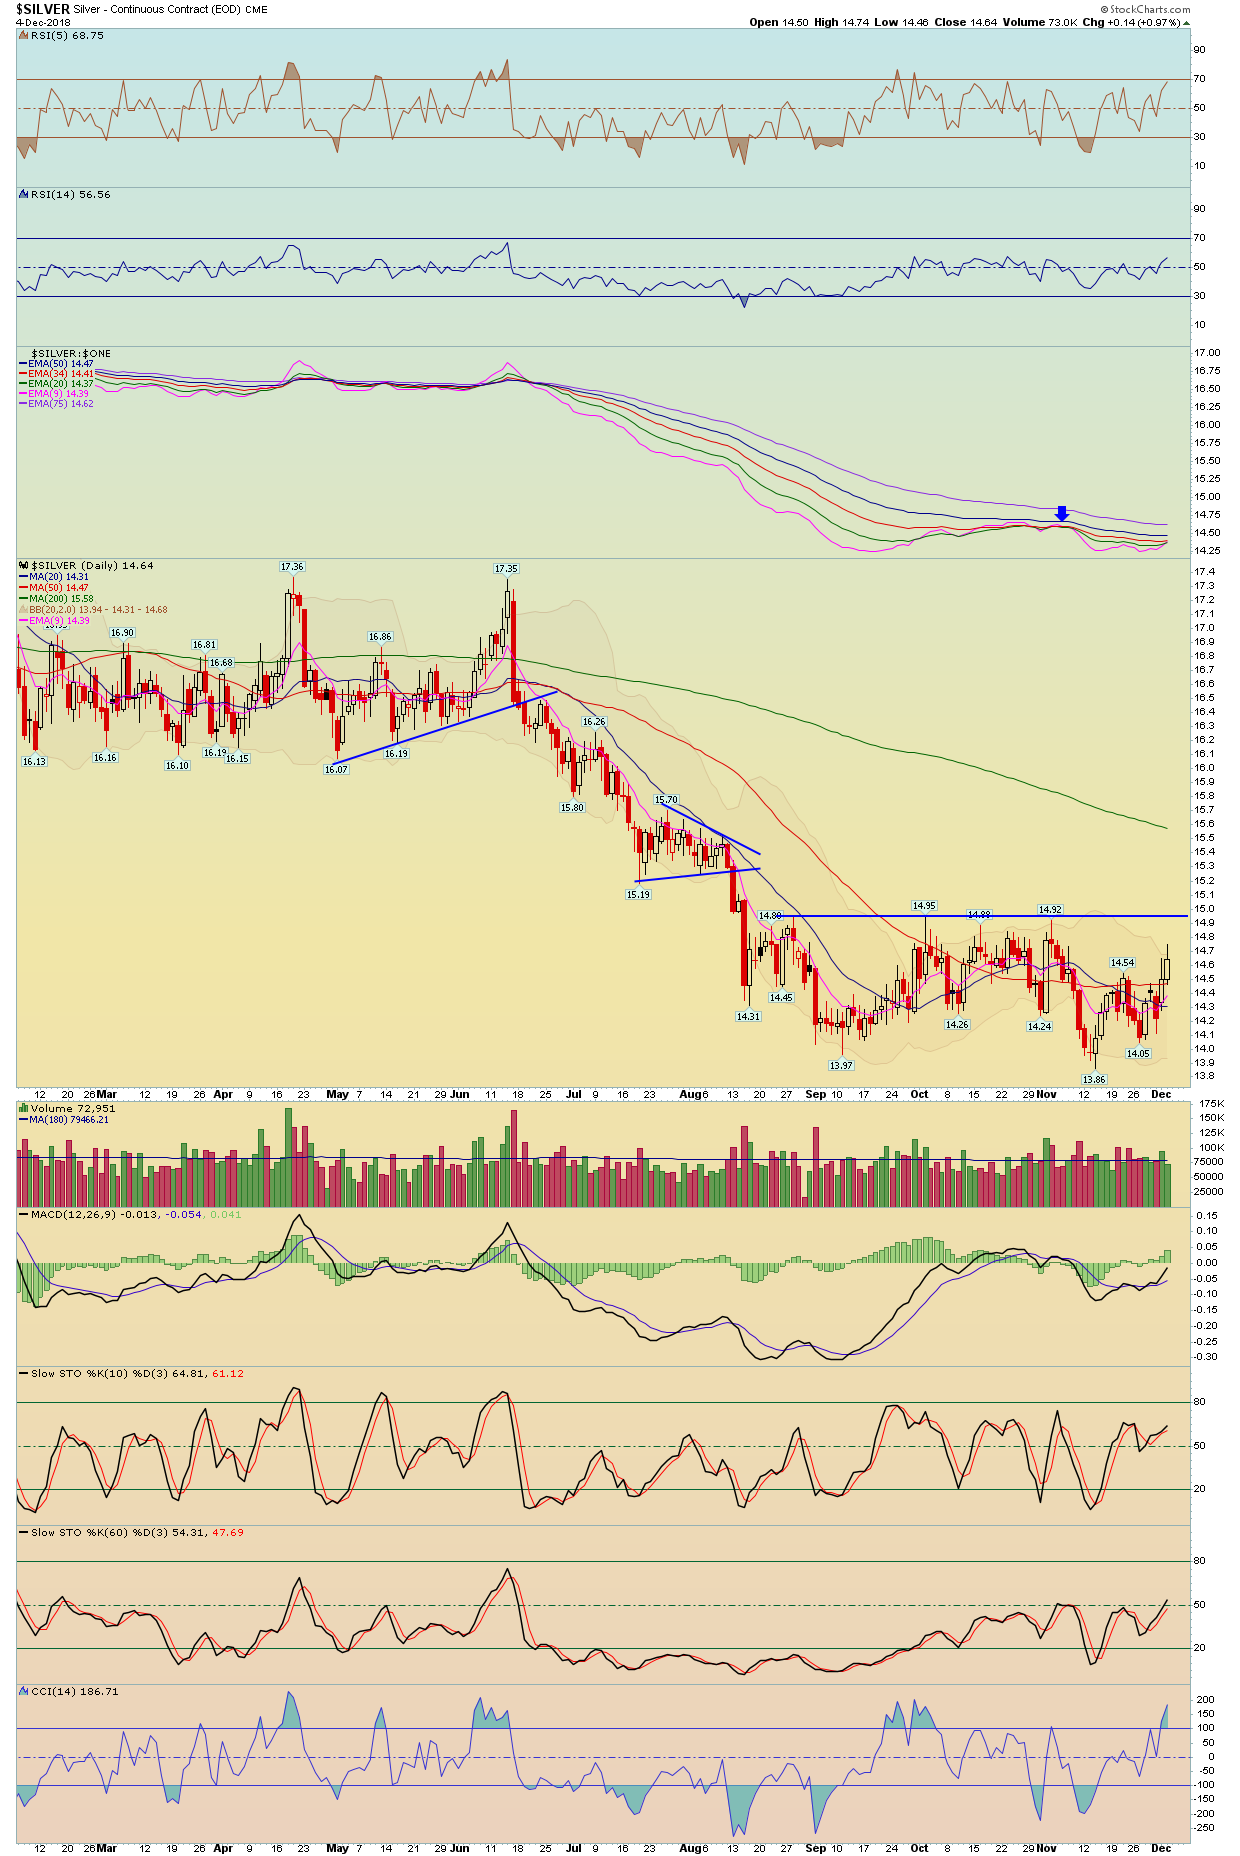
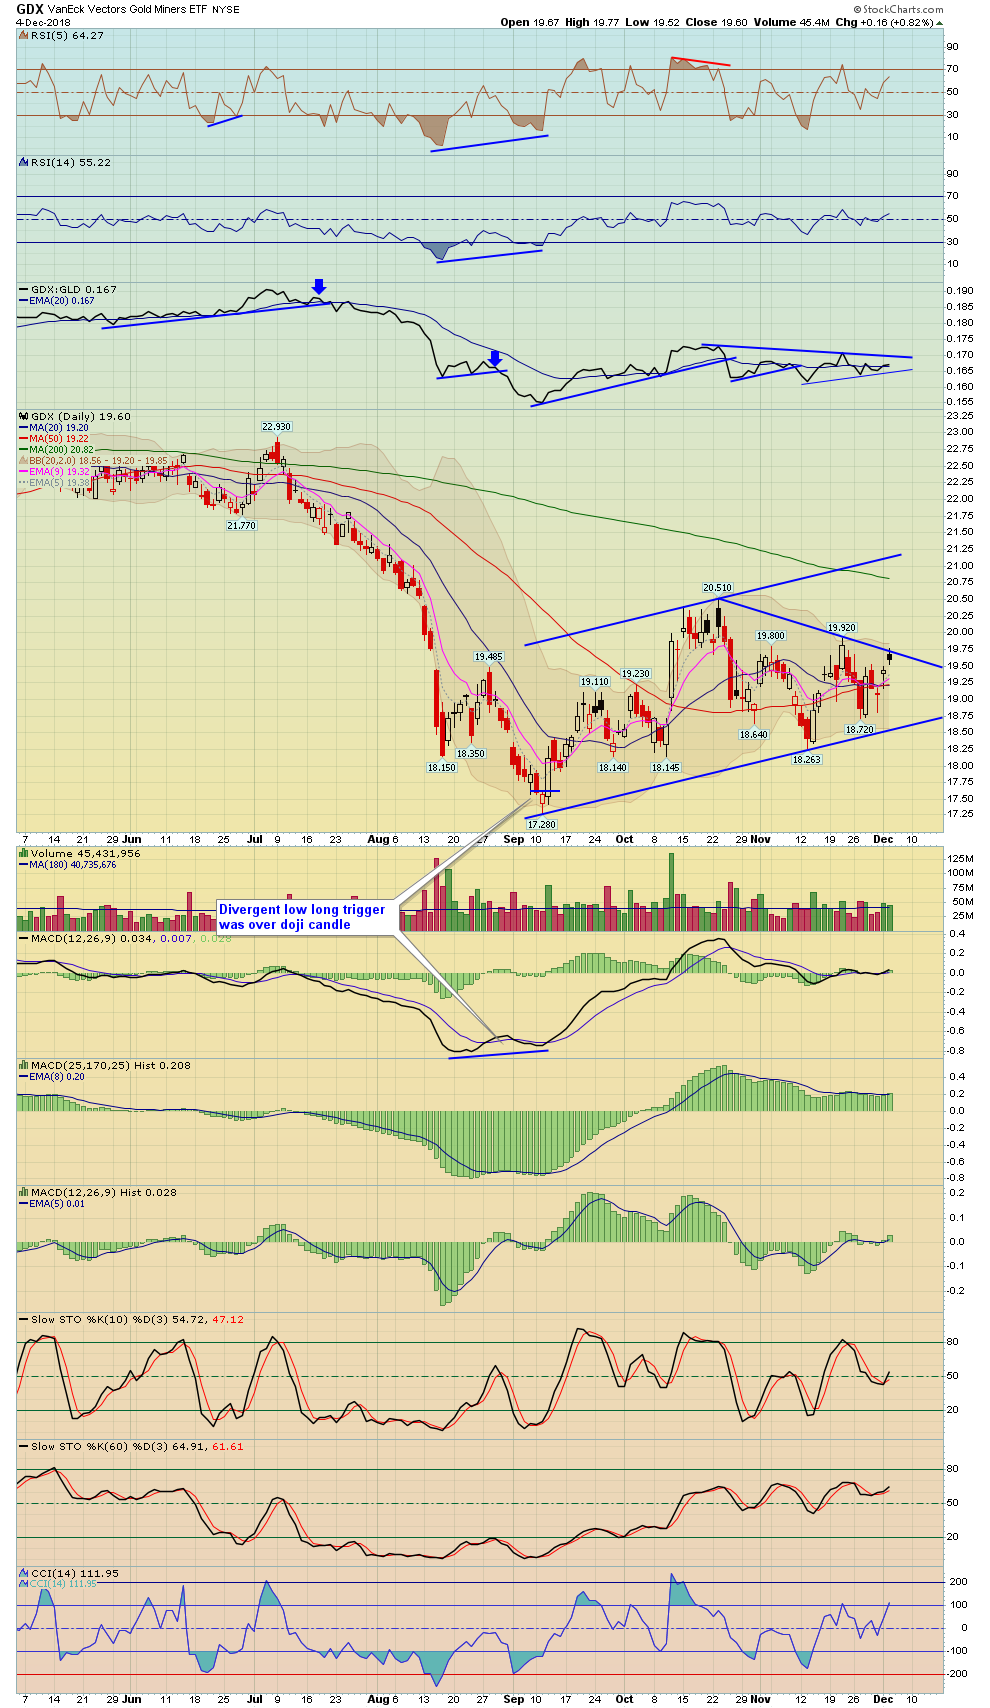
4. Precious Metals and GDX
5. Trade Ideas (are you kidding?)
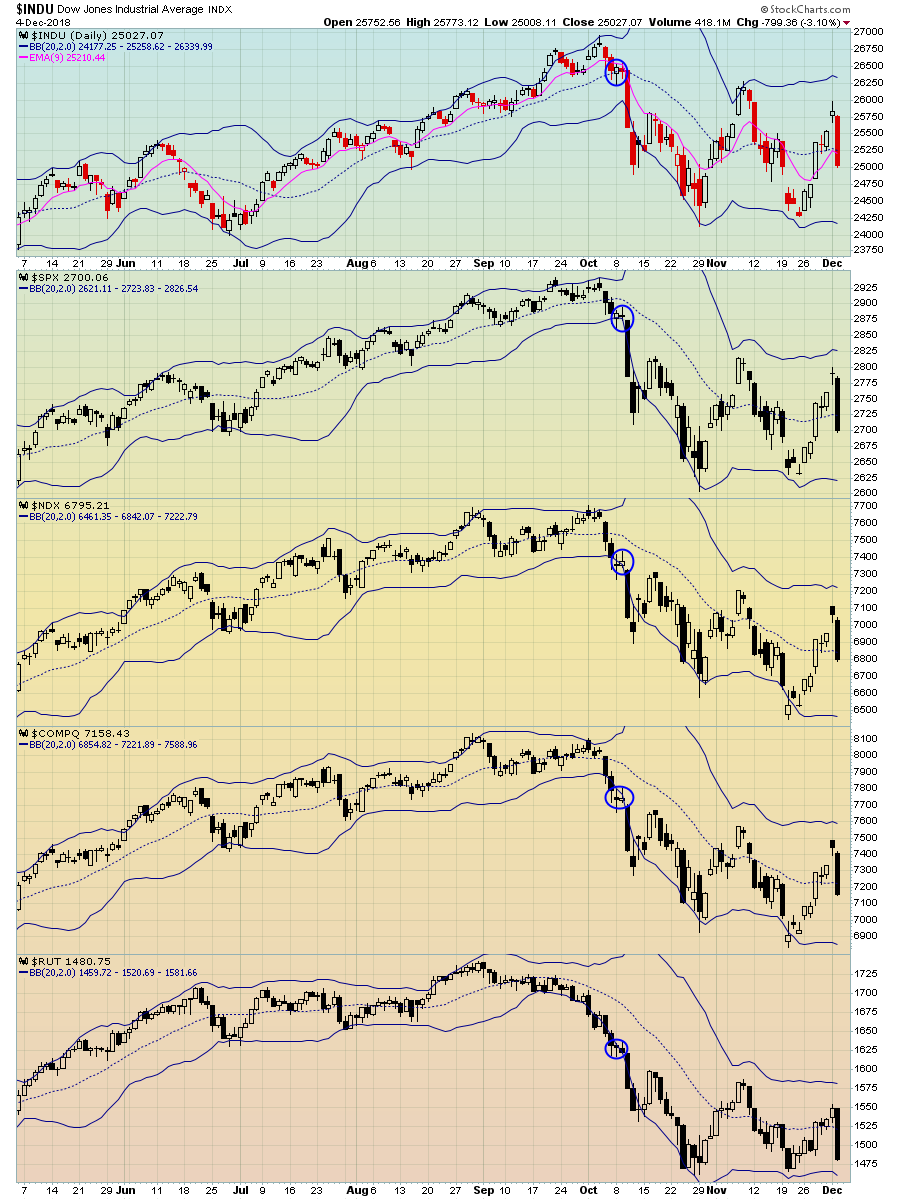
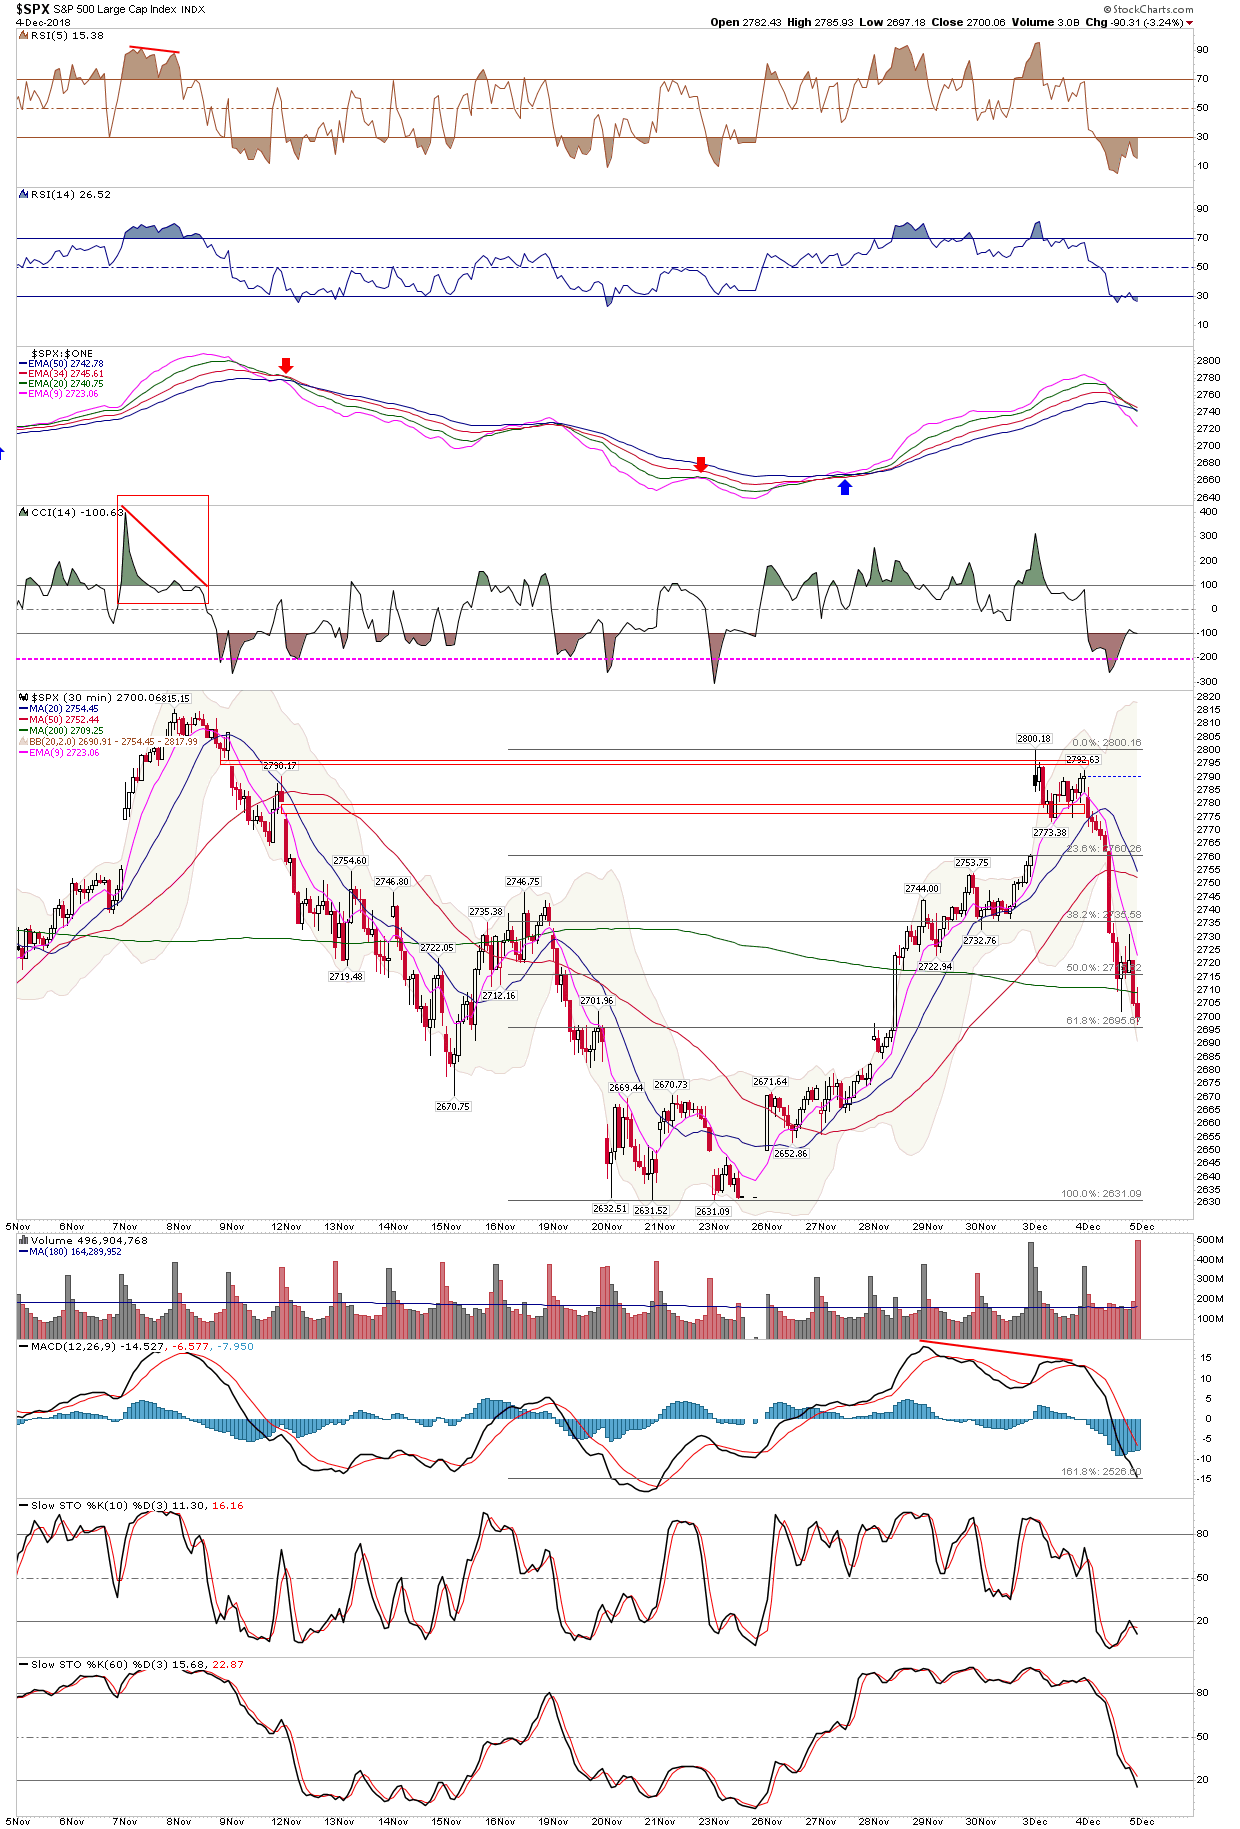
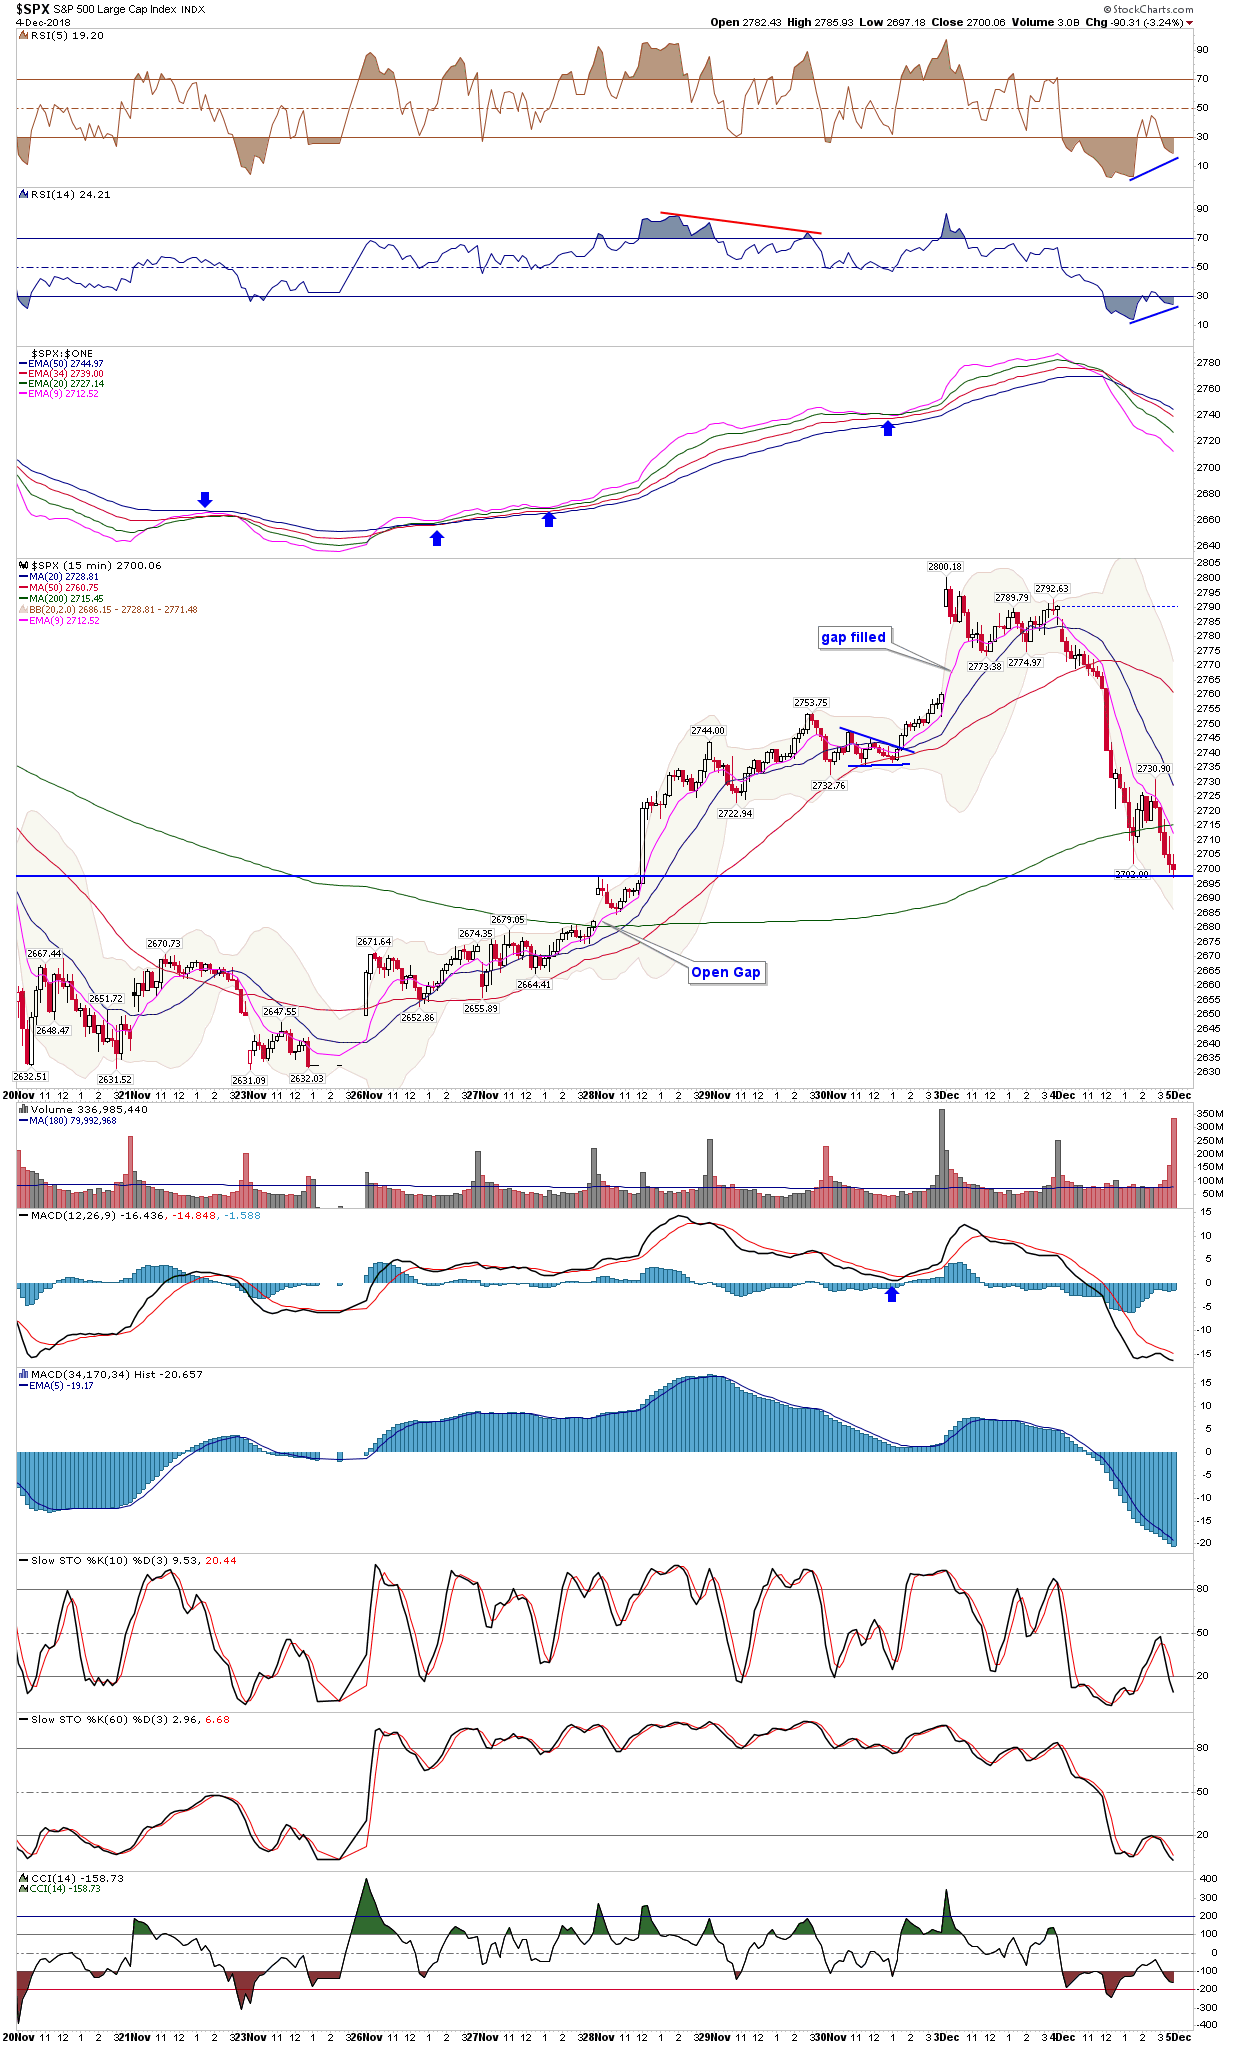
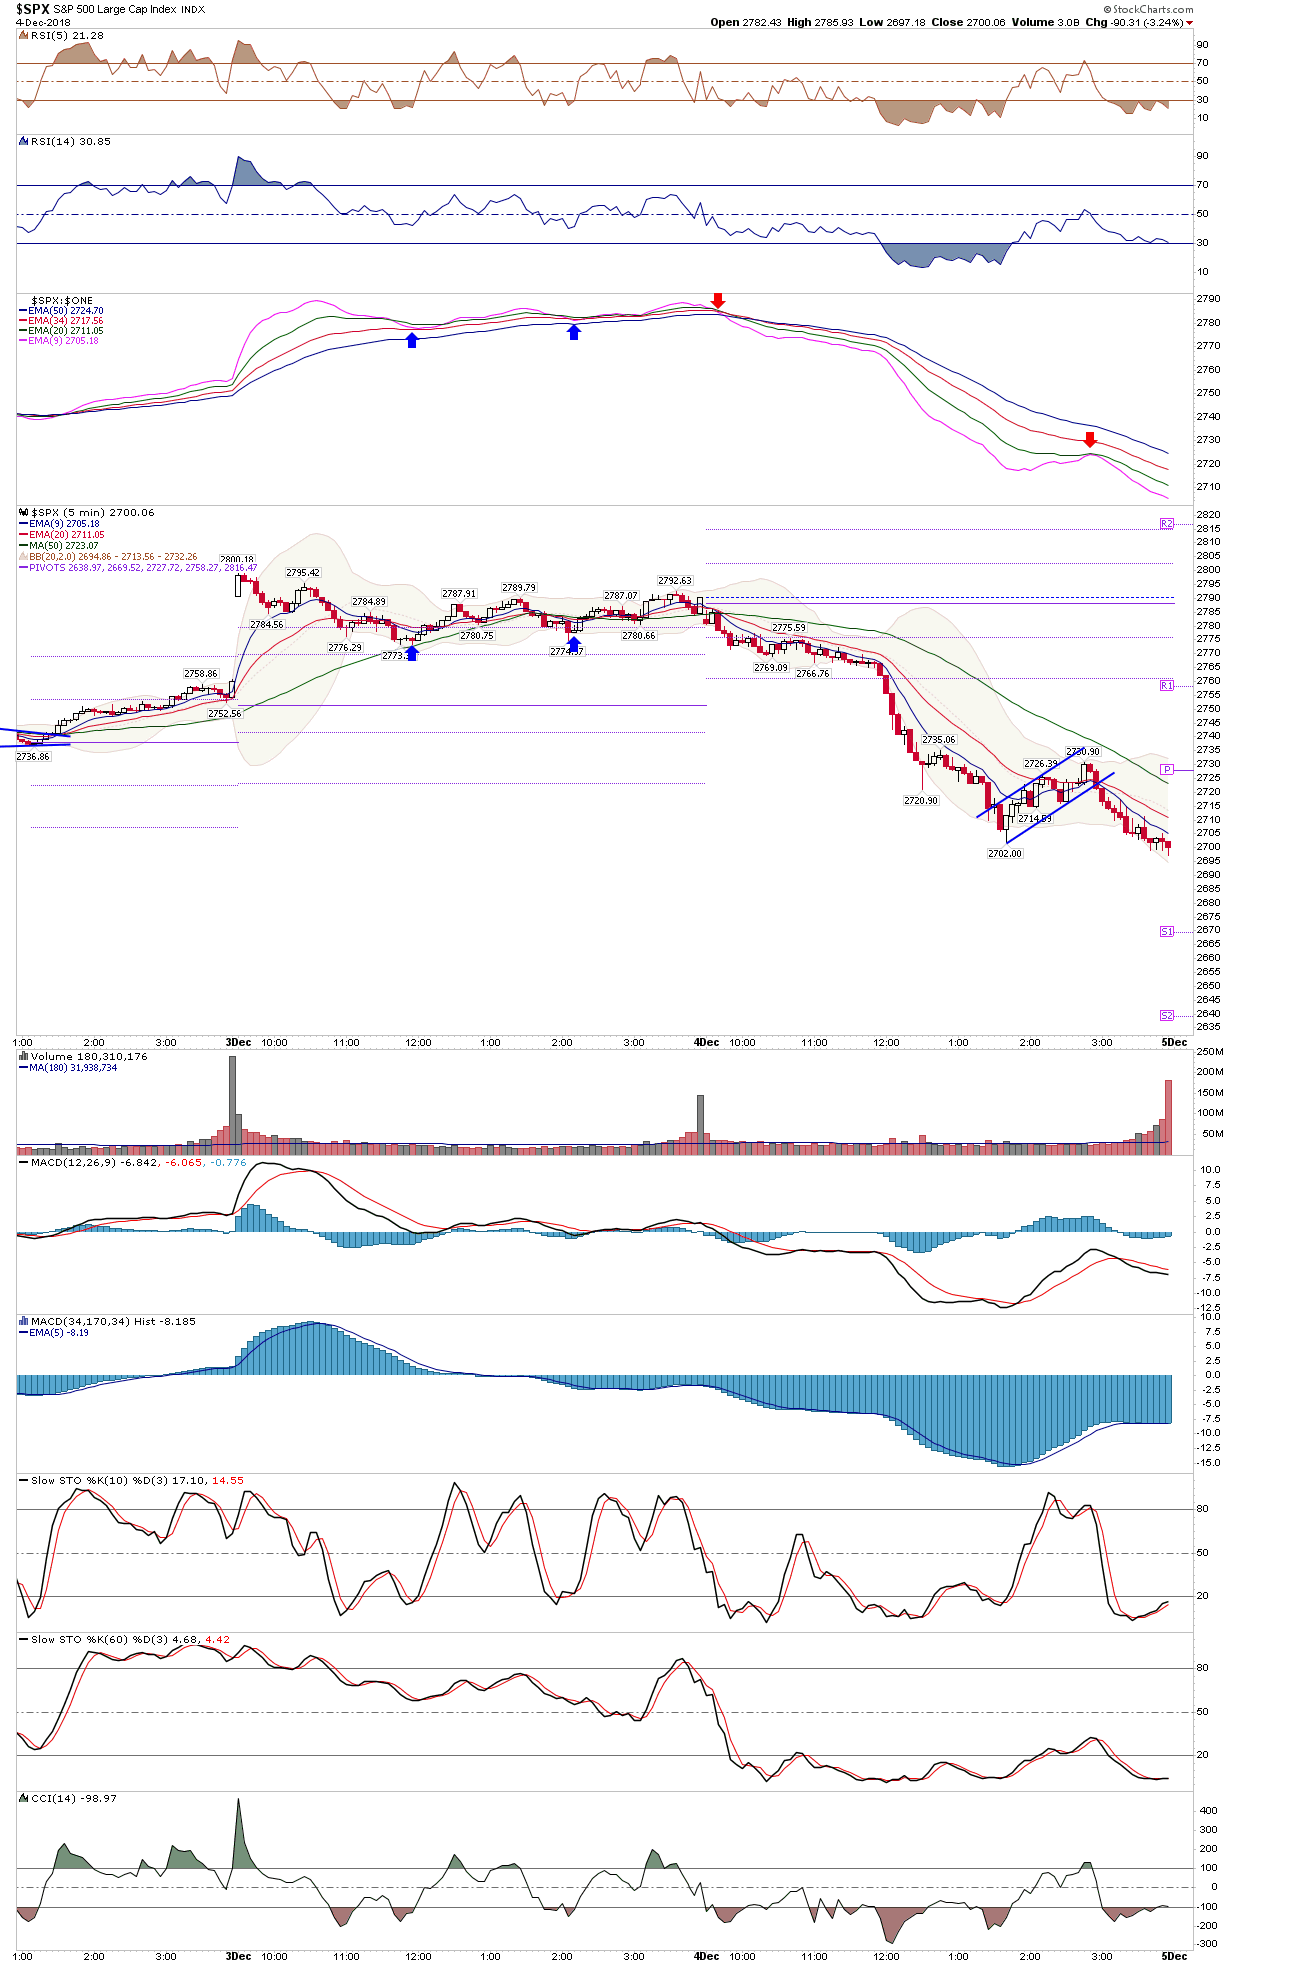
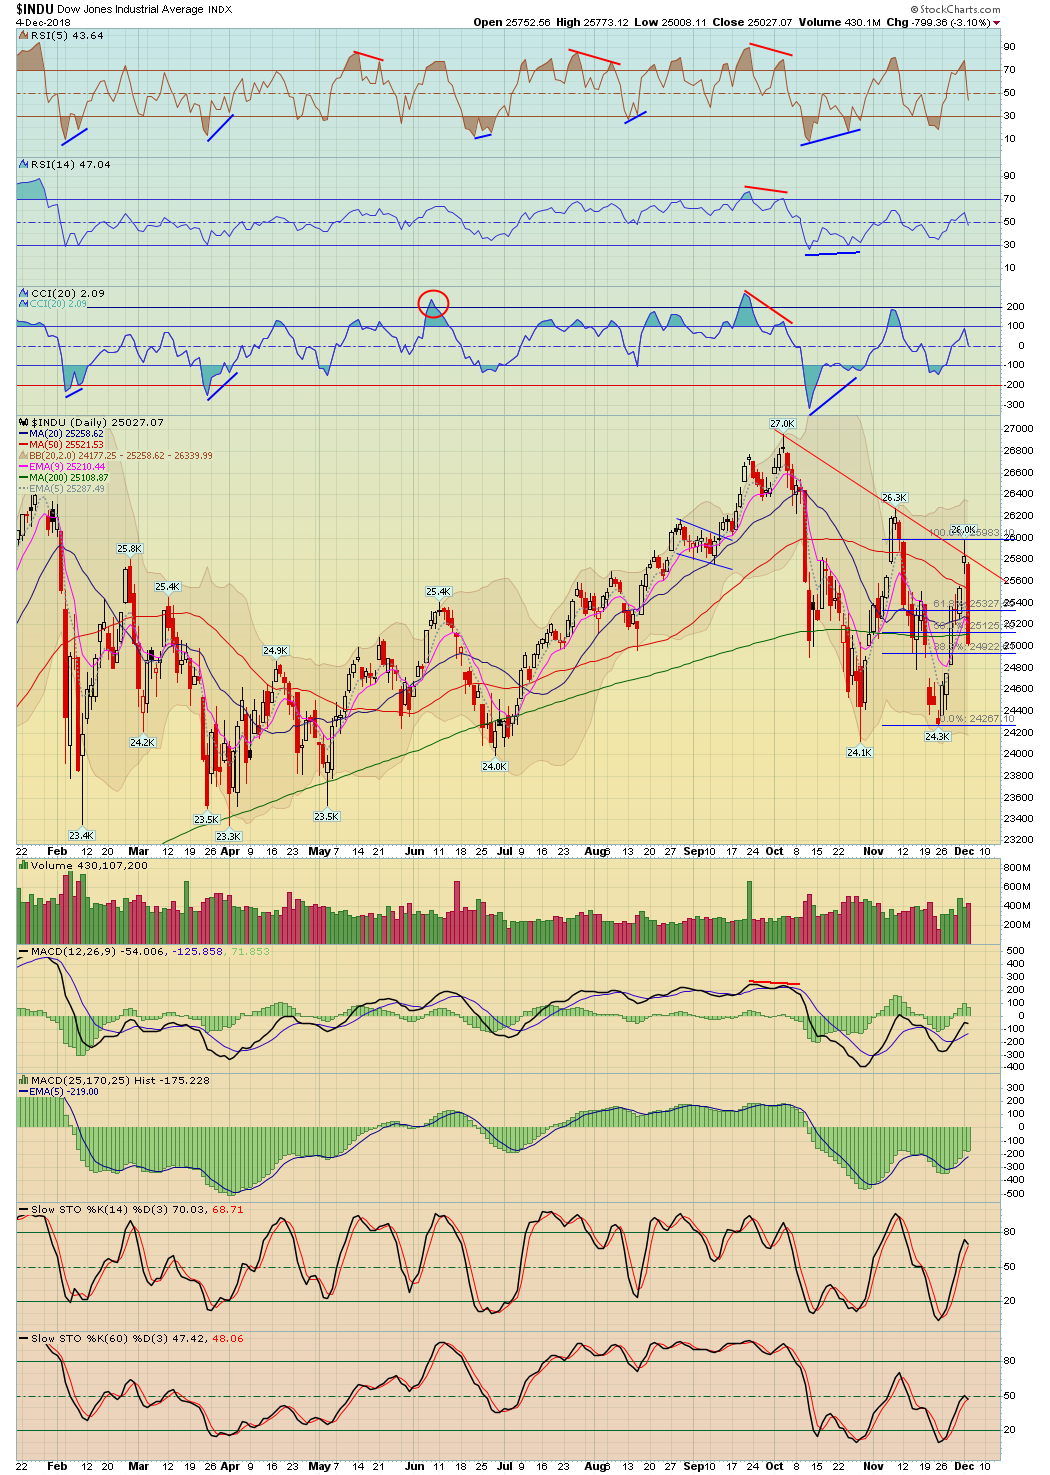
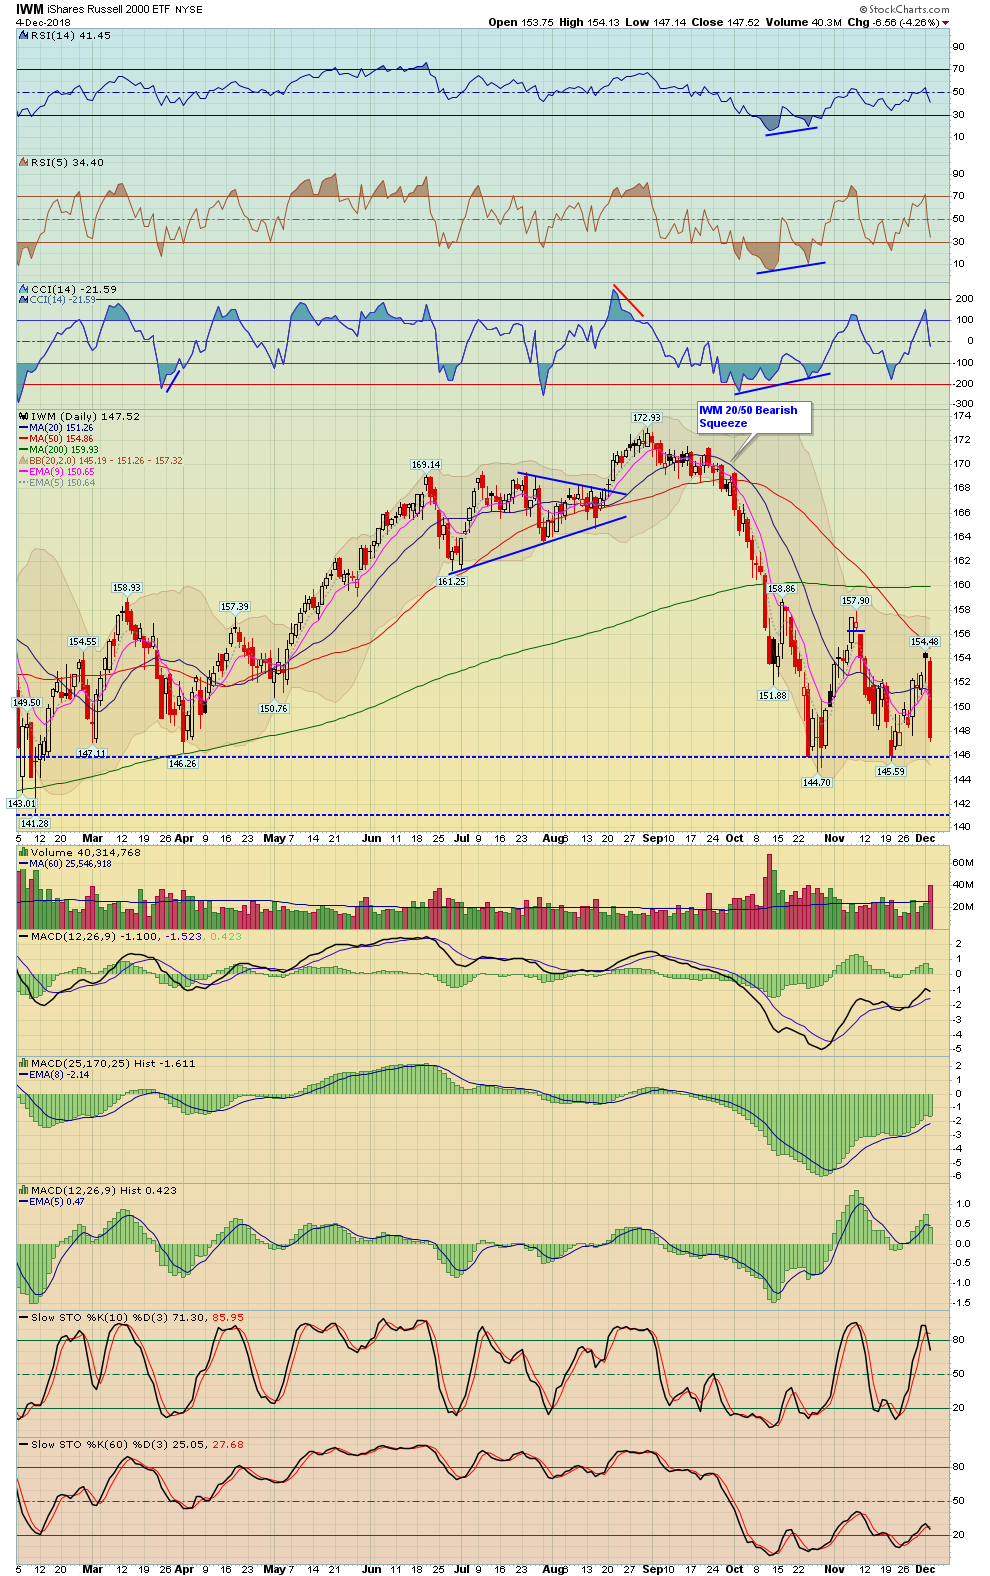
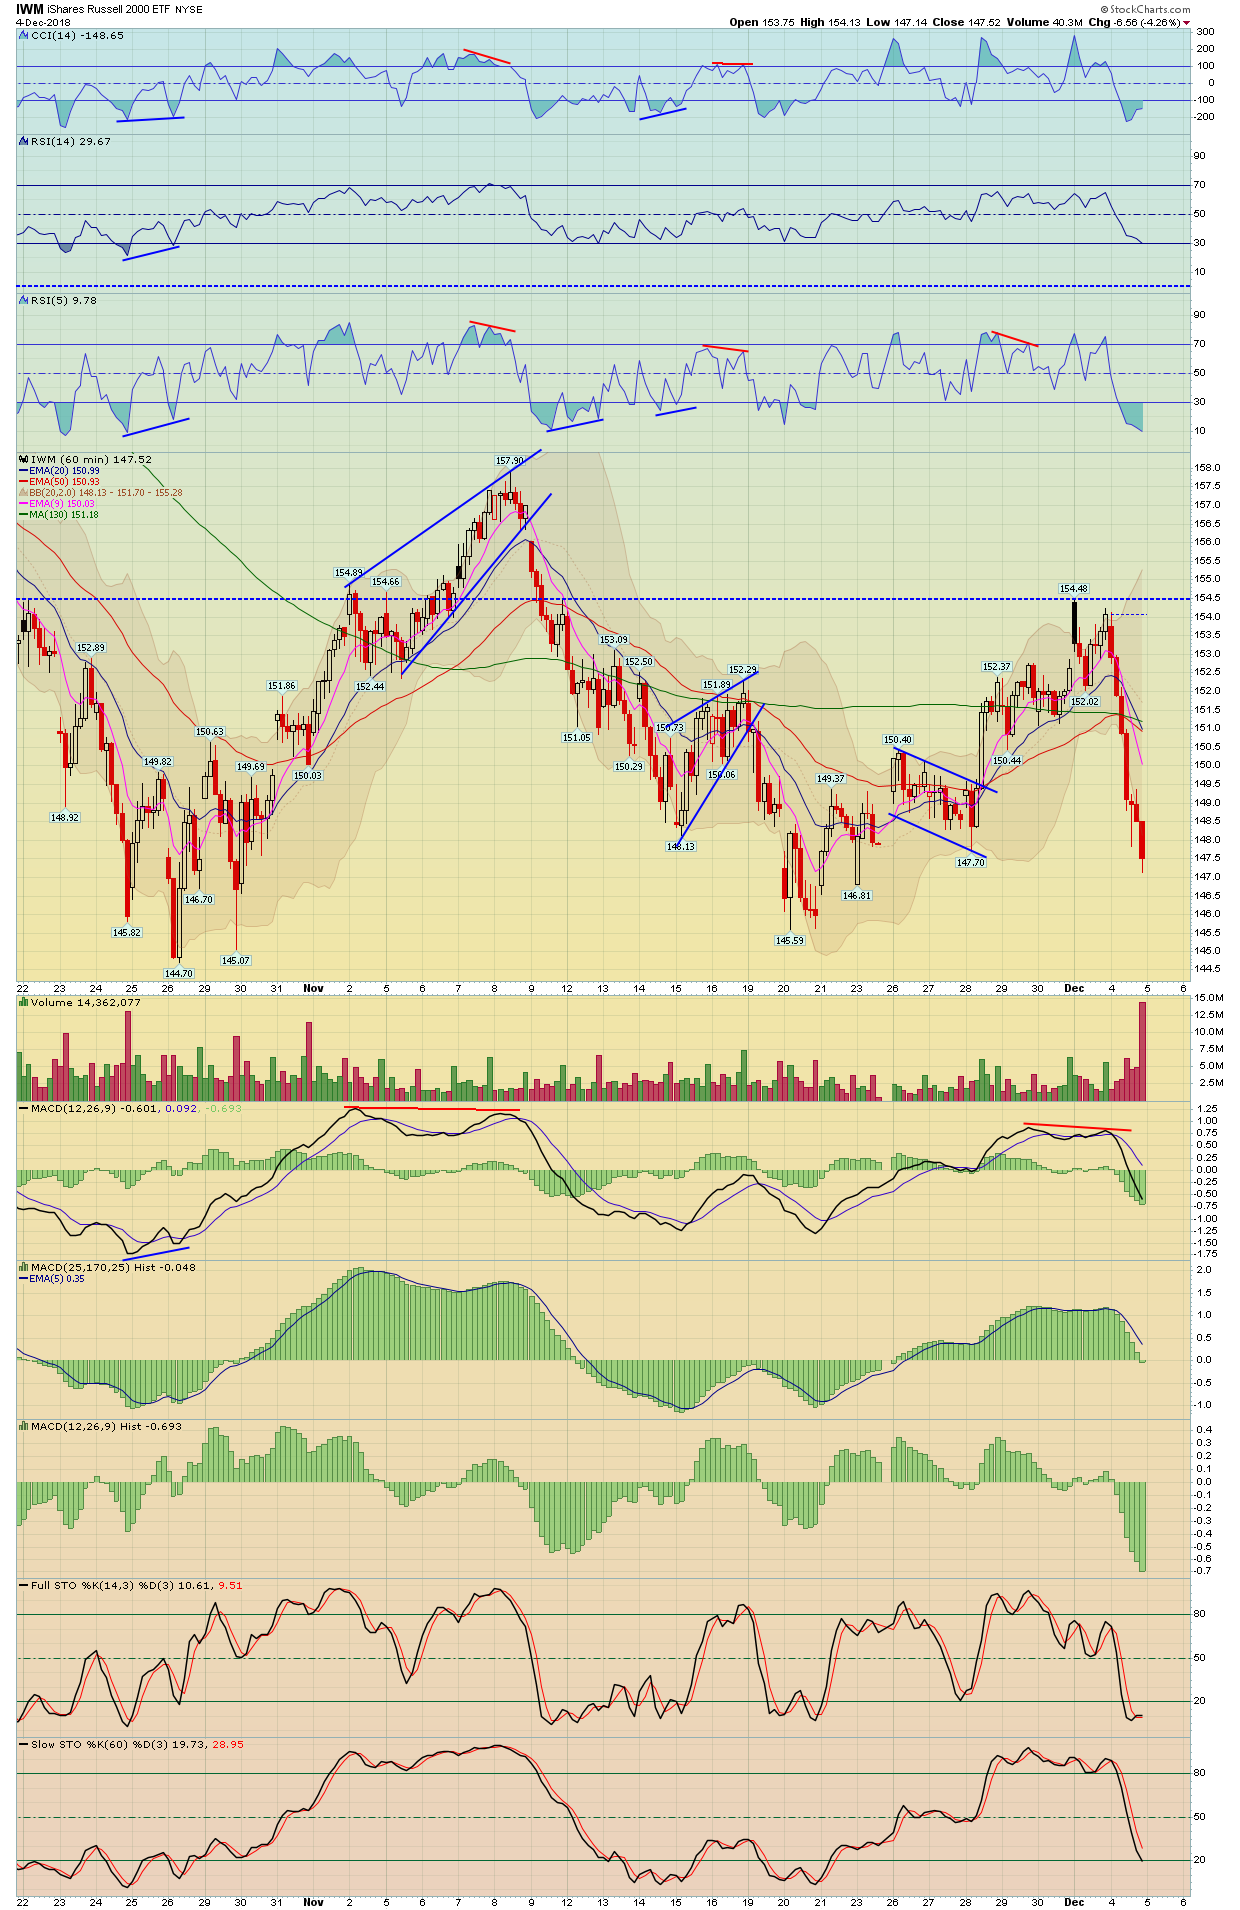
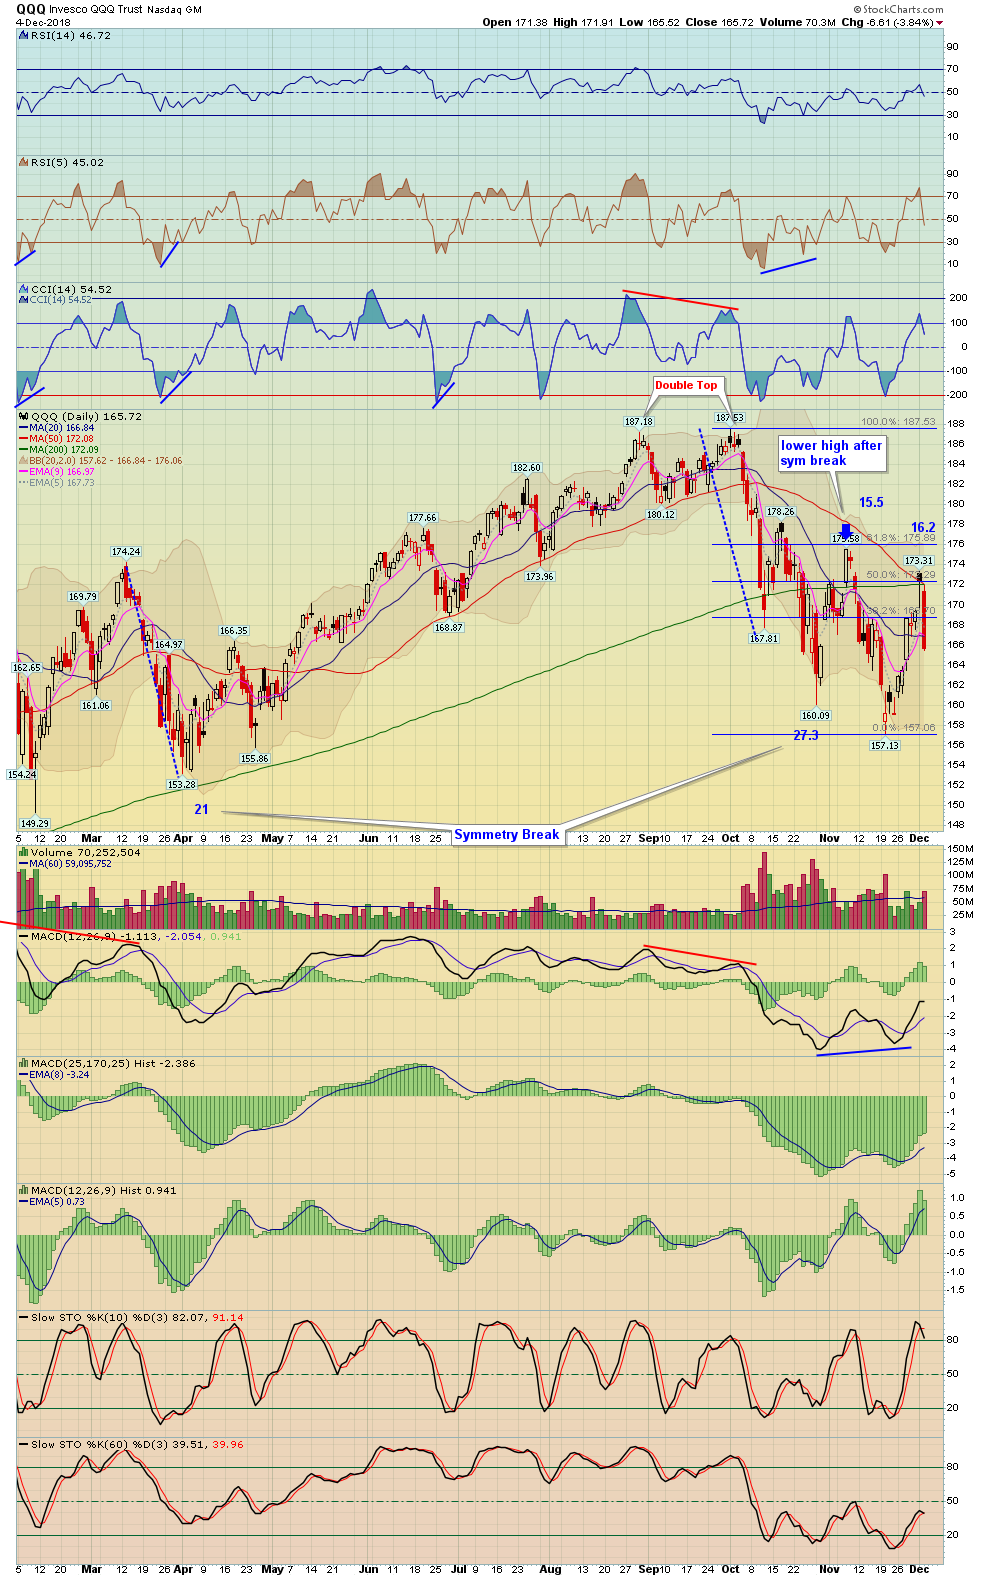
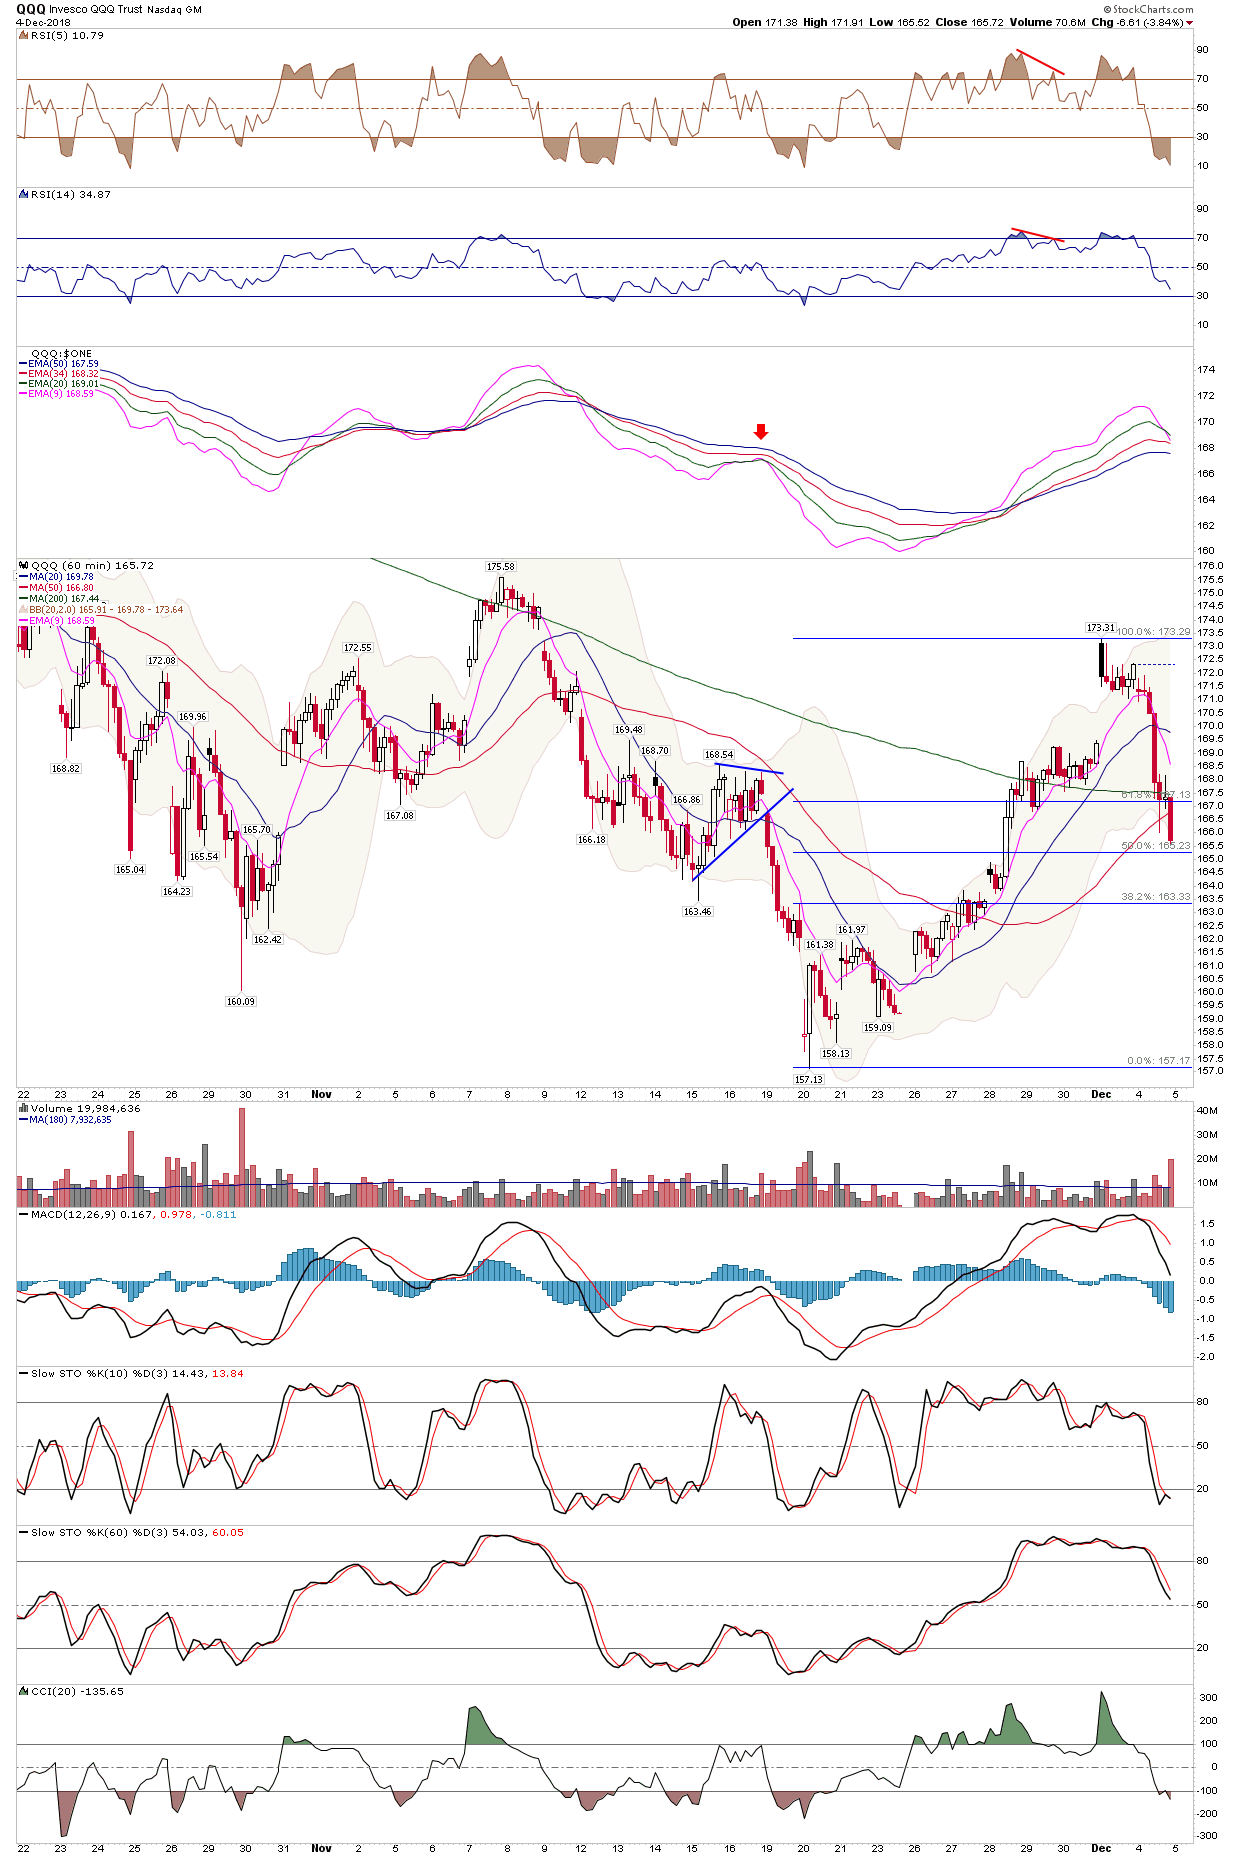
The market was bludgeoned on Tuesday, SPX lost 90 points or 3.25%, the Dow Jones lost 800 points or 3.1%, the Nasdaq lost 3.8%, and the Russell 2000 Small Caps lost 4.4%!
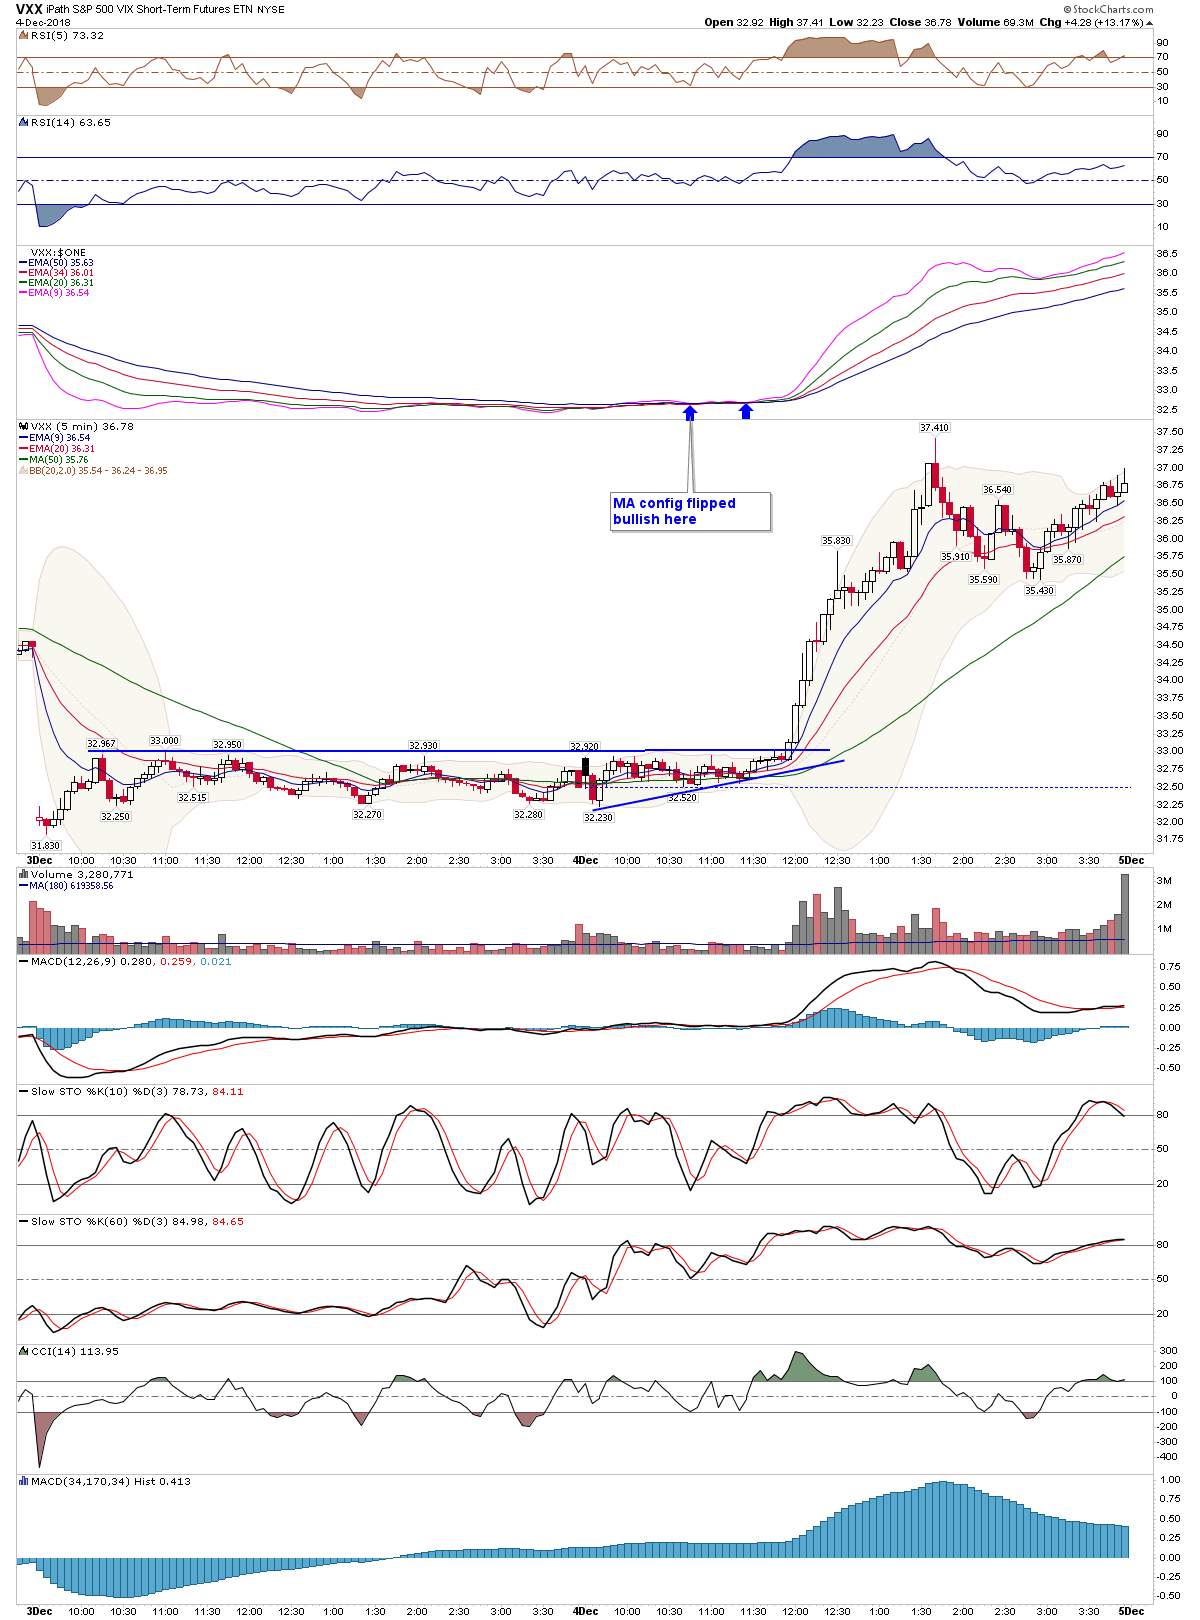
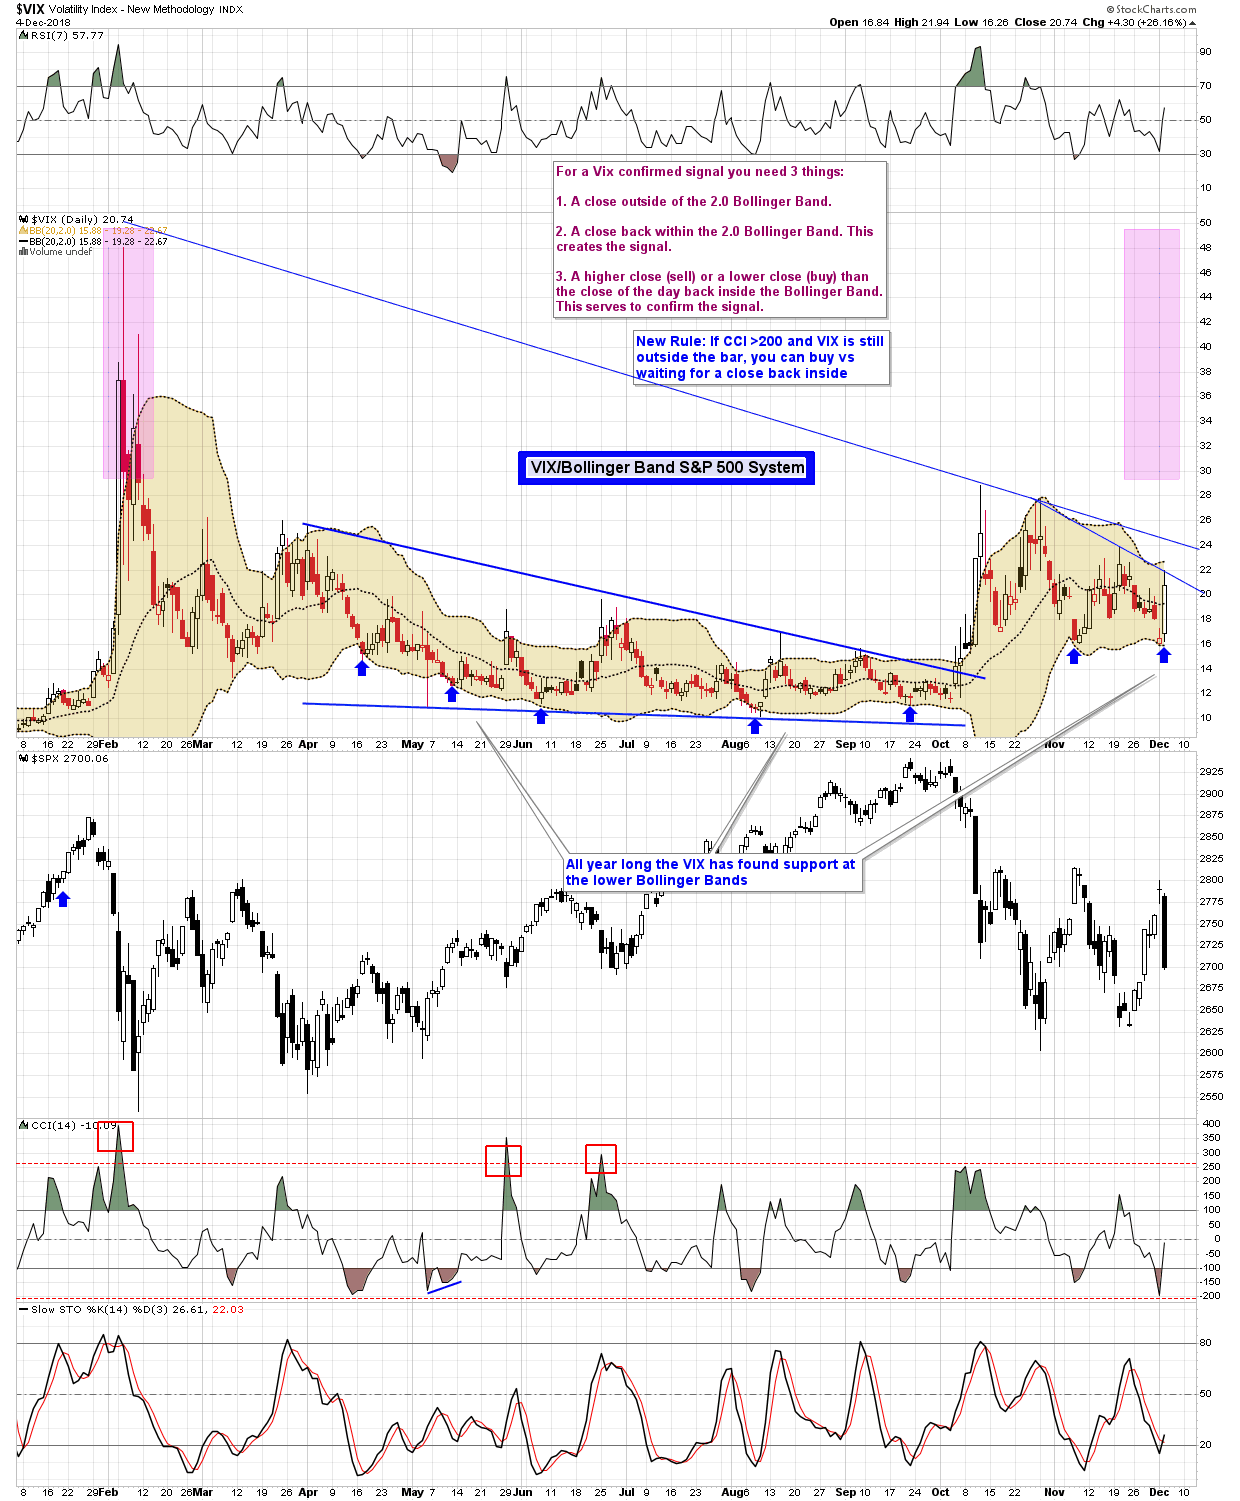
Despite some bullish calls from various market commentators recently, Steve and I have always viewed the latest market rally as a corrective bounce in a longer term downtrend. If you listened to my weekend newsletter I stated that a gap up on Monday in response to the G20 Tariff pause would be a good opportunity to sell and lighten up on long positions. On Monday morning just after the opening bell I sent out an alert on the SPY system re-iterating that the big gap up on Monday morning would be a good opportunity to trim/lighten up on SPY and other longs. Boy has that played out especially with today's huge sell off. Also on the weekend I said to watch the VIX indicator, I said that the lower Bollinger Bands would likely act as support and that's exactly what happened, the VIX tagged the lower Bollinger Bands yesterday morning and that was the low. All year long each time the VIX has tagged the lower Bollinger Band it has rallied - this is something we also discussed early this year. See VIX Chart
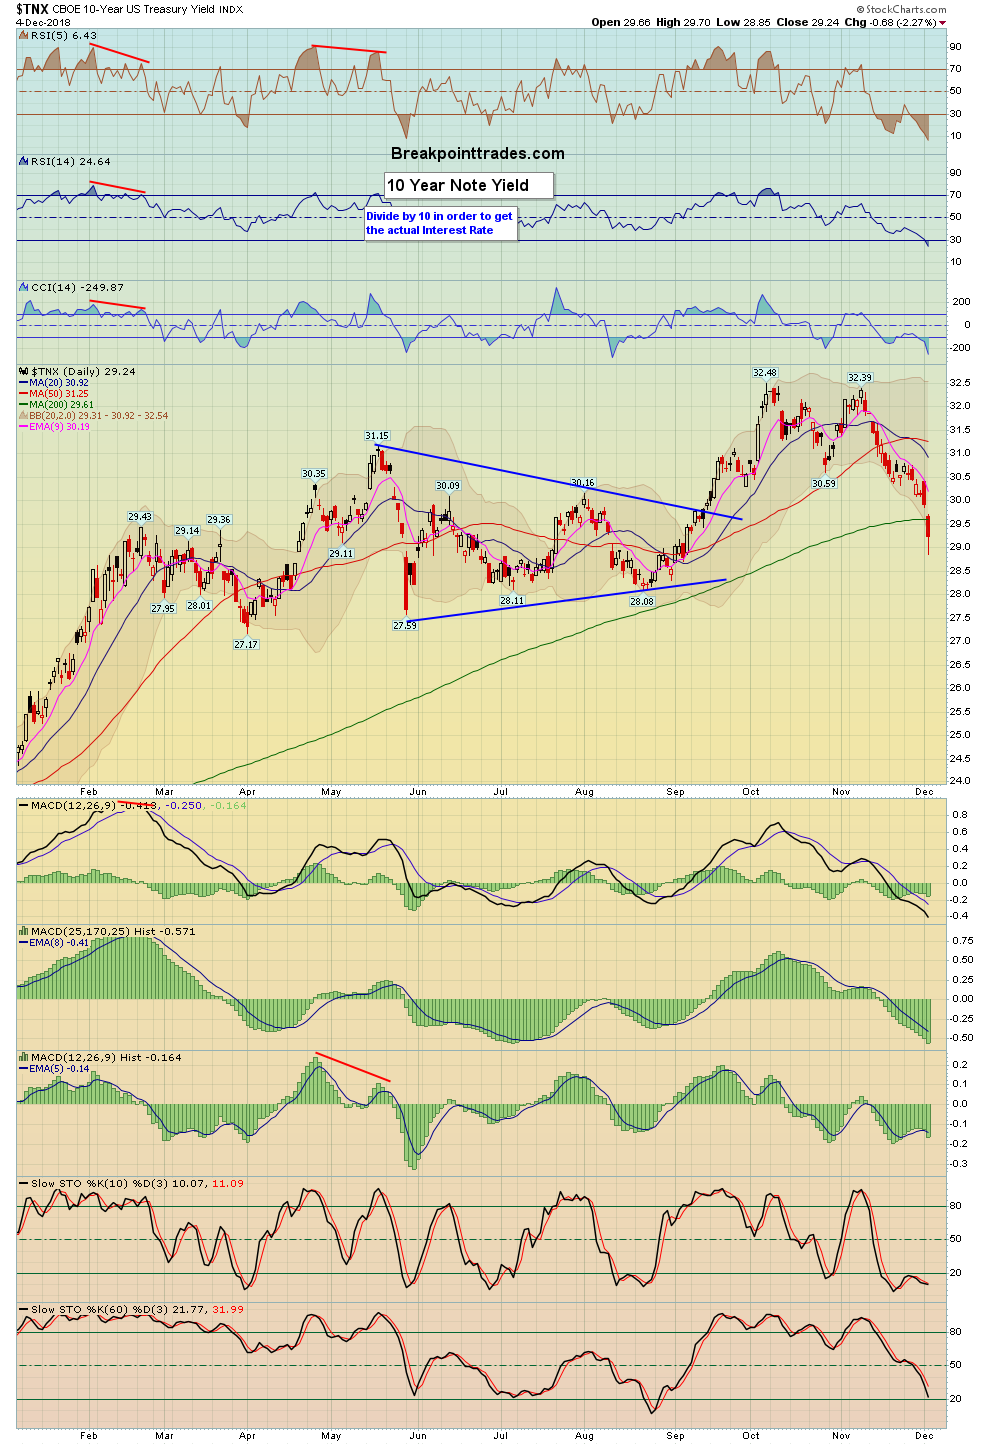
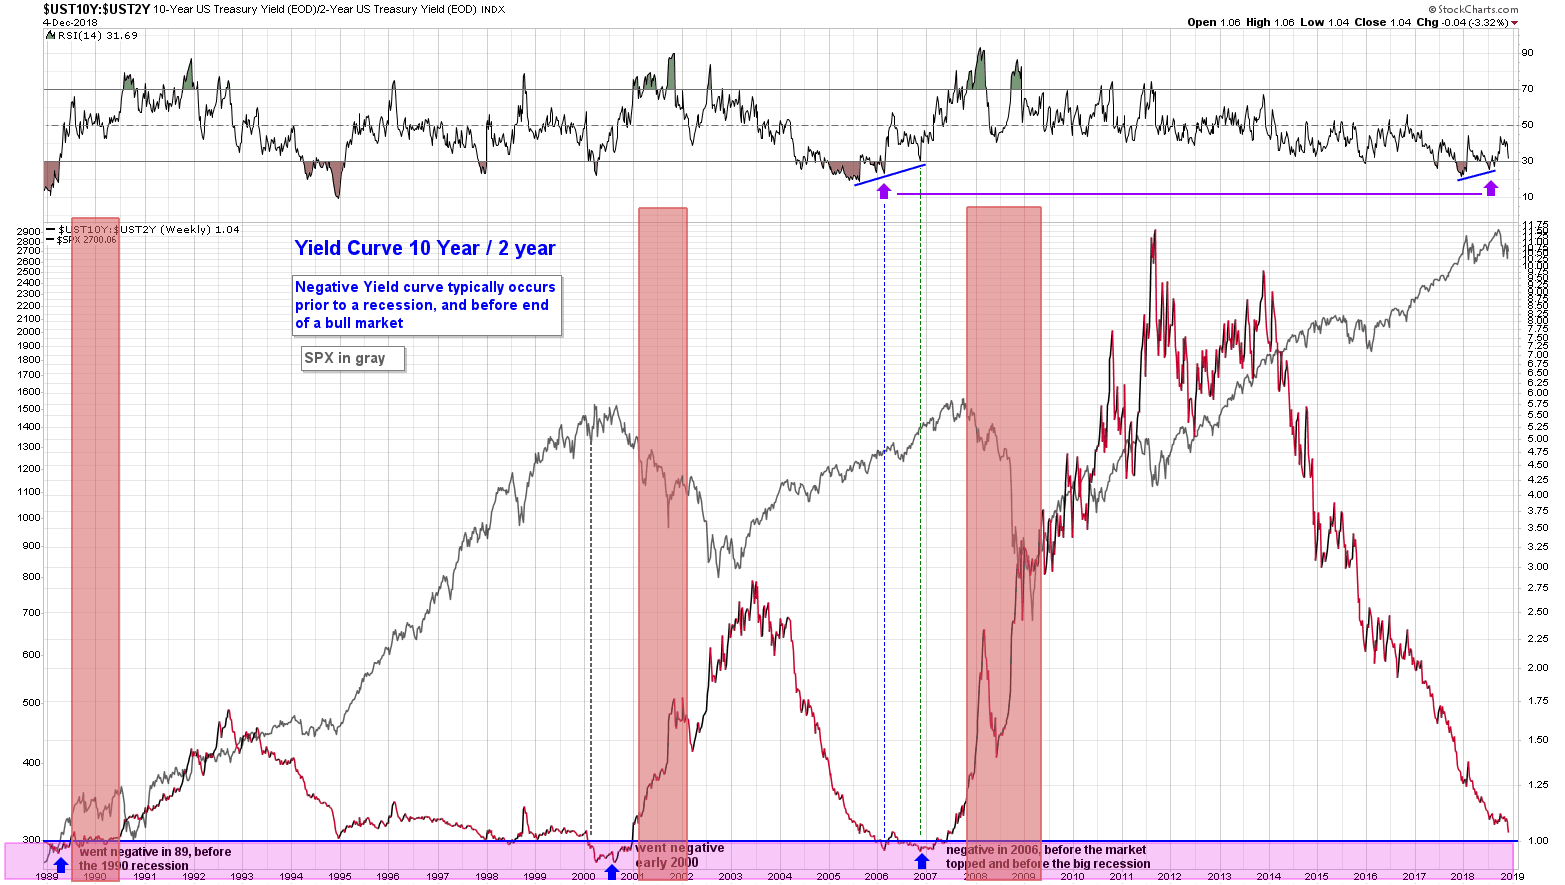
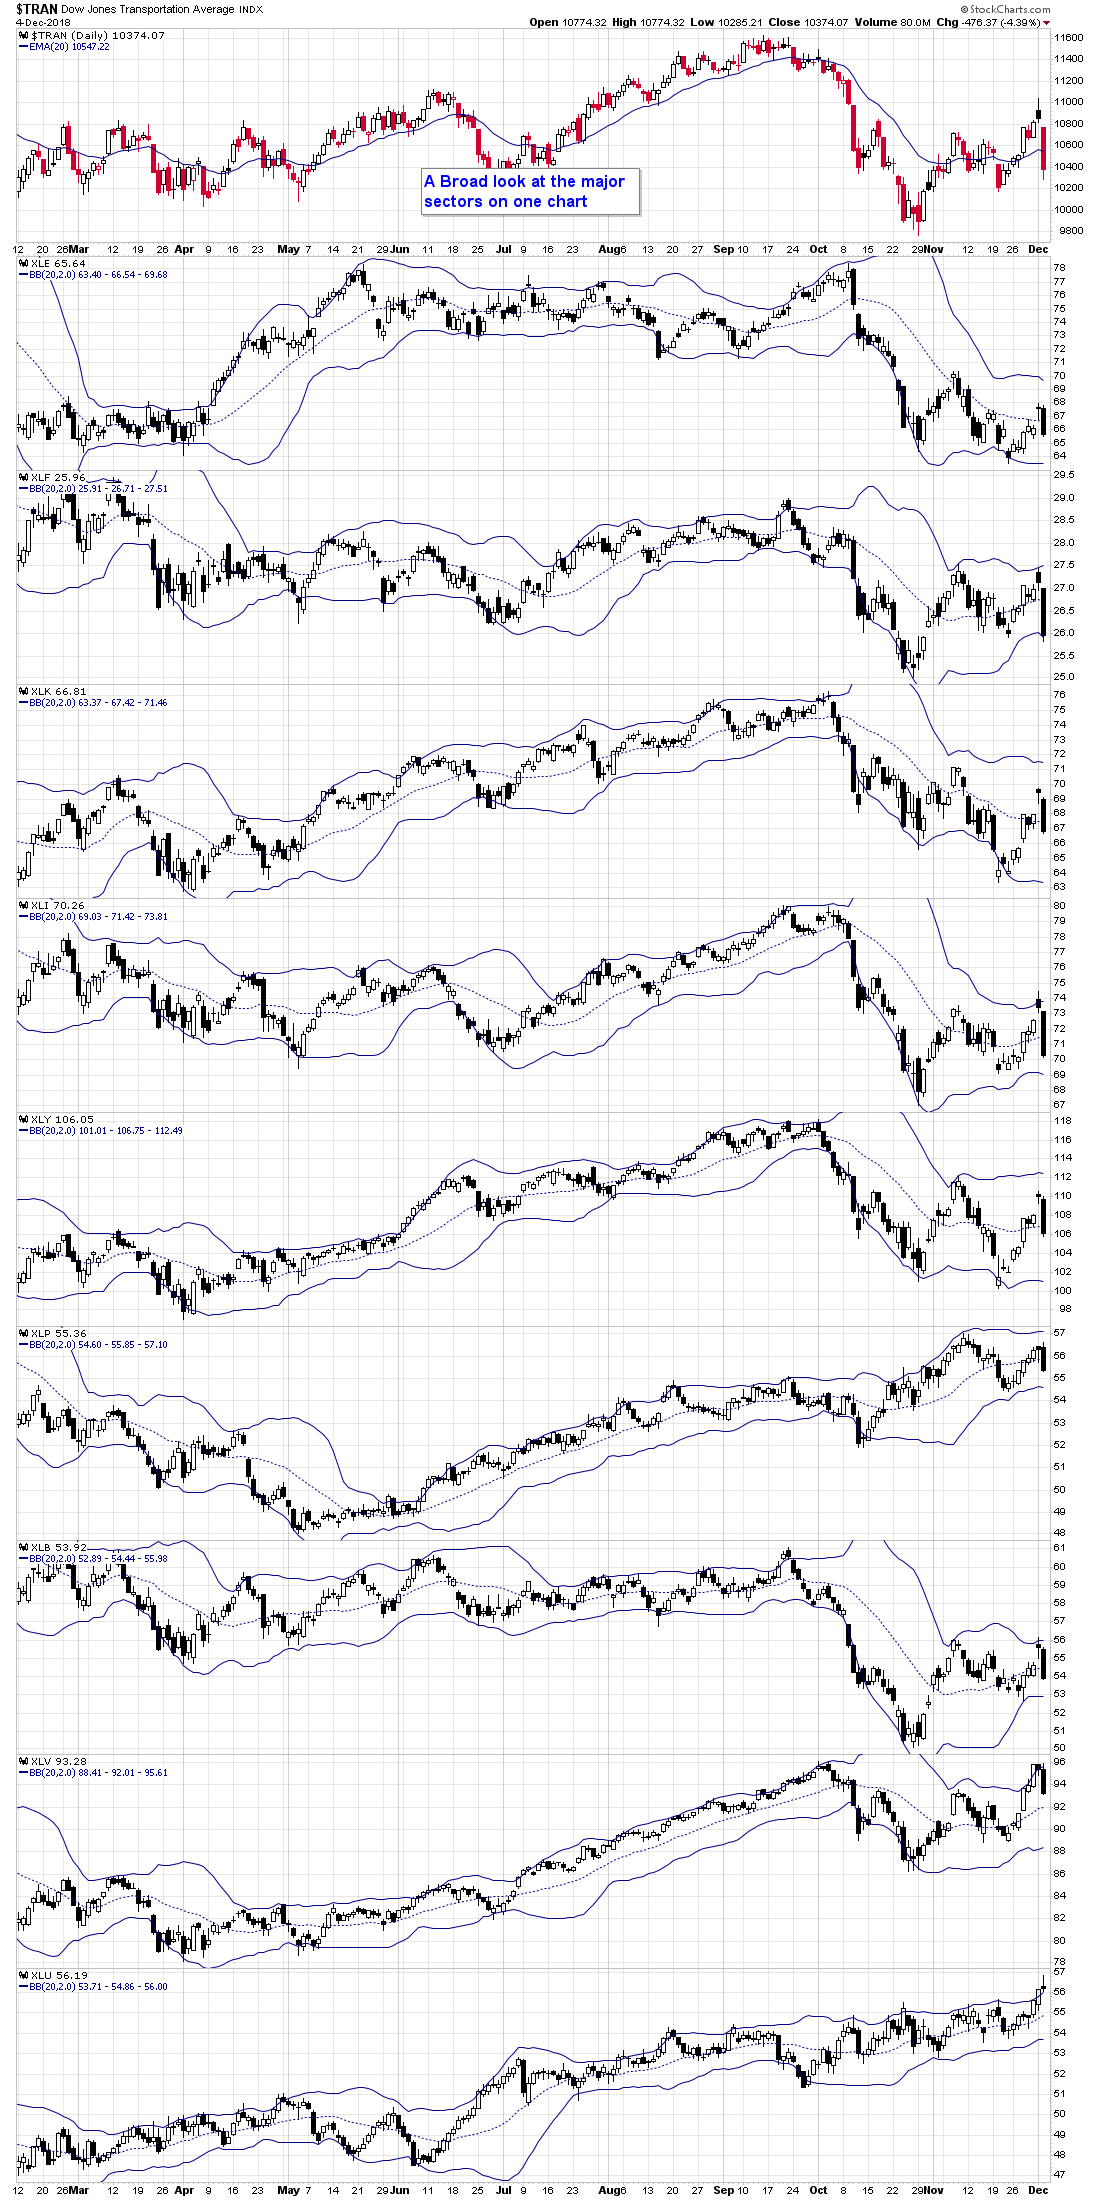
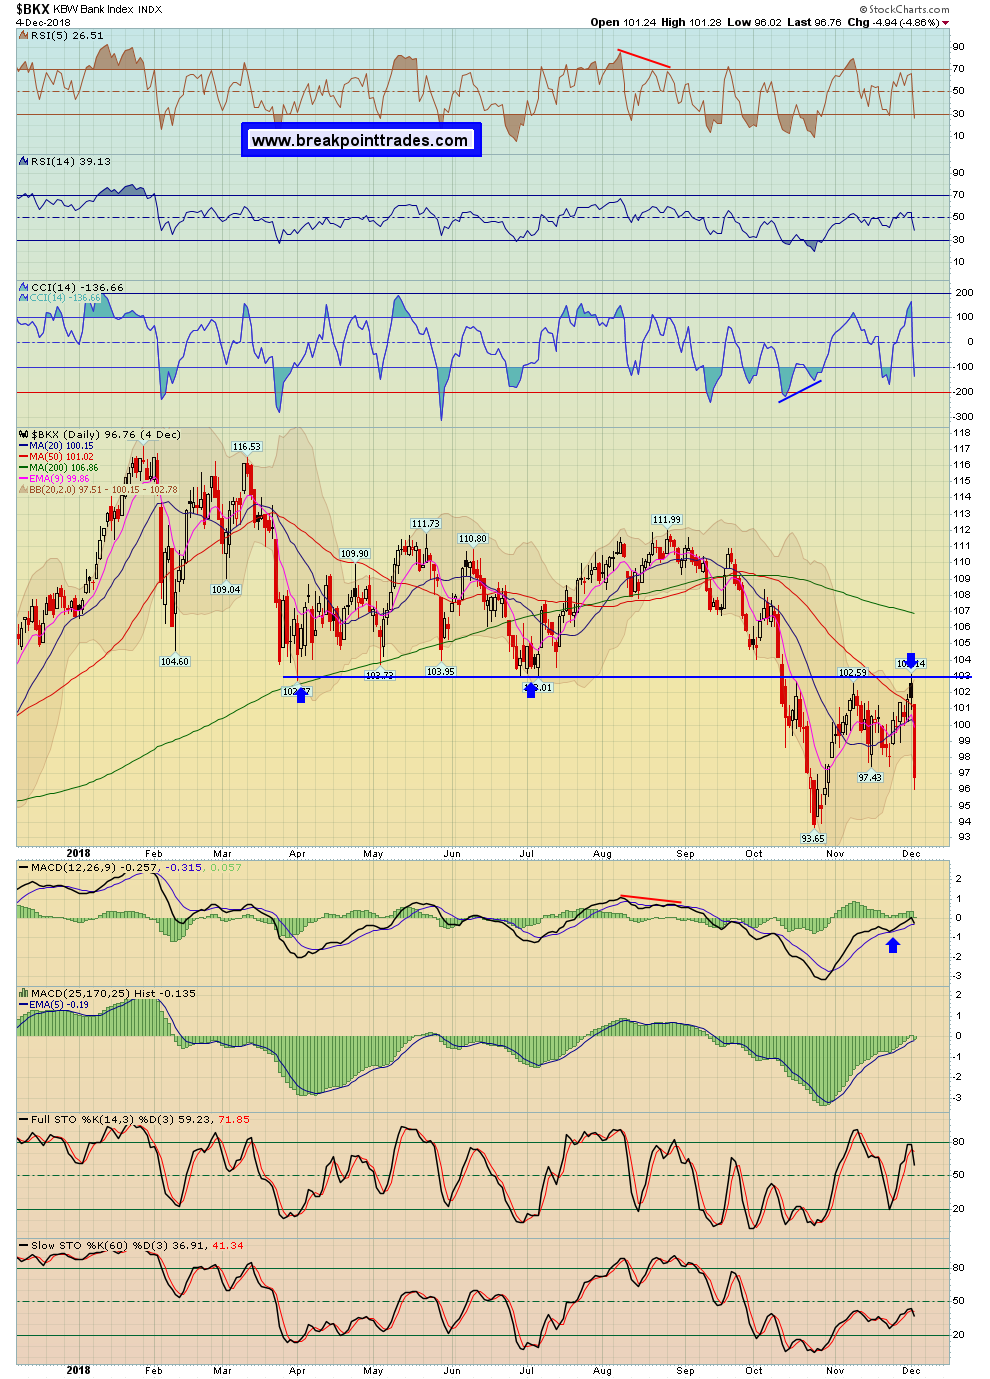
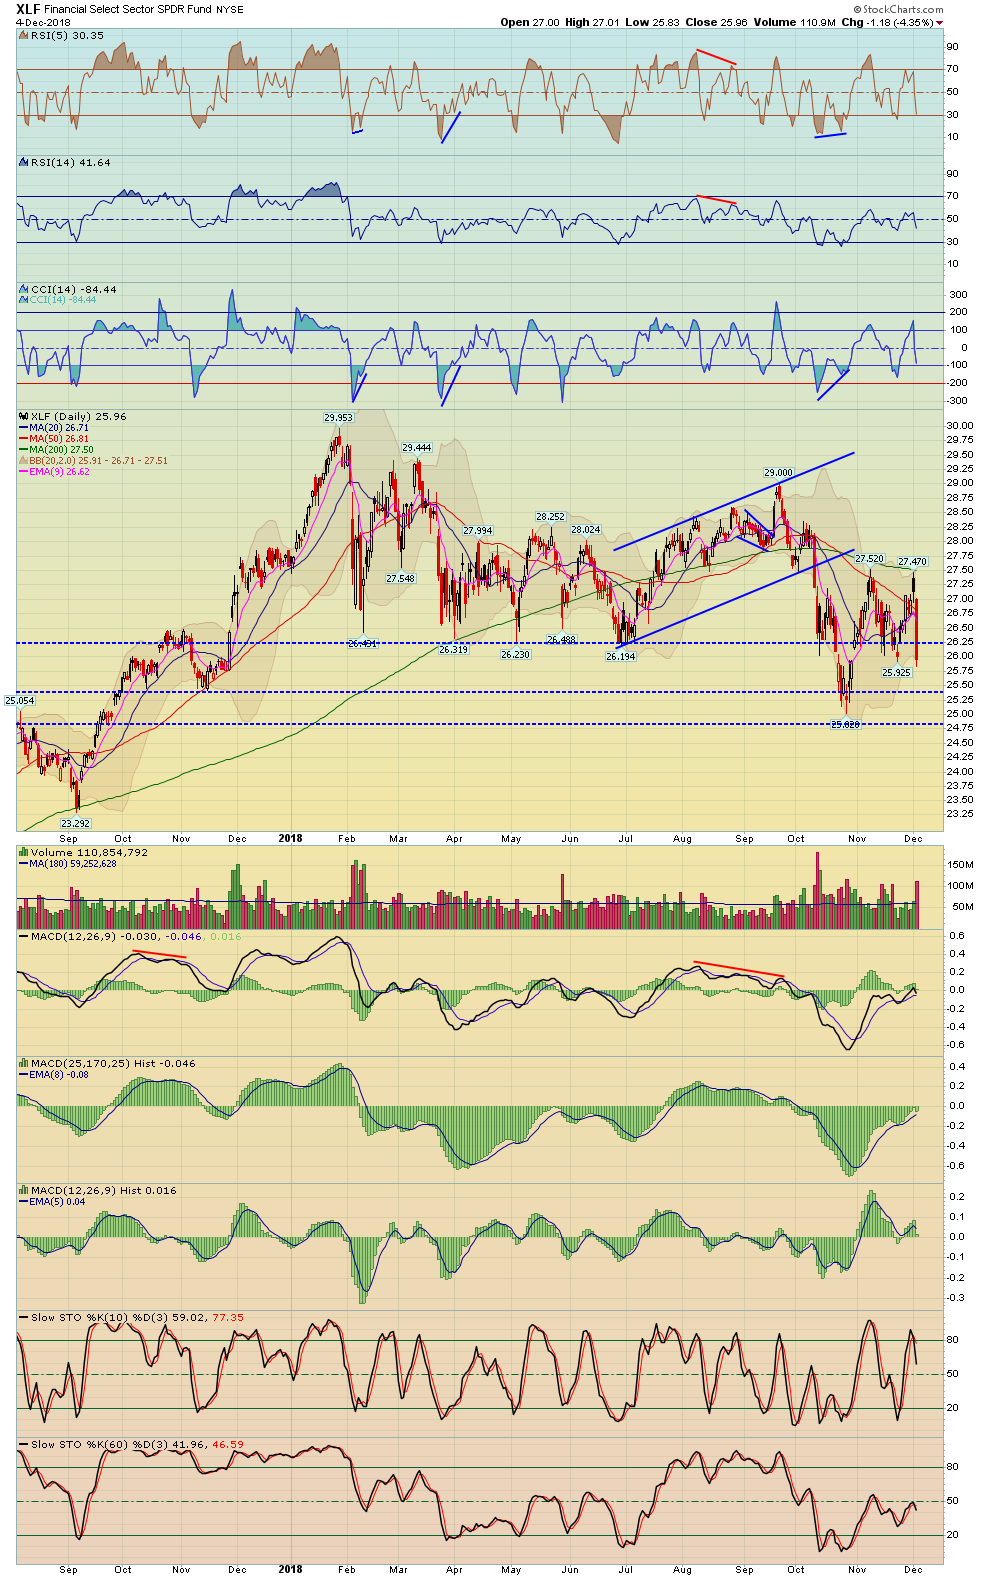
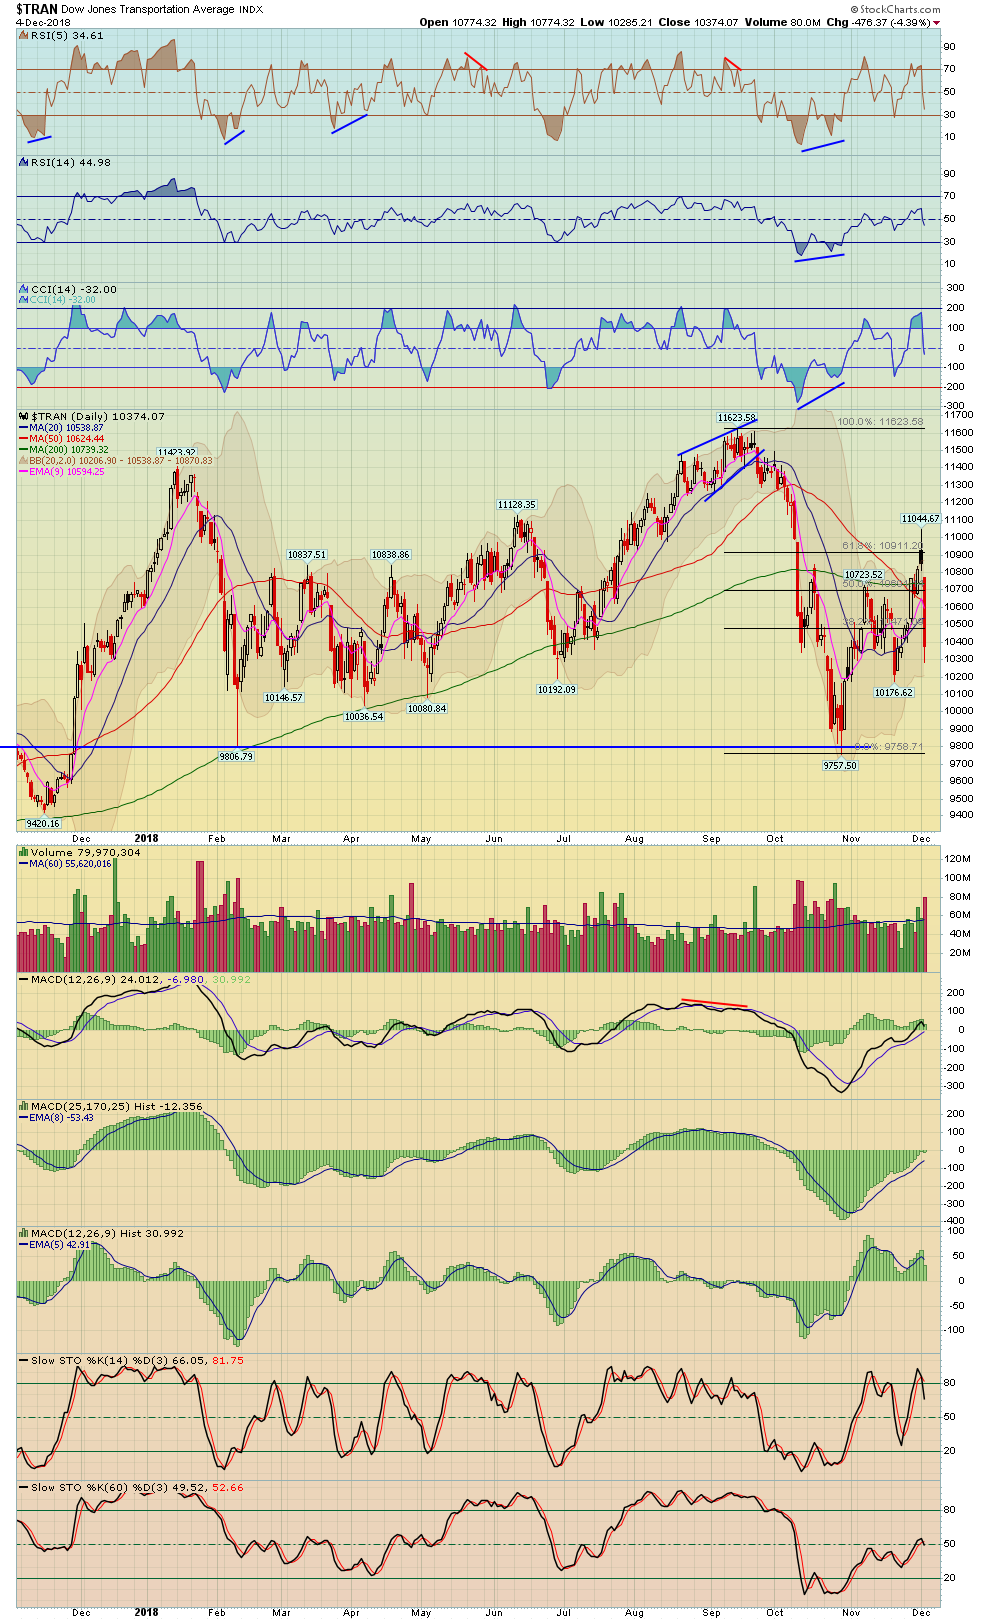
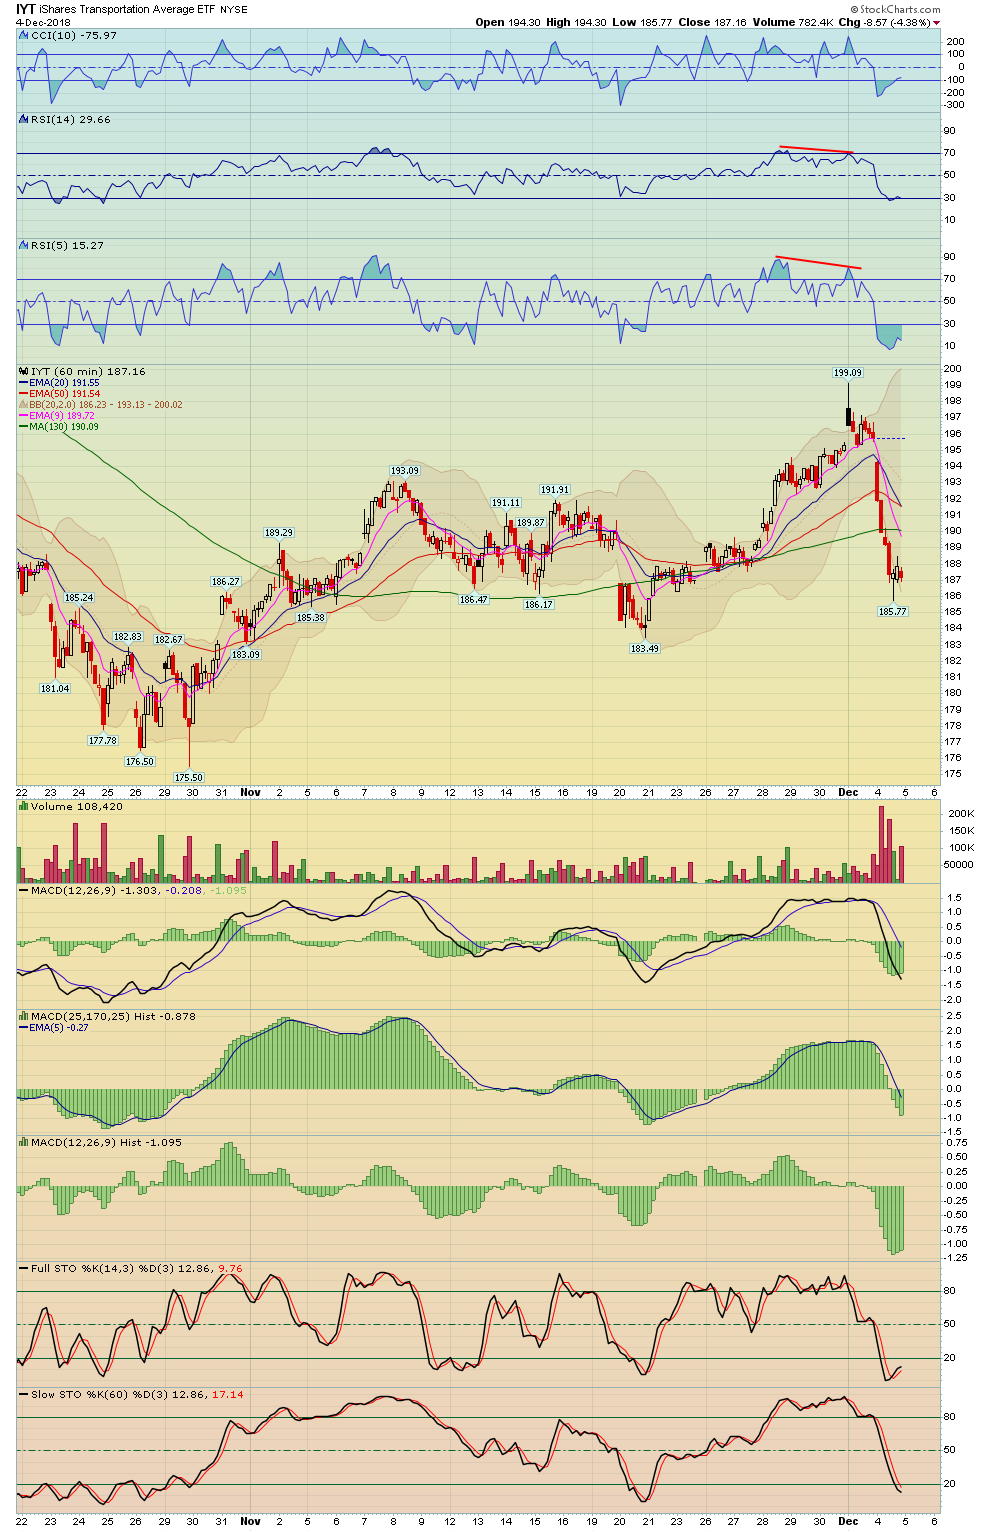
Today of course the market was scared by the move in bond markets, the yield curve (10 Year / 2 Year) fell once again and is getting close to par. It won't take much for it to go negative now. Remember I discussed the Yield Curve on the weekend and in Monday's newsletter. Early this morning Banks/Financials and Transports were extra weak in response to the bond market as the flattening yield curve hurts their profits.
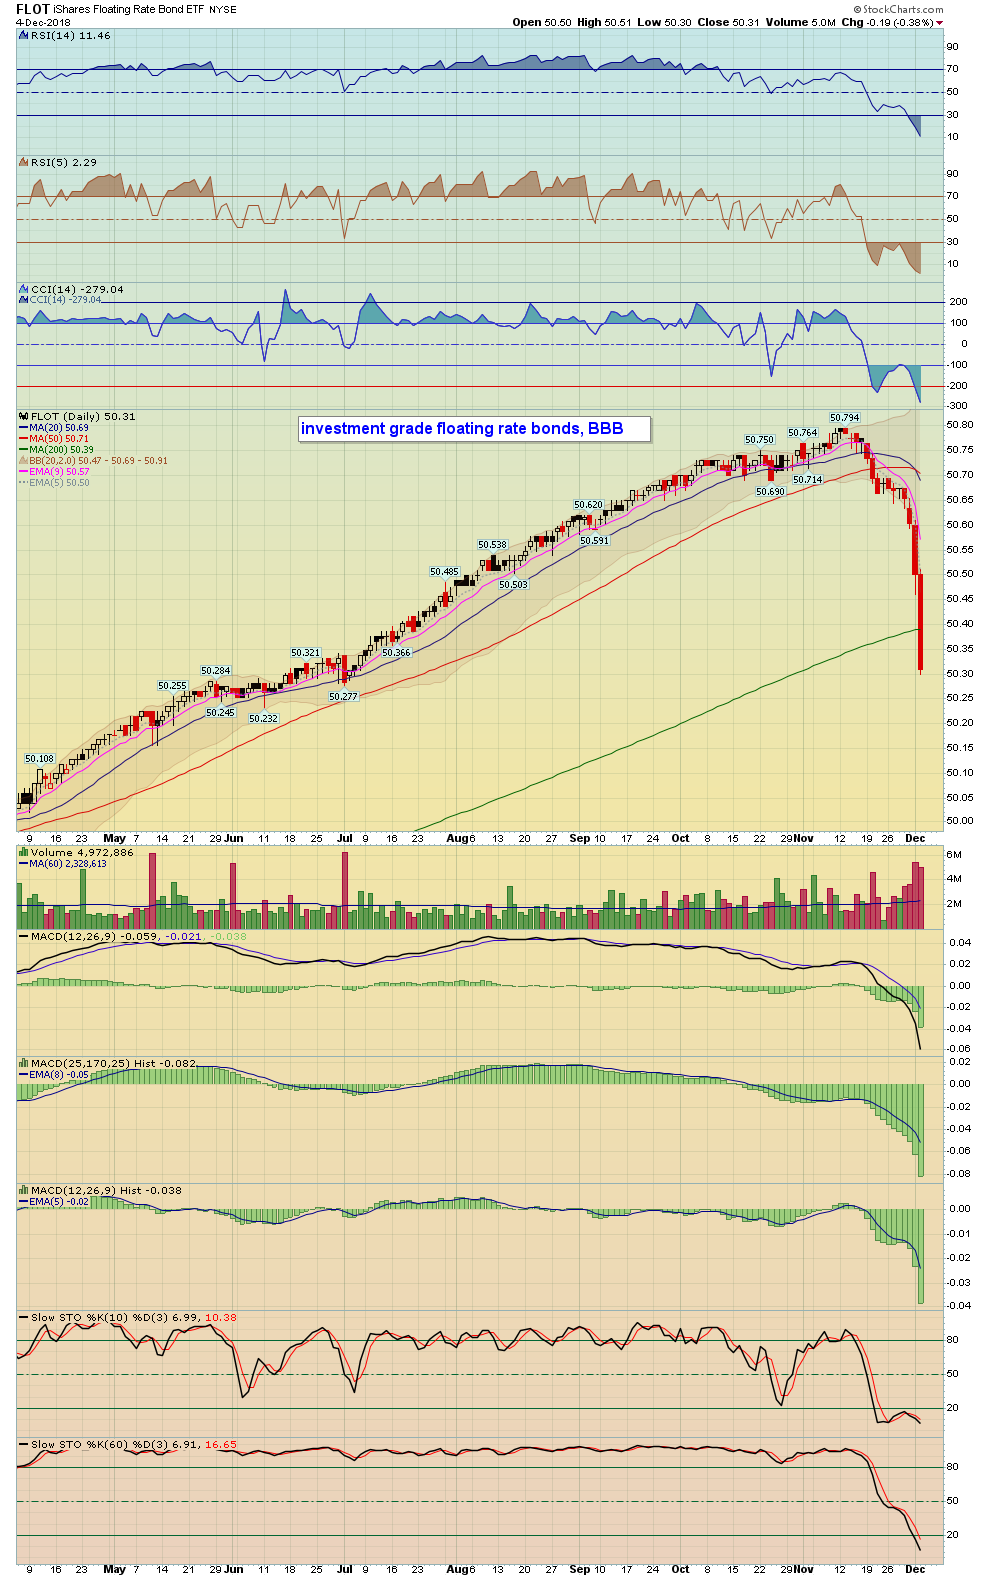
One chart that someone pointed out to me earlier today was the FLOT ETF, which is Investment Grade Floating Rate Bonds. HERE's a Chart, as you will see below there was a HUGE move in this instrument over the last couple days, even yesterday, this was a pre warning for the market of the issues underneath the surface in the credit markets.
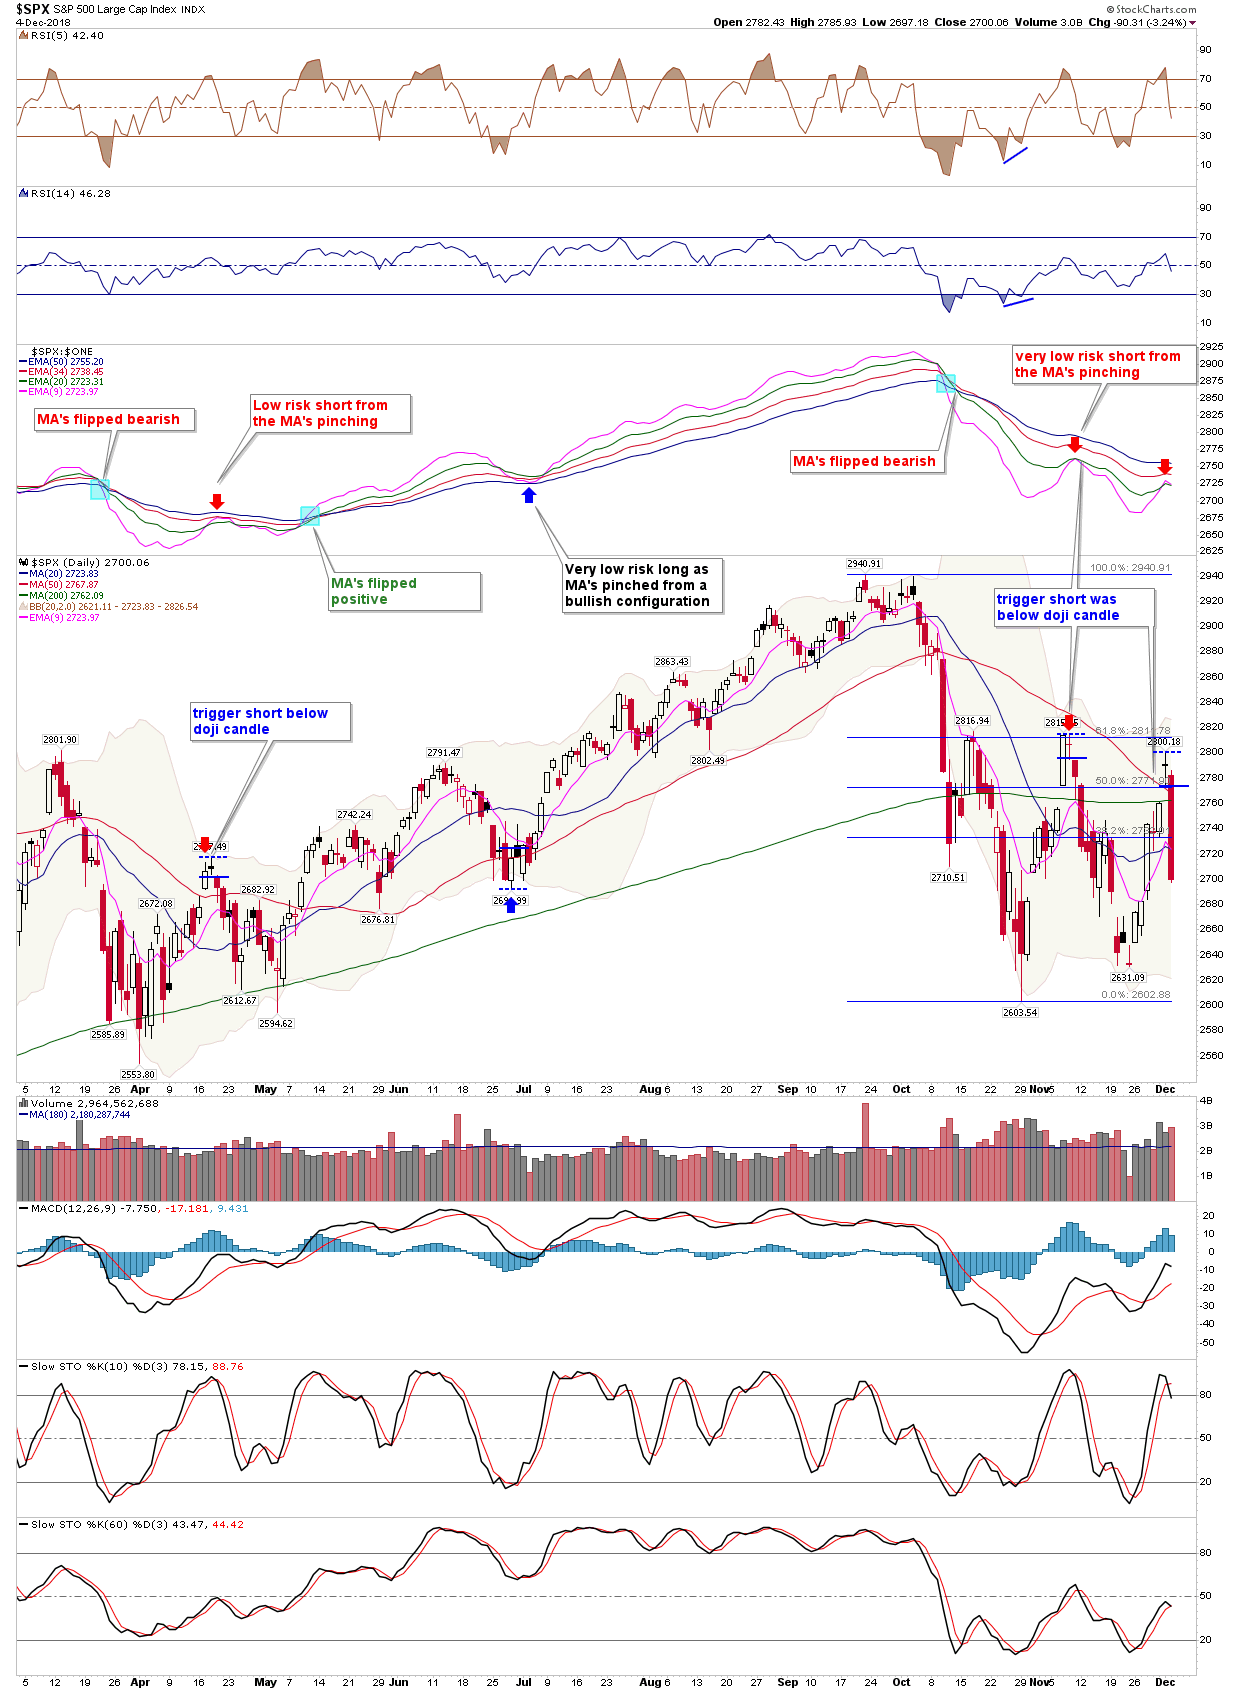
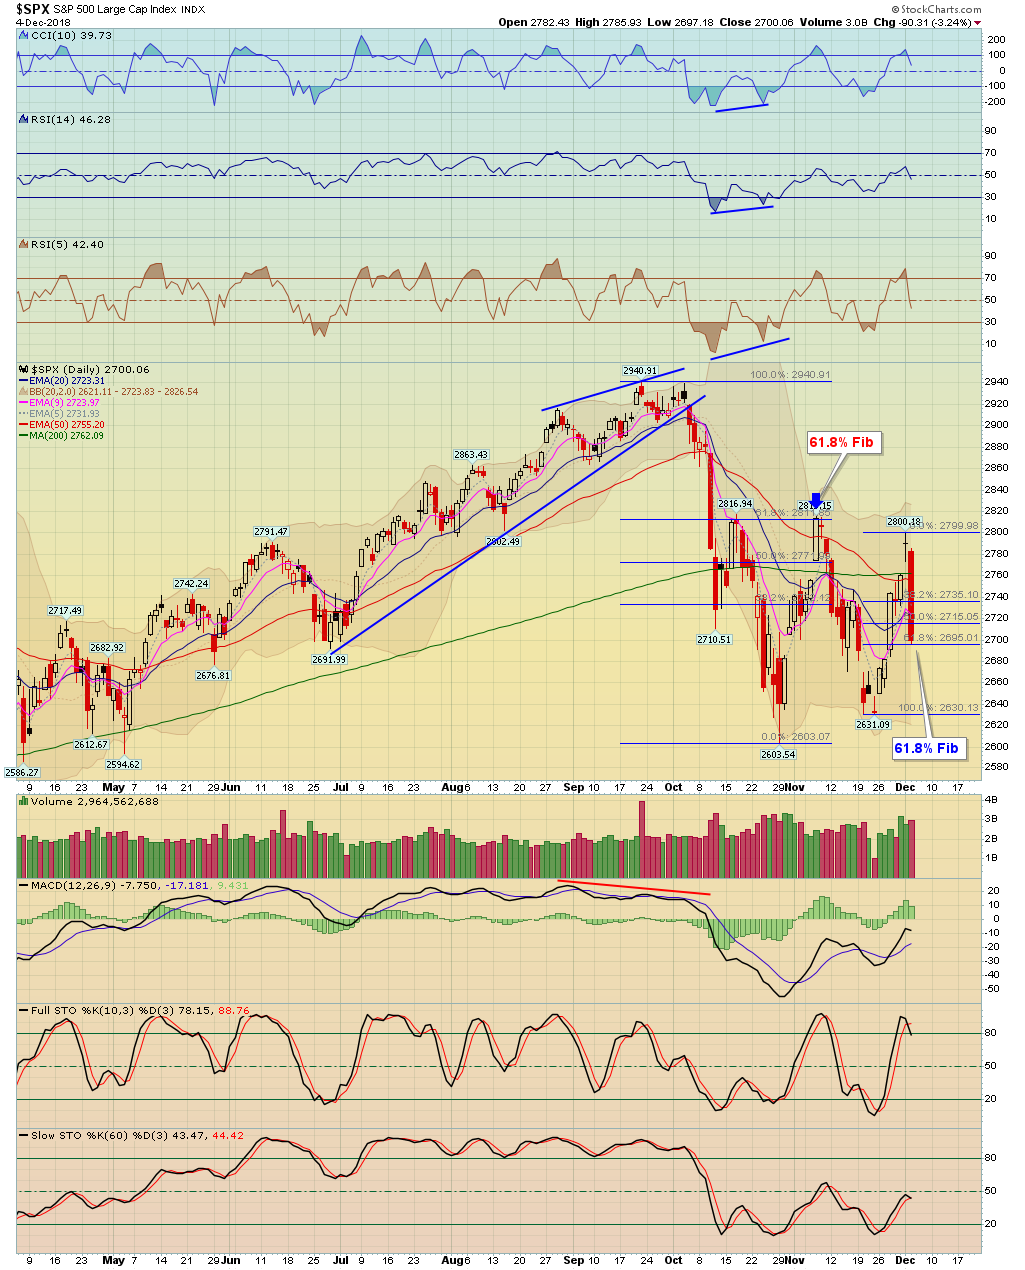
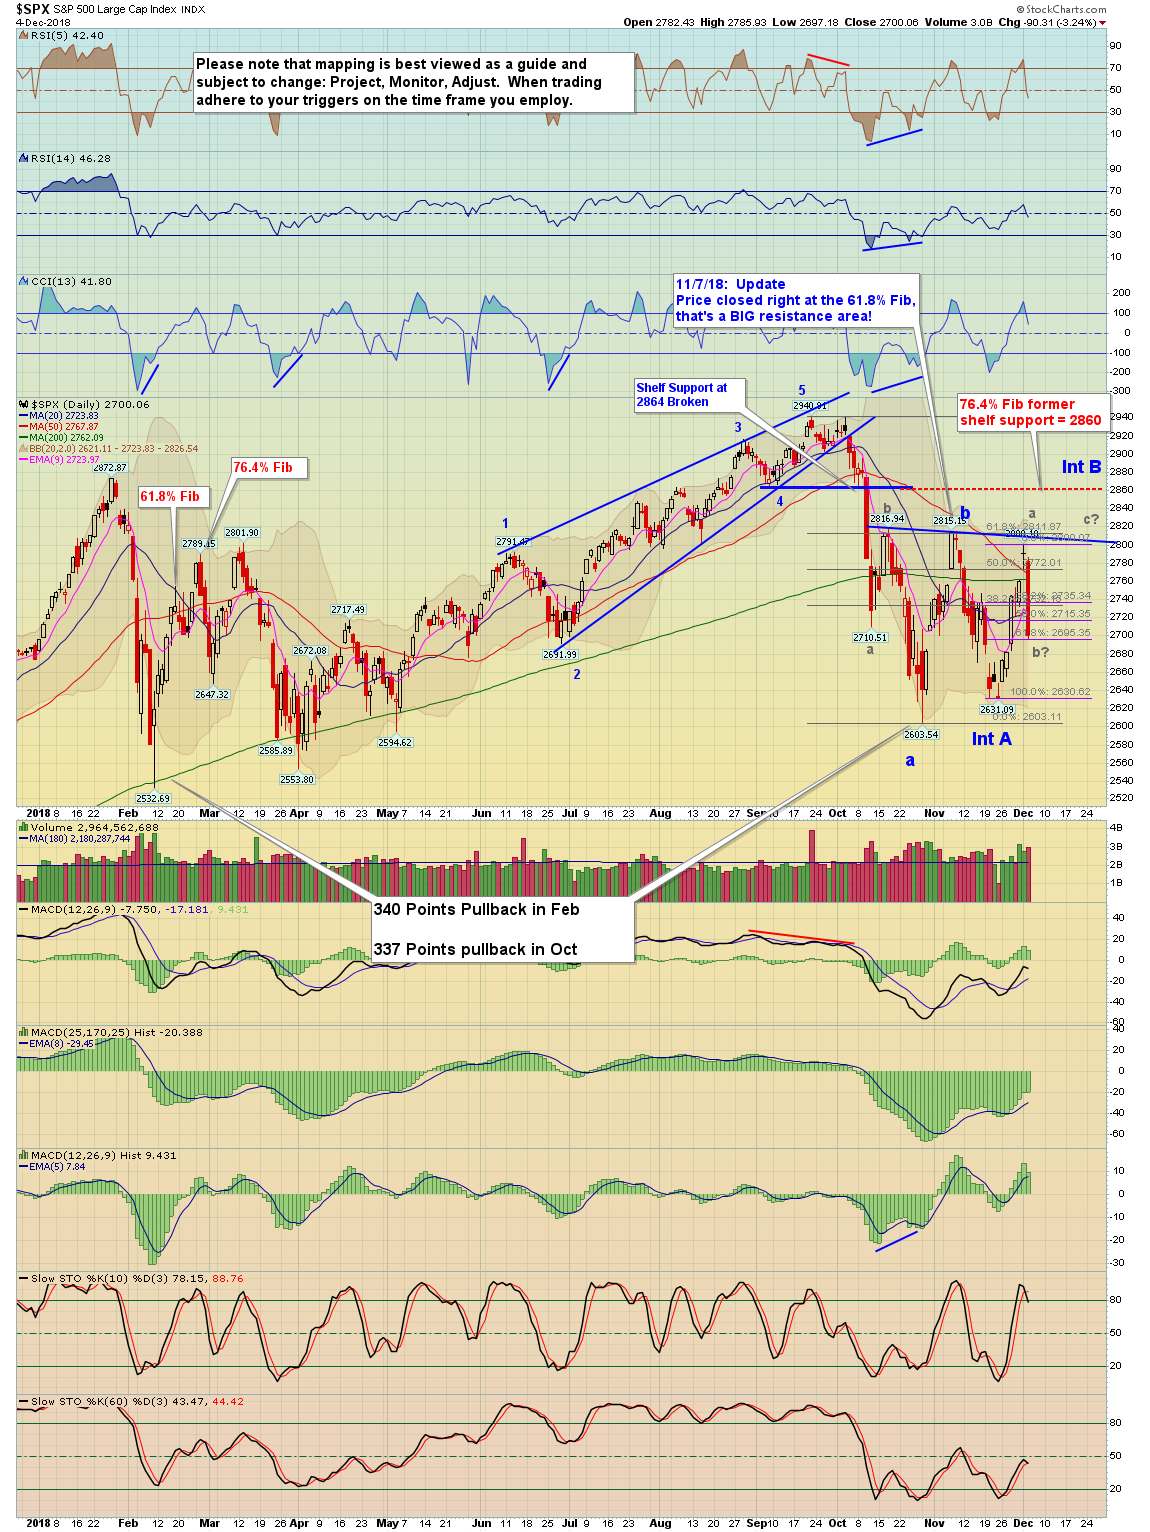
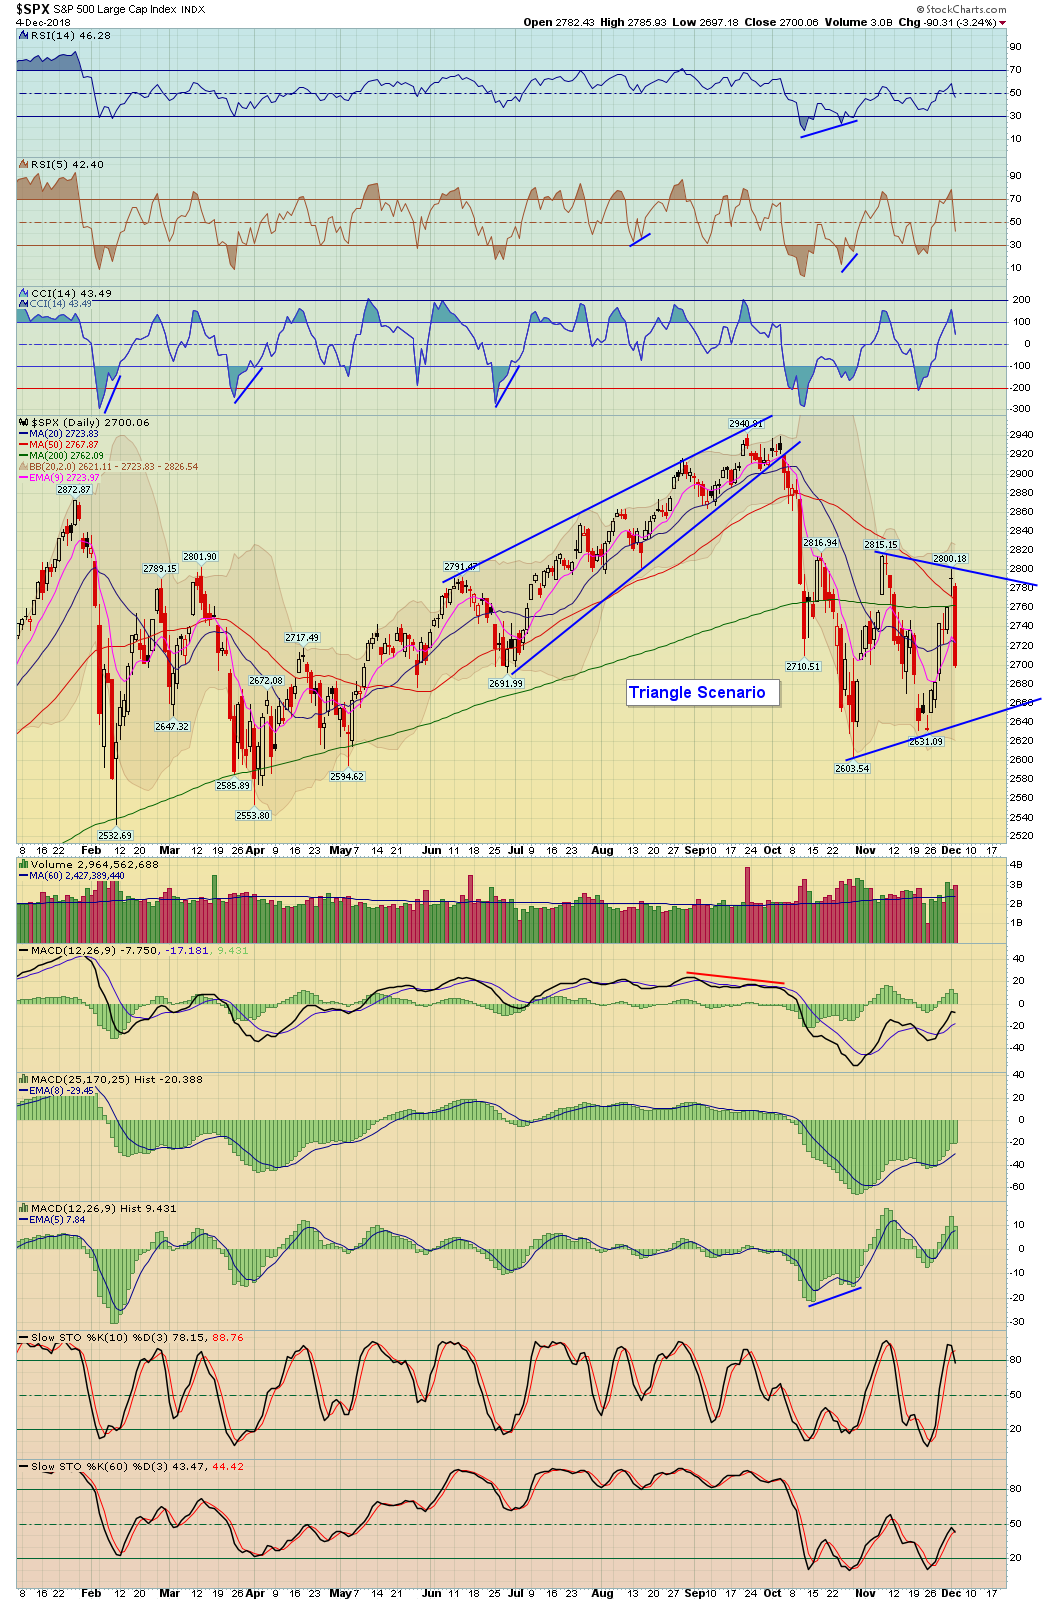
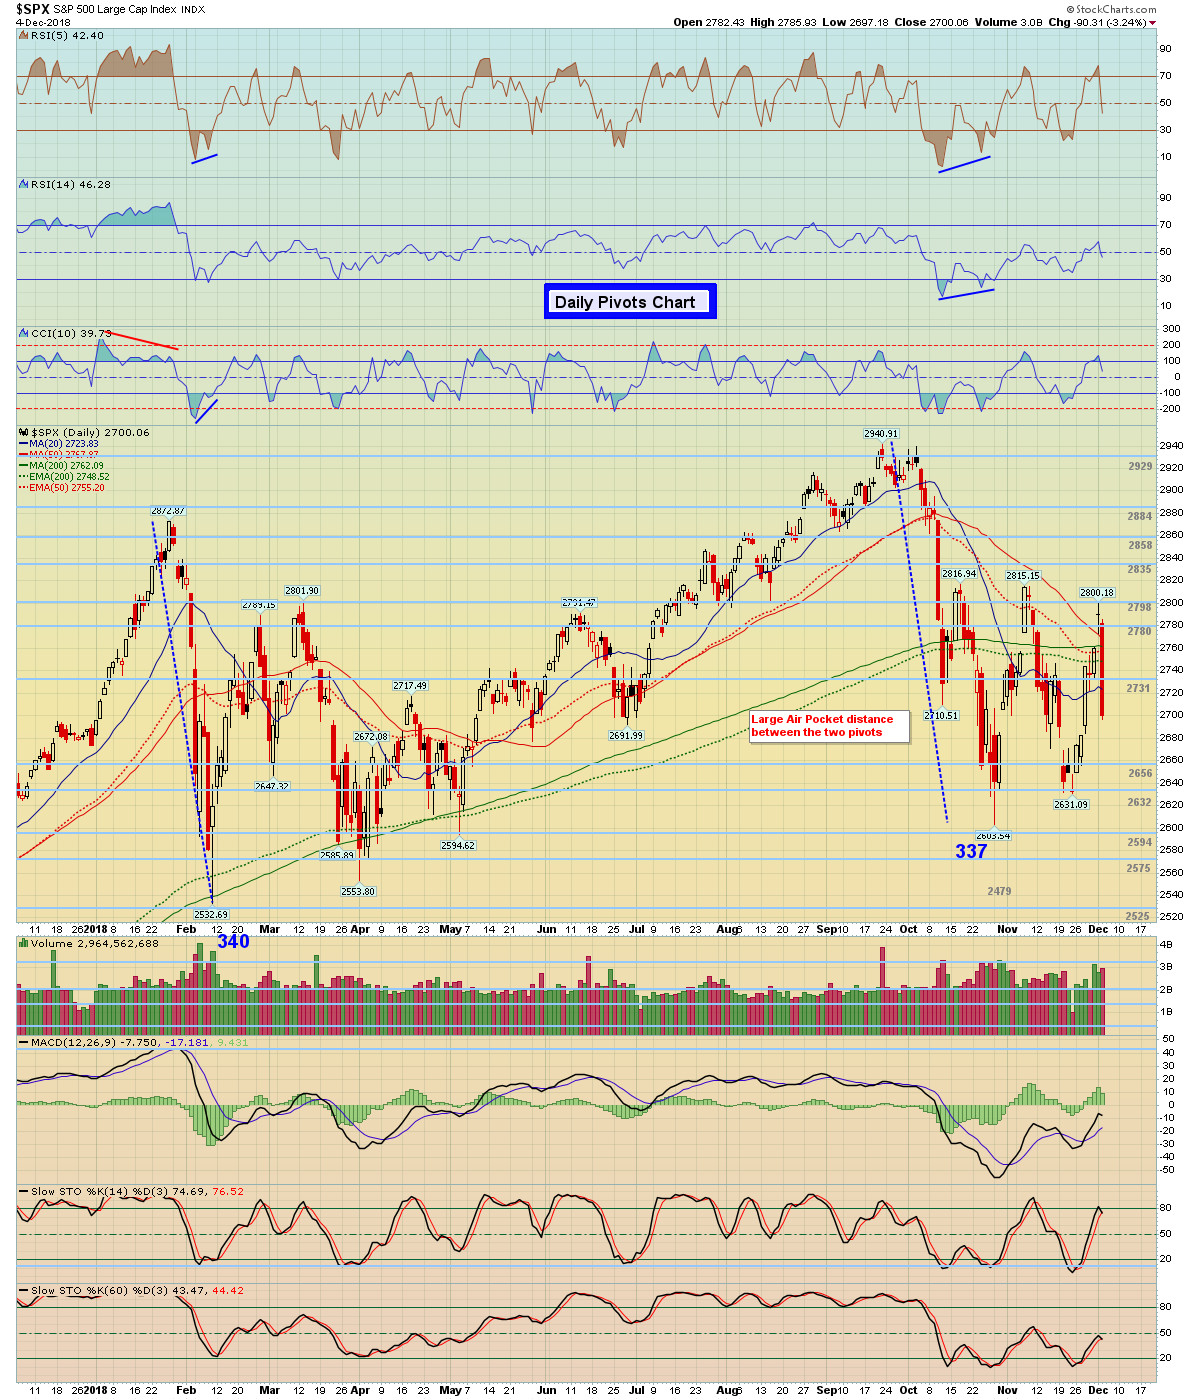
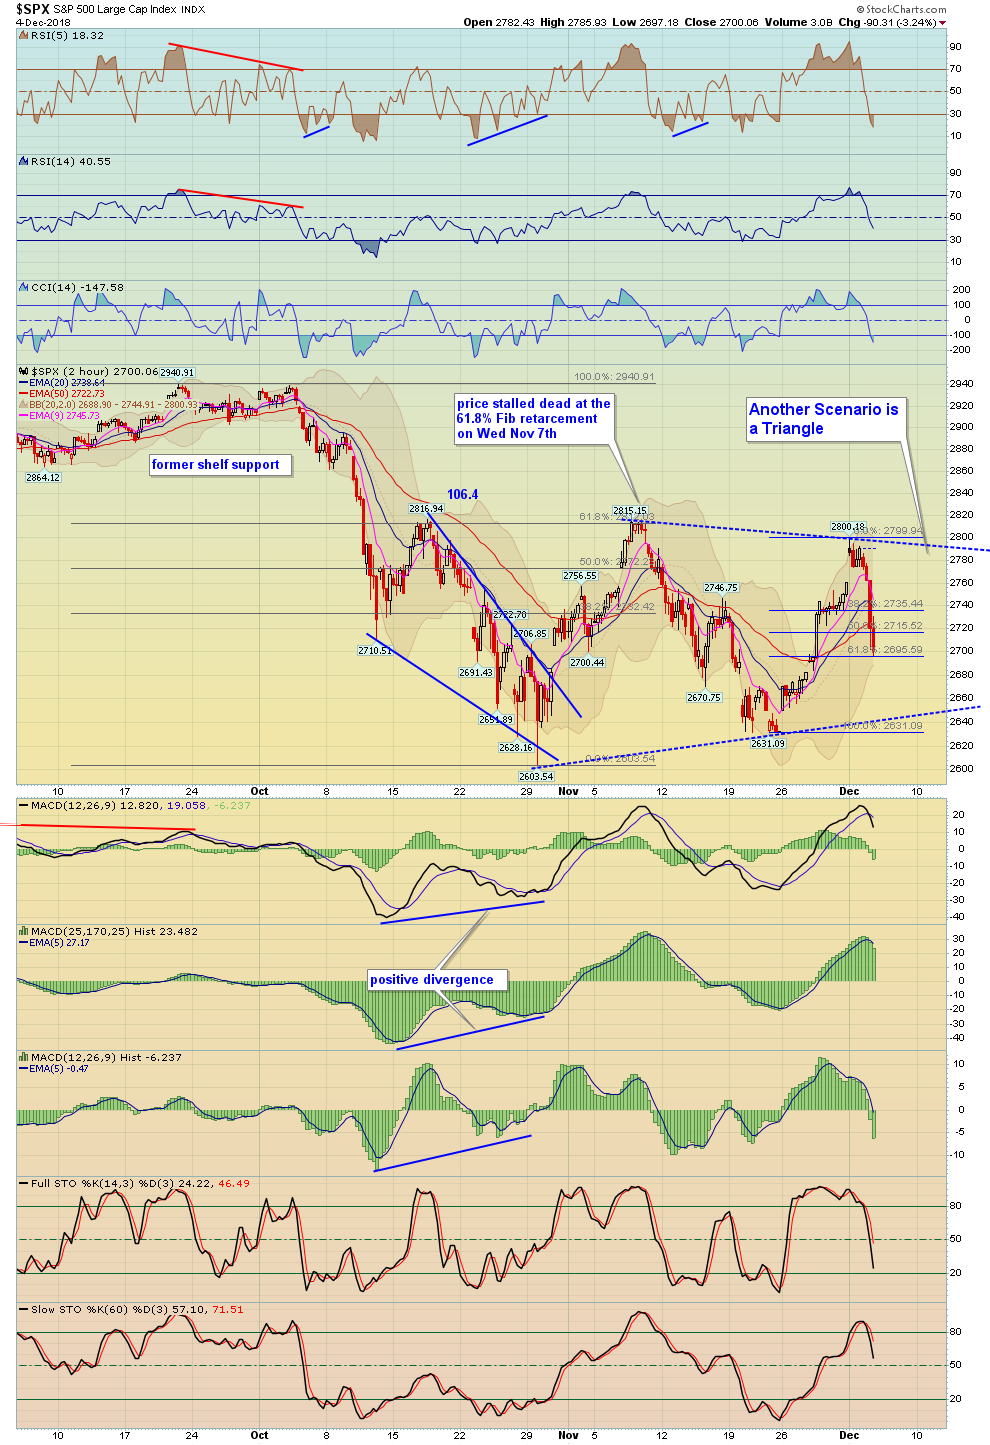
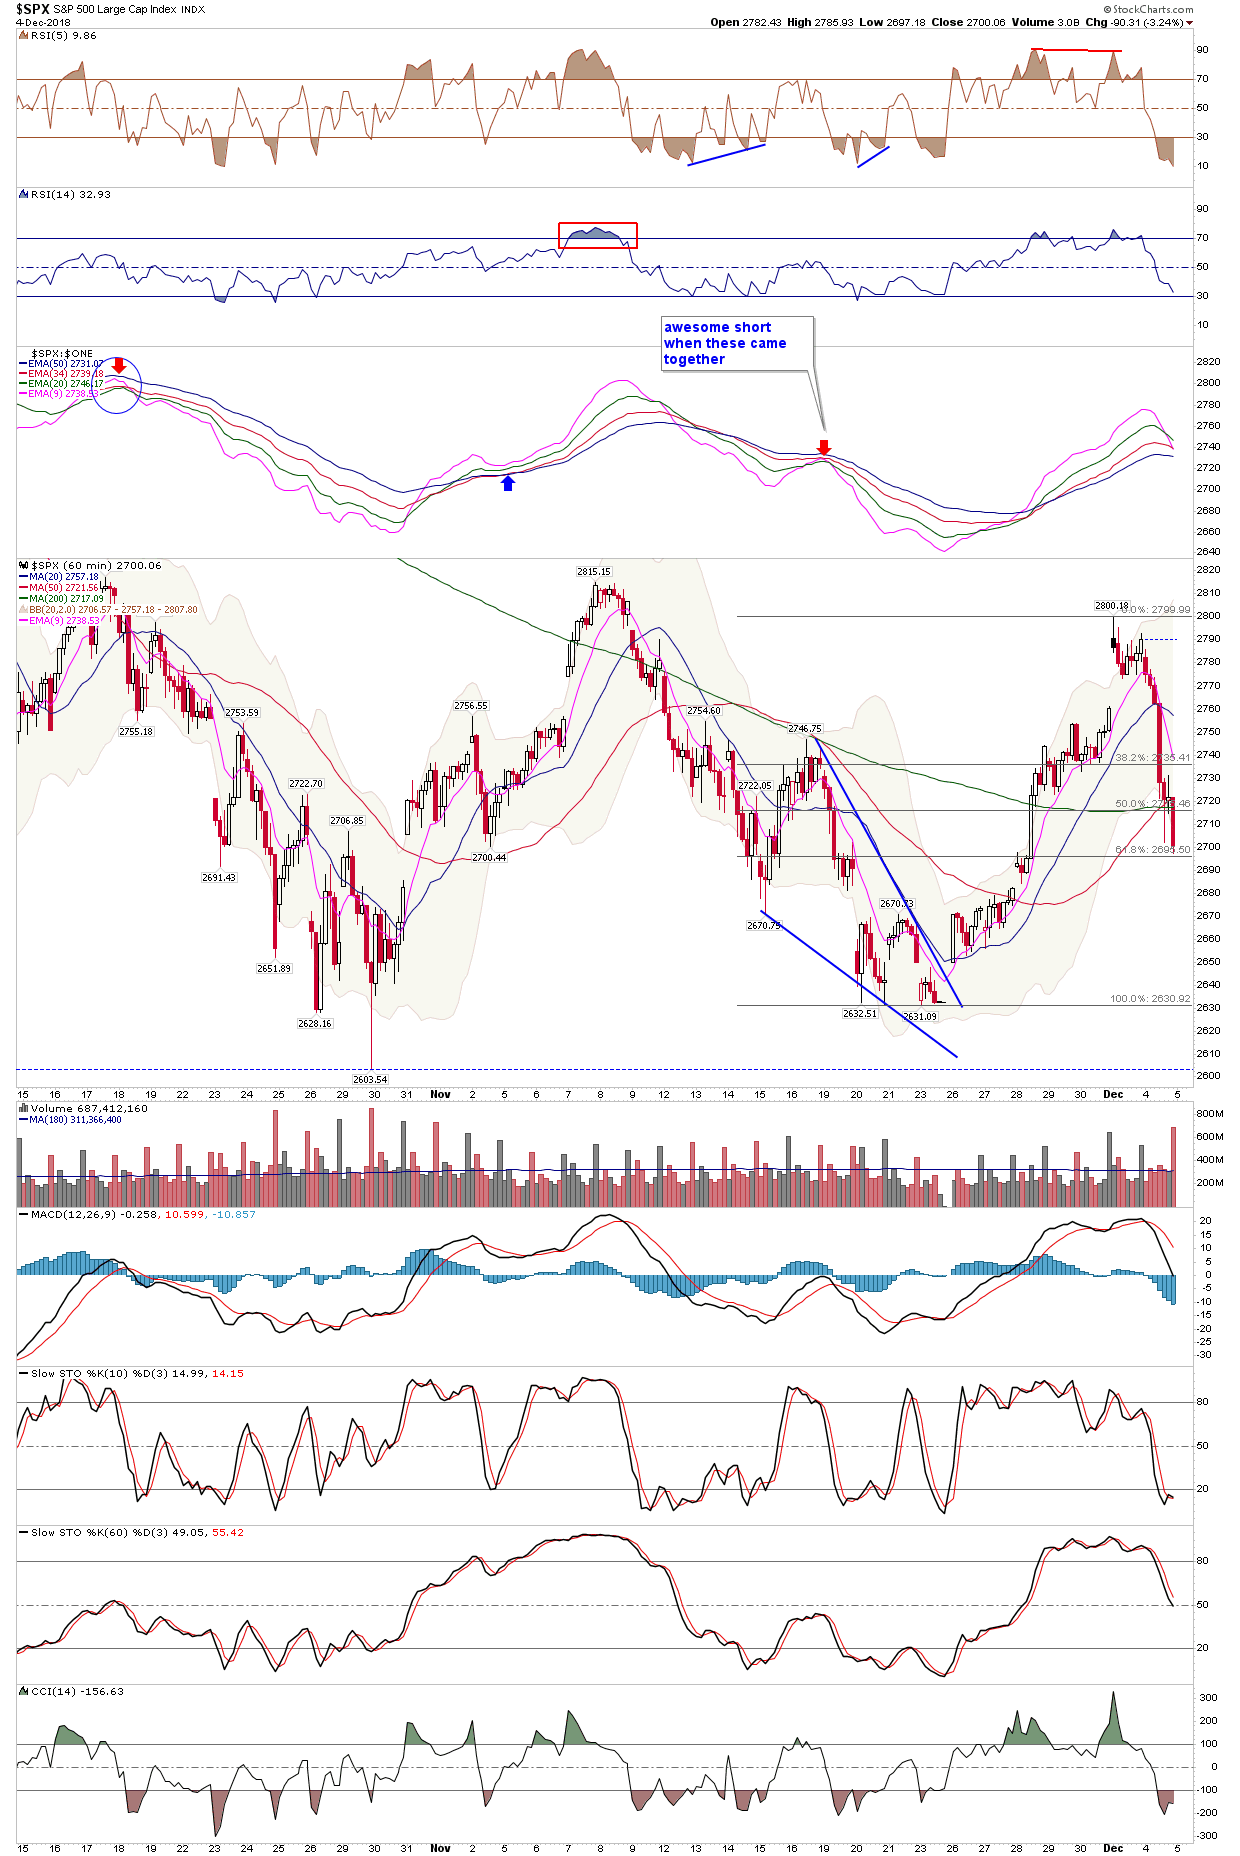
As far as the market, you know our bigger picture is one of caution/bear market. On the weekend for the short term I discuss various scenarios to monitor from the ABC, to a triangle, etc, corrective patterns can take many forms.
2
| Major Indexes | Index Symbol | ETF Symbol | % G / L Day | % G / L Week | Close |
|---|---|---|---|---|---|
| Dow Jones | INDU - W | DIA - W | -3.10% | -2.00% | 25,027.07 |
| S&P 500 | SPX - W | SPY - W | -3.24% | -2.18% | 2,700.06 |
| Wilshire 5000 | WLSH - W | -3.38% | -2.29% | 27,796.93 | |
| Nasdaq | COMPQ - W | -3.80% | -2.35% | 7,158.43 | |
| NDX 100 | NDX - W | QQQ - W | -3.78% | -2.21% | 6,795.21 |
| Russel 2000 (Small Caps) | RUT - W | IWM - W | -4.40% | -3.43% | 1,480.75 |
| Market Sectors | Index Symbol | ETF Symbol | % G / L Day | % G / L Week | Close |
|---|---|---|---|---|---|
| Transports | TRAN - W | IYT - W | -4.39% | -4.12% | 10,374.07 |
| Banks | BKX - W | -4.85% | -4.73% | 96.76 | |
| Financials | XLF - W | -4.35% | -3.74% | 25.96 | |
| Brokers | XBD - W | -4.10% | -3.60% | 253.04 | |
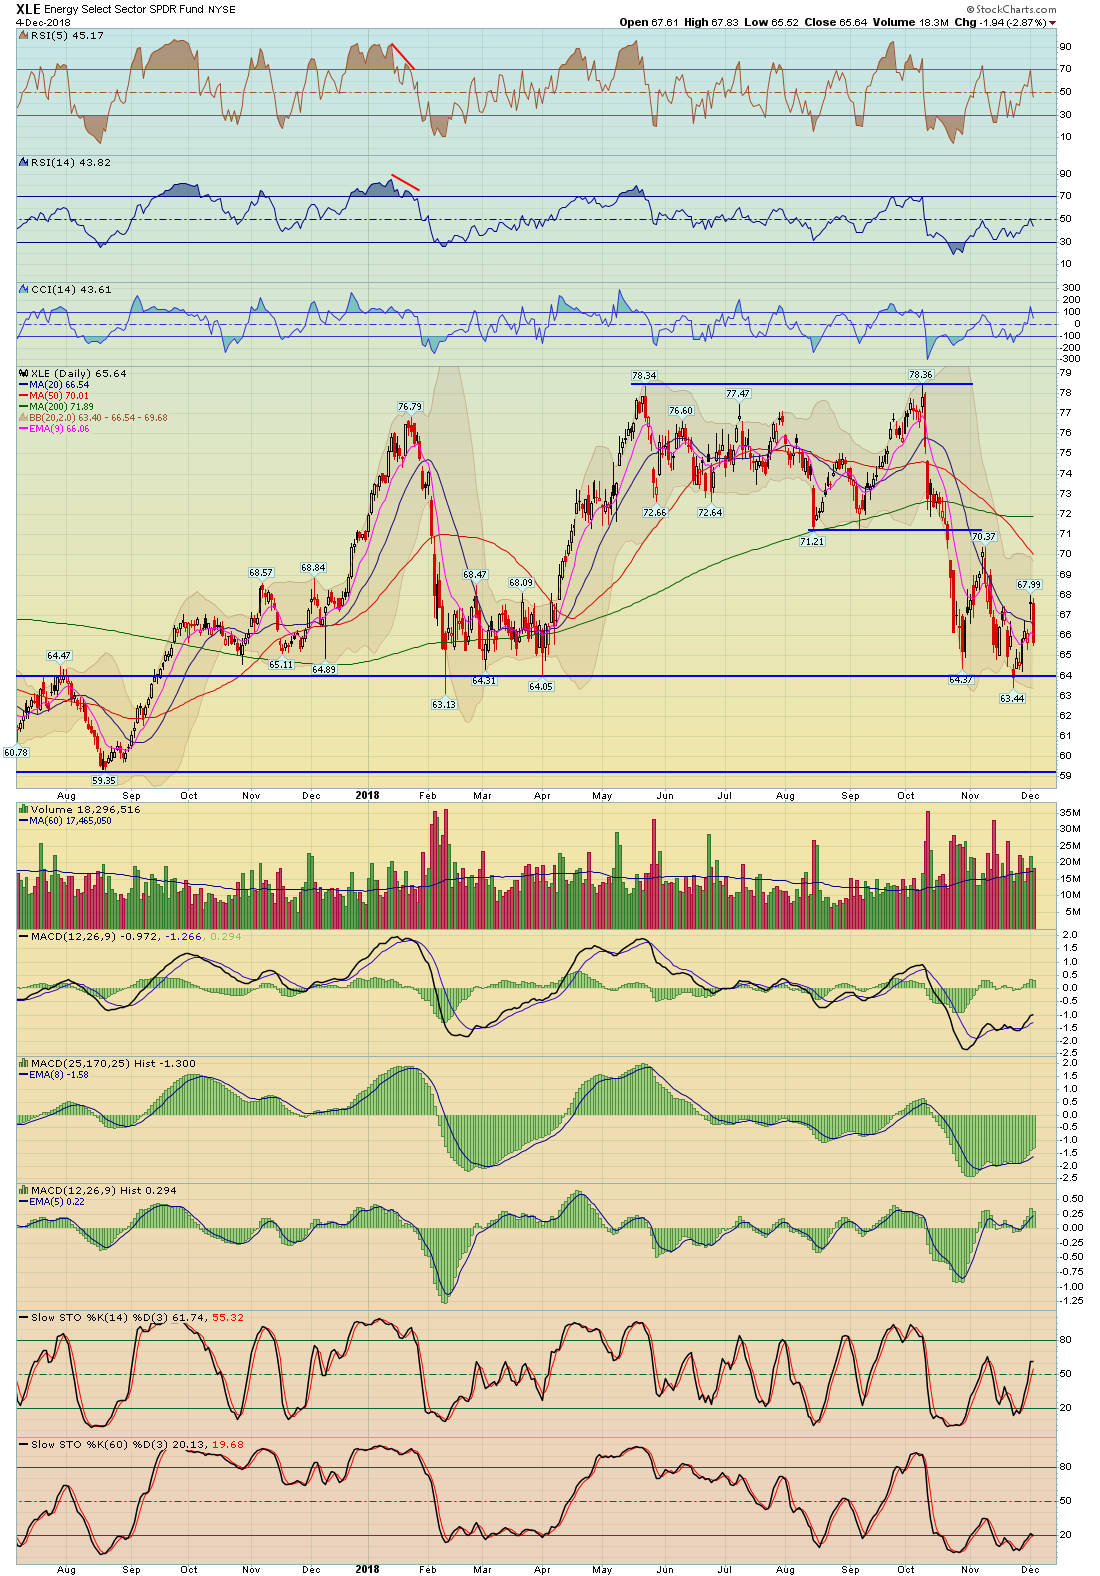
| XLE (Energy Select) | XLE - W | -2.87% | -0.71% | 65.64 | |
| Oil Service Holders | OIH - W | -4.65% | -1.27% | 17.85 | |
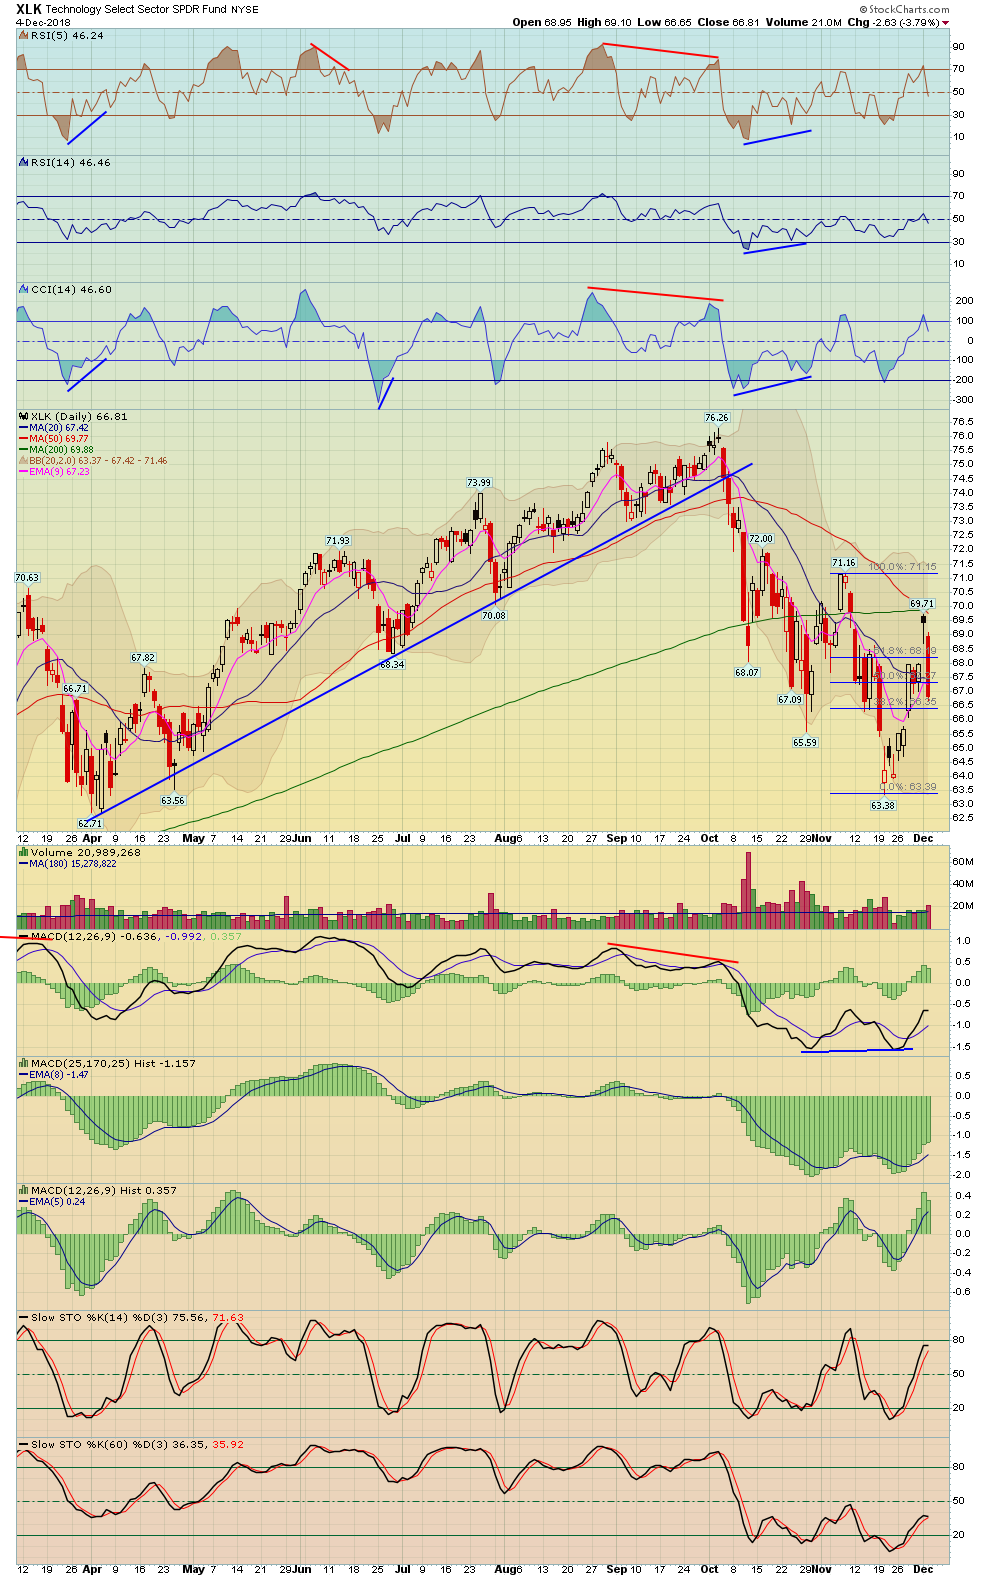
| Technology | XLK - W | -3.79% | -1.66% | 66.81 | |
| Semiconductor | SOX - W | SMH - W | -4.98% | -2.44% | 1,209.35 |
| Communication Services | XLC - W | -2.95% | -2.80% | 43.75 | |
| Retail | XRT - W | -3.68% | -2.37% | 45.25 | |
| Consumer Staples | XLP - W | -1.69% | -1.60% | 55.36 | |
| Consumer Discretionary | XLY - W | -3.60% | -1.80% | 106.05 | |
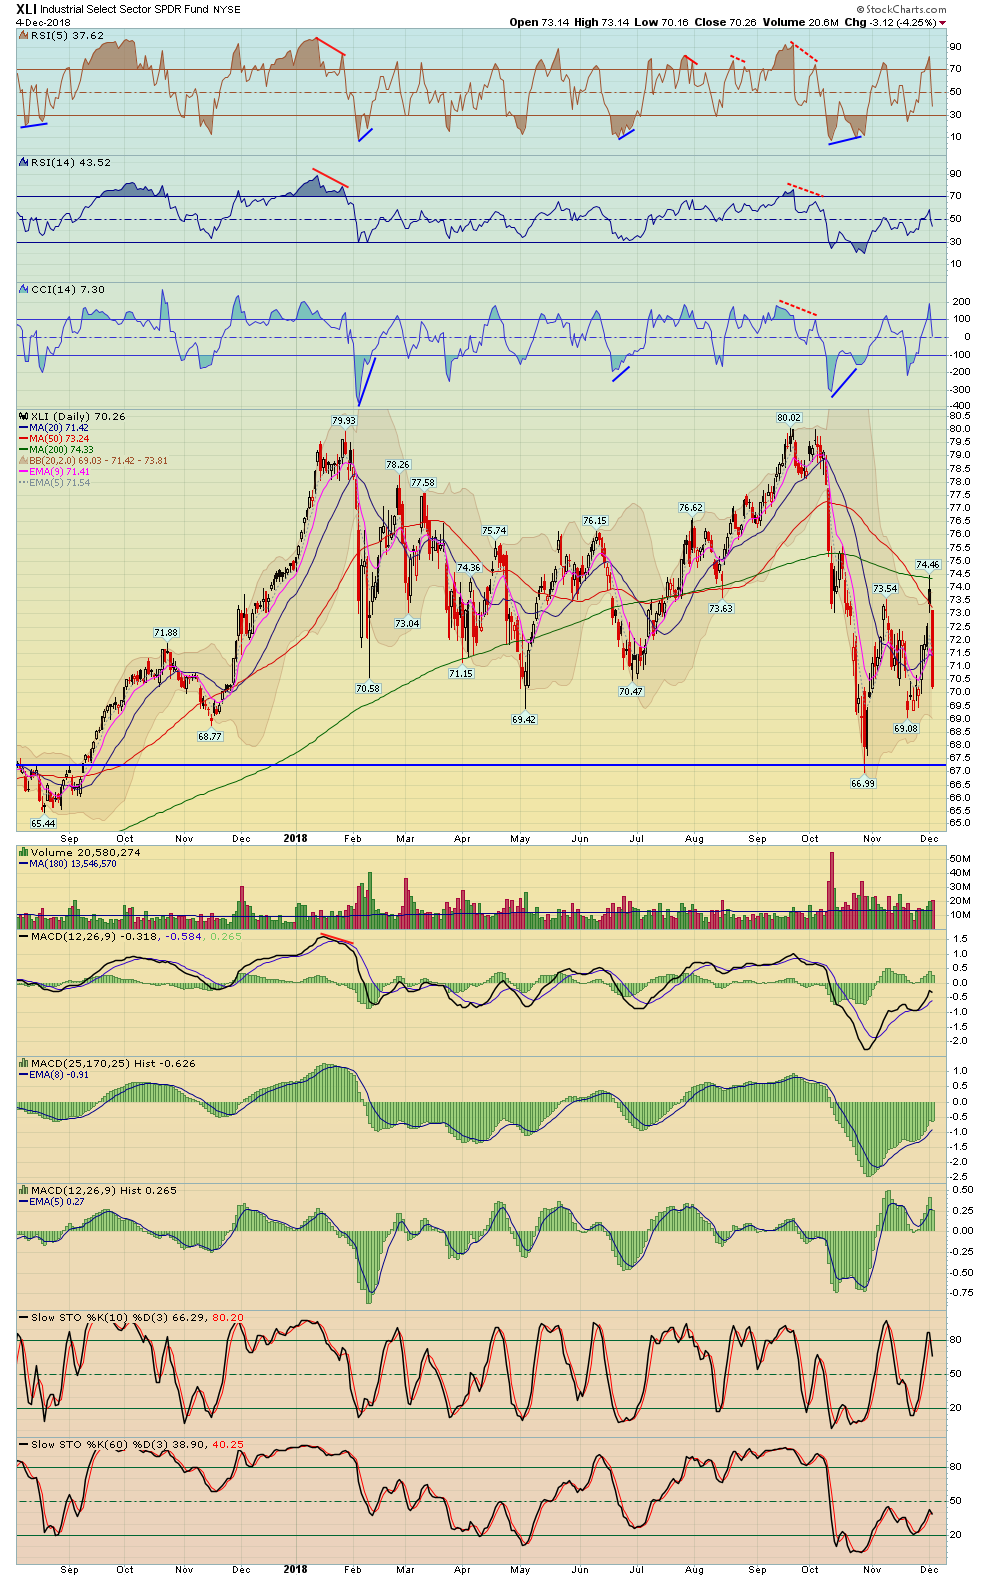
| Industrials | XLI - W | -4.25% | -3.14% | 70.26 | |
| Real Estate | IYR - W | -1.55% | -1.09% | 80.89 | |
| Homebuilders | HGX - W | XHB - W | -4.84% | -3.77% | 256.06 |
| Materials | XLB - W | -2.97% | -1.26% | 53.92 | |
| Metals And Mining | XME - W | -2.98% | -0.31% | 28.94 | |
| GDX Gold Miners ETF | GDX - W | 0.82% | 2.67% | 19.60 | |
| Biotechnology | BTK - W | XBI - W | -4.07% | -2.94% | 4,615.96 |
| Healthcare | XLV - W | -2.23% | -2.70% | 93.28 | |
| Drugs | DRG - W | -1.46% | -2.13% | 596.16 | |
| Utilities | UTIL - W | XLU - W | 0.17% | 1.07% | 749.84 |
| Currencies | Index Symbol | ETF Symbol | % G / L Day | % G / L Week | Close |
|---|---|---|---|---|---|
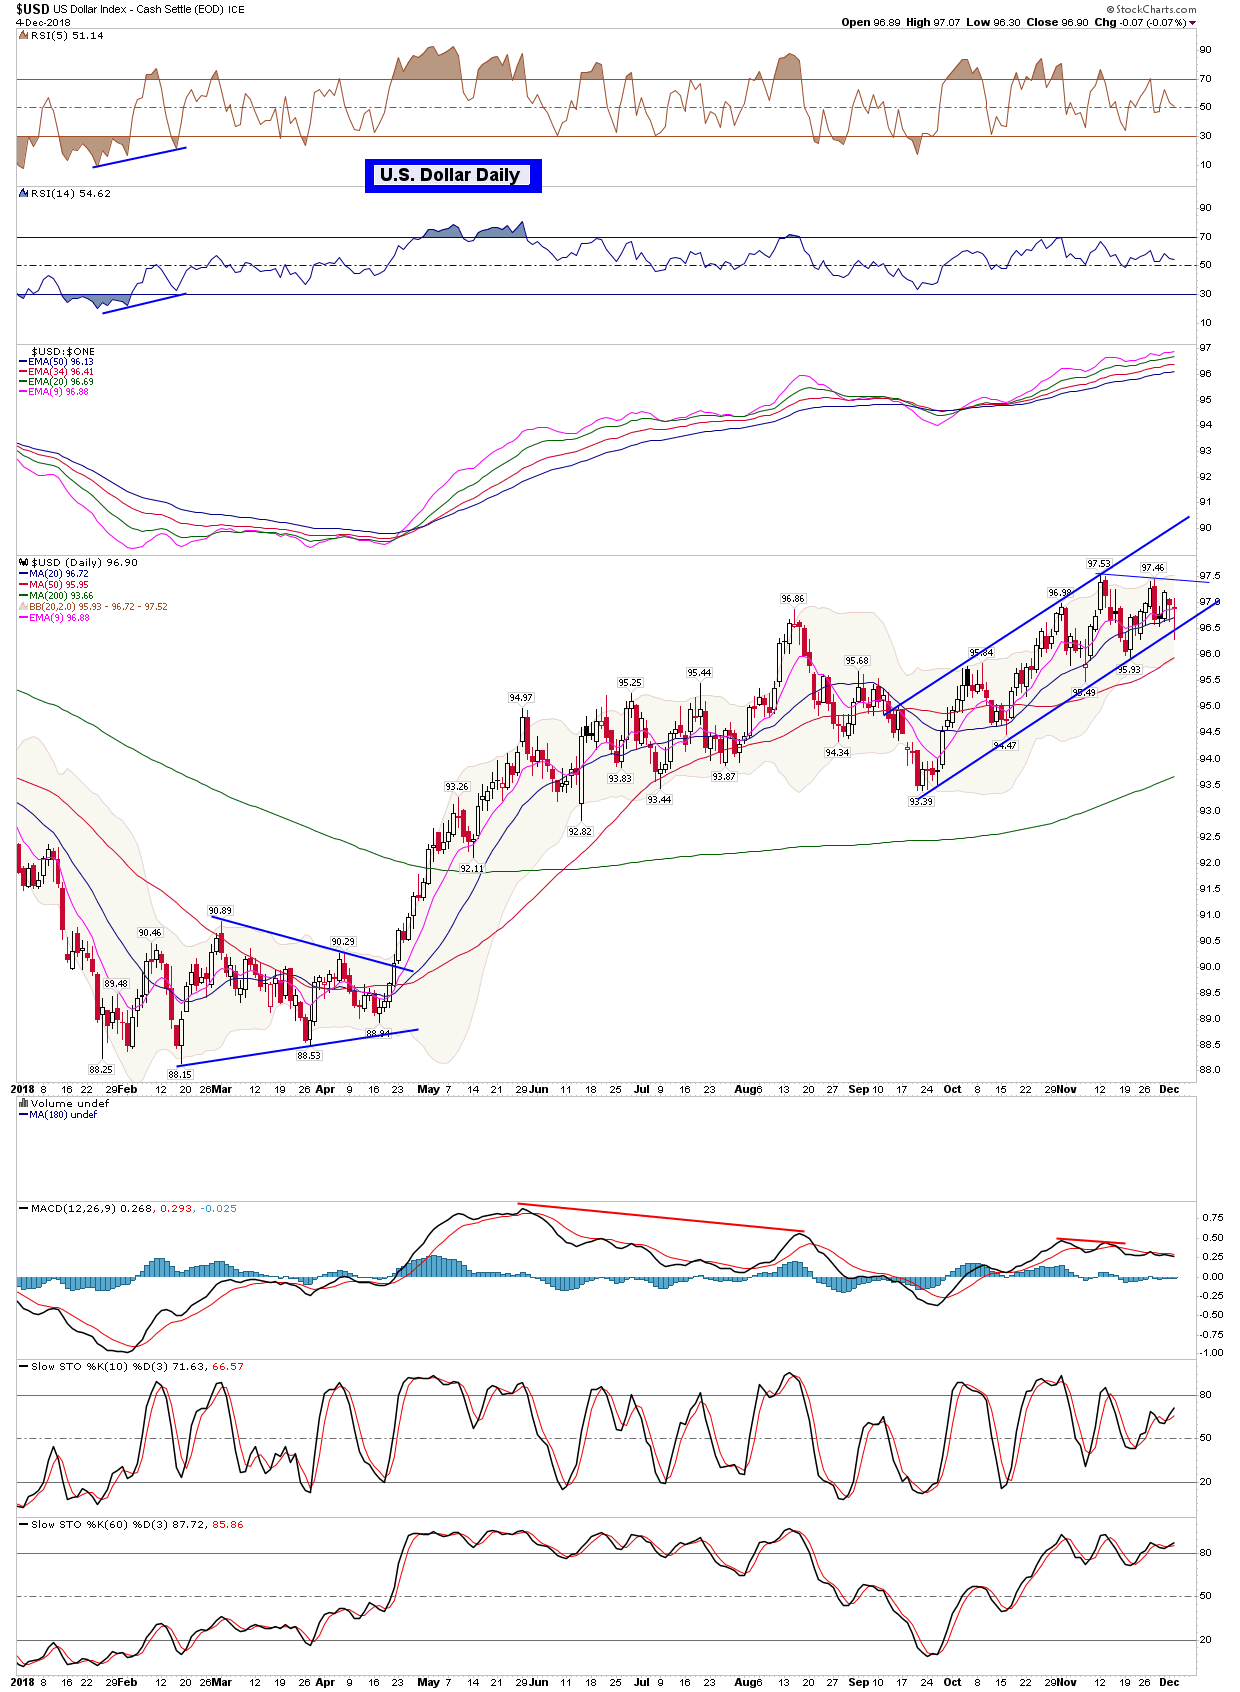
| US Dollar | UUP - W | -0.19% | -0.15% | 25.88 | |
| Euro | XEU - W | FXE - W | -0.08% | 0.56% | 113.44 |
| Yen | XJY - W | FXY - W | 0.77% | 0.69% | 88.67 |
| Australian | XAD - W | FXA - W | -0.27% | 0.36% | 73.38 |
| British Pound | XBP - W | FXB - W | -0.04% | -0.29% | 127.16 |
| Chinese Yuan | CYB - W | 0.51% | 1.38% | 25.68 | |
| Canadian Dollar | CDW - W | FXC - W | -0.48% | 0.22% | 75.41 |
| Swiss Franc | XSF - W | FXF - W | 0.05% | 0.08% | 100.25 |
| Commodities | Index Symbol | ETF Symbol | % G / L Day | % G / L Week | Close |
|---|---|---|---|---|---|
| Commodities | DBC - W | 0.06% | 2.35% | 15.65 | |
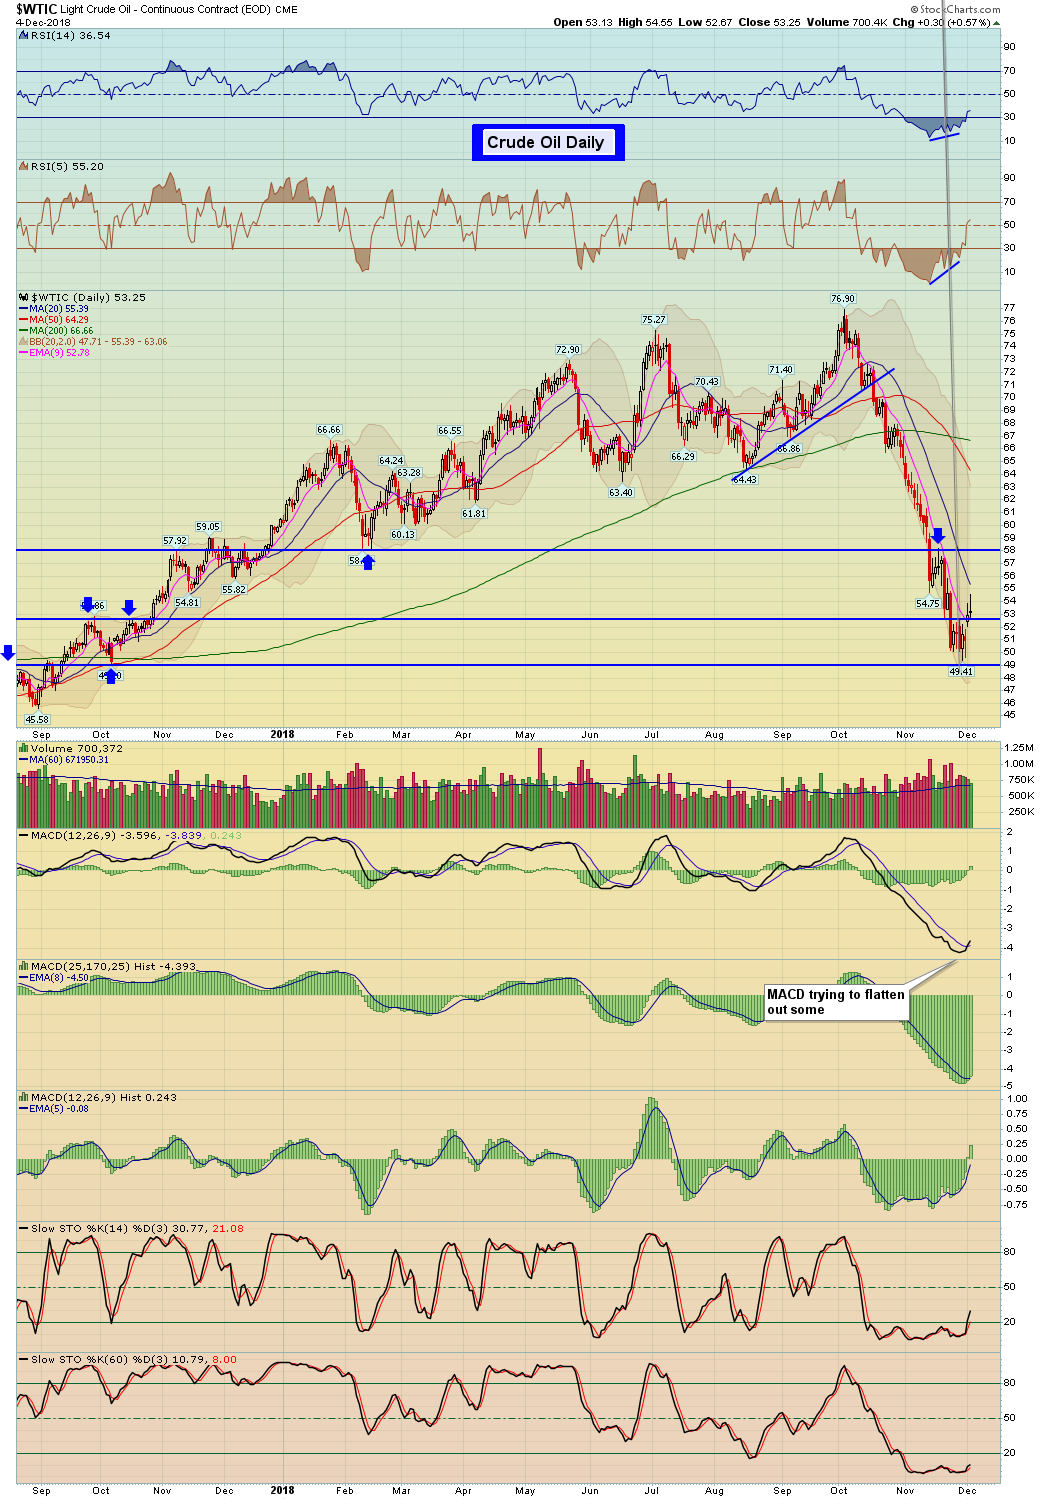
| Crude Oil | WTIC - W | USO - W | 0.57% | 4.56% | 53.25 |
| Gasoline | GASO - W | 0.84% | 2.96% | 1.44 | |
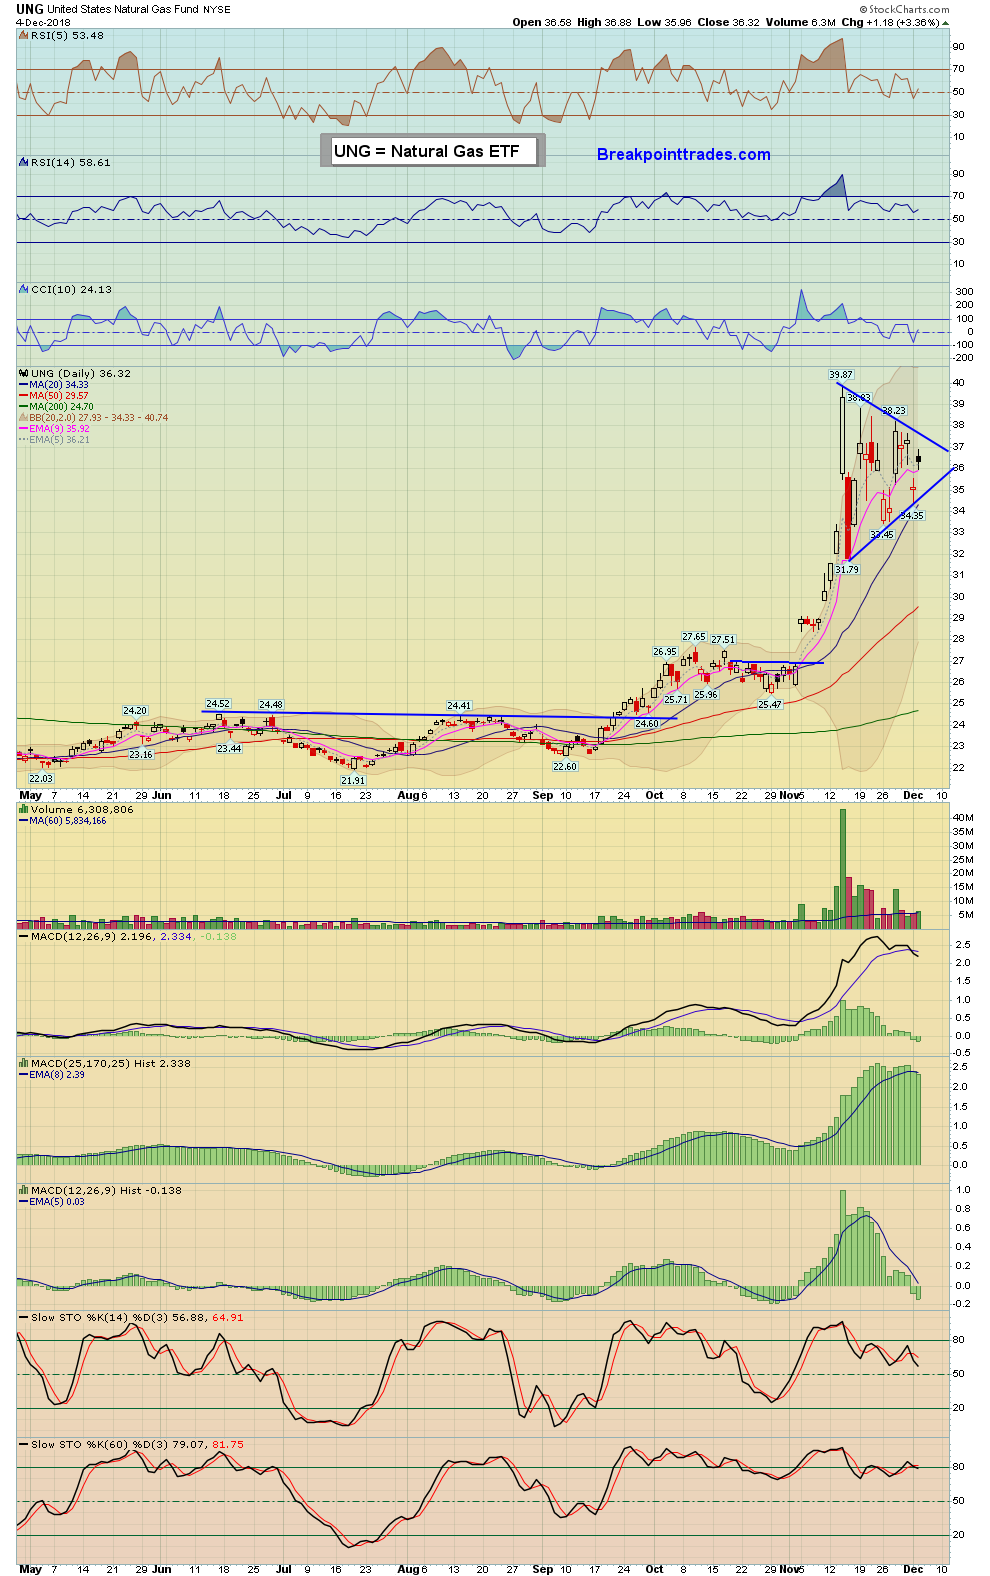
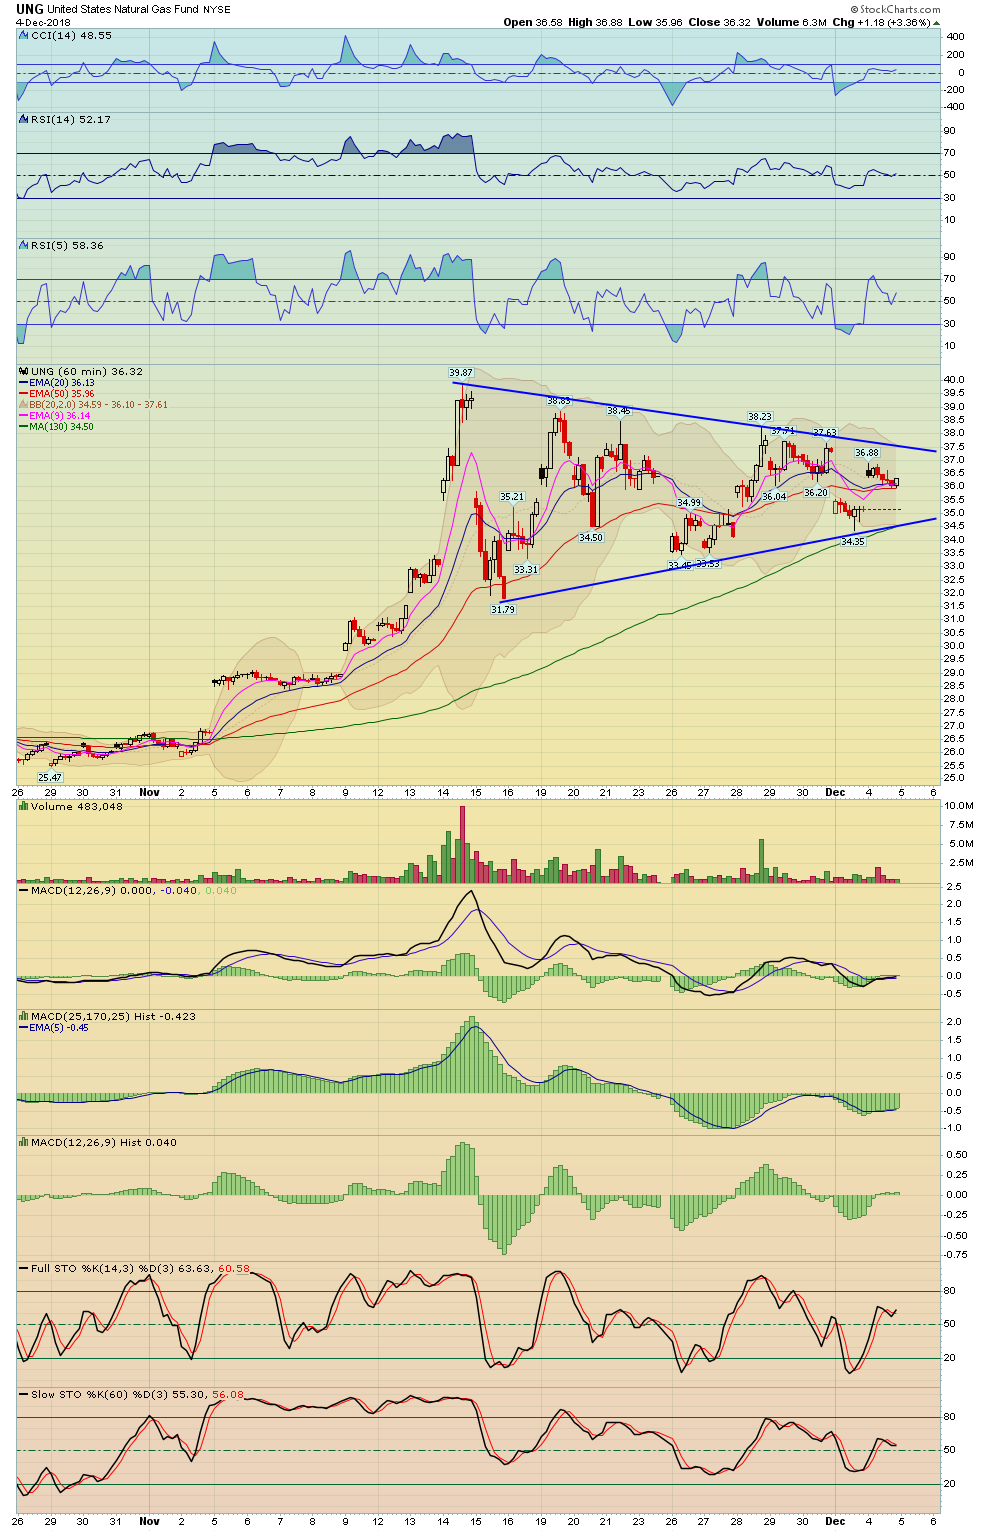
| Natural Gas | NATGAS - W | UNG - W | 2.72% | -3.36% | 4.46 |
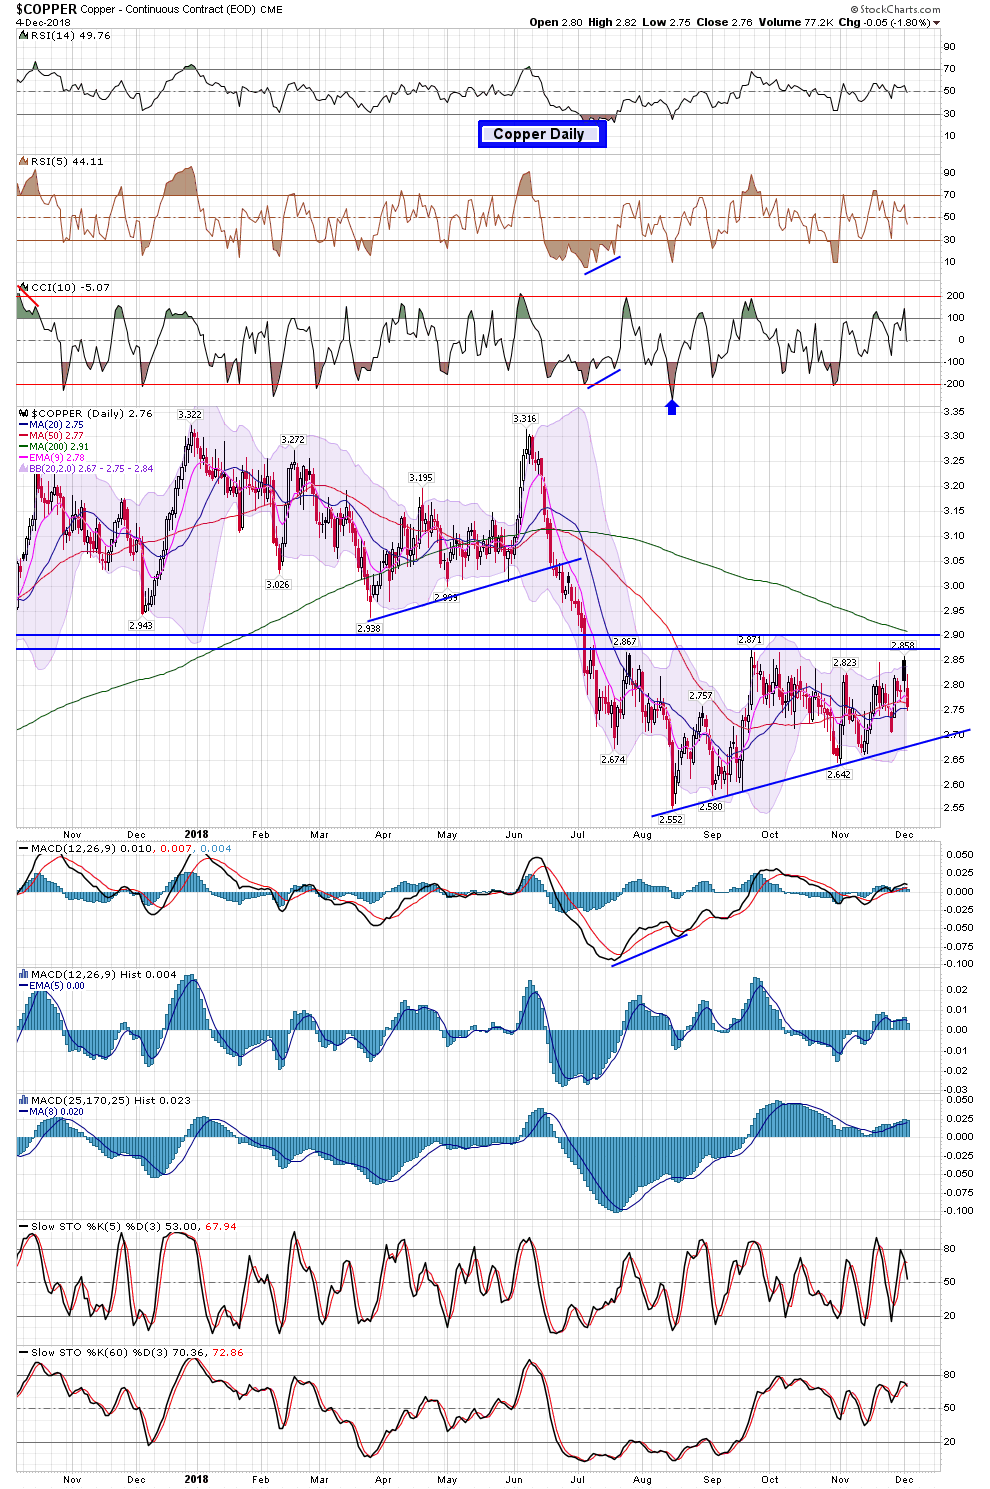
| Copper | COPPER - W | JJCB - W | -1.80% | -1.02% | 2.76 |
| Agriculture | DBA - W | -0.46% | 0.00% | 17.29 | |
| Corn | CORN - W | CORN - W | 0.72% | 1.85% | 384.75 |
| Wheat | WHEAT - W | WEAT - W | 0.24% | 1.31% | 522.50 |
| Coffee | BJO - W | -2.04% | -3.06% | 41.78 | |
| Sugar | CANE - W | -1.19% | -0.93% | 7.45 |
| Precious Metals | Index Symbol | ETF Symbol | % G / L Day | % G / L Week | Close |
|---|---|---|---|---|---|
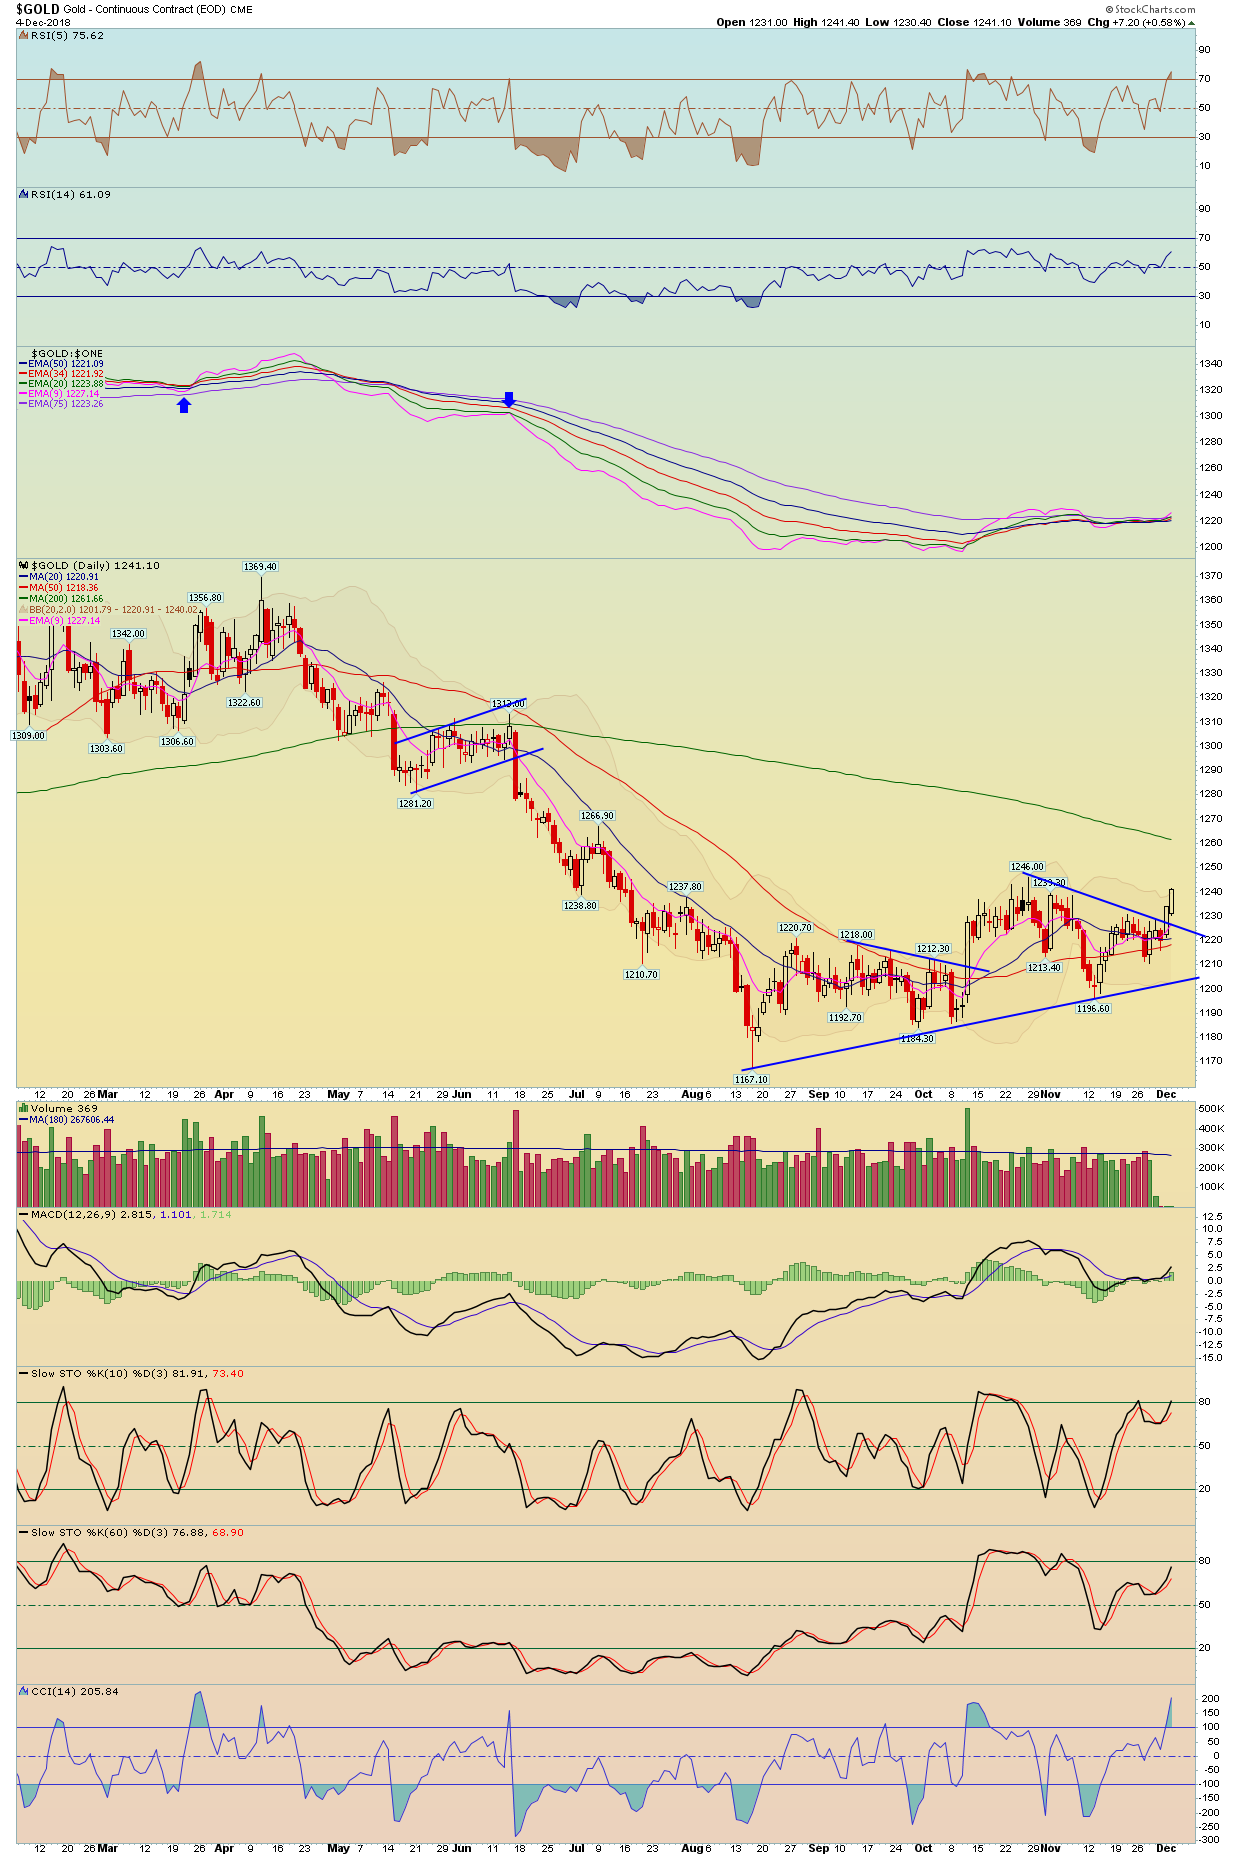
| Gold Metal | GLD - W | 0.61% | 1.37% | 117.12 | |
| Silver | SLV - W | 0.96% | 2.25% | 13.62 | |
| Platinum | PPLT - W | -0.38% | 0.50% | 76.03 | |
| Palladium | PALL - W | 2.88% | 5.03% | 117.26 | |
| GDX Gold Miners ETF | GDX - W | 0.82% | 2.67% | 19.60 |
| Bonds | Index Symbol | ETF Symbol | % G / L Day | % G / L Week | Close |
|---|---|---|---|---|---|
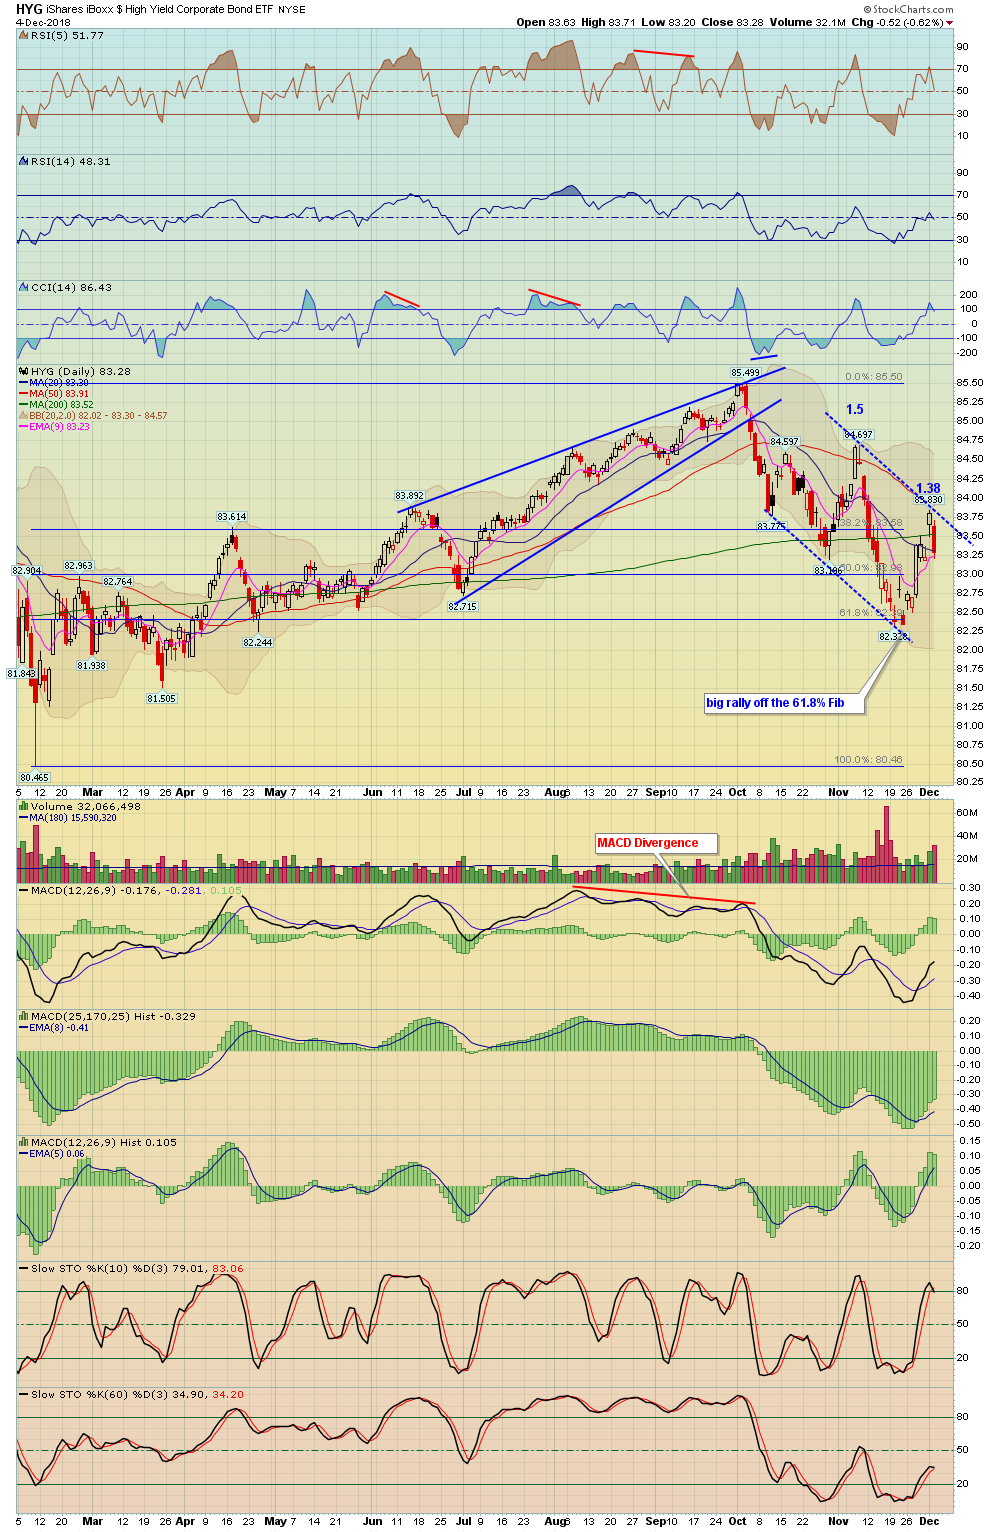
| High Yield Corporate Bond | HYG - W | -0.62% | 0.07% | 83.28 | |
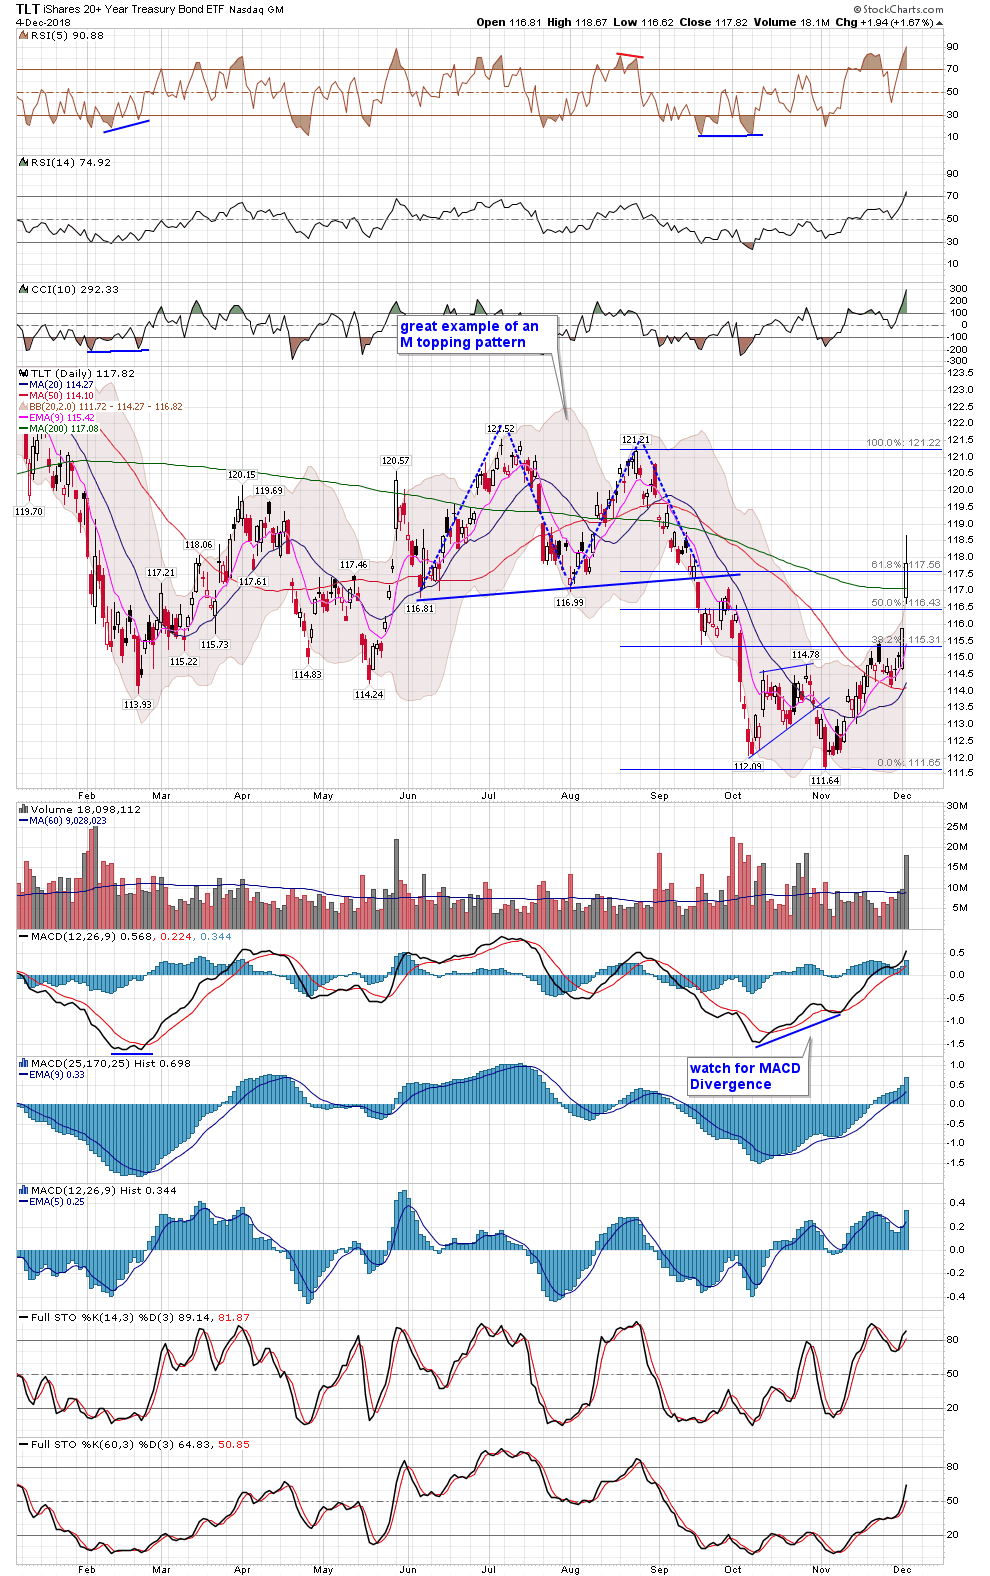
| TLT 20 Year Bond ETF | TLT - W | 1.67% | 2.40% | 117.82 | |
| 10 Year Treasury Yield | TNX - W | -2.27% | -2.95% | 29.24 | |
| 30 Year Treasury Yield | TYX - W | -3.05% | -4.02% | 31.78 |
3
| Date | ET | Release | For | Actual | Briefing.com Forecast | Briefing.com Consensus | Prior | Revised From |
|---|---|---|---|---|---|---|---|---|
| Dec 03 | 10:00 | ISM Index | Nov | 59.3 | 56.8 | 57.2 | 57.7 | |
| Dec 03 | 10:00 | Construction Spending | Oct | -0.1% | 0.3% | 0.3% | -0.1% | 0.0% |
| Dec 03 | 14:00 | Auto Sales | Nov | NA | NA | 4.27M | ||
| Dec 03 | 14:00 | Truck Sales | Nov | NA | NA | 9.31M | ||
| Dec 05 | 07:00 | MBA Mortgage Applications Index | 12/01 | NA | NA | 5.5% | ||
| Dec 05 | 14:00 | Beige Book | Nov | NA | NA | NA | ||
| Dec 06 | 08:15 | ADP Employment Change | Nov | 180K | 192K | 227K | ||
| Dec 06 | 08:30 | Productivity-Rev. | Q3 | 2.2% | 2.2% | 2.2% | ||
| Dec 06 | 08:30 | Trade Balance | Oct | -$55.1B | -$54.7B | -$54.0B | ||
| Dec 06 | 08:30 | Unit Labor Costs - Rev. | Q3 | 1.2% | 1.2% | 1.2% | ||
| Dec 06 | 08:30 | Initial Claims | 12/01 | 230K | 225K | 234K | ||
| Dec 06 | 08:30 | Continuing Claims | 11/24 | NA | NA | 1710K | ||
| Dec 06 | 10:00 | Factory Orders | Oct | -1.8% | -2.0% | 0.7% | ||
| Dec 06 | 10:00 | ISM Services | Nov | 59.3 | 59.0 | 60.3 | ||
| Dec 06 | 11:00 | Crude Inventories | 12/01 | NA | NA | +3.6M | ||
| Dec 07 | 08:30 | Nonfarm Payrolls | Nov | 180K | 189K | 250K | ||
| Dec 07 | 08:30 | Nonfarm Private Payrolls | Nov | 175K | 185K | 246K | ||
| Dec 07 | 08:30 | Avg. Hourly Earnings | Nov | 0.3% | 0.3% | 0.2% | ||
| Dec 07 | 08:30 | Unemployment Rate | Nov | 3.7% | 3.7% | 3.7% | ||
| Dec 07 | 08:30 | Average Workweek | Nov | 34.5 | 34.5 | 34.5 | ||
| Dec 07 | 10:00 | University of Michigan Consumer Sentiment - prelim | Dec | 97.0 | 96.8 | 97.5 | ||
| Dec 07 | 10:00 | Wholesale Inventories | Oct | 0.7% | 0.7% | 0.4% | ||
| Dec 07 | 10:30 | Natural Gas Inventories | 12/01 | NA | NA | -59 bcf | ||
| Dec 07 | 15:00 | Consumer Credit | Oct | $14.0B | $16.5B | $11.0B |

Stock Earnings Calender:
Click here for a list of Stocks that are reporting Earnings
**Generally we never hold a position into earnings since the risk/reward is too great
4 - View Live Chart
5 - View Live Chart
6 - View Live Chart
7 - View Live Chart
8 - View Live Chart
9 - View Live Chart
10 - View Live Chart
11 - View Live Chart
12 - View Live Chart
13 - View Live Chart
14 - View Live Chart
15 - View Live Chart
16 - View Live Chart
17 - View Live Chart
18 - View Live Chart
19 - View Live Chart
20 - View Live Chart
21 - View Live Chart
22 - View Live Chart
23 - View Live Chart
24 - View Live Chart
25 - View Live Chart

26 - View Live Chart
27 - View Live Chart
28 - View Live Chart
29 - View Live Chart
30 - View Live Chart
31 - View Live Chart
32 - View Live Chart
33 - View Live Chart
34 - View Live Chart
35 - View Live Chart
36 - View Live Chart
37 - View Live Chart
38 - View Live Chart
39 - View Live Chart
40 - View Live Chart
41 - View Live Chart
42 - View Live Chart
43 - View Live Chart
44 - View Live Chart
45 - View Live Chart
46 - View Live Chart
- Hide Player Link to Newsletter Audio
- Hide Player Link to Newsletter Audio
- Hide Player Link to Newsletter Audio