Wednesday November 28th, 2018 Newsletter - free
Disclaimer: Intraday Chart Links will show up as daily charts unless you have an active stockcharts.com membership and are signed in, you can sign up here.
1
Table of Contents:
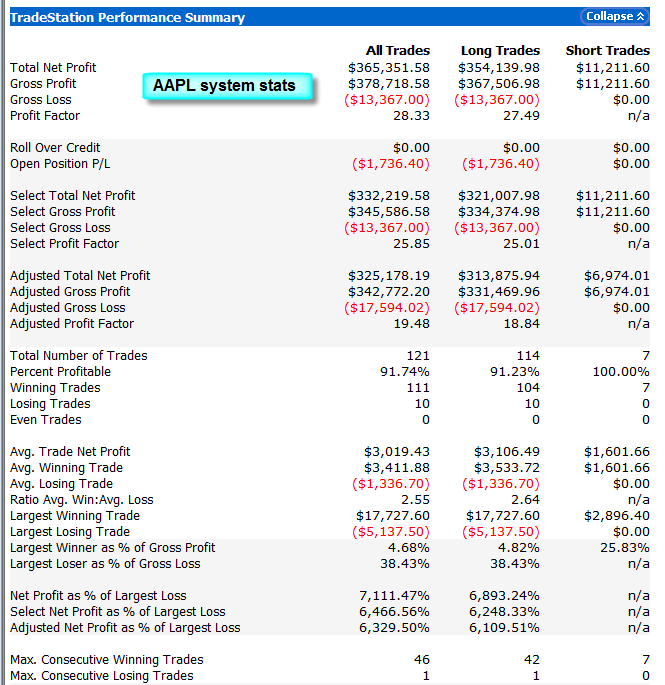
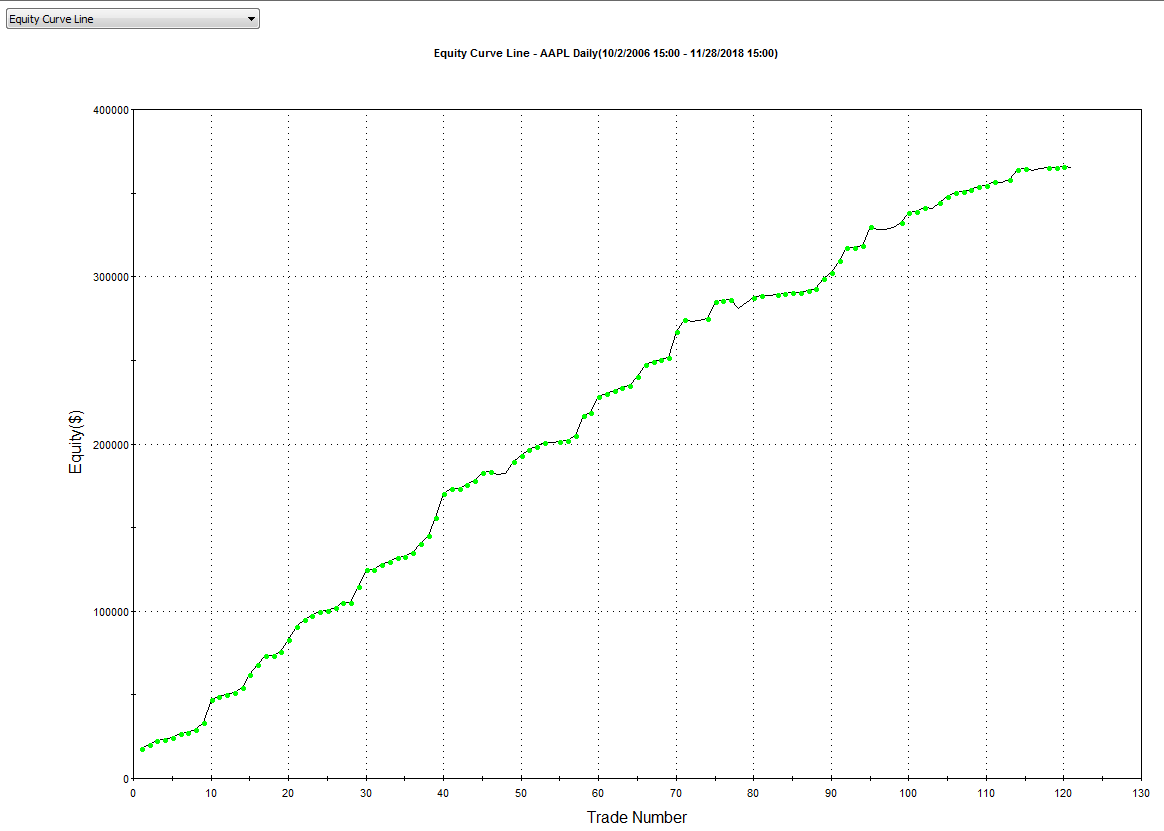
Systems Comments
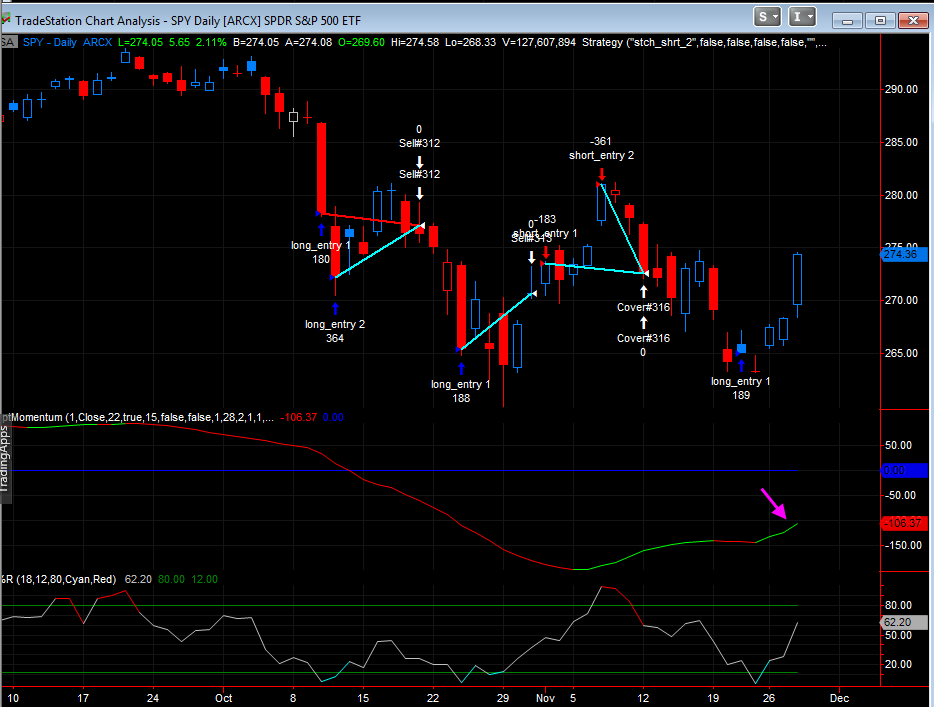
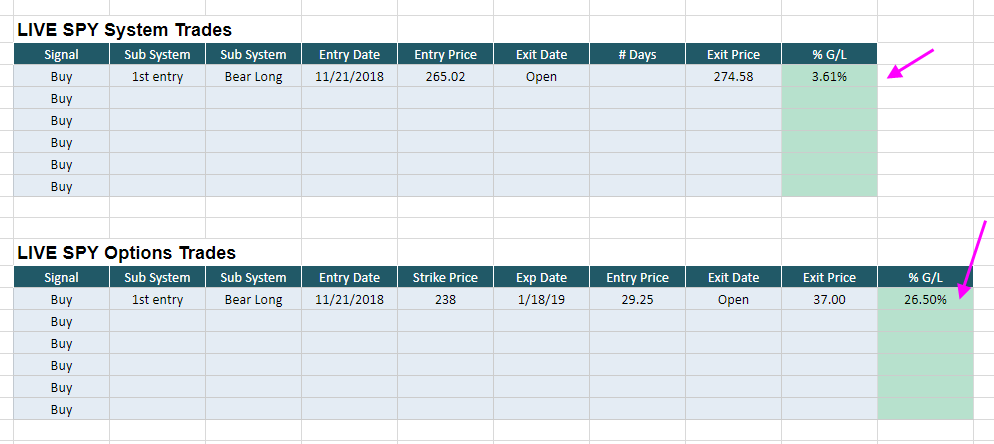
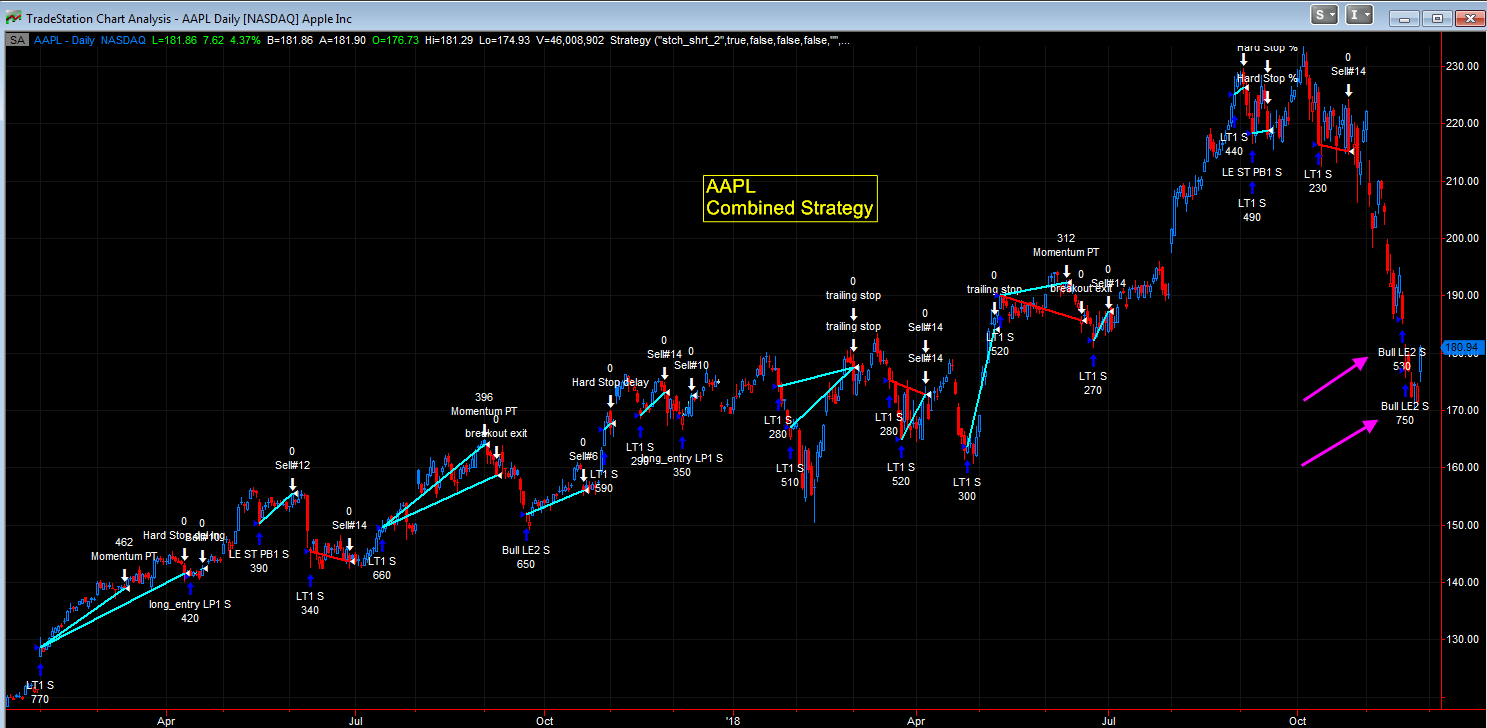
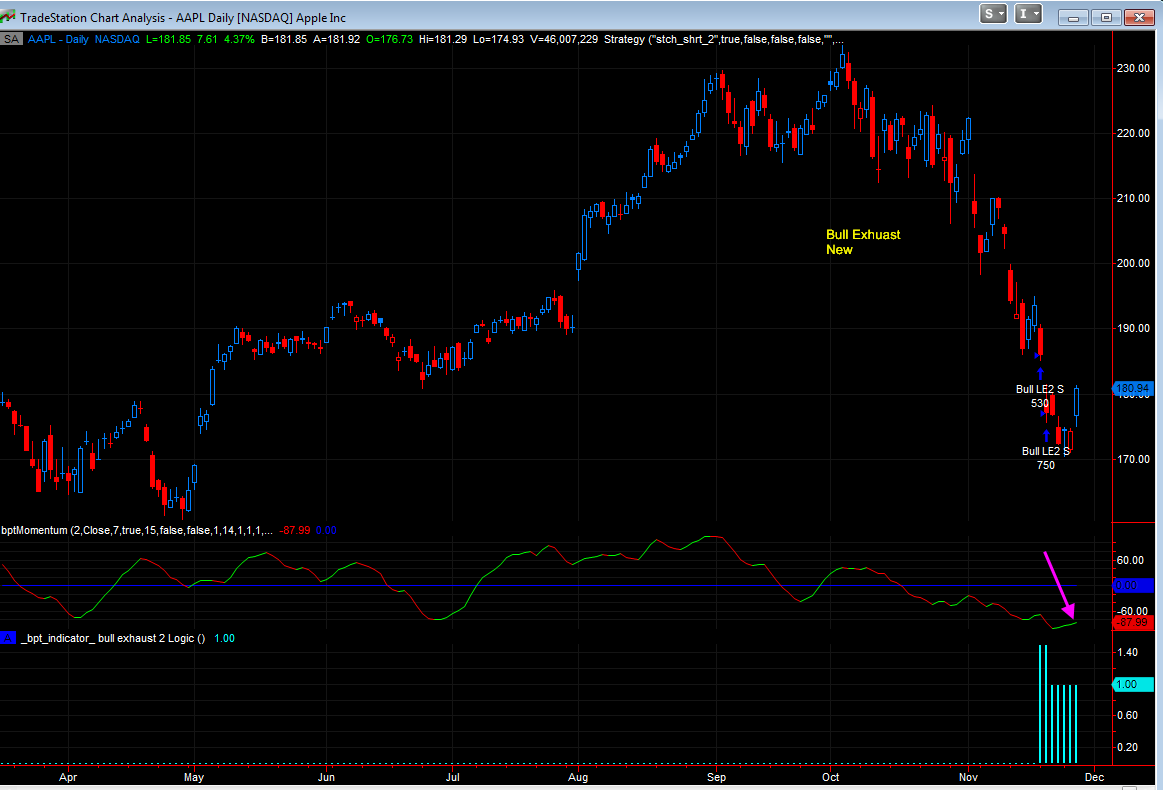
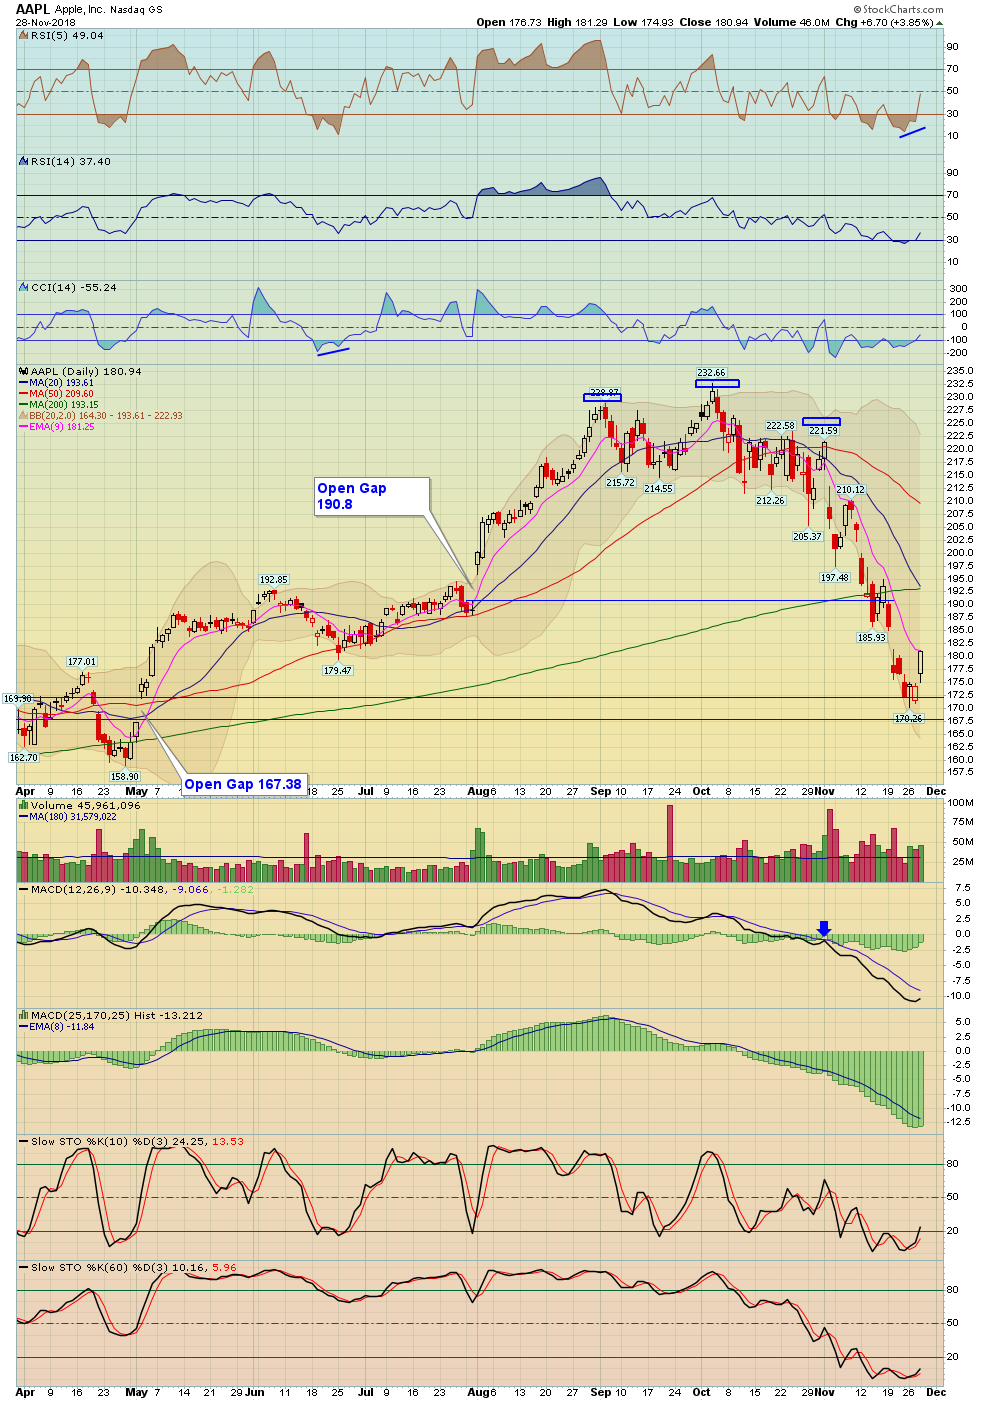
I sent out 2 emails already on the SPY and AAPL systems.
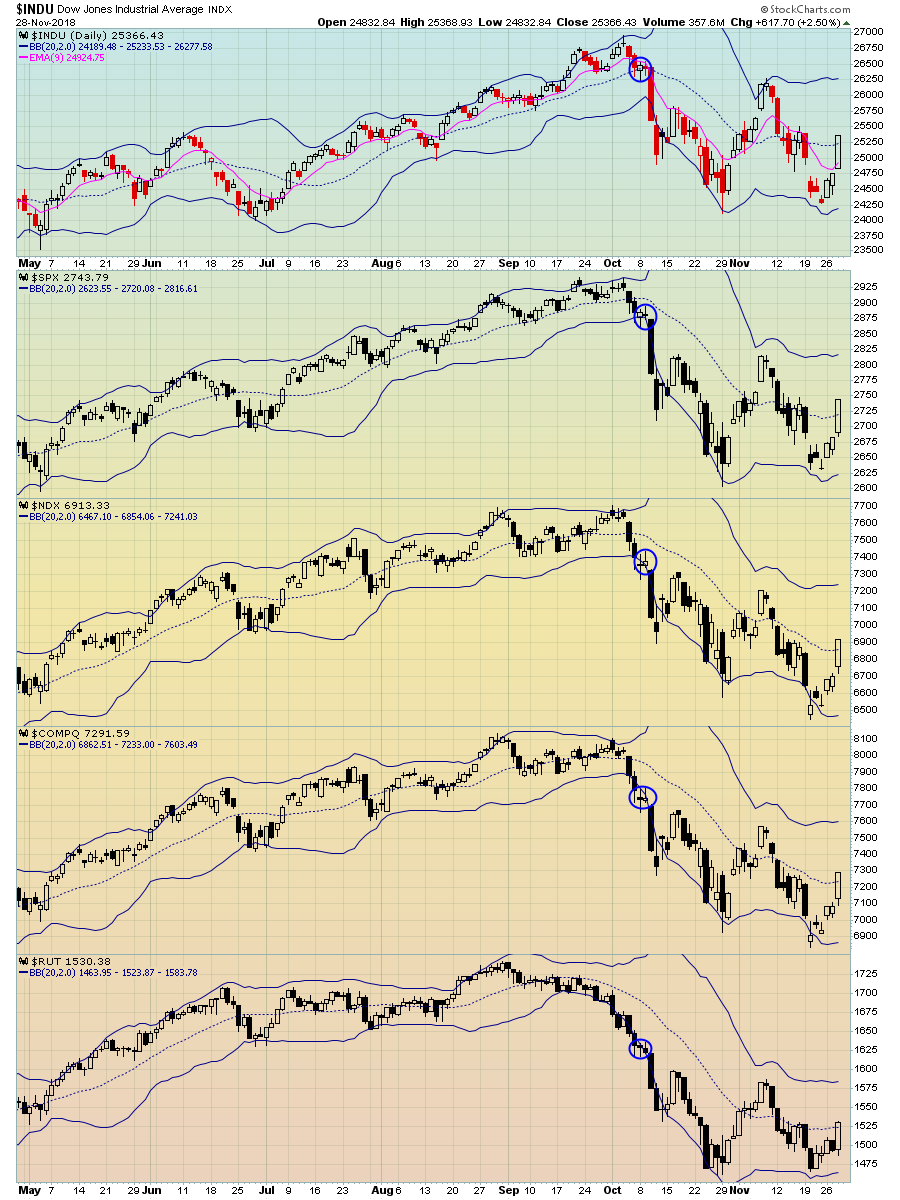
1. General Market Analysis: SPX and Other Major Indices
Market Surges after Fed Chairman Powell's comments Click here for article
2. Review of Select Sectors
3. Glance at Currencies and Commodities
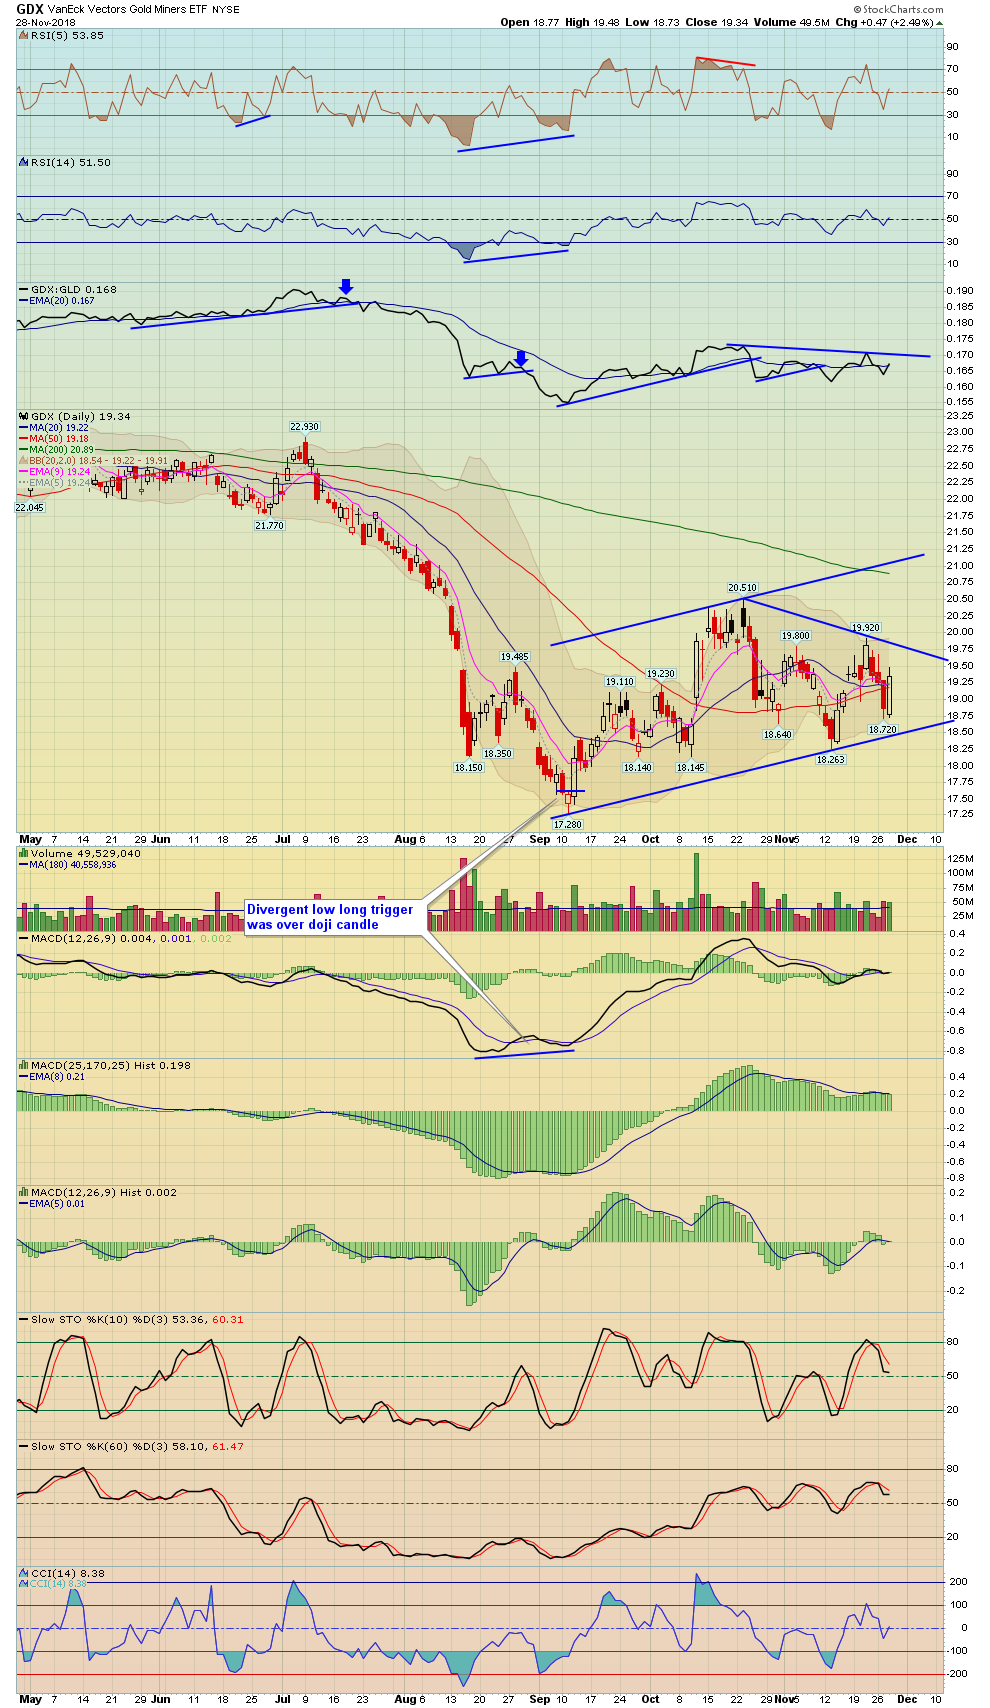
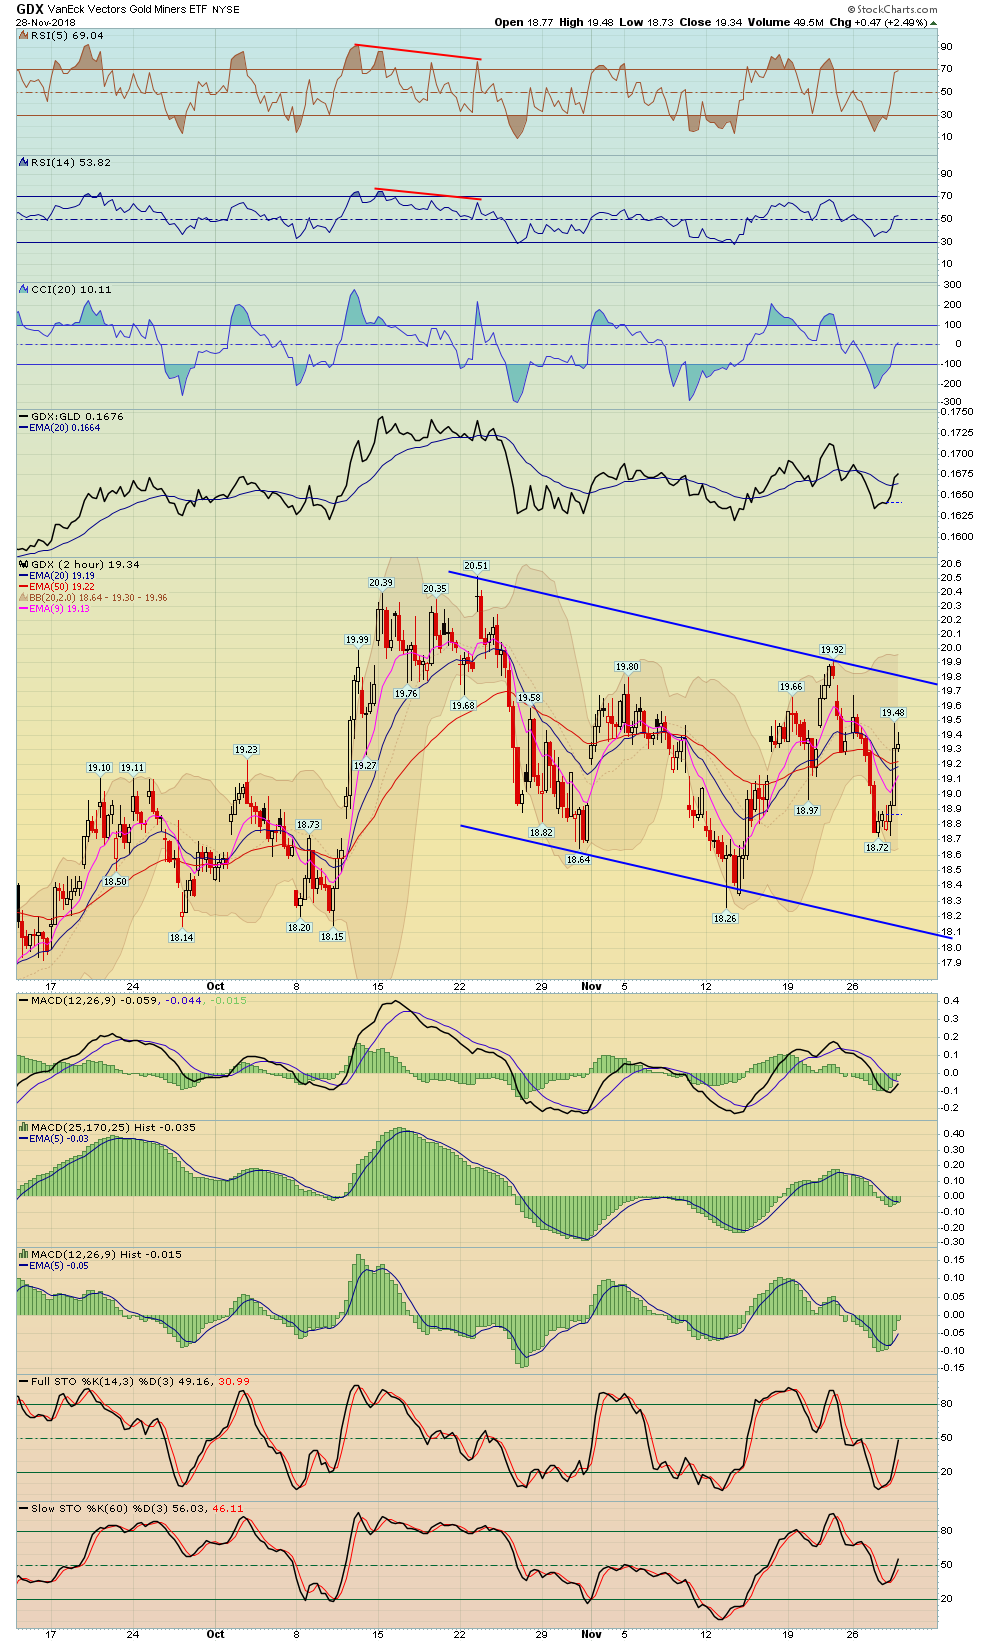
4. Precious Metals and GDX
5. Trade Ideas
-----
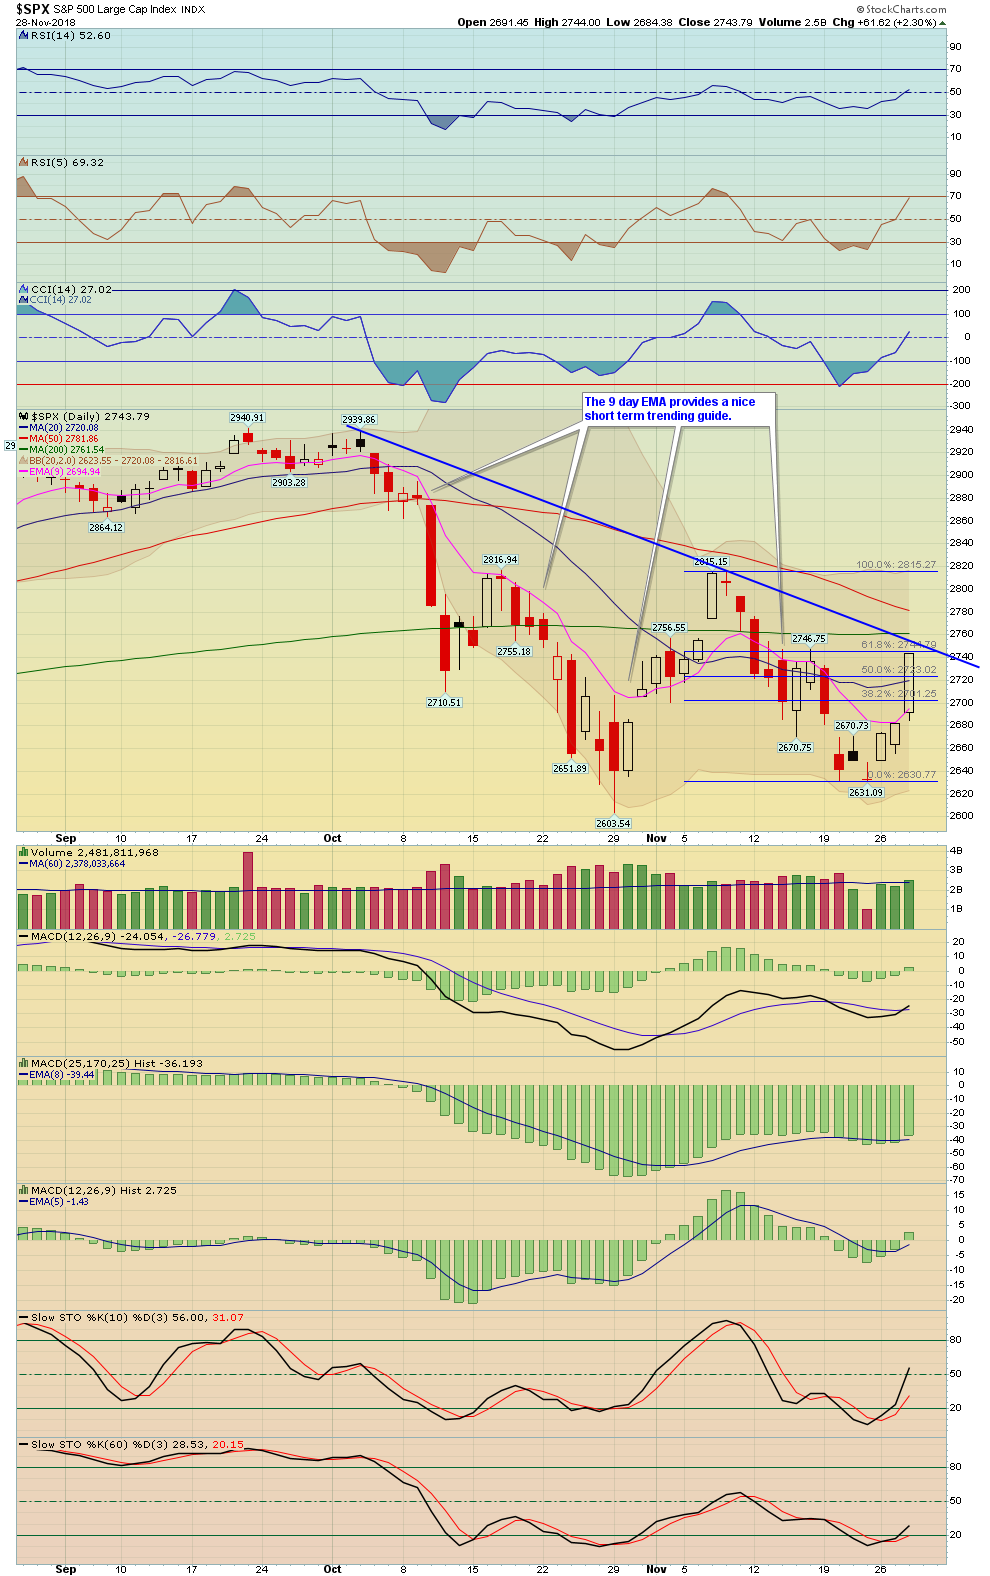
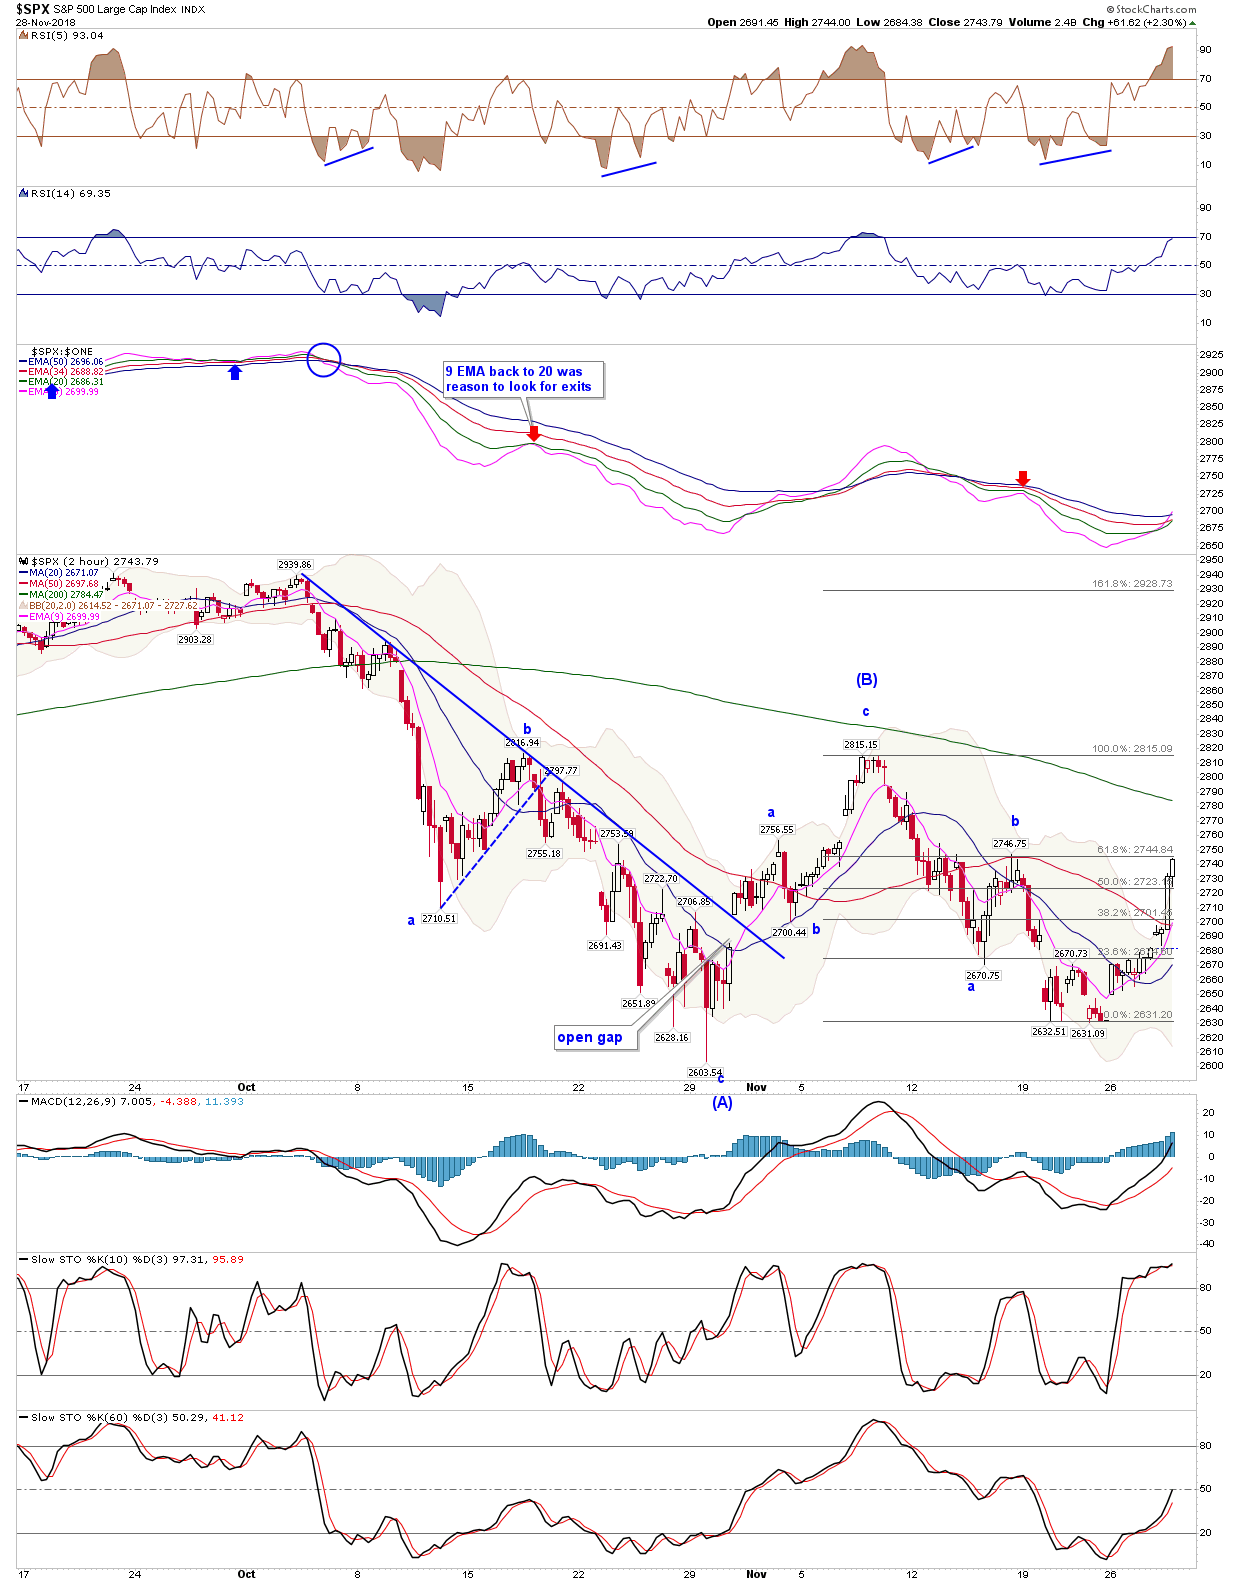
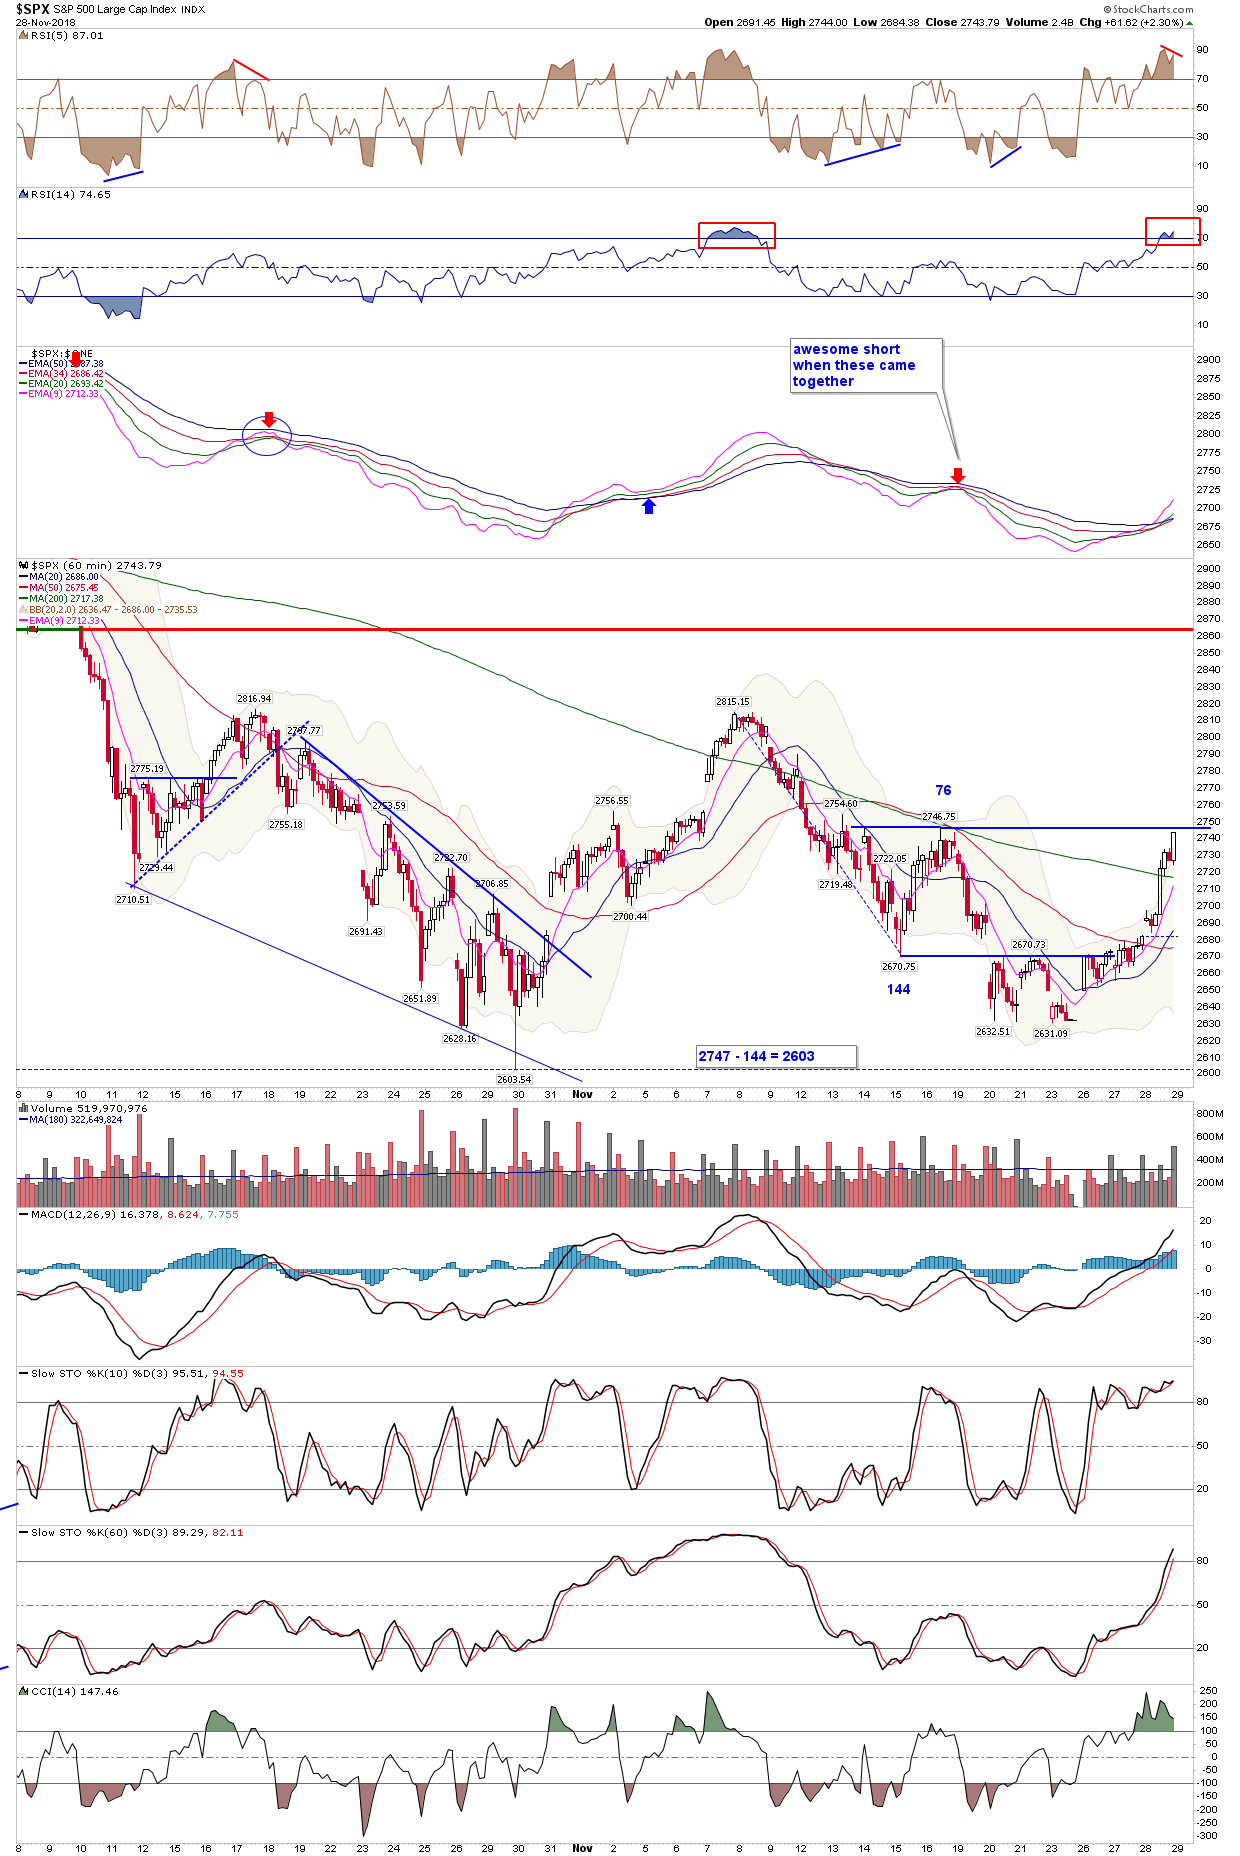
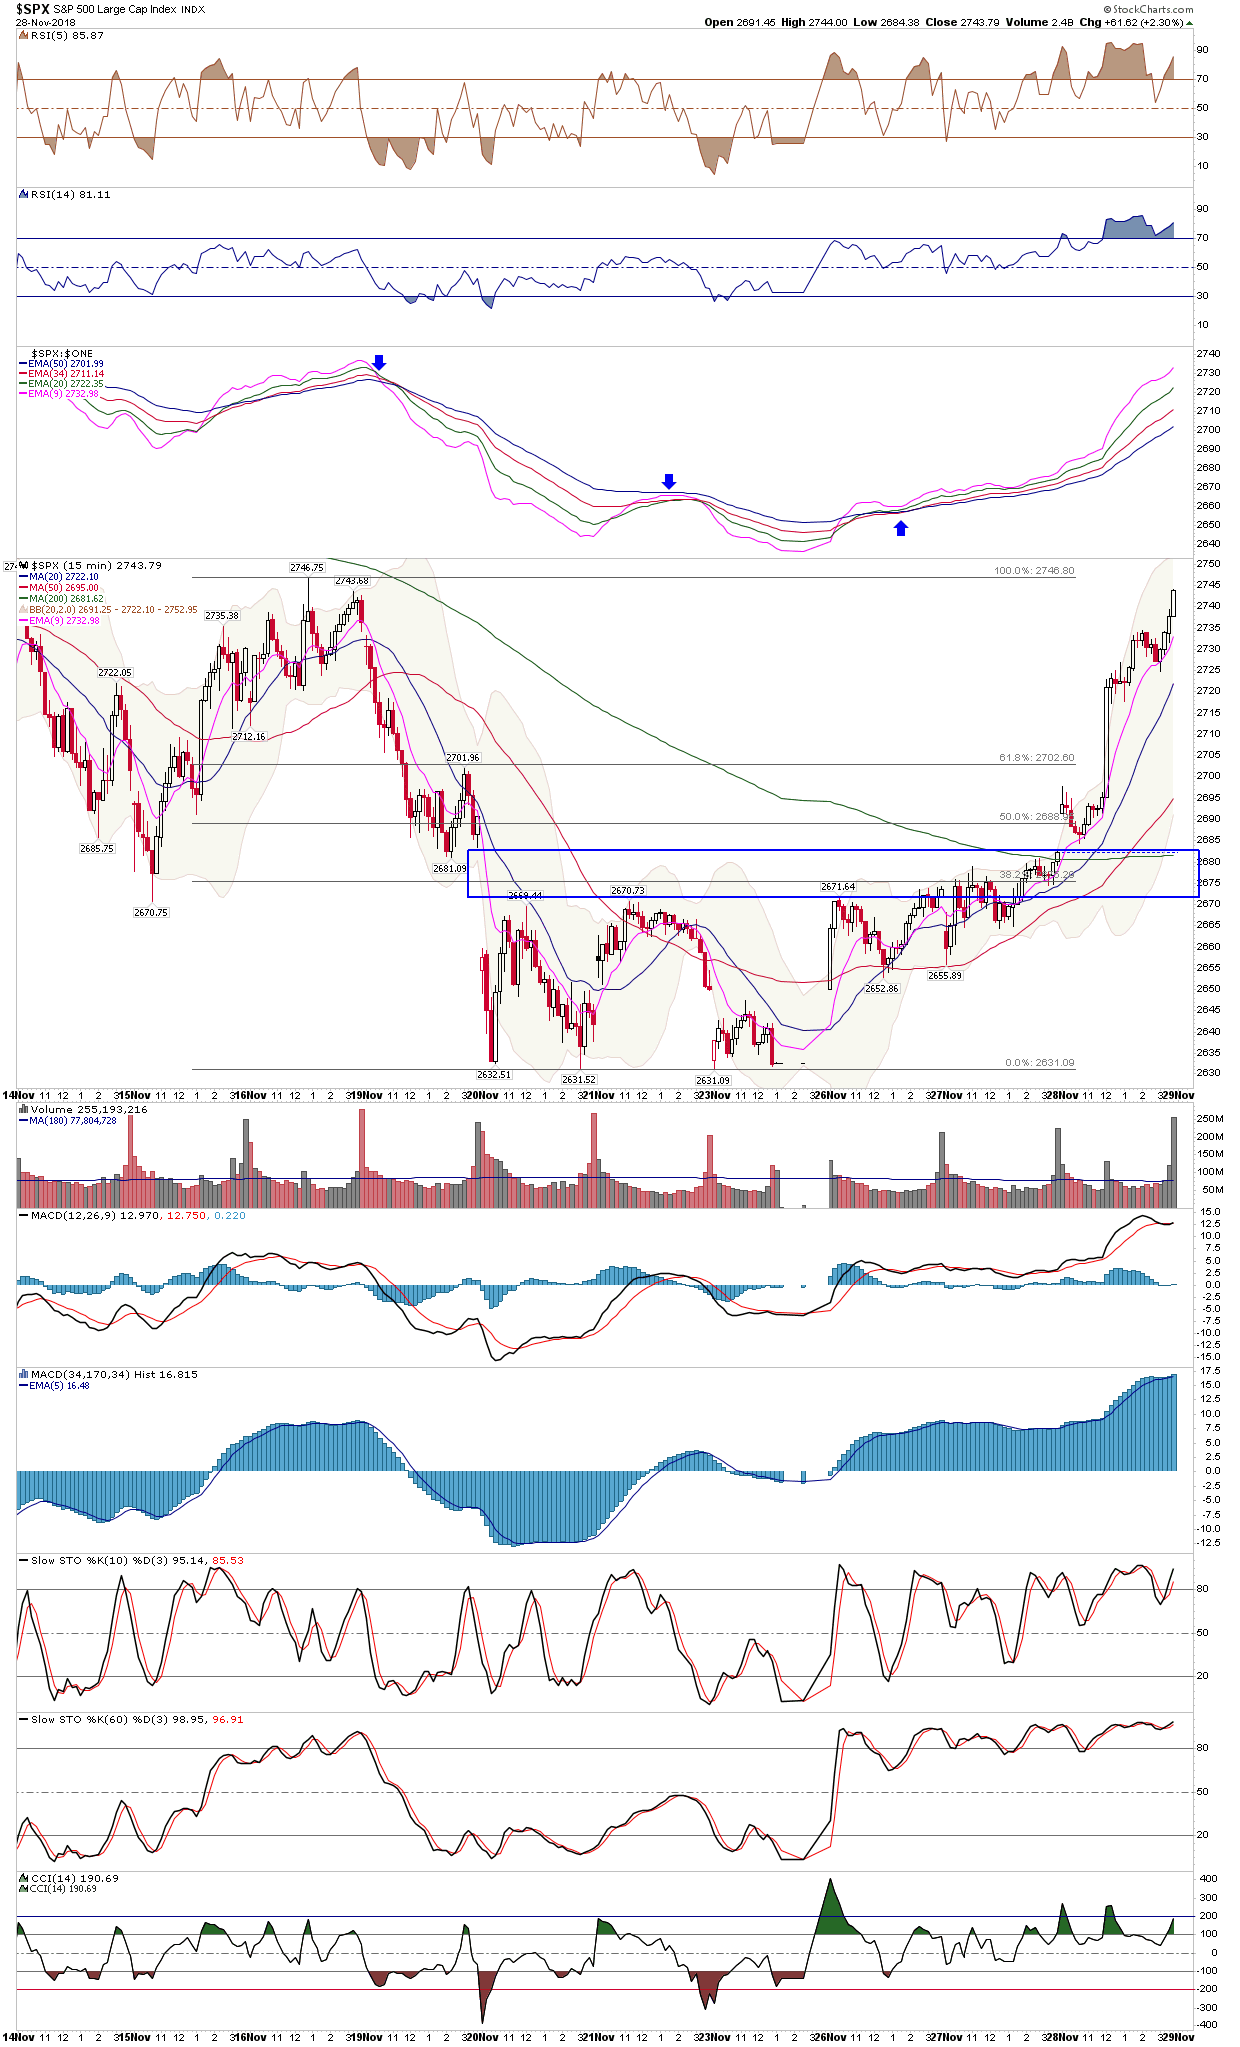
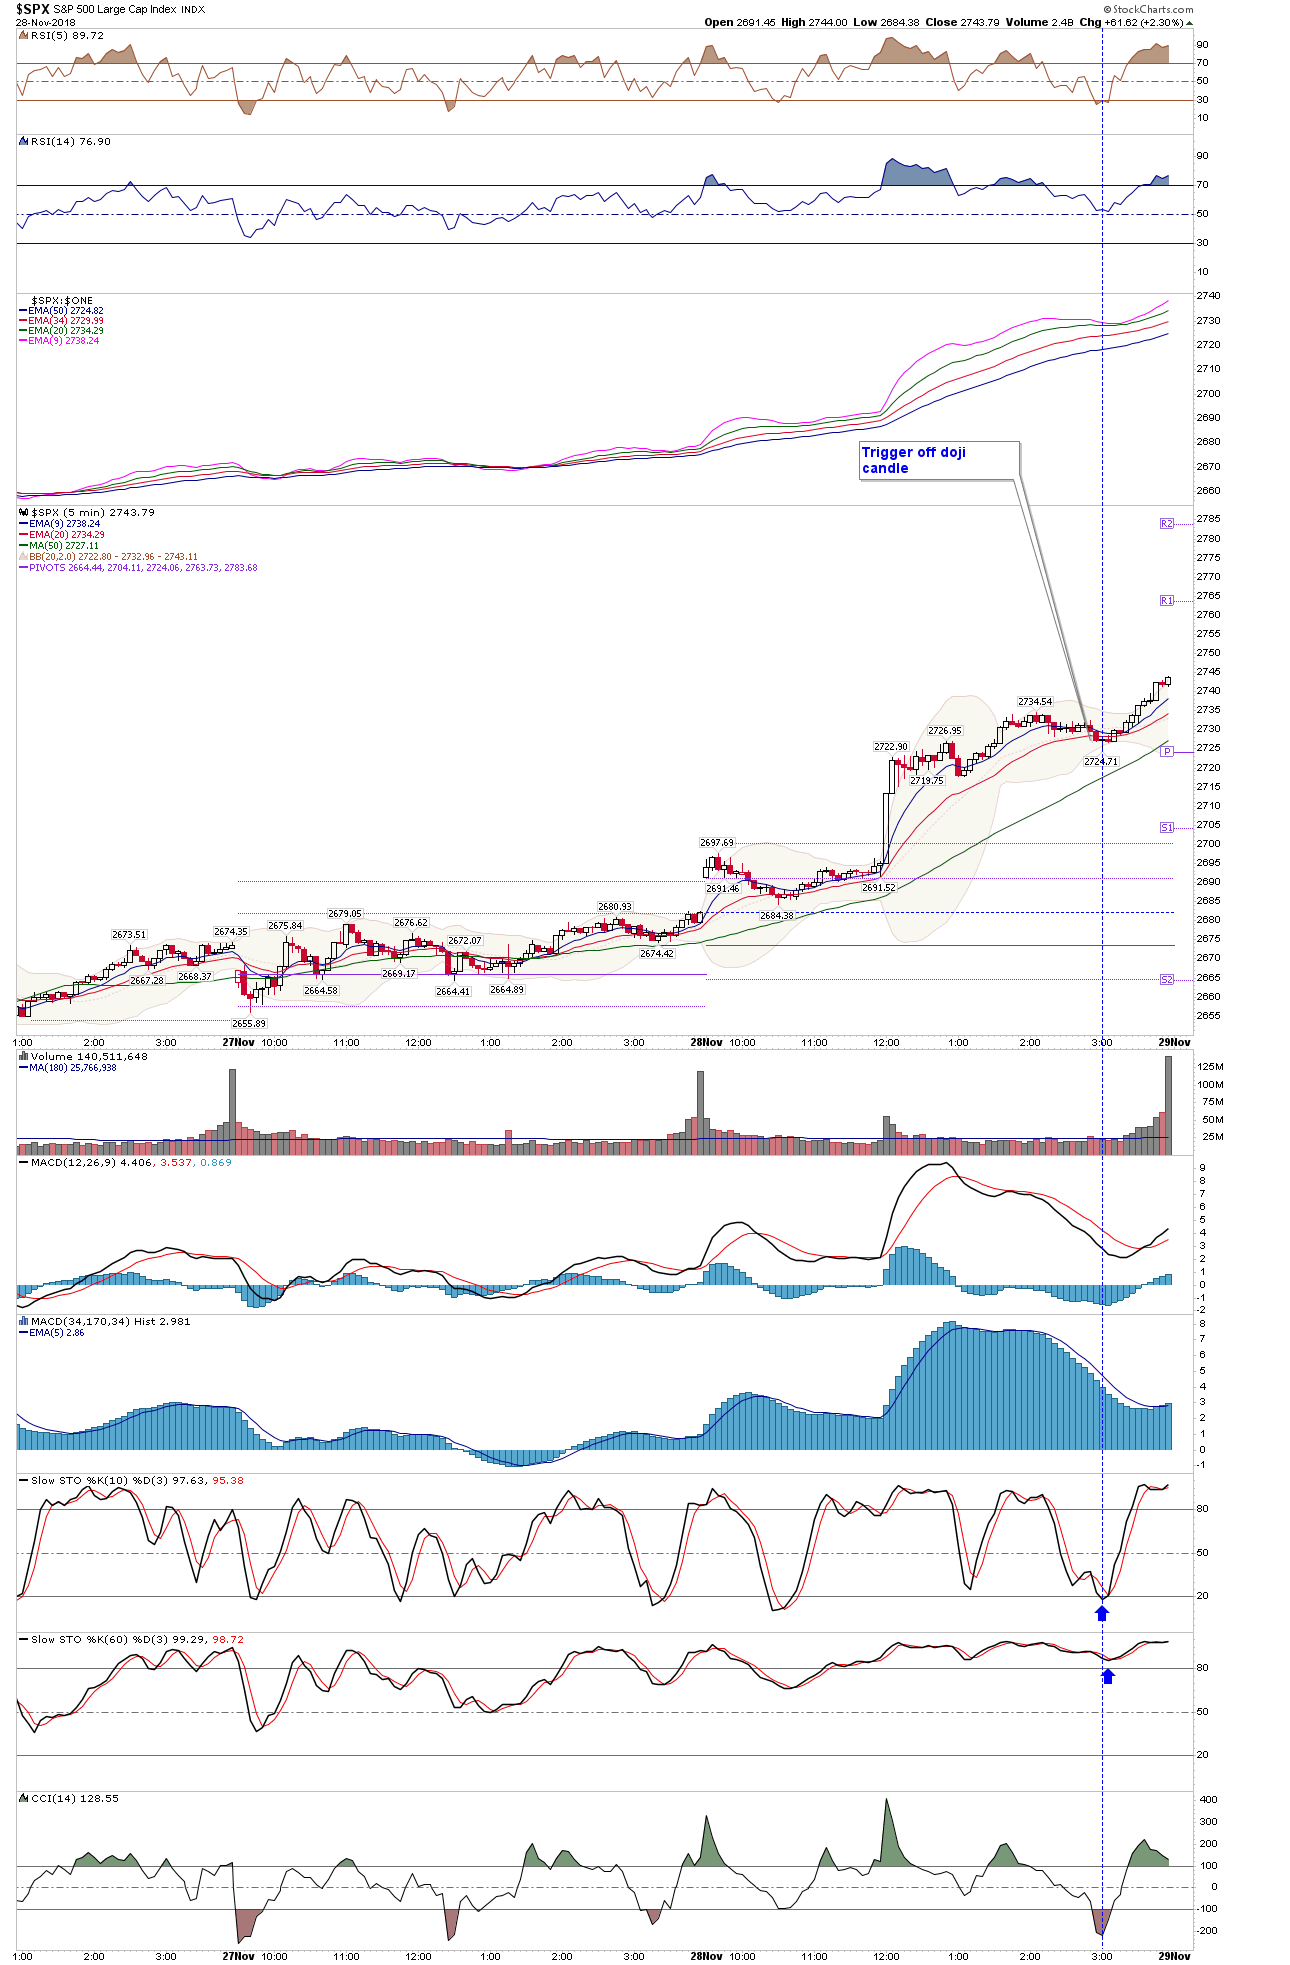
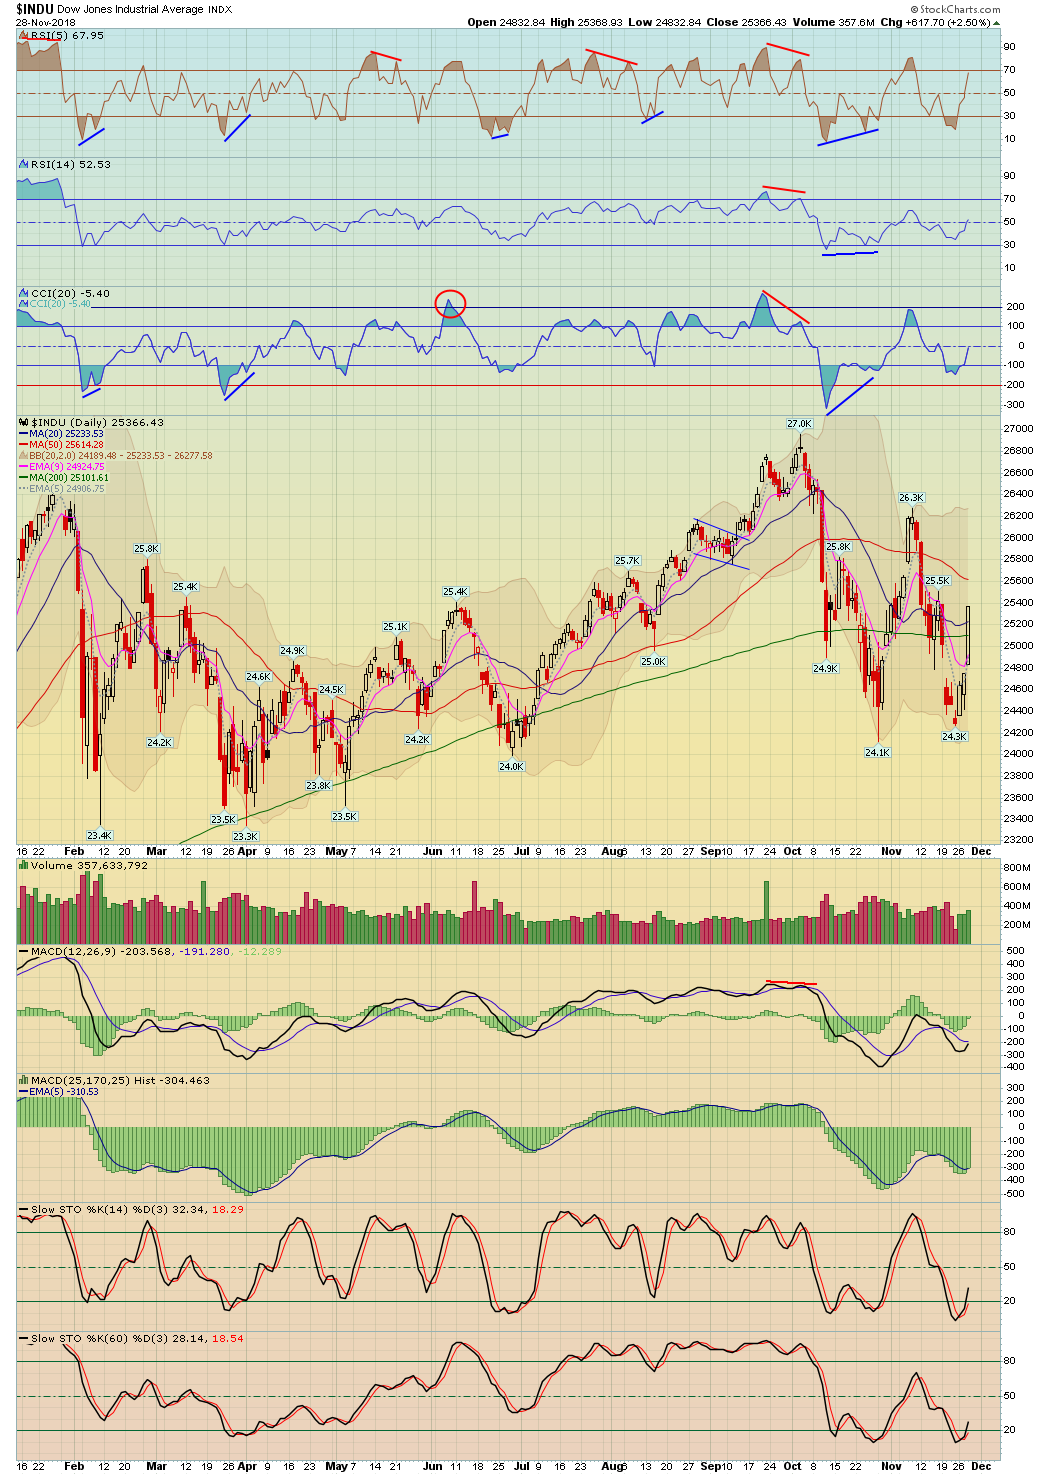
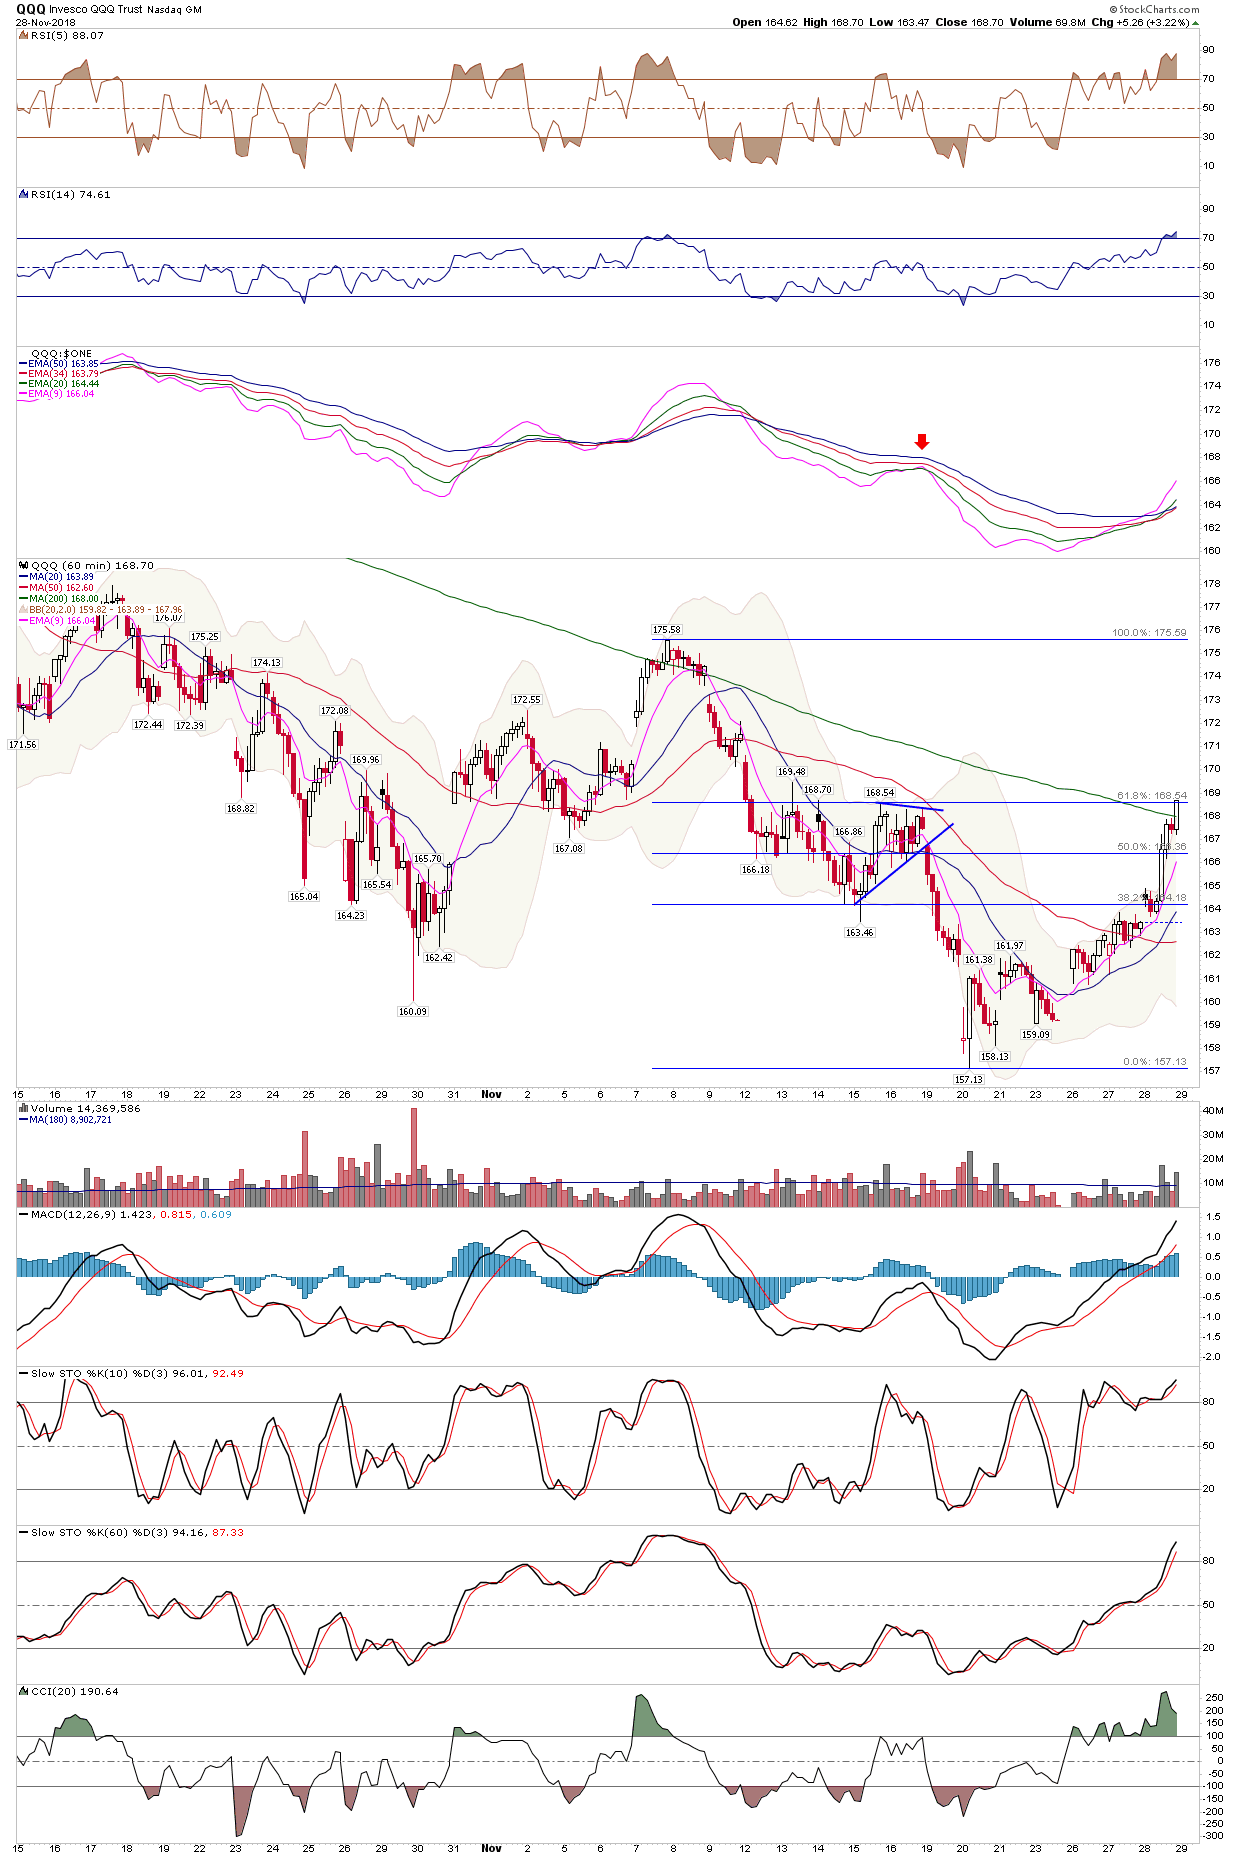
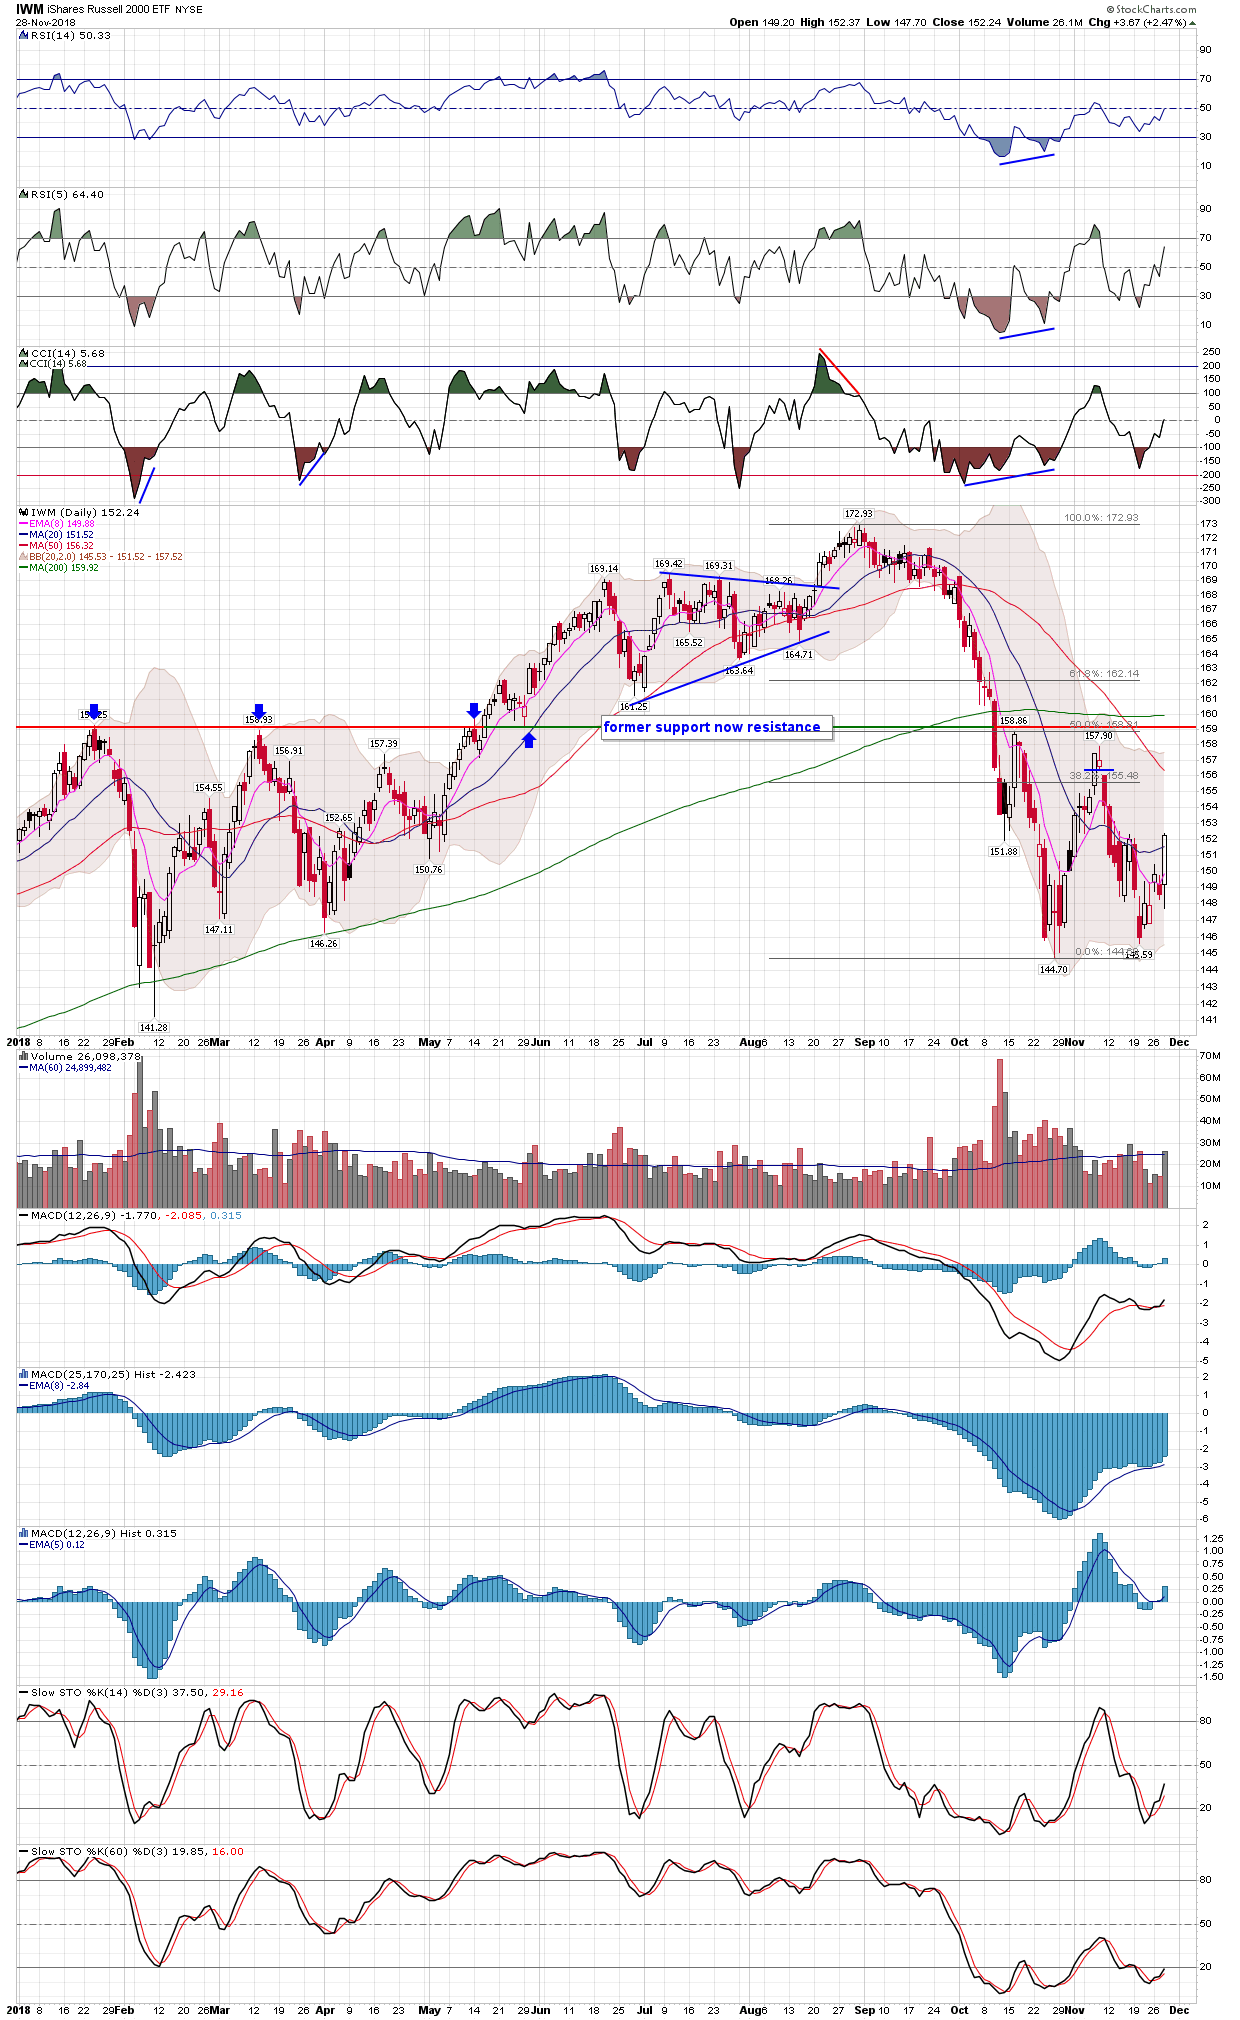
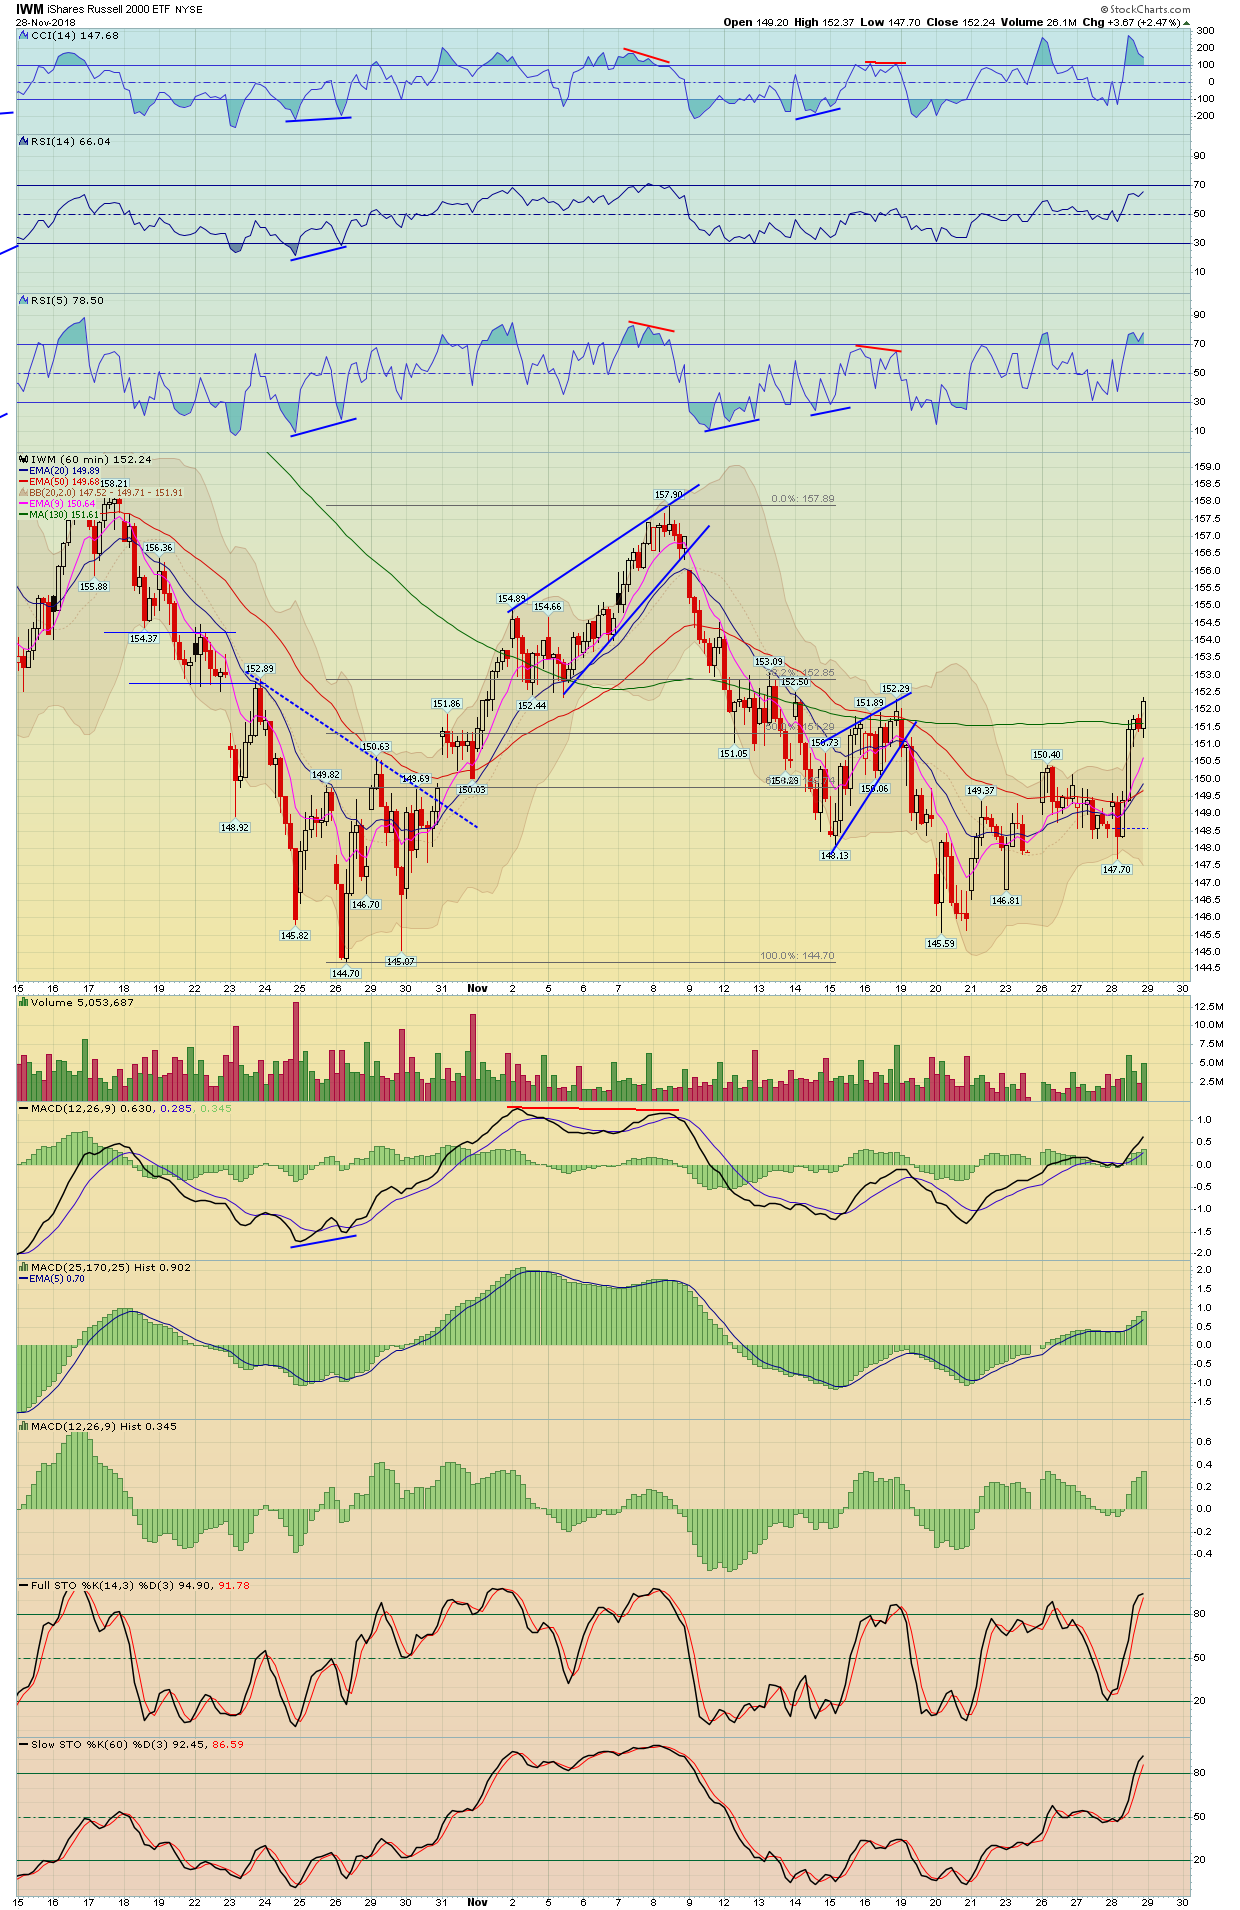
Today was one of those 'rip your face off' rallies, especially after Fed Chairman Powell's softer comments. I hope you guys see just how important the Fed is to the market. The Dow rallied 618 points or 2.5%, the SPX rallied 62 points or 2.3%, the Nasdaq rallied 3%, and the Russell 2000 rallied 2.5%. Obviously a very nice day for the market, however that's also par for the course in this volatility especially when things get too too stretched along with bearish sentiment. Last night Steve posted 8 new long setups and most of his provided nice trades, and most of my long setups from Monday that didn't trigger on Tuesday triggered today for very nice trades!
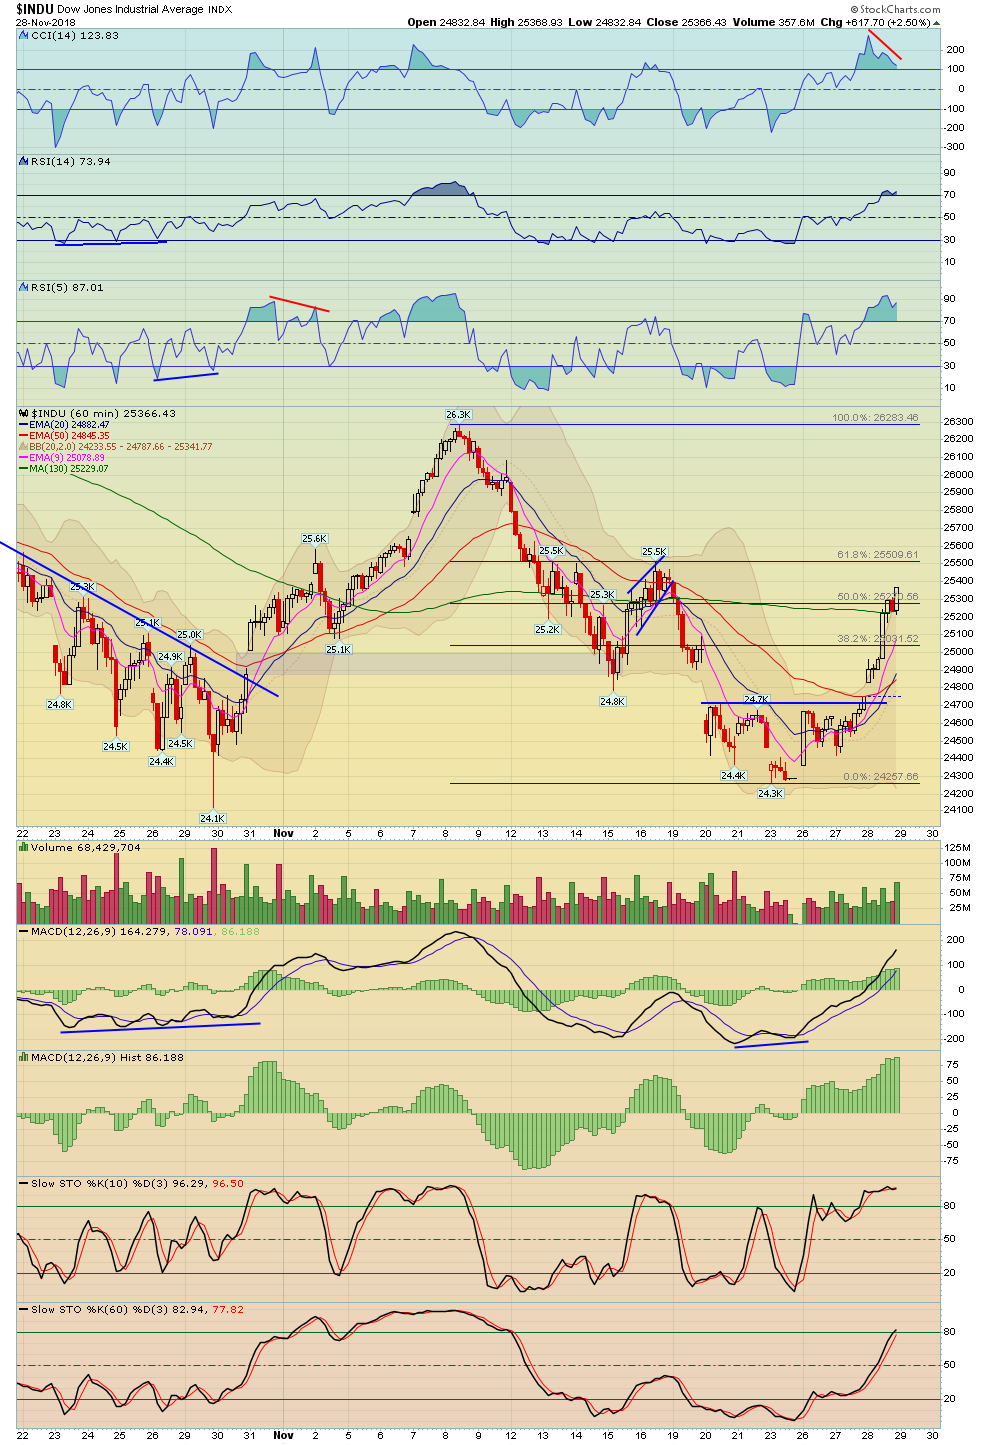
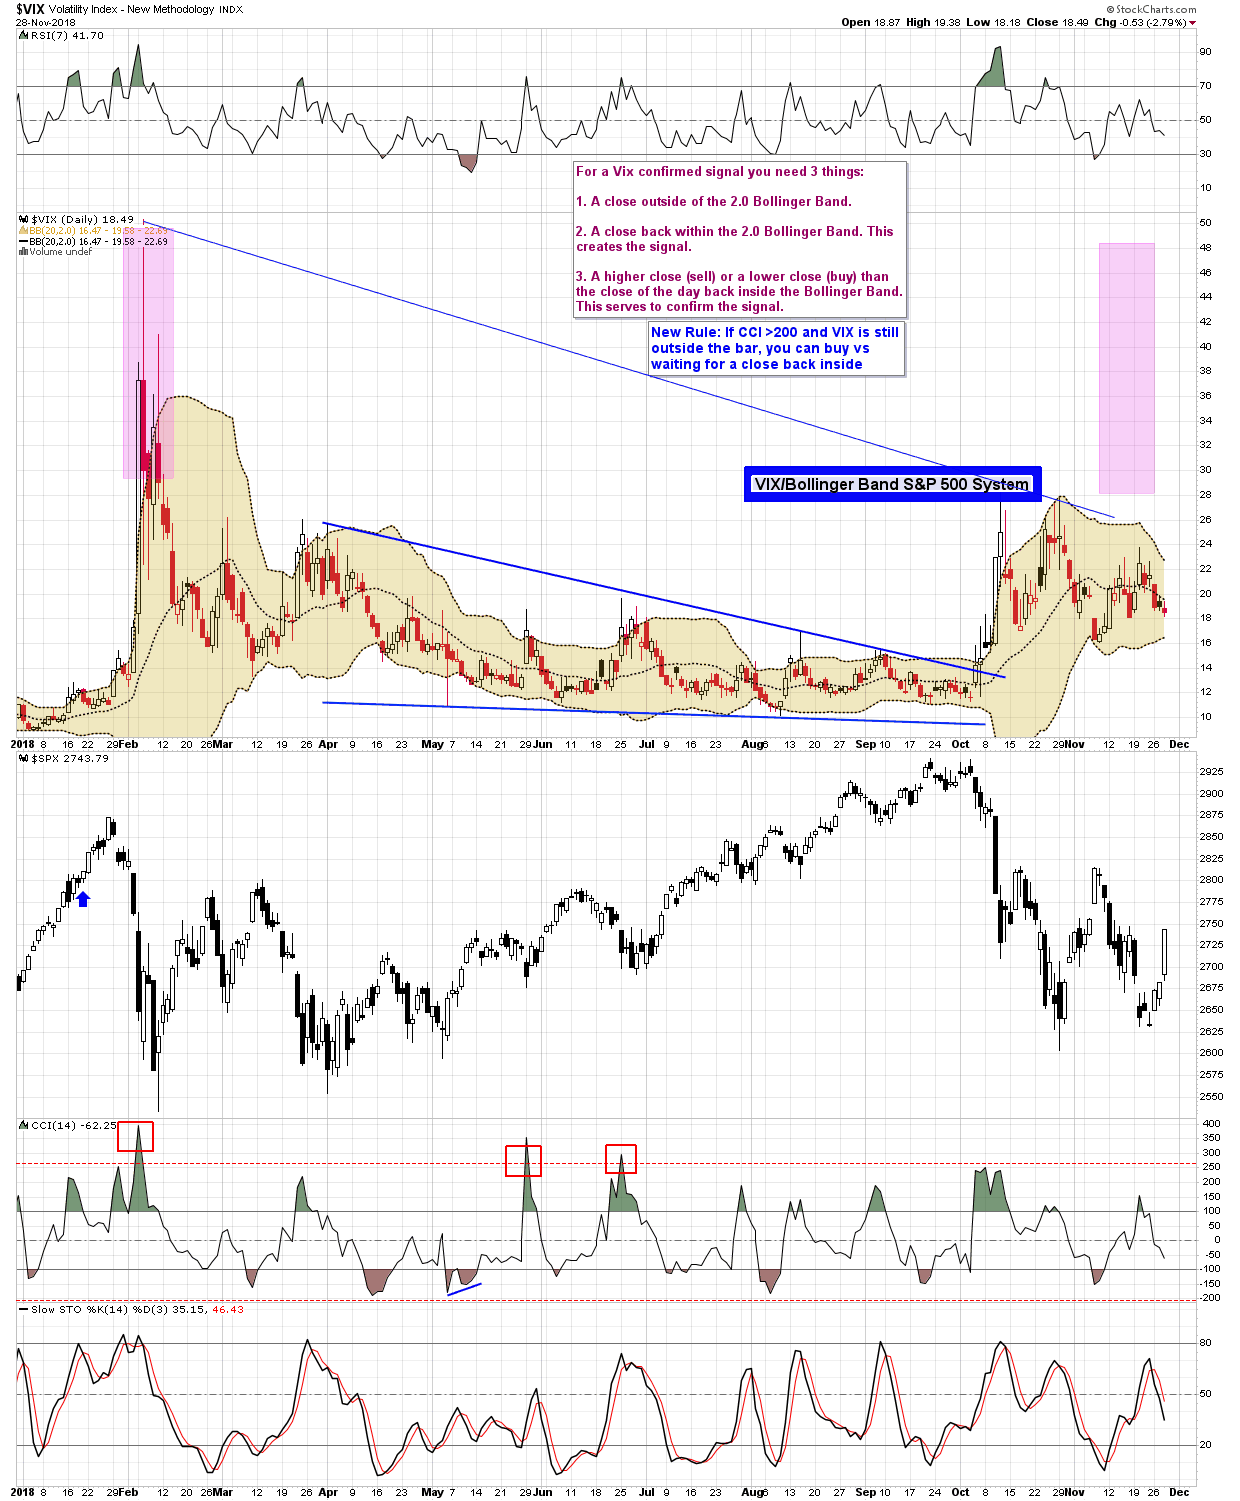
As far as the market, one thing to note is that the indexes essentially closed at the 61.8% Fibonacci retracements from the Nov 7th highs to last week's lows. Lately that 61.8% Fib has been an important one. We'll see what happens tomorrow. Generally after a big rally day you get an inside day. The best thing for the 'bulls' in the short term would be for the market to not have a big retracement, more than 50% of today's candle range.
Matt
2
3
4
5
6
7
8
| Major Indexes | Index Symbol | ETF Symbol | % G / L Day | % G / L Week | Close |
|---|---|---|---|---|---|
| Dow Jones | INDU - W | DIA - W | 2.50% | 4.45% | 25,366.43 |
| S&P 500 | SPX - W | SPY - W | 2.30% | 4.22% | 2,743.78 |
| Wilshire 5000 | WLSH - W | 2.34% | 4.03% | 28,293.10 | |
| Nasdaq | COMPQ - W | 2.95% | 5.08% | 7,291.59 | |
| NDX 100 | NDX - W | QQQ - W | 3.17% | 5.91% | 6,913.33 |
| Russel 2000 (Small Caps) | RUT - W | IWM - W | 2.51% | 2.80% | 1,530.38 |
| Market Sectors | Index Symbol | ETF Symbol | % G / L Day | % G / L Week | Close |
|---|---|---|---|---|---|
| Transports | TRAN - W | IYT - W | 2.48% | 3.83% | 10,766.61 |
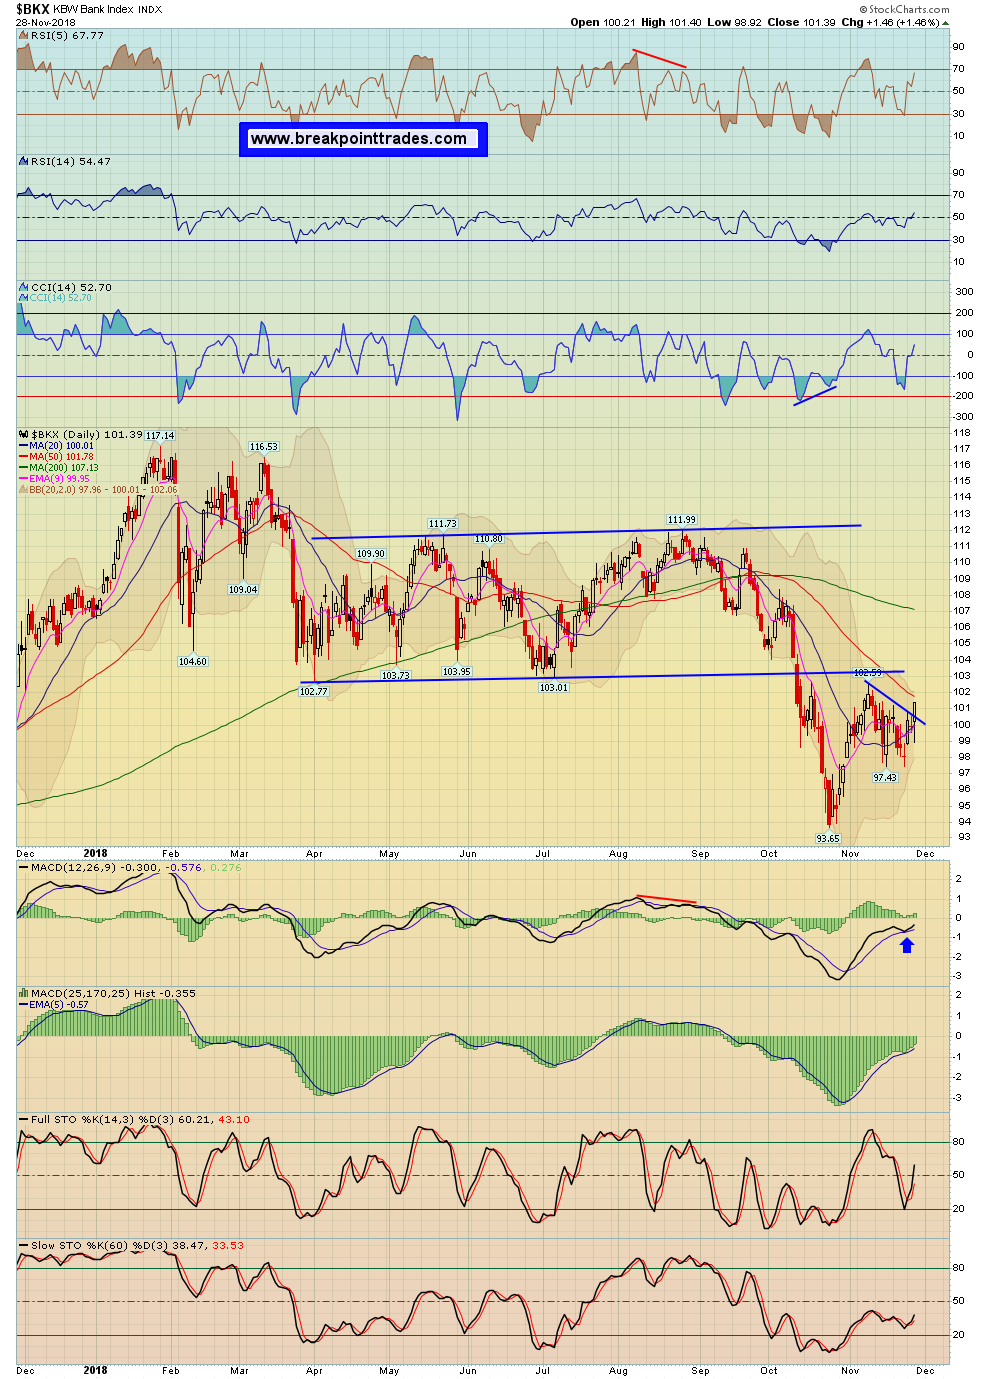
| Banks | BKX - W | 1.46% | 3.39% | 101.39 | |
| Financials | XLF - W | 1.92% | 4.08% | 27.06 | |
| Brokers | XBD - W | 1.60% | 3.05% | 264.80 | |
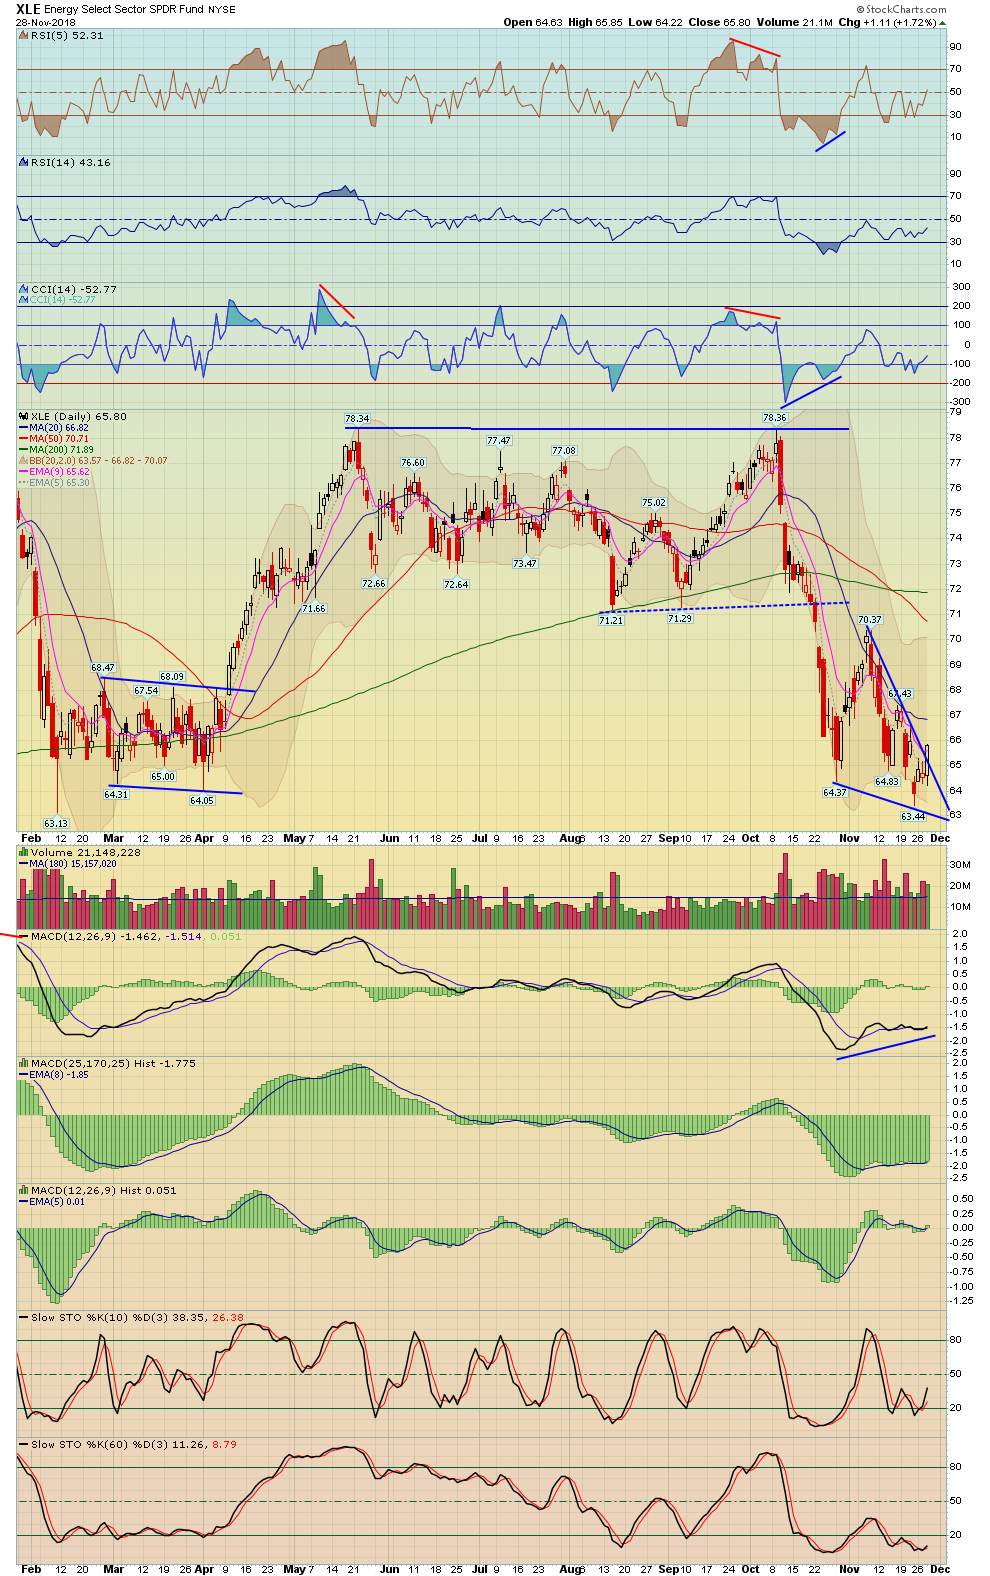
| XLE (Energy Select) | XLE - W | 1.72% | 2.96% | 65.80 | |
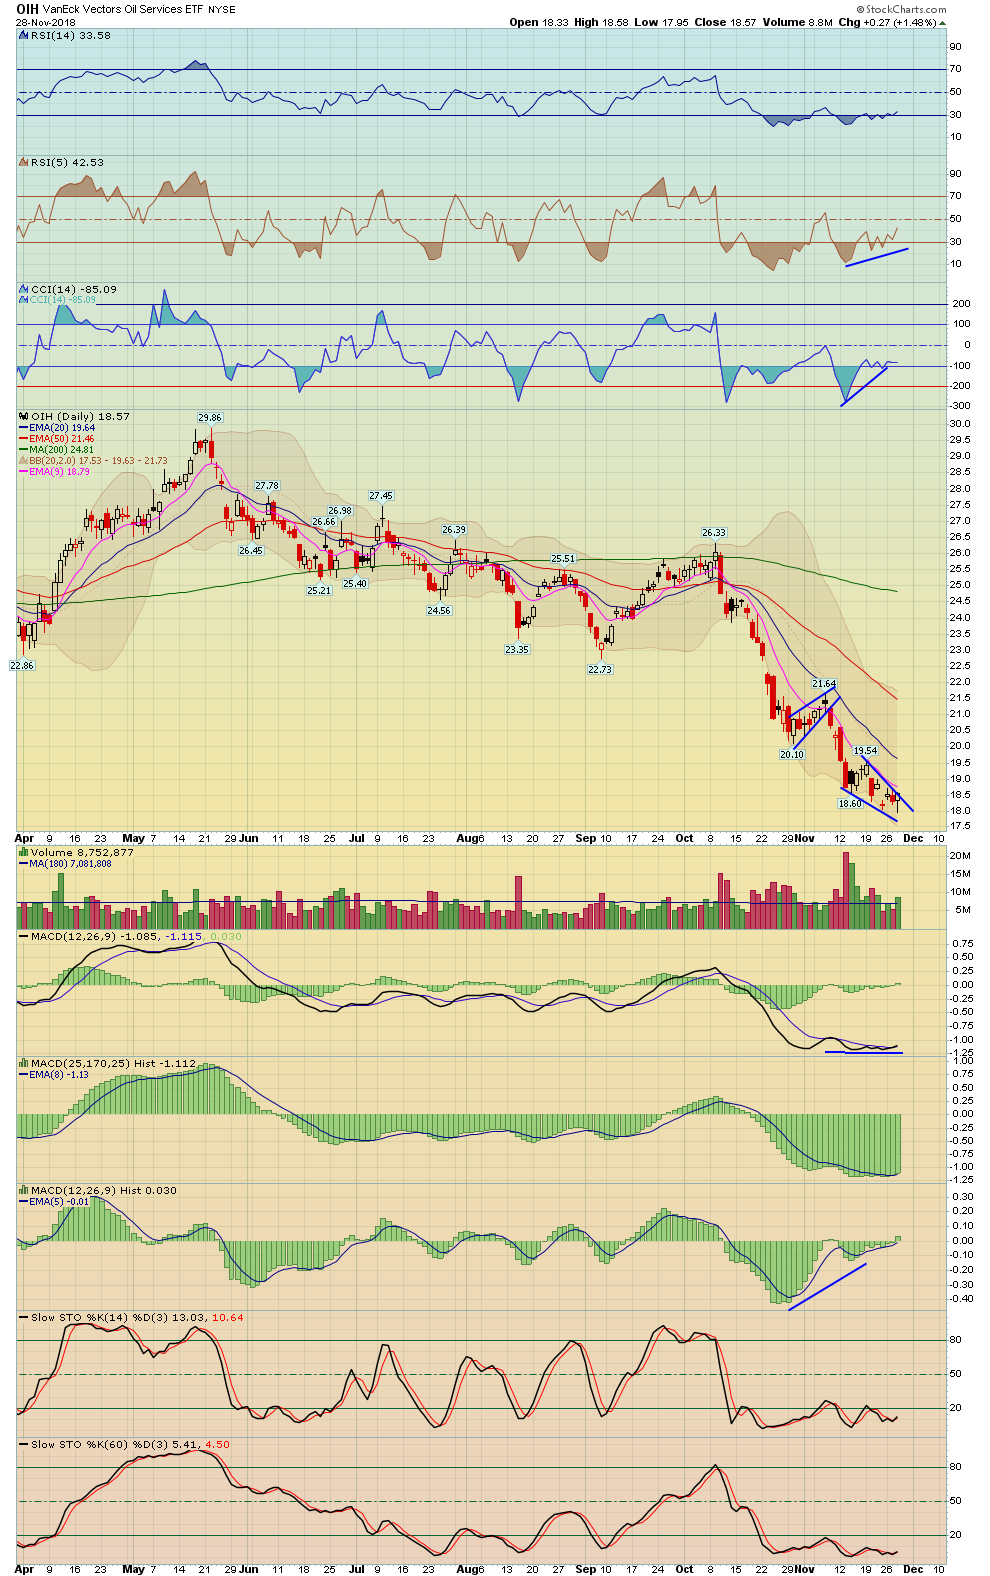
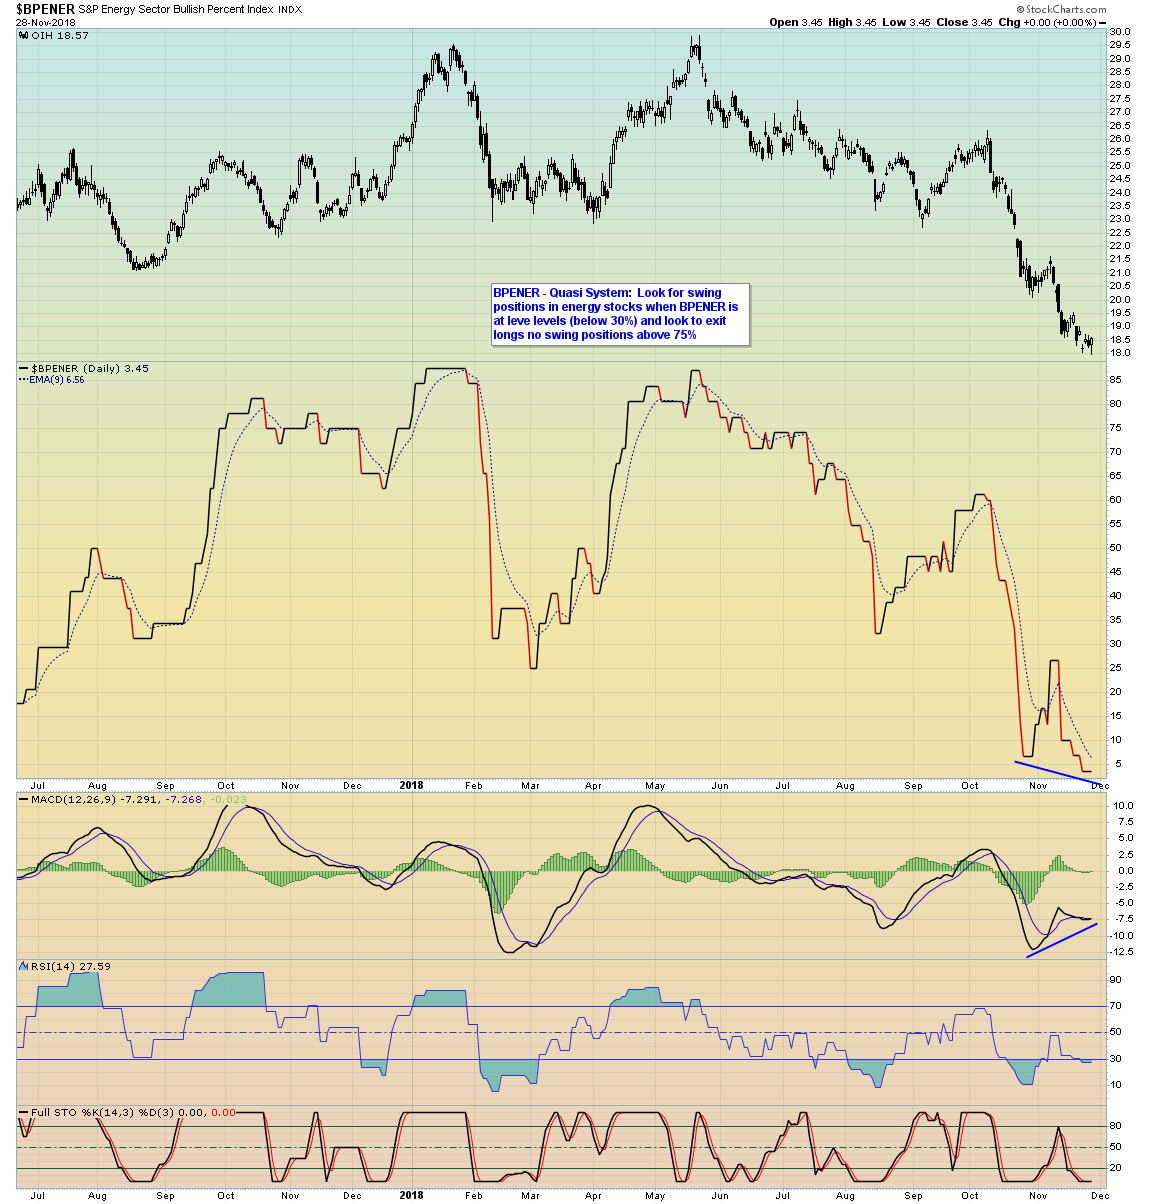
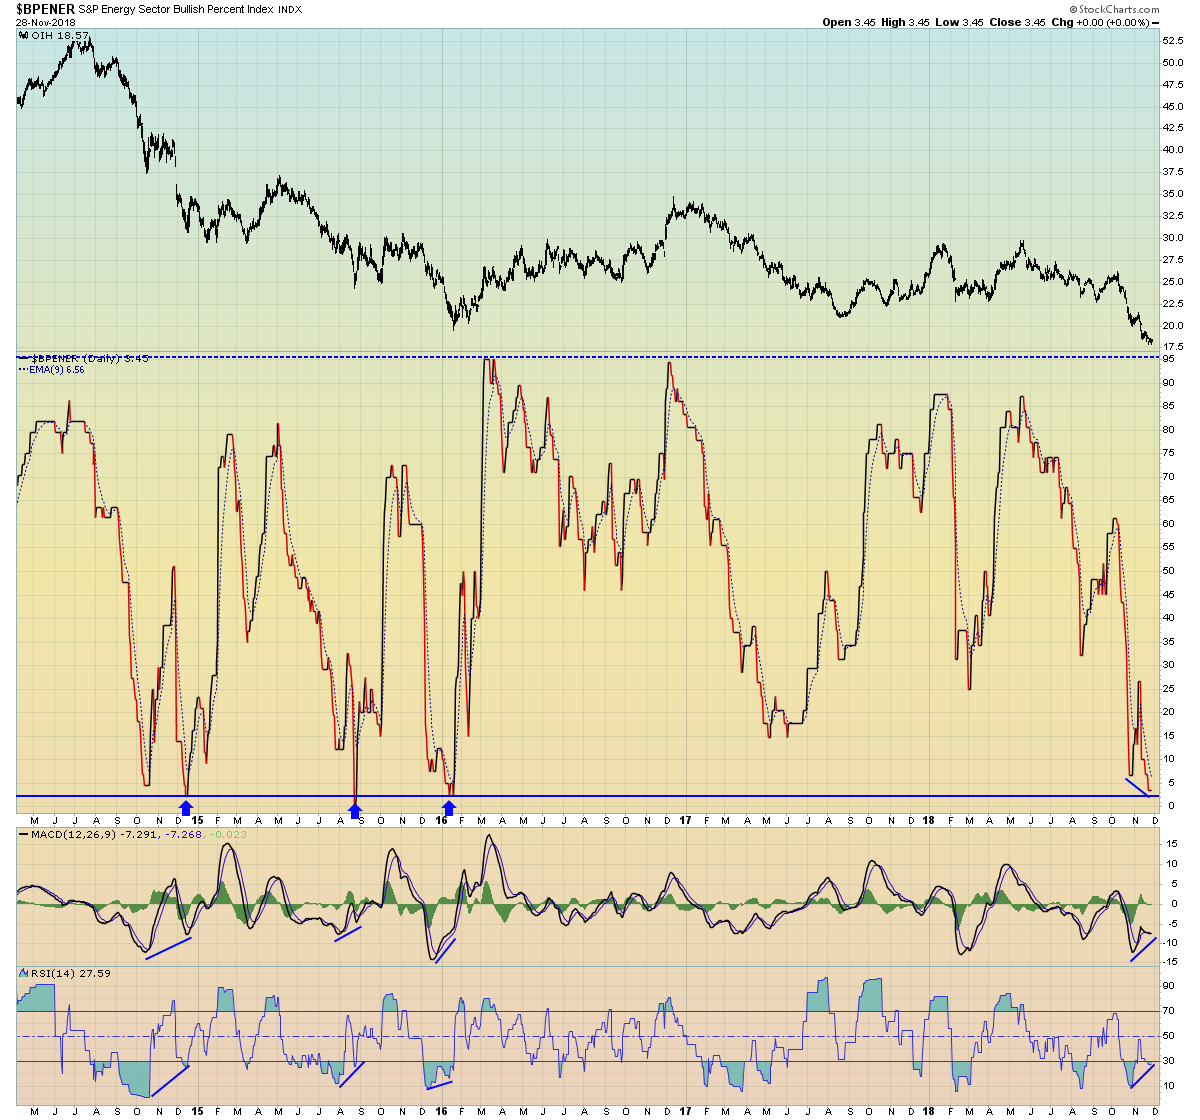
| Oil Service Holders | OIH - W | 1.48% | 2.09% | 18.57 | |
| Technology | XLK - W | 3.50% | 6.05% | 67.96 | |
| Semiconductor | SOX - W | SMH - W | 2.27% | 4.43% | 1,231.45 |
| Communication Services | XLC - W | 2.09% | 4.76% | 44.93 | |
| Retail | XRT - W | 1.64% | 3.88% | 46.62 | |
| Consumer Staples | XLP - W | 0.83% | 1.86% | 55.81 | |
| Consumer Discretionary | XLY - W | 2.95% | 5.58% | 107.71 | |
| Industrials | XLI - W | 2.40% | 2.97% | 71.80 | |
| Real Estate | IYR - W | 0.89% | 1.56% | 80.87 | |
| Homebuilders | HGX - W | XHB - W | 2.32% | 3.46% | 268.10 |
| Materials | XLB - W | 1.54% | 1.44% | 54.08 | |
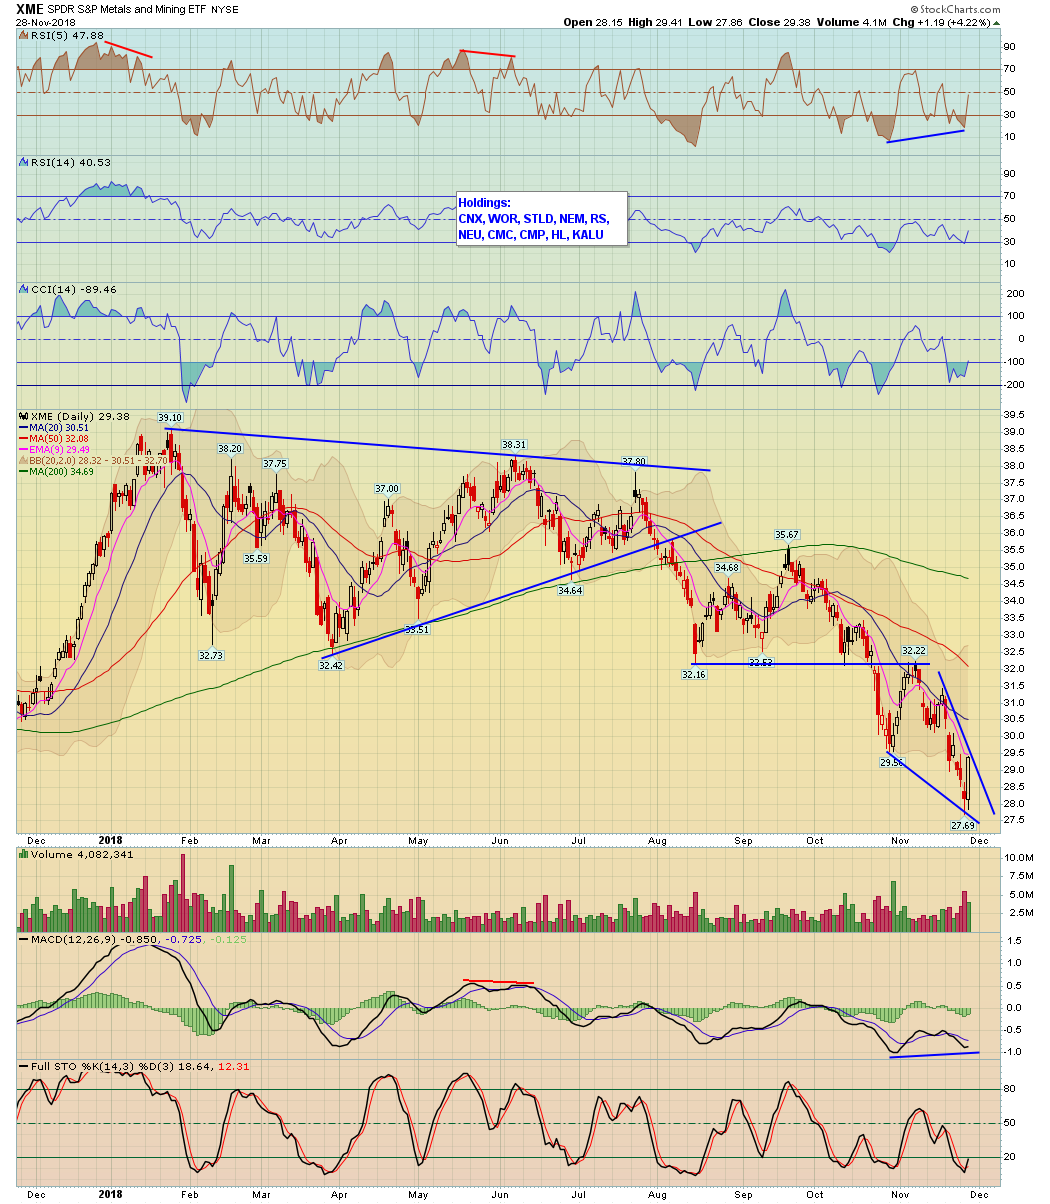
| Metals And Mining | XME - W | 4.22% | 1.24% | 29.38 | |
| GDX Gold Miners ETF | GDX - W | 2.49% | -0.10% | 19.34 | |
| Biotechnology | BTK - W | XBI - W | 3.52% | 4.66% | 4,755.98 |
| Healthcare | XLV - W | 2.41% | 4.47% | 93.65 | |
| Drugs | DRG - W | 1.69% | 2.46% | 598.52 | |
| Utilities | UTIL - W | XLU - W | -0.05% | 1.45% | 730.09 |
| Currencies | Index Symbol | ETF Symbol | % G / L Day | % G / L Week | Close |
|---|---|---|---|---|---|
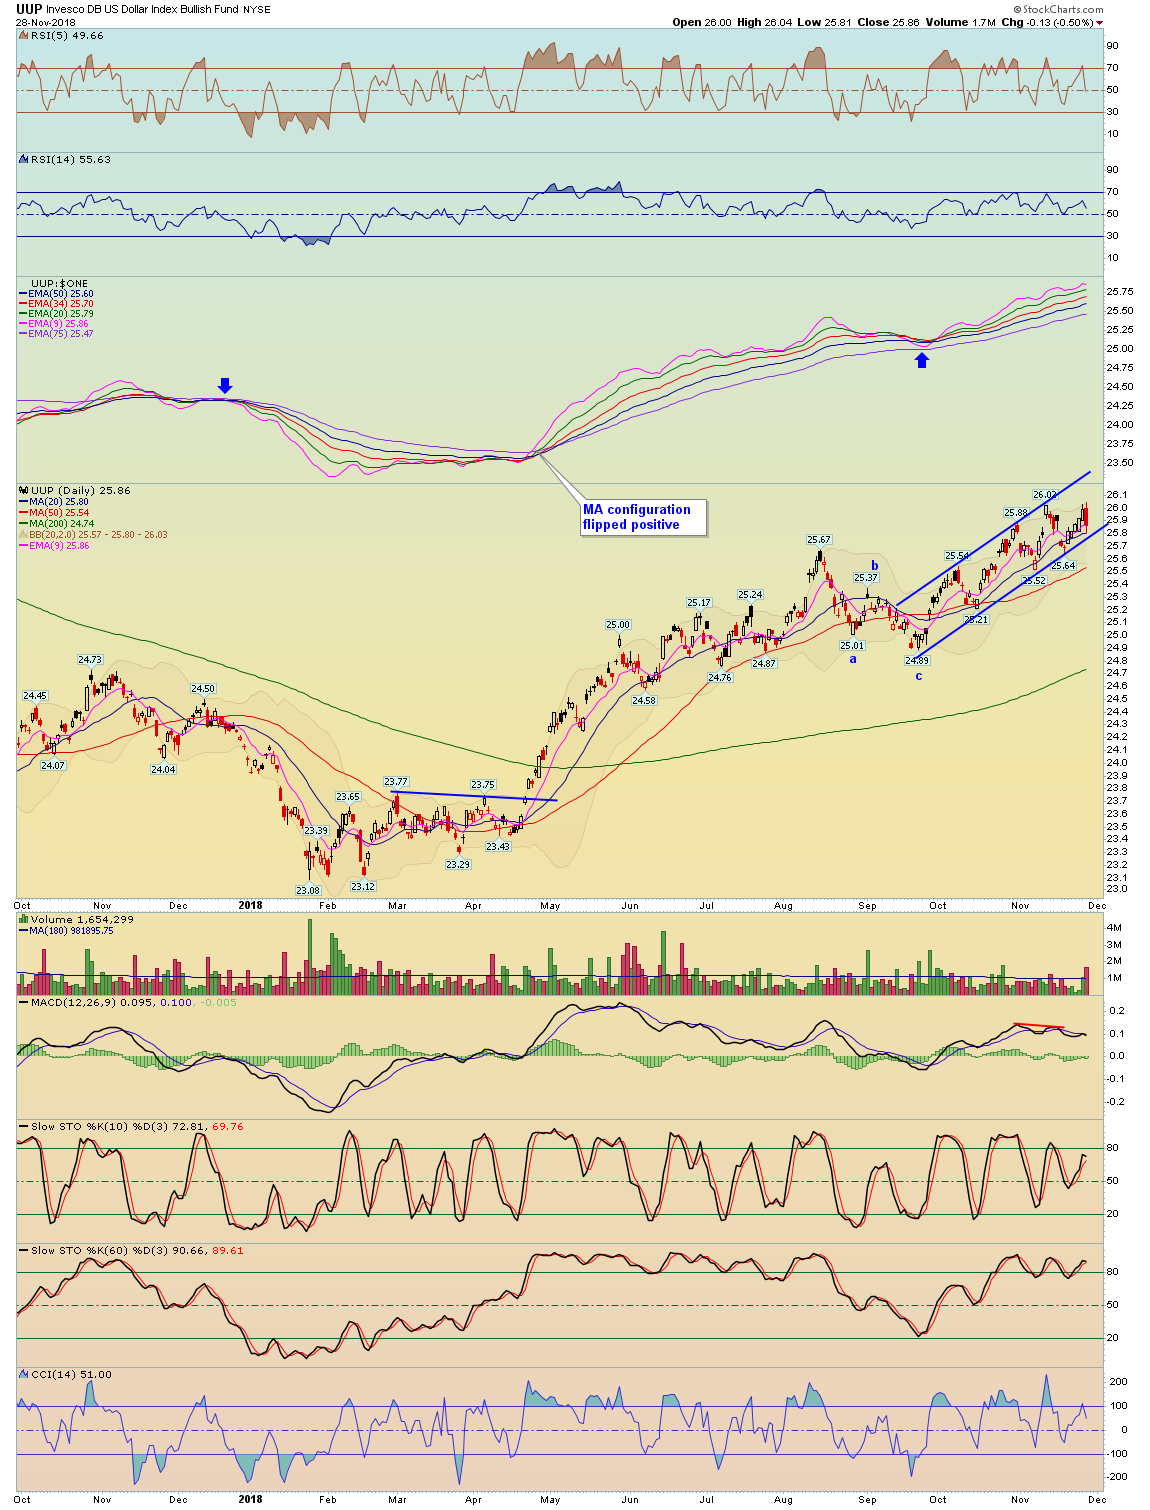
| US Dollar | UUP - W | -0.50% | -0.04% | 25.86 | |
| Euro | XEU - W | FXE - W | 0.68% | 0.34% | 113.70 |
| Yen | XJY - W | FXY - W | 0.09% | -0.72% | 87.98 |
| Australian | XAD - W | FXA - W | 1.07% | 1.05% | 73.06 |
| British Pound | XBP - W | FXB - W | 0.62% | 0.14% | 128.25 |
| Chinese Yuan | CYB - W | 1.53% | -0.36% | 25.26 | |
| Canadian Dollar | CDW - W | FXC - W | 0.17% | -0.38% | 75.33 |
| Swiss Franc | XSF - W | FXF - W | 0.47% | 0.35% | 100.59 |
| Commodities | Index Symbol | ETF Symbol | % G / L Day | % G / L Week | Close |
|---|---|---|---|---|---|
| Commodities | DBC - W | -0.33% | -0.26% | 15.26 | |
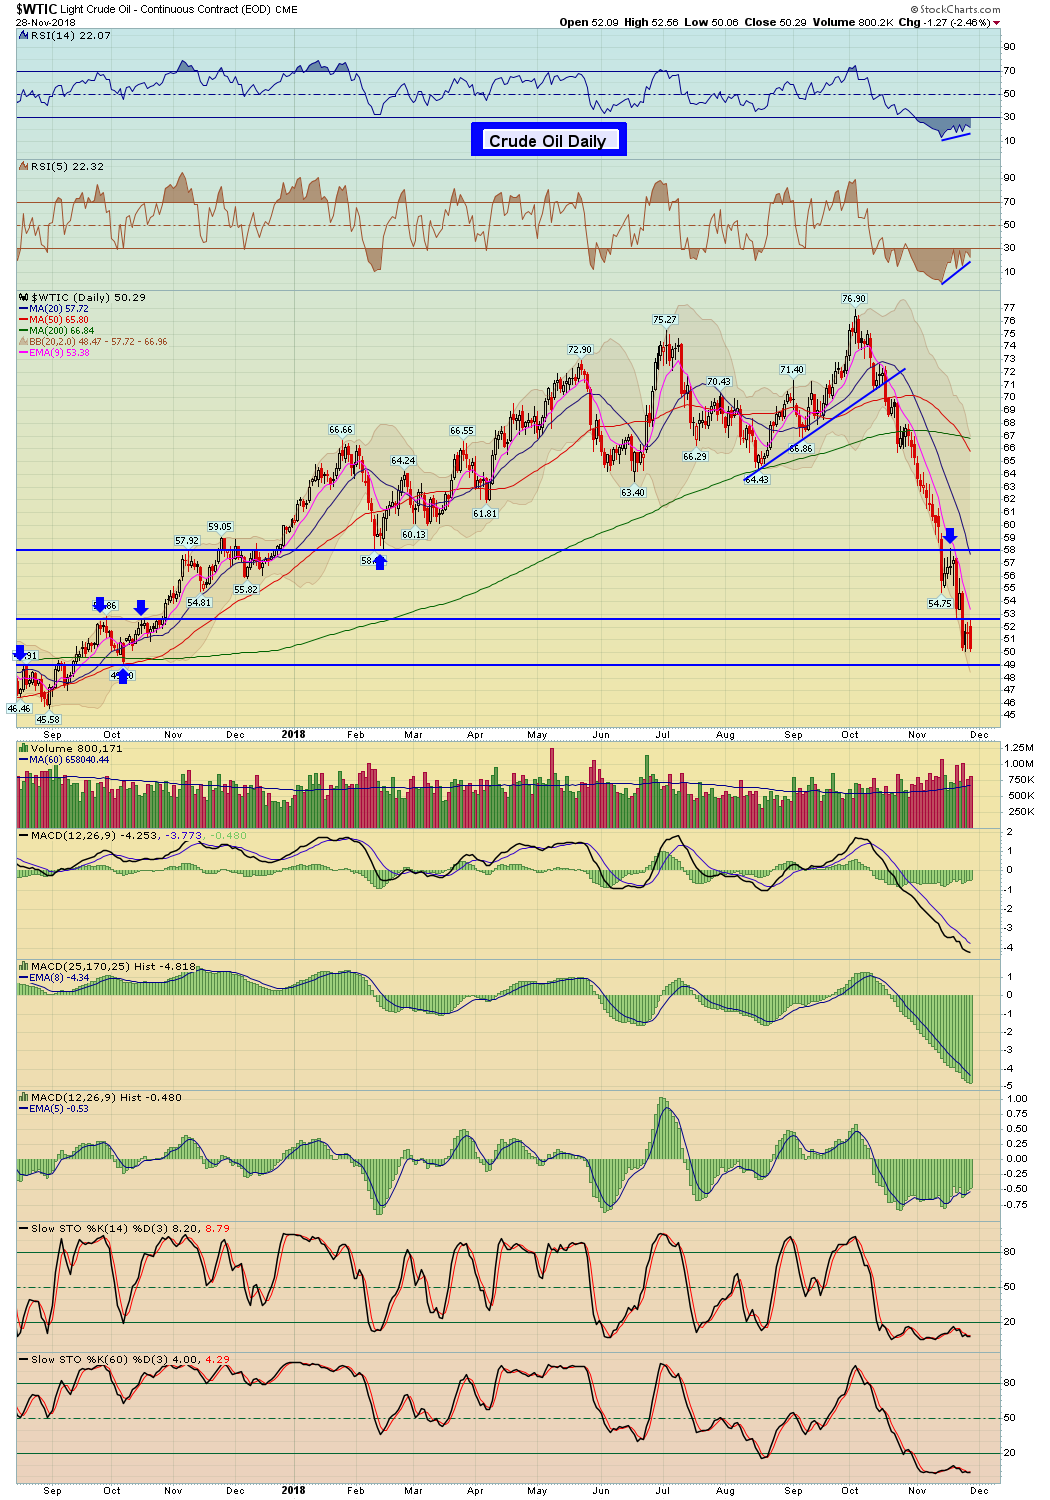
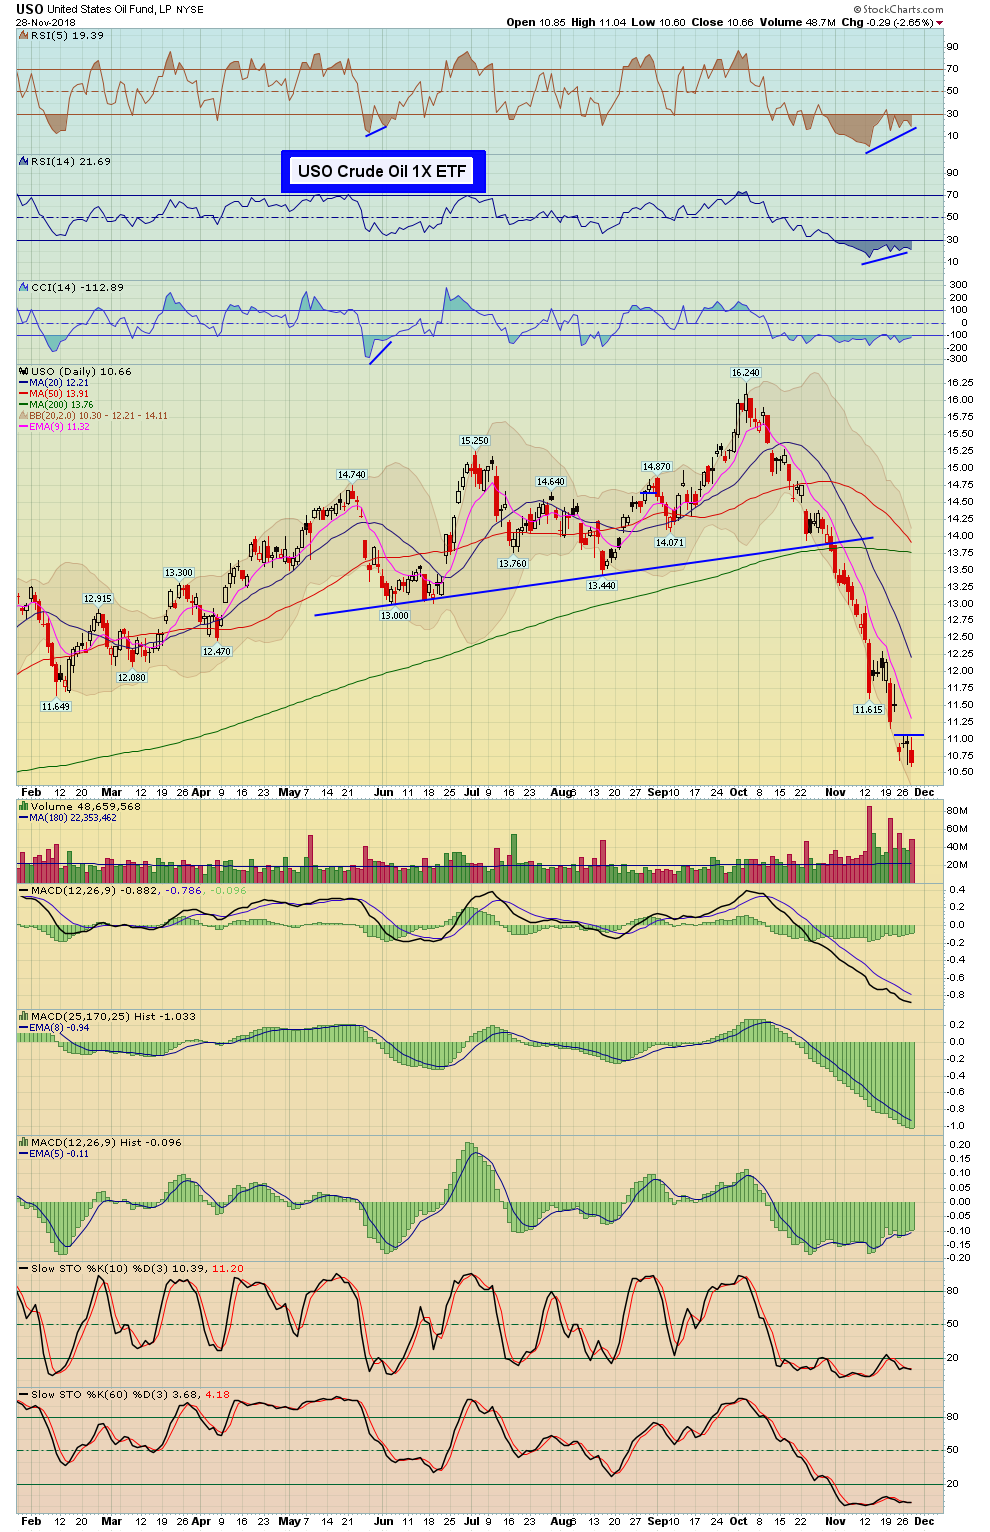
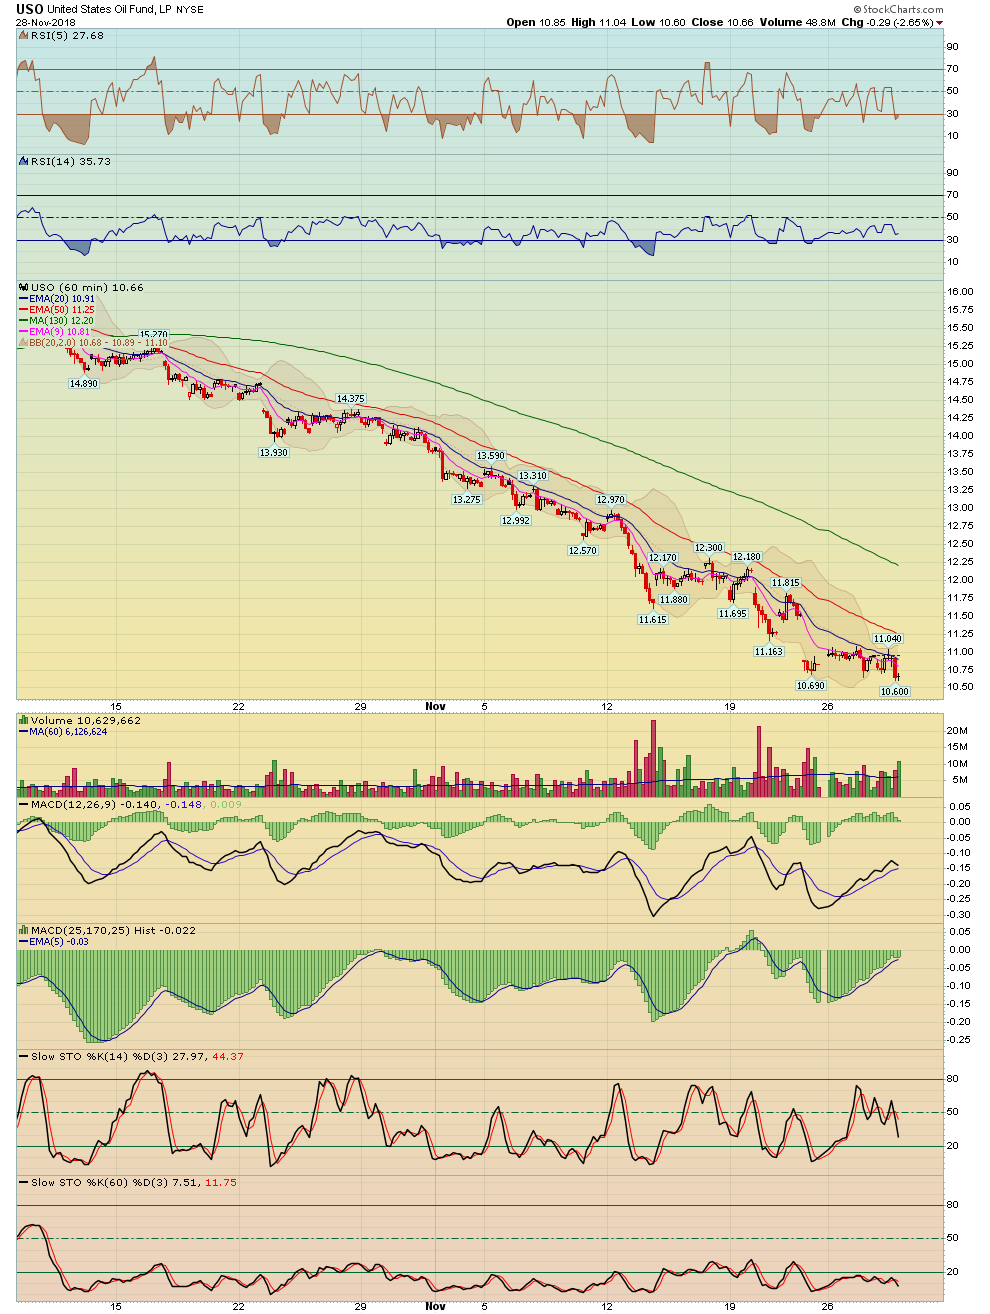
| Crude Oil | WTIC - W | USO - W | -2.46% | -0.26% | 50.29 |
| Gasoline | GASO - W | -1.82% | 0.17% | 1.38 | |
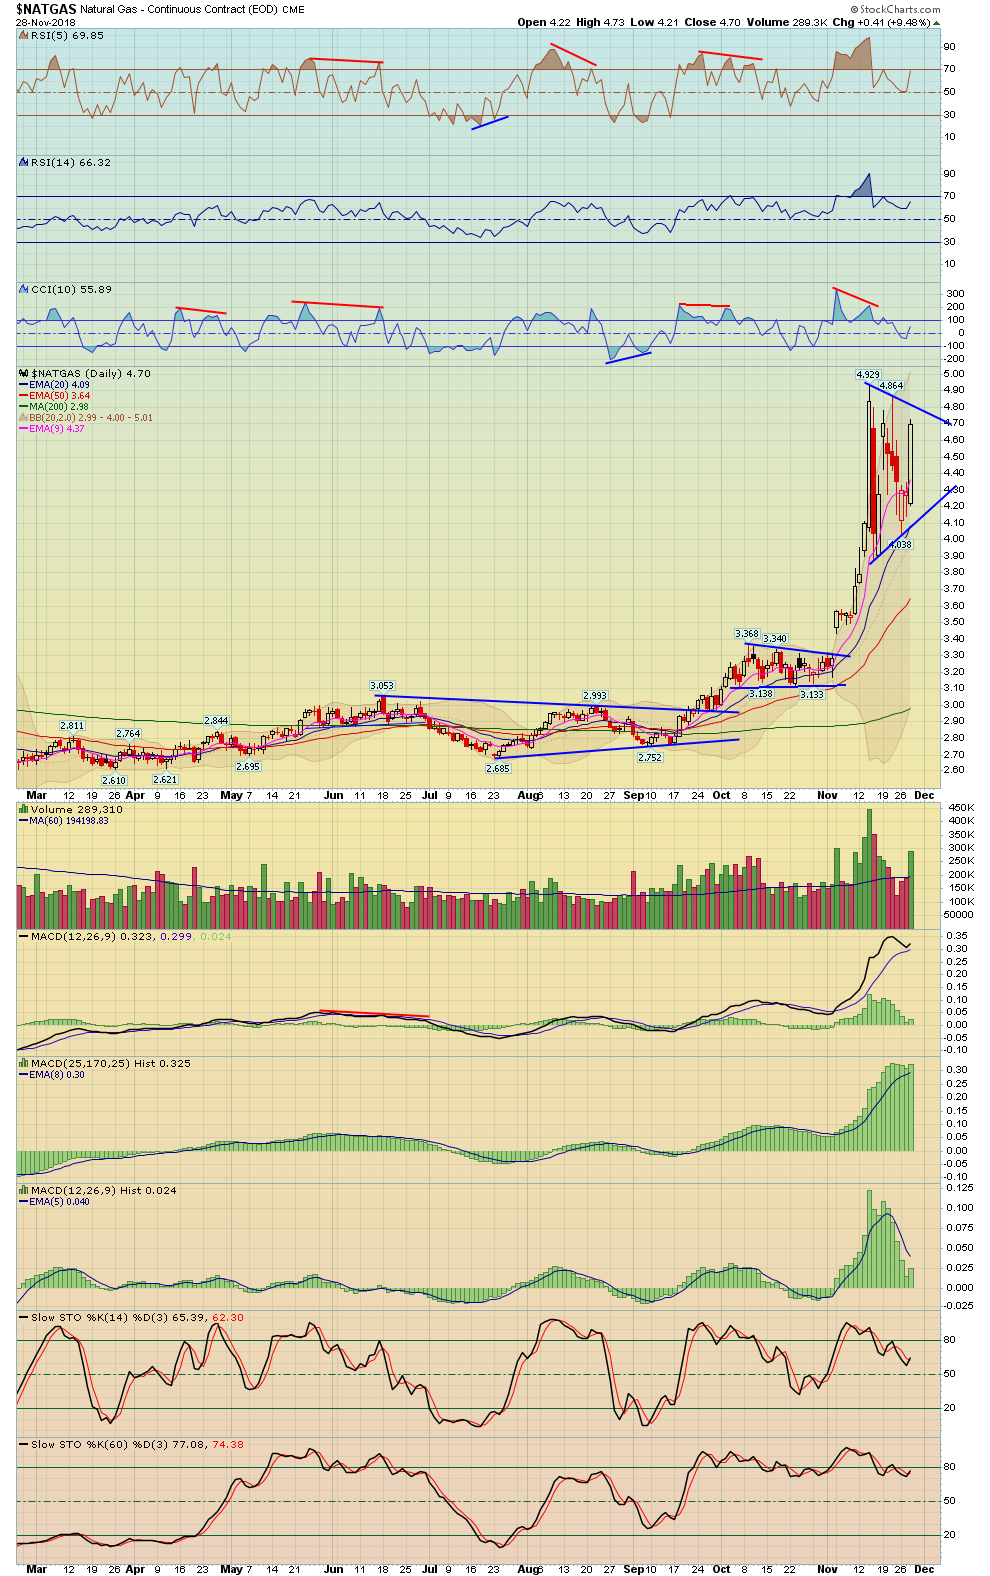
| Natural Gas | NATGAS - W | UNG - W | 9.48% | 7.90% | 4.70 |
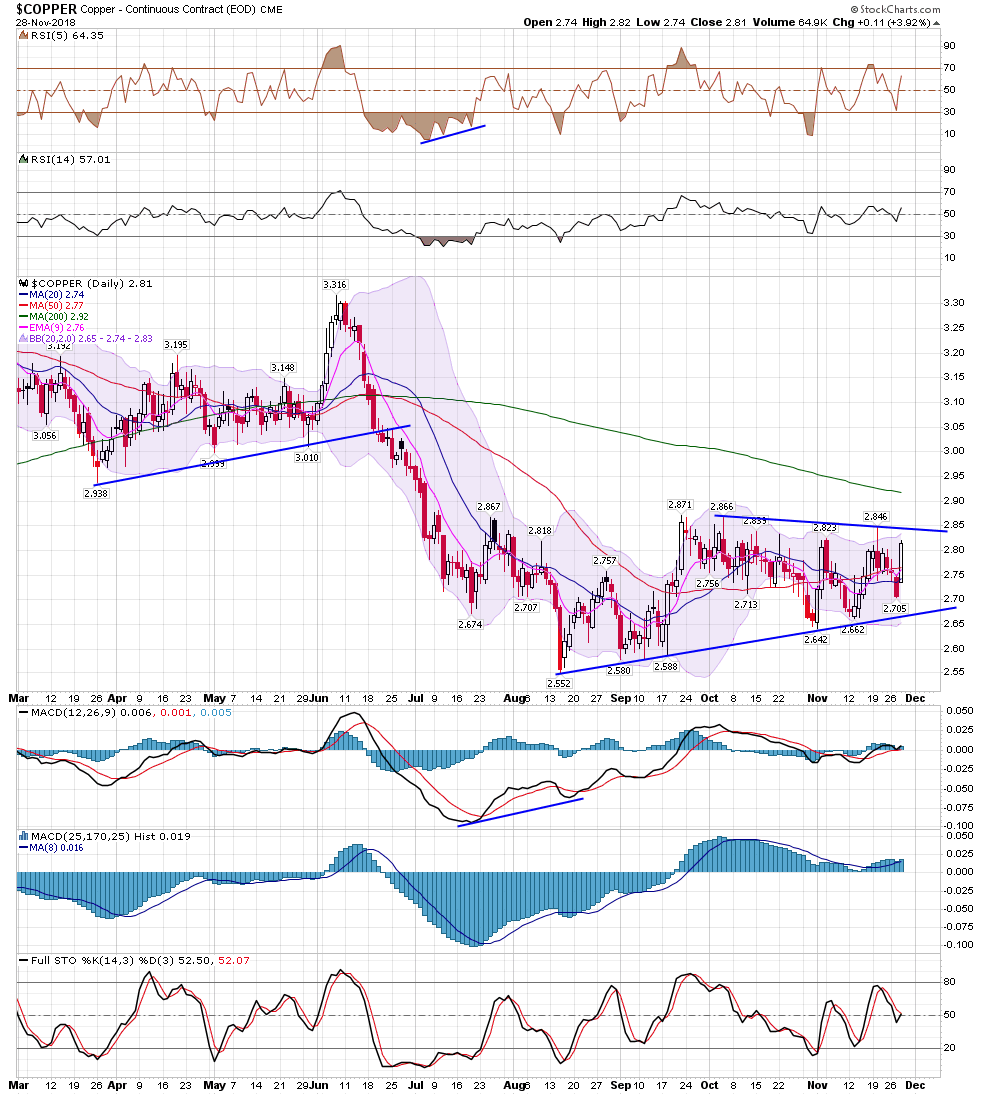
| Copper | COPPER - W | JJCB - W | 3.92% | 1.70% | 2.81 |
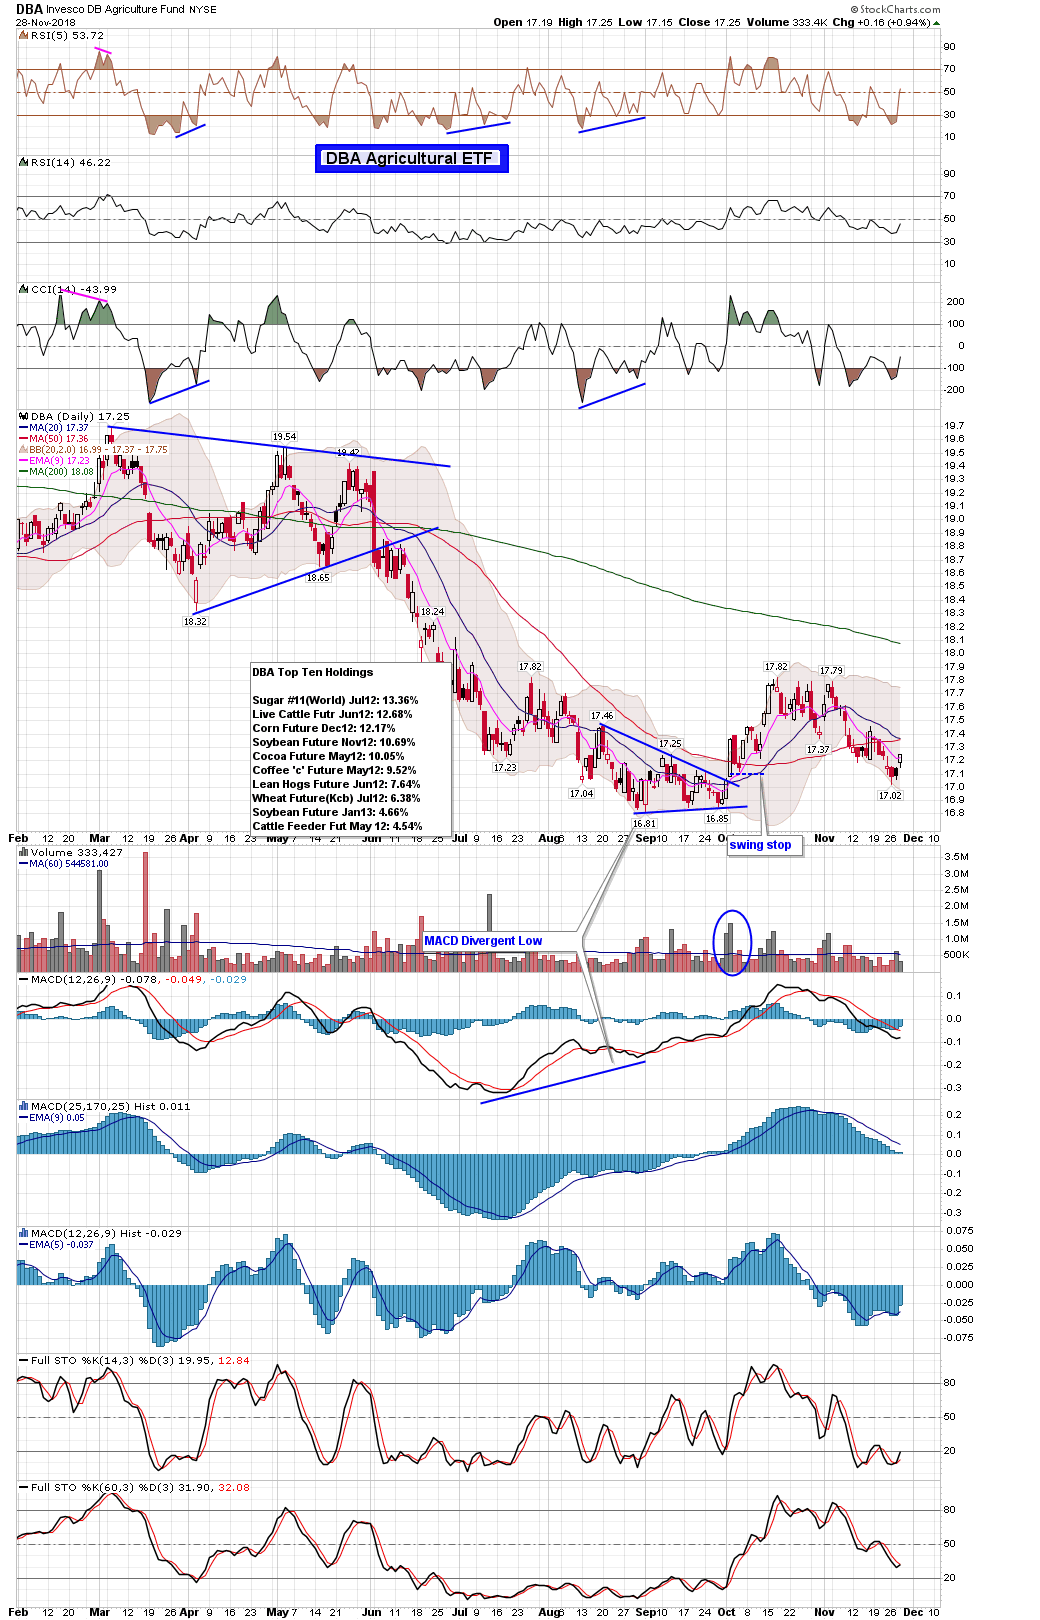
| Agriculture | DBA - W | 0.94% | 0.52% | 17.25 | |
| Corn | CORN - W | CORN - W | 1.29% | 3.97% | 373.25 |
| Wheat | WHEAT - W | WEAT - W | 0.99% | 0.84% | 511.50 |
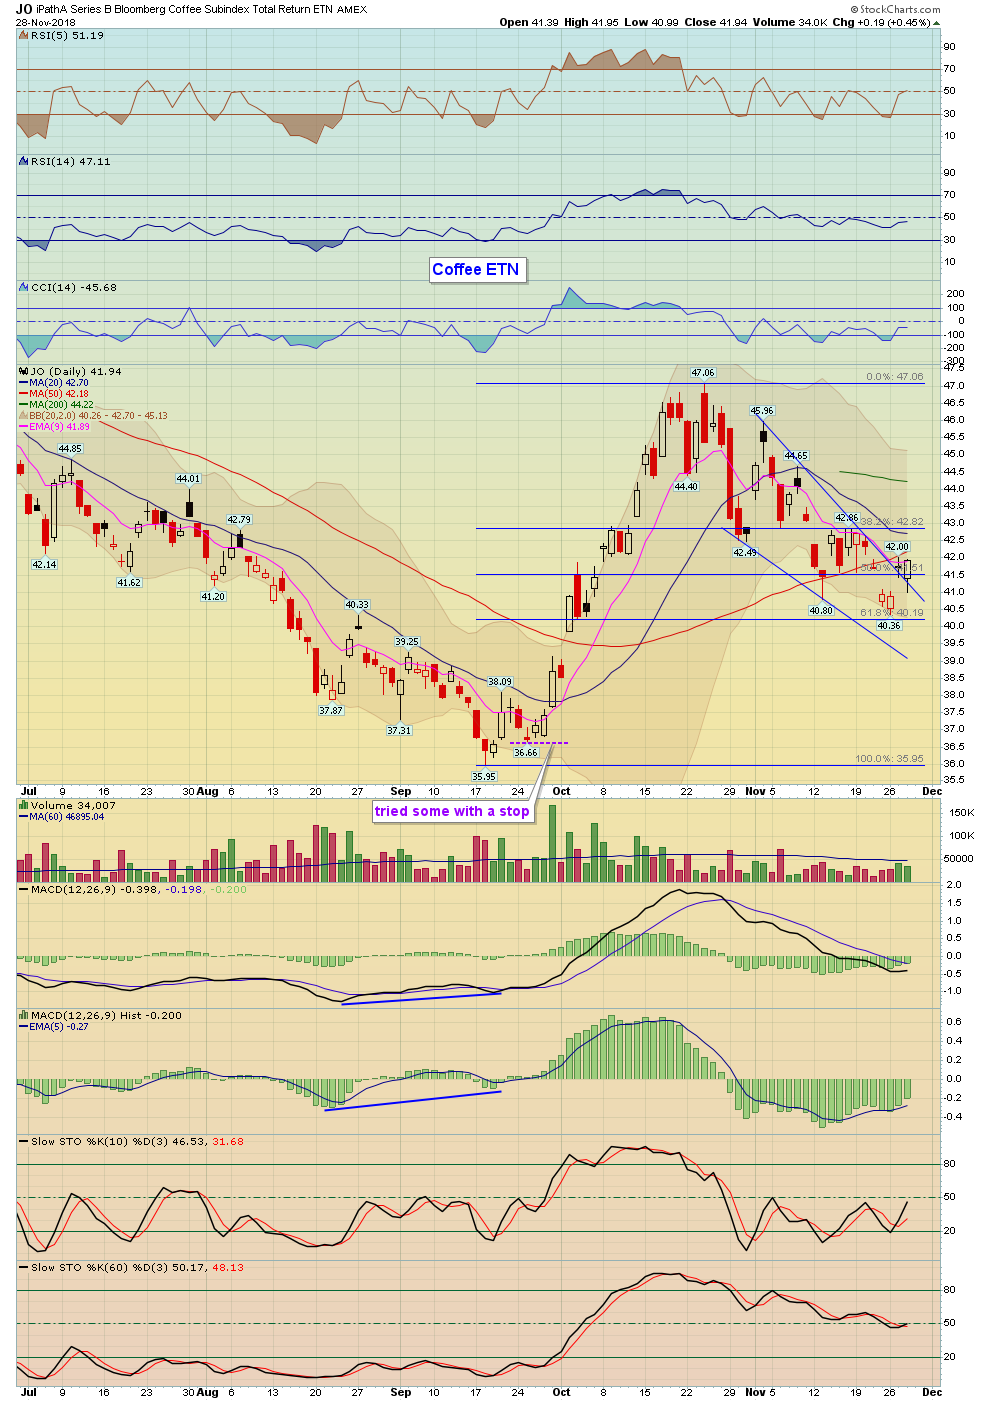
| Coffee | BJO - W | -2.04% | -3.06% | 41.78 | |
| Sugar | CANE - W | 3.03% | 2.61% | 7.48 |
| Precious Metals | Index Symbol | ETF Symbol | % G / L Day | % G / L Week | Close |
|---|---|---|---|---|---|
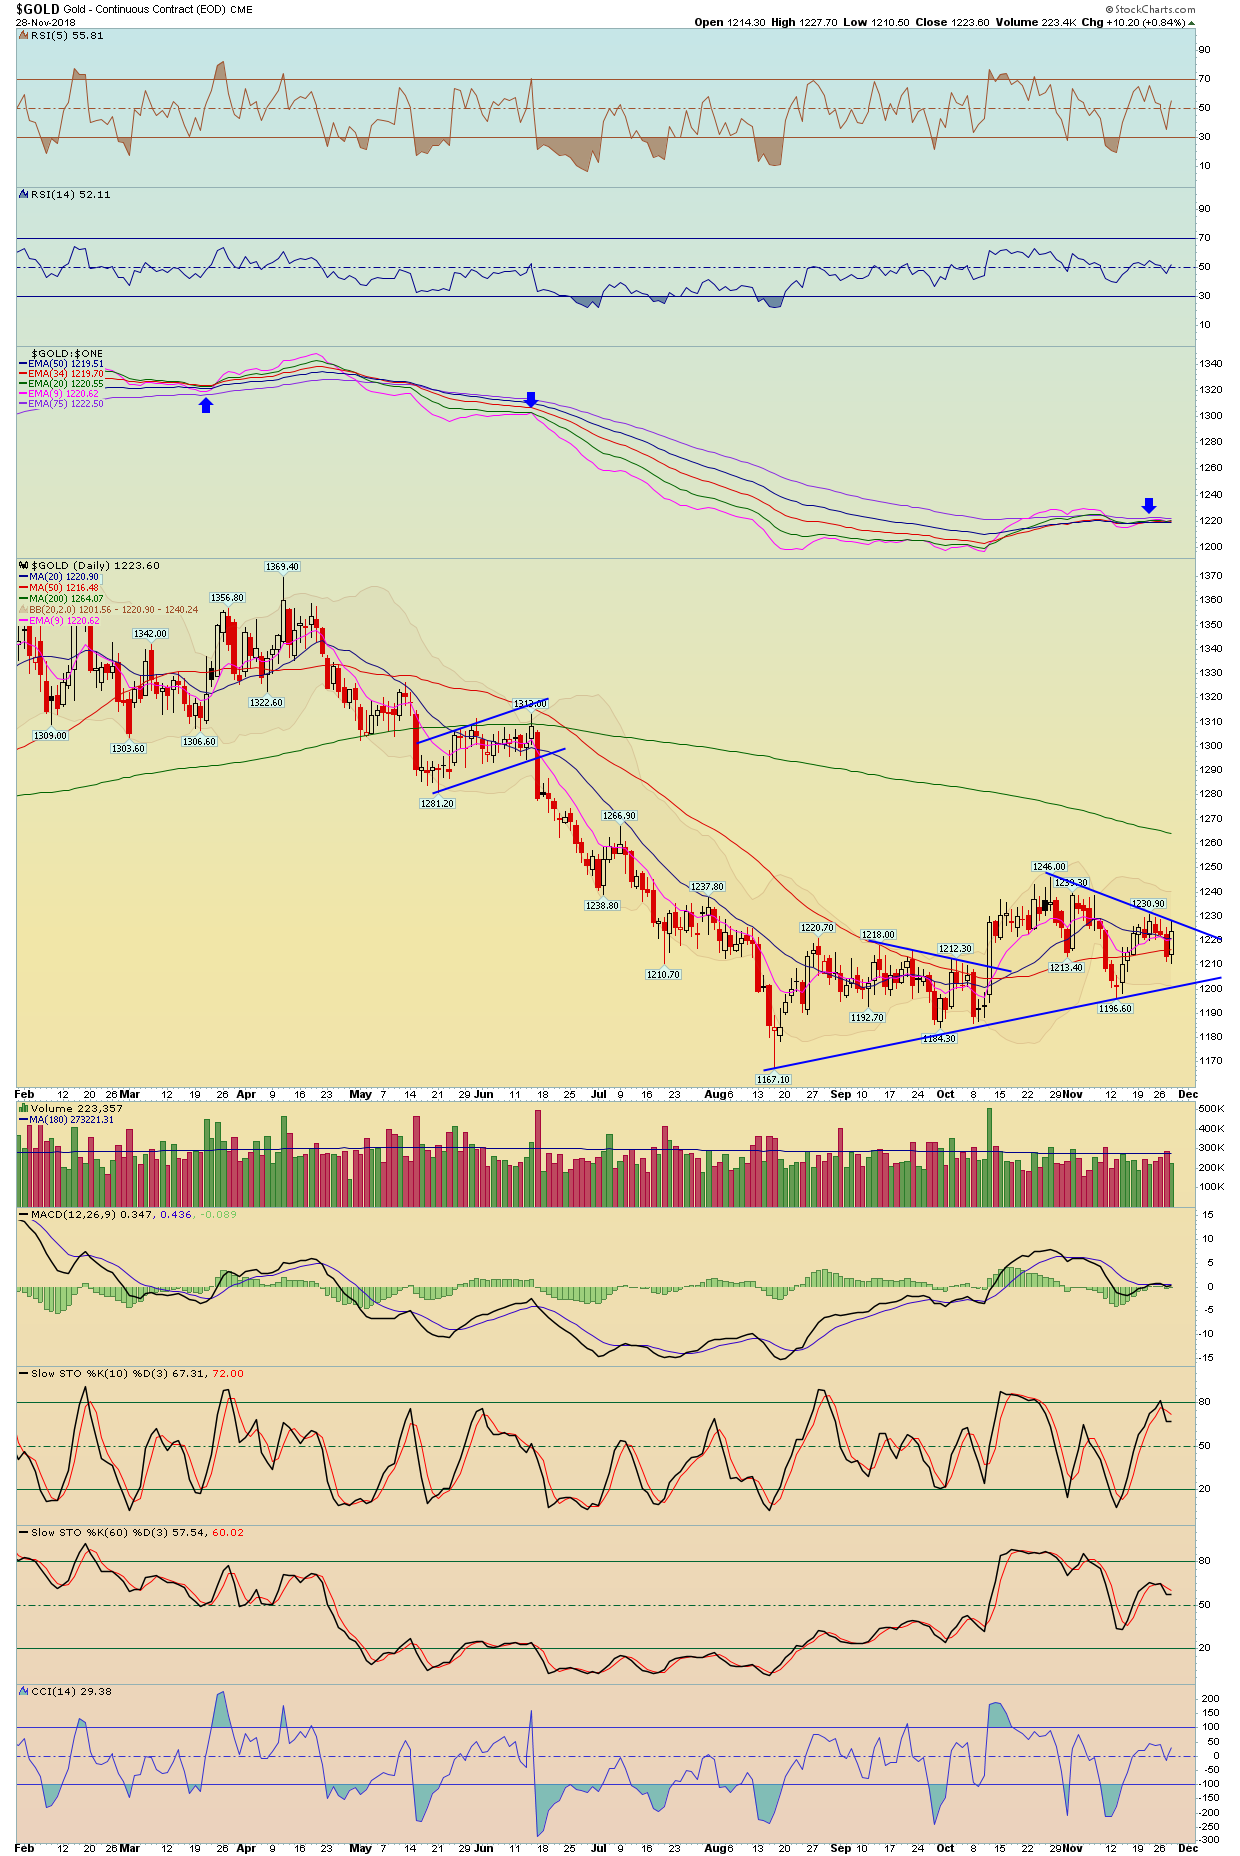
| Gold Metal | GLD - W | 0.37% | -0.34% | 115.38 | |
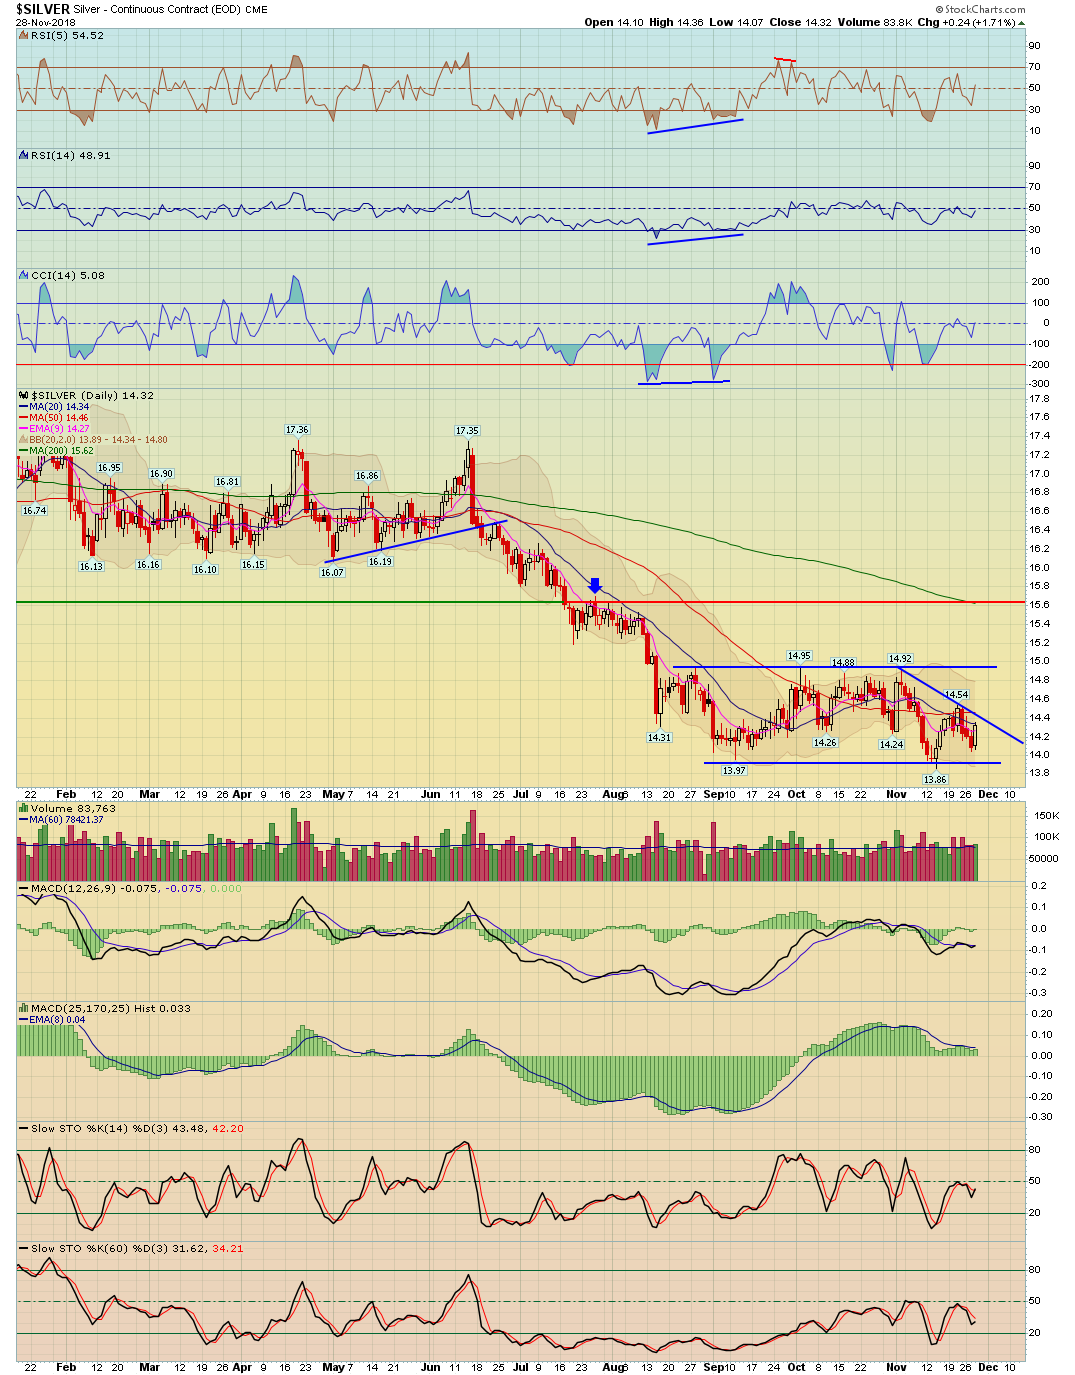
| Silver | SLV - W | 1.05% | 0.07% | 13.43 | |
| Platinum | PPLT - W | -1.09% | -1.71% | 78.14 | |
| Palladium | PALL - W | 2.23% | 5.42% | 112.35 | |
| GDX Gold Miners ETF | GDX - W | 2.49% | -0.10% | 19.34 |
| Bonds | Index Symbol | ETF Symbol | % G / L Day | % G / L Week | Close |
|---|---|---|---|---|---|
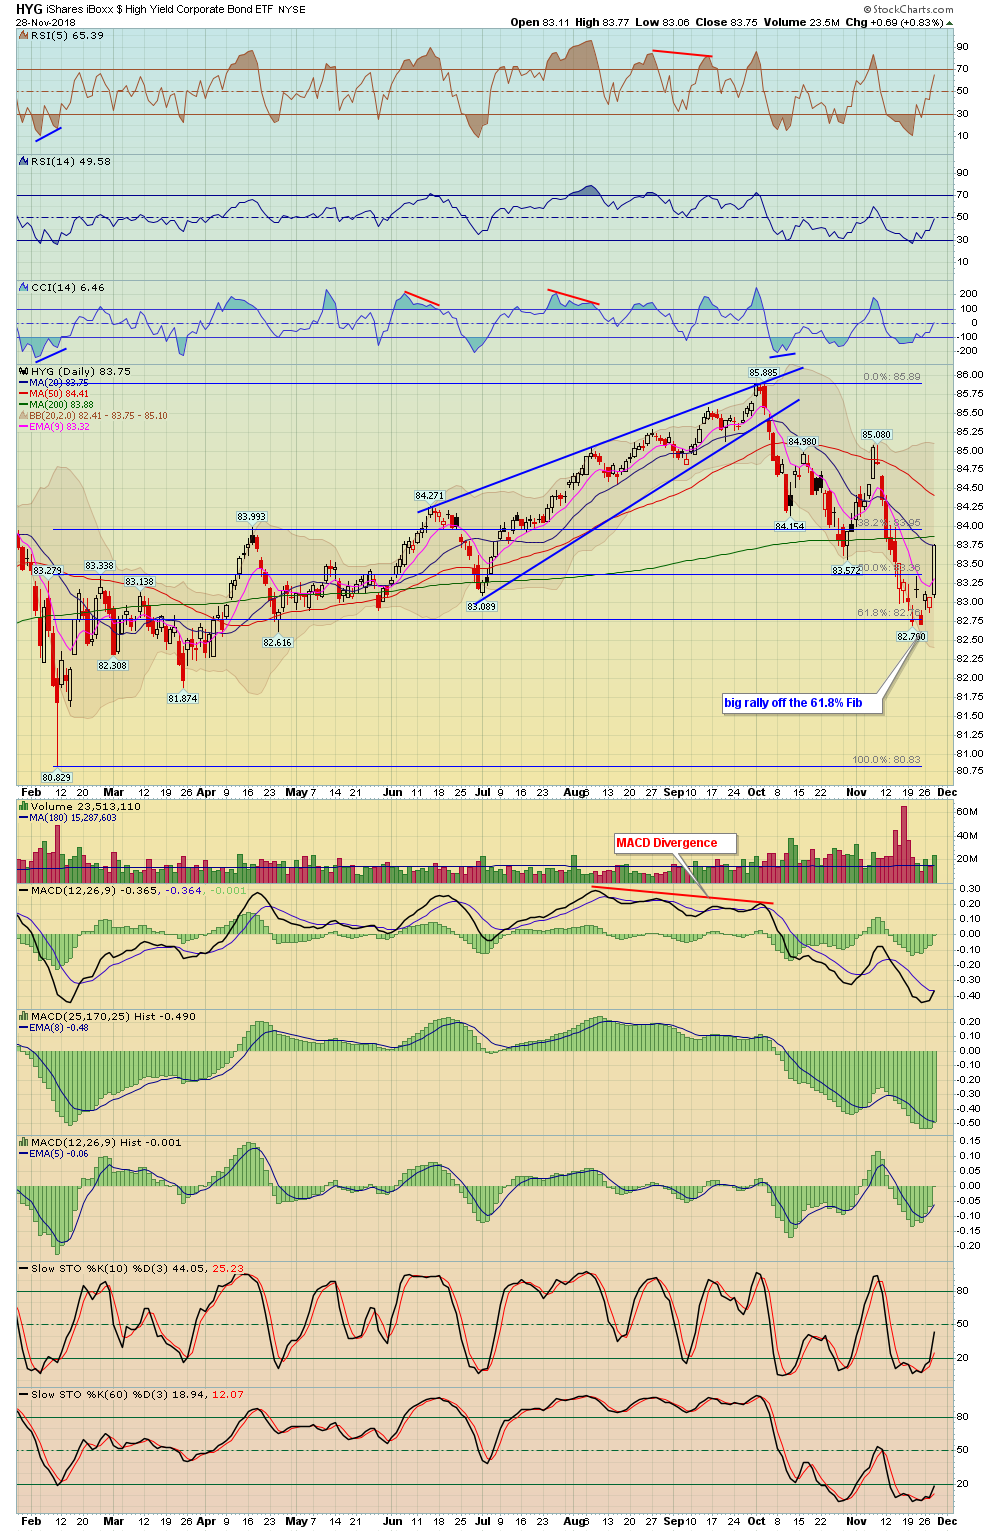
| High Yield Corporate Bond | HYG - W | 0.83% | 1.26% | 83.75 | |
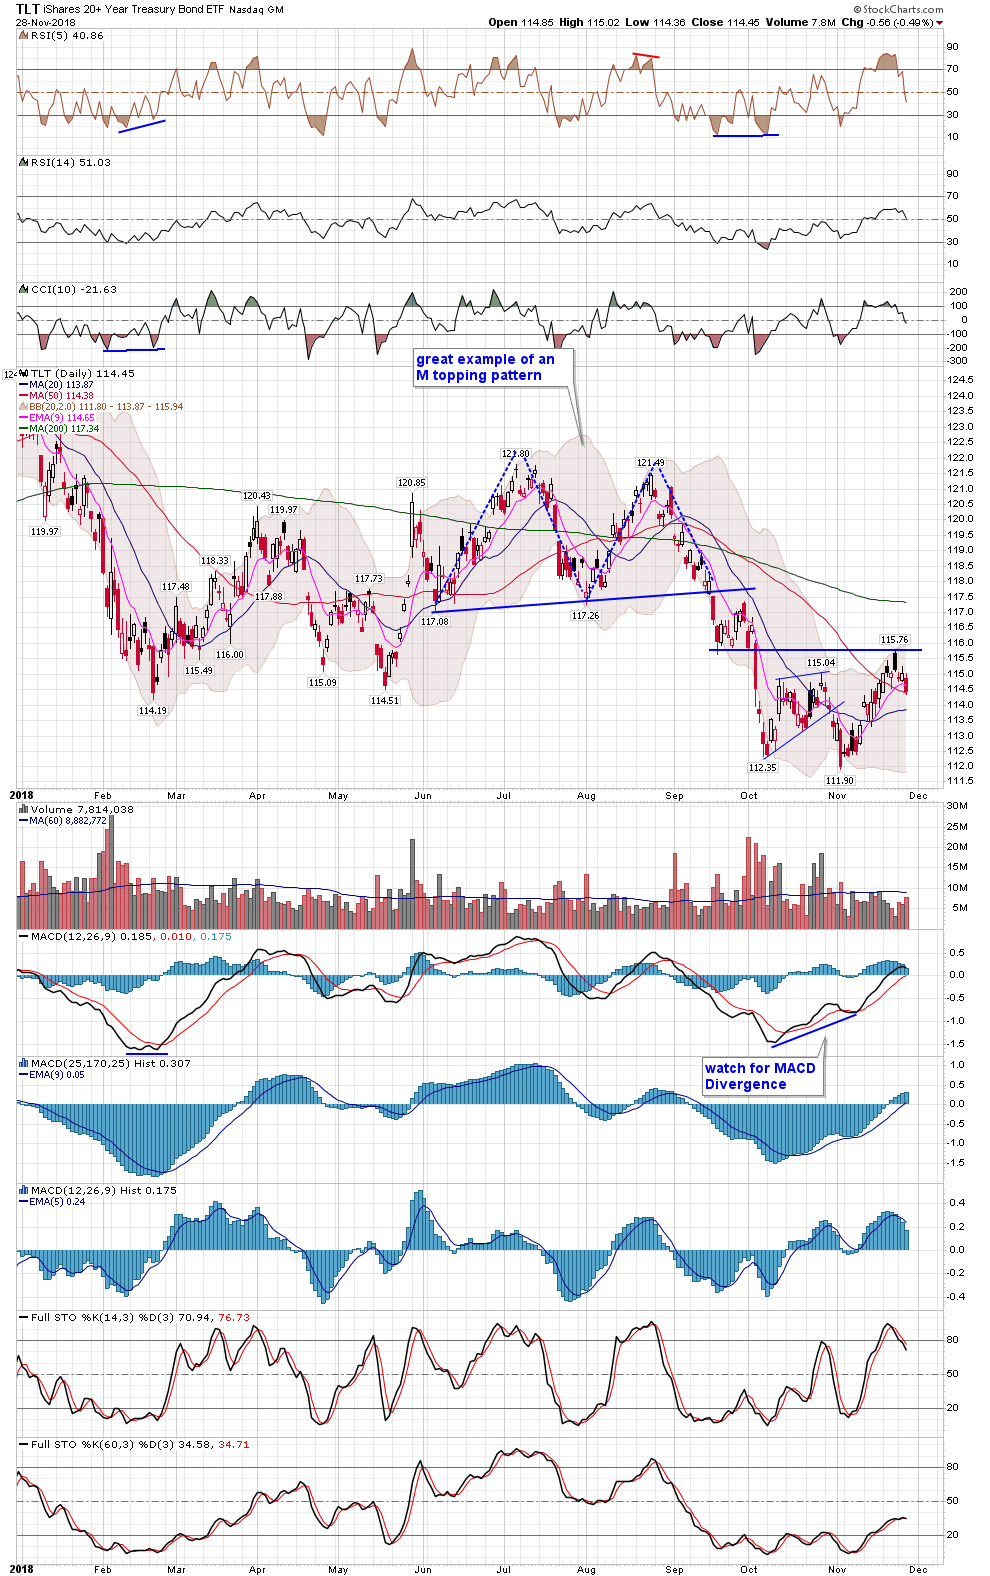
| TLT 20 Year Bond ETF | TLT - W | -0.49% | -0.60% | 114.45 | |
| 10 Year Treasury Yield | TNX - W | -0.36% | -0.33% | 30.44 | |
| 30 Year Treasury Yield | TYX - W | 0.30% | 0.57% | 33.29 |
9
| Date | ET | Release | For | Actual | Briefing.com Forecast | Briefing.com Consensus | Prior | Revised From |
|---|---|---|---|---|---|---|---|---|
| Nov 27 | 09:00 | Case-Shiller 20-city Index | Sep | 5.1% | 5.2% | 5.3% | 5.5% | -- |
| Nov 27 | 09:00 | FHFA Housing Price Index | Sep | 0.2% | NA | NA | 0.4% | 0.3% |
| Nov 27 | 10:00 | Consumer Confidence | Nov | 135.7 | 135.7 | 135.5 | 137.9 | |
| Nov 28 | 07:00 | MBA Mortgage Applications Index | 11/24 | 5.5% | NA | NA | -0.1% | |
| Nov 28 | 08:30 | GDP - Second Estimate | Q3 | 3.5% | 3.6% | 3.6% | 3.5% | |
| Nov 28 | 08:30 | GDP Deflator - Second Estimate | Q3 | 1.7% | 1.4% | 1.4% | 1.7% | |
| Nov 28 | 08:30 | Adv. International Trade in Goods | Oct | -$77.2B | NA | NA | -$76.3B | -$76.0B |
| Nov 28 | 08:30 | Adv. Retail Inventories | Oct | 0.9% | NA | NA | 0.1% | |
| Nov 28 | 08:30 | Adv. Wholesale Inventories | Oct | 0.7% | NA | NA | 0.6% | 0.3% |
| Nov 28 | 10:00 | New Home Sales | Oct | 544K | 555K | 575K | 597K | 553K |
| Nov 28 | 10:30 | Crude Inventories | 11/24 | +3.6M | NA | NA | +4.9M | |
| Nov 29 | 08:30 | Personal Income | Oct | 0.3% | 0.4% | 0.2% | ||
| Nov 29 | 08:30 | Personal Spending | Oct | 0.4% | 0.4% | 0.4% | ||
| Nov 29 | 08:30 | PCE Prices | Oct | NA | NA | 0.1% | ||
| Nov 29 | 08:30 | PCE Prices - Core | Oct | 0.2% | 0.2% | 0.2% | ||
| Nov 29 | 08:30 | Initial Claims | 11/24 | 220K | 218K | 224K | ||
| Nov 29 | 08:30 | Continuing Claims | 11/17 | NA | NA | 1668K | ||
| Nov 29 | 10:00 | Pending Home Sales | Oct | 0.3% | 0.7% | 0.5% | ||
| Nov 29 | 10:30 | Natural Gas Inventories | 11/24 | NA | NA | -134 bcf | ||
| Nov 29 | 14:00 | FOMC Minutes | Nov | NA | NA | NA | ||
| Nov 30 | 09:45 | Chicago PMI | Nov | 57.5 | 58.0 | 58.4 |

Stock Earnings Calender:
Click here for a list of Stocks that are reporting Earnings
**Generally we never hold a position into earnings since the risk/reward is too great
10 - View Live Chart
11 - View Live Chart
12 - View Live Chart
13 - View Live Chart
14 - View Live Chart
15
16 - View Live Chart
17 - View Live Chart
18 - View Live Chart
19 - View Live Chart
20 - View Live Chart
21 - View Live Chart
22 - View Live Chart
23 - View Live Chart
24 - View Live Chart
25 - View Live Chart
26 - View Live Chart
27 - View Live Chart
28 - View Live Chart
29 - View Live Chart
30 - View Live Chart
31 - View Live Chart
32 - View Live Chart
33 - View Live Chart
34 - View Live Chart
35 - View Live Chart
36 - View Live Chart
37 - View Live Chart
38 - View Live Chart
39 - View Live Chart
40 - View Live Chart
41 - View Live Chart
42 - View Live Chart
43 - View Live Chart
44 - View Live Chart
45 - View Live Chart
46 - View Live Chart
47 - View Live Chart
48 - View Live Chart
49 - View Live Chart
50 - View Live Chart
51 - View Live Chart
52 - View Live Chart
53 - View Live Chart
54 - View Live Chart
55 - View Live Chart
56 - View Live Chart
57 - View Live Chart
58 - View Live Chart
59 - View Live Chart
60 - View Live Chart
61 - View Live Chart
62 - View Live Chart
63 - View Live Chart
64 - View Live Chart
65 - View Live Chart
66 - View Live Chart
67 - View Live Chart
68 - View Live Chart
69 - View Live Chart
70 - View Live Chart
71 - View Live Chart
72 - View Live Chart
73 - View Live Chart
74 - View Live Chart
75 - View Live Chart
76 - View Live Chart
- Hide Player Link to Newsletter Audio
- Hide Player Link to Newsletter Audio