Sunday August 12th, 2018 Newsletter - free
Disclaimer: Intraday Chart Links will show up as daily charts unless you have an active stockcharts.com membership and are signed in, you can sign up here.
1
Table Of Contents:
1. Opening Dialogue, Market Comments
2. General Market Analysis: Major Indexes (SPX, Dow, Nasdaq, Russell 2000)
3. Market Indicators, Bonds/Rates, Yield Curve
4. Market Sector Breakdown
5. World Markets
6. US Dollar, Commodities and Precious Metals
2
| Major Indexes | Index Symbol | ETF Symbol | % G / L Day | % G / L Week | Close |
|---|---|---|---|---|---|
| Dow Jones | INDU - W | DIA - W | -0.77% | -0.59% | 25,313.14 |
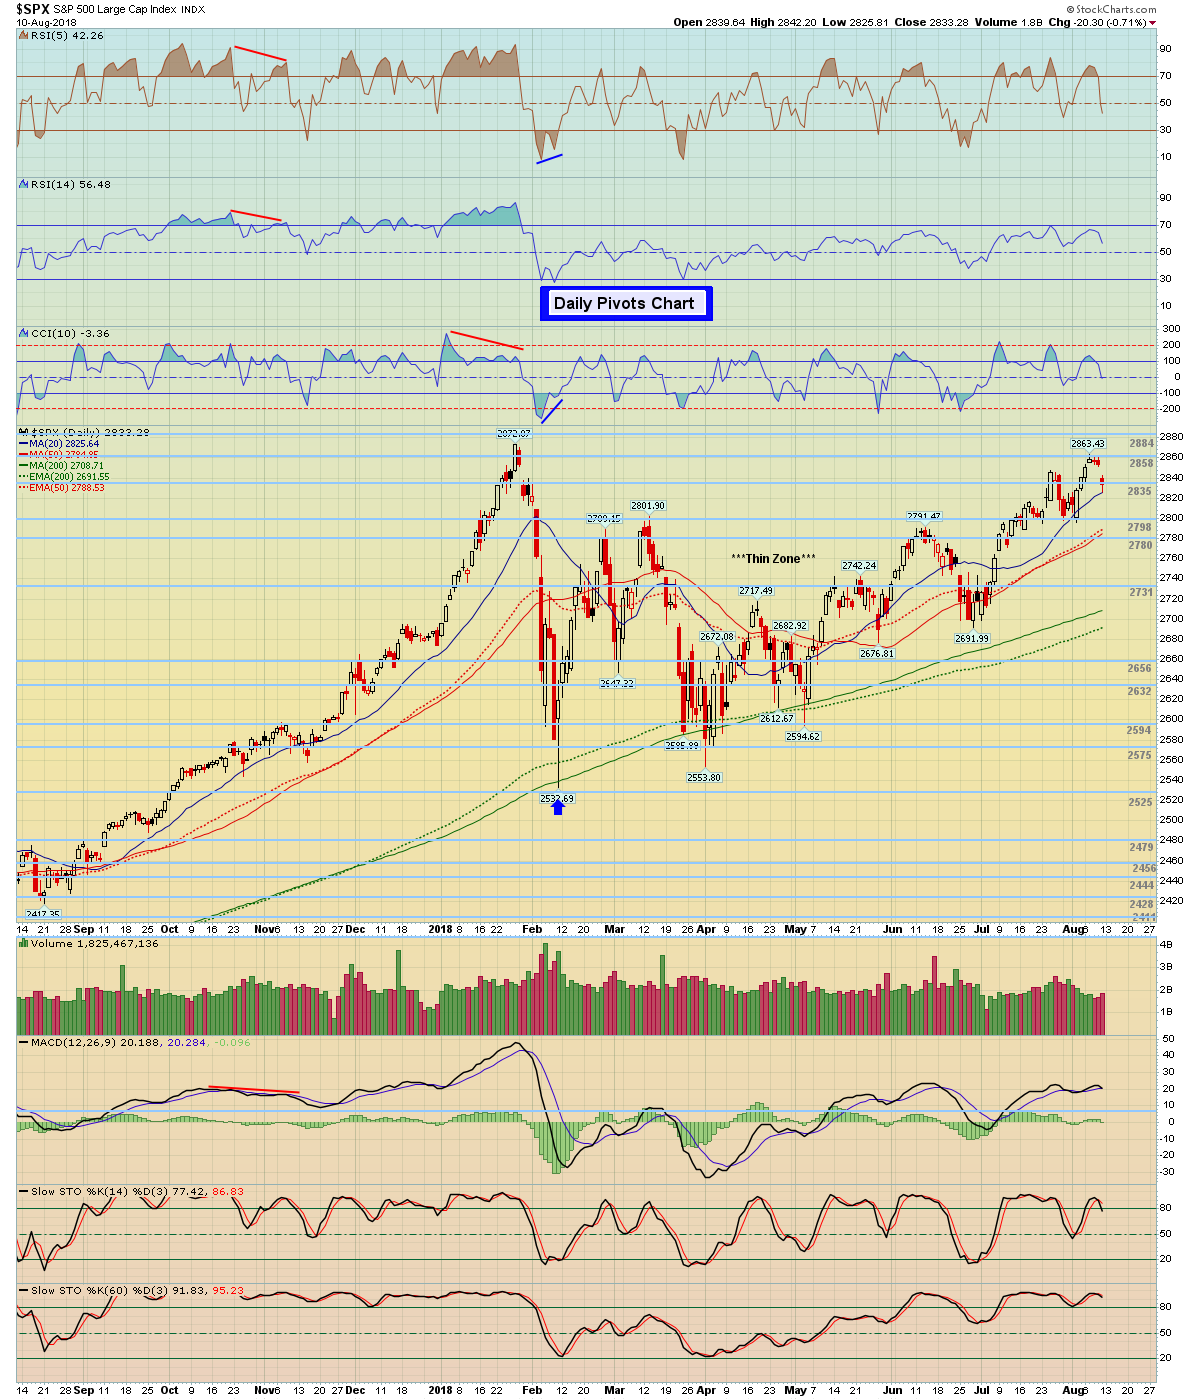
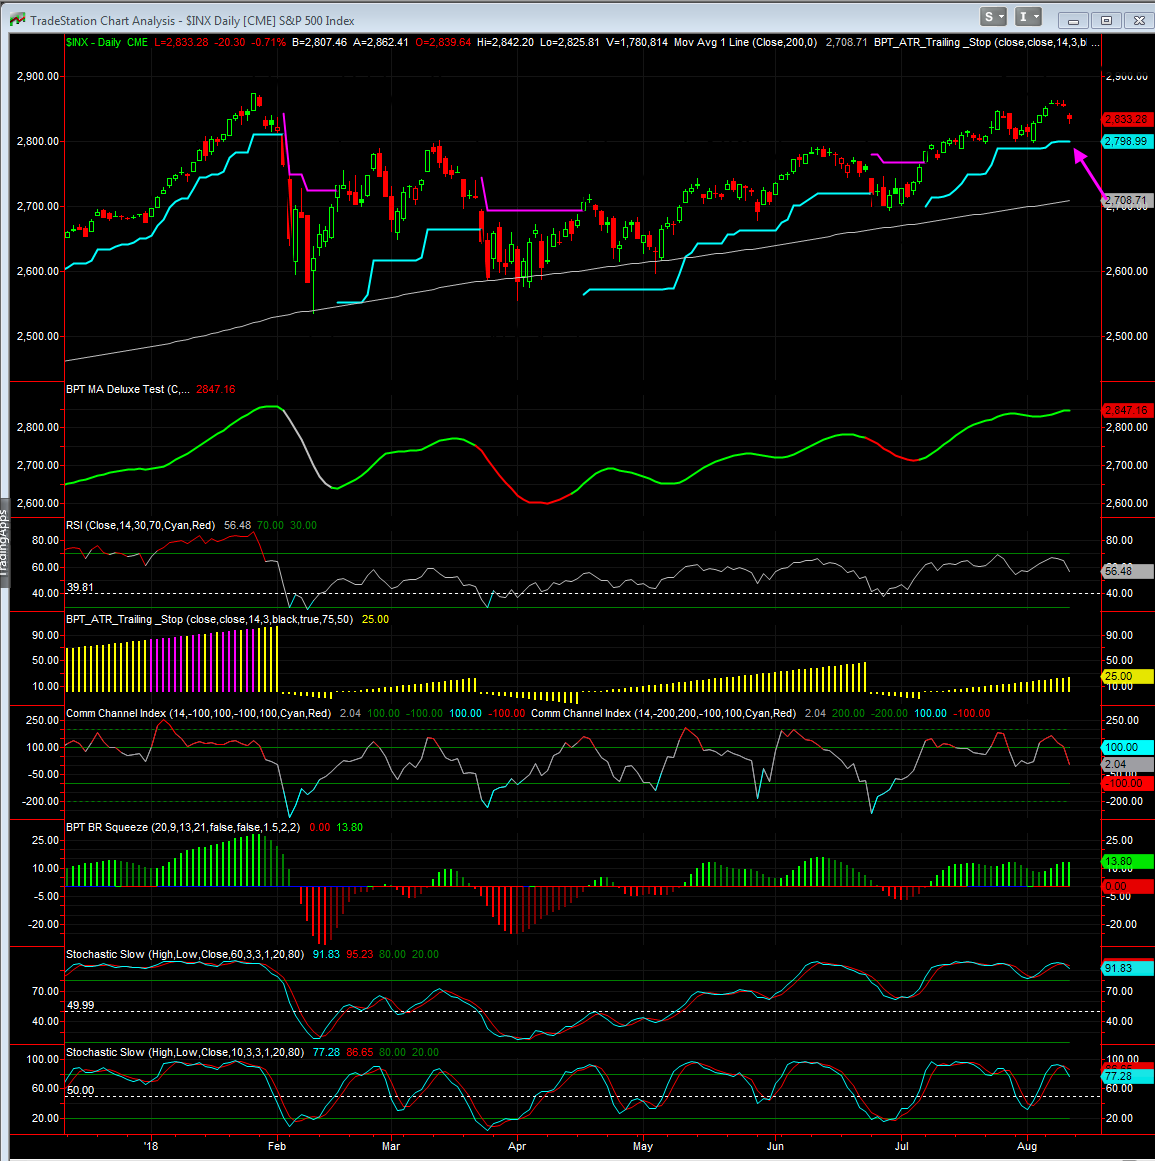
| S&P 500 | SPX - W | SPY - W | -0.71% | -0.25% | 2,833.28 |
| Wilshire 5000 | WLSH - W | -0.61% | 0.04% | 29,566.85 | |
| Nasdaq | COMPQ - W | -0.67% | 0.35% | 7,839.11 | |
| NDX 100 | NDX - W | QQQ - W | -0.79% | 0.17% | 7,408.30 |
| Russel 2000 (Small Caps) | RUT - W | IWM - W | -0.24% | 0.80% | 1,686.80 |
| Market Sectors | Index Symbol | ETF Symbol | % G / L Day | % G / L Week | Close |
|---|---|---|---|---|---|
| Transports | TRAN - W | IYT - W | -0.45% | -0.06% | 11,090.63 |
| Banks | BKX - W | -1.16% | -1.10% | 109.12 | |
| Financials | XLF - W | -1.17% | -0.53% | 27.97 | |
| Brokers | XBD - W | -0.52% | -0.09% | 273.06 | |
| XLE (Energy Select) | XLE - W | 0.61% | 0.07% | 75.29 | |
| Oil Service Holders | OIH - W | 1.15% | -0.08% | 25.48 | |
| Technology | XLK - W | -0.80% | 0.43% | 73.03 | |
| Semiconductor | SOX - W | SMH - W | -2.47% | -1.94% | 1,354.80 |
| Retail | XRT - W | 0.06% | 2.00% | 50.99 | |
| Consumer Staples | XLP - W | -0.37% | -1.93% | 53.24 | |
| Consumer Discretionary | XLY - W | -0.84% | 0.77% | 112.72 | |
| Industrials | XLI - W | -0.88% | -1.03% | 75.07 | |
| Telecom | IYZ - W | -0.59% | 2.11% | 28.51 | |
| Real Estate | IYR - W | -0.90% | -1.78% | 80.75 | |
| Homebuilders | HGX - W | XHB - W | -1.01% | -0.27% | 301.76 |
| Materials | XLB - W | -1.44% | -1.03% | 58.68 | |
| Metals And Mining | XME - W | -0.37% | -2.01% | 34.70 | |
| GDX Gold Miners ETF | GDX - W | -0.72% | -2.84% | 20.56 | |
| Biotechnology | BTK - W | XBI - W | -0.21% | 1.46% | 5,132.76 |
| Healthcare | XLV - W | -0.43% | -0.20% | 89.63 | |
| Drugs | DRG - W | -0.47% | -0.76% | 566.66 | |
| Utilities | UTIL - W | XLU - W | -0.54% | -0.73% | 723.51 |
| Currencies | Index Symbol | ETF Symbol | % G / L Day | % G / L Week | Close |
|---|---|---|---|---|---|
| US Dollar | UUP - W | 0.71% | 1.23% | 25.48 | |
| Euro | XEU - W | FXE - W | -0.99% | -1.39% | 114.15 |
| Yen | XJY - W | FXY - W | 0.21% | 0.37% | 90.21 |
| Australian | XAD - W | FXA - W | -0.67% | -1.01% | 73.23 |
| British Pound | XBP - W | FXB - W | -0.46% | -1.79% | 127.69 |
| South African Rand | ZAR - W | -3.16% | -5.62% | 0.07 | |
| Canadian Dollar | CDW - W | FXC - W | -0.74% | -1.07% | 76.08 |
| Swiss Franc | XSF - W | FXF - W | -0.17% | -0.07% | 100.49 |
| Commodities | Index Symbol | ETF Symbol | % G / L Day | % G / L Week | Close |
|---|---|---|---|---|---|
| CRB Commodities (17 Components) | CRB - W | DBC - W | -0.38% | -0.80% | 191.69 |
| Crude Oil | WTIC - W | USO - W | 1.23% | -1.26% | 67.63 |
| Gasoline | GASO - W | 1.97% | -1.27% | 2.04 | |
| Natural Gas | NATGAS - W | UNG - W | -0.37% | 3.19% | 2.94 |
| Copper | COPPER - W | -0.83% | -0.76% | 2.74 | |
| Agriculture | DBA - W | -1.60% | -1.71% | 17.21 | |
| Corn | CORN - W | CORN - W | -2.87% | -3.25% | 371.75 |
| Wheat | WHEAT - W | WEAT - W | -3.14% | -1.71% | 546.75 |
| Coffee | COFFEE - W | BJO - W | -0.23% | 2.78% | 1.11 |
| Sugar | SUGAR - W | 0.28% | -0.09% | 0.11 |
| Precious Metals | Index Symbol | ETF Symbol | % G / L Day | % G / L Week | Close |
|---|---|---|---|---|---|
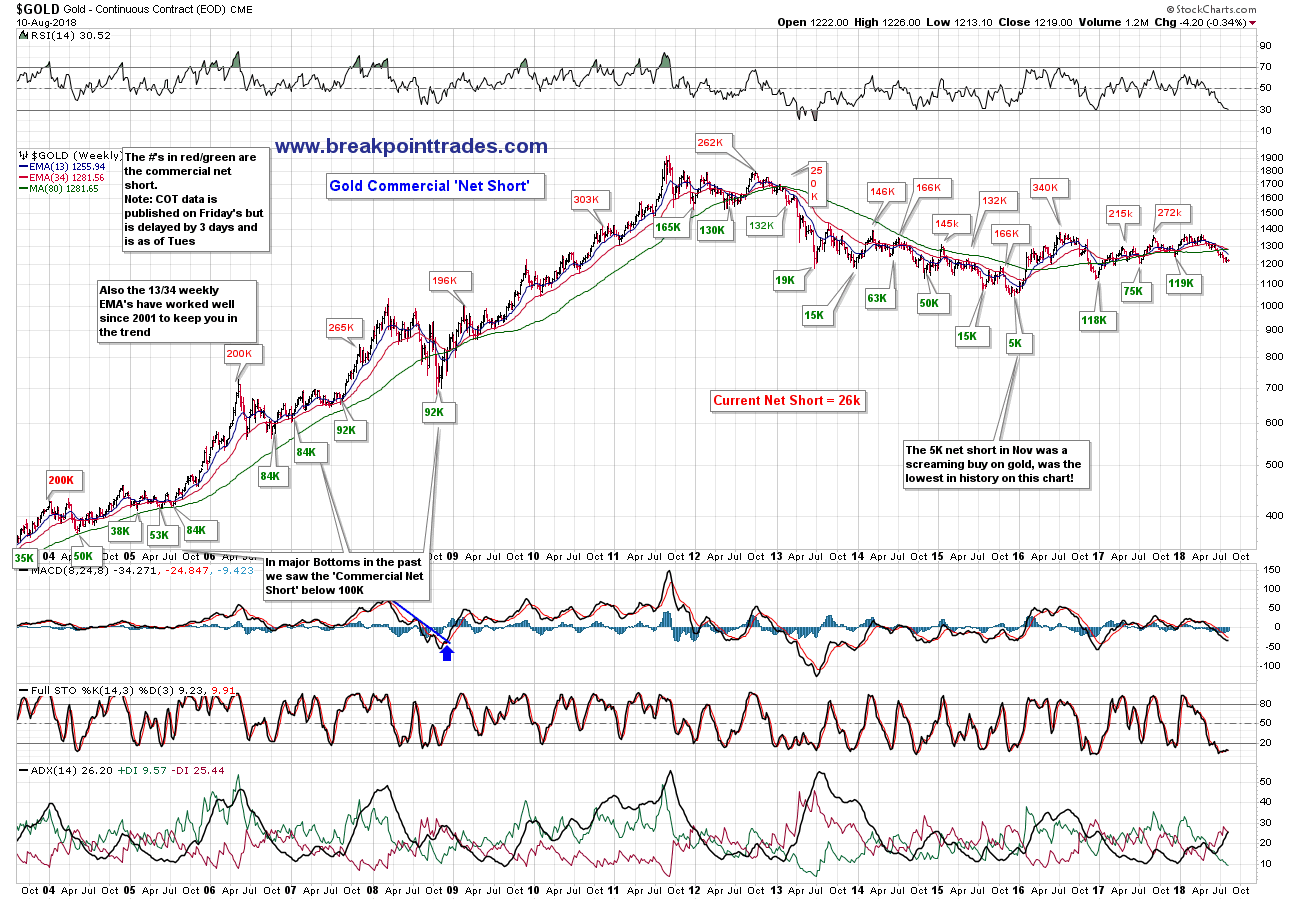
| Gold Metal | GLD - W | -0.04% | -0.20% | 114.69 | |
| Silver | SLV - W | -0.76% | -0.62% | 14.41 | |
| Platinum | PPLT - W | -0.51% | -0.39% | 78.75 | |
| Palladium | PALL - W | 0.65% | -0.31% | 86.41 | |
| GDX Gold Miners ETF | GDX - W | -0.72% | -2.84% | 20.56 |
| Bonds | Index Symbol | ETF Symbol | % G / L Day | % G / L Week | Close |
|---|---|---|---|---|---|
| TLT 20 Year Bond ETF | TLT - W | 0.73% | 1.21% | 120.66 | |
| 10 Year Treasury Yield | TNX - W | -2.66% | -3.25% | 28.57 | |
| 30 Year Treasury Yield | TYX - W | -2.14% | -2.49% | 30.16 |
3
Week of August 13 - August 17
| Date | ET | Release | For | Actual | Briefing.com Forecast | Briefing.com Consensus | Prior | Revised From |
|---|---|---|---|---|---|---|---|---|
| Aug 14 | 06:00 | NFIB Small Business Optimism Index | Jul | NA | NA | 107.2 | ||
| Aug 14 | 08:30 | Import Prices | Jul | NA | NA | -0.4% | ||
| Aug 14 | 08:30 | Import Prices ex-oil | Jul | NA | NA | -0.3% | ||
| Aug 14 | 08:30 | Export Prices | Jul | NA | NA | 0.3% | ||
| Aug 14 | 08:30 | Export Prices ex-ag. | Jul | NA | NA | 0.4% | ||
| Aug 15 | 07:00 | MBA Mortgage Applications Index | 08/11 | NA | NA | -3.0% | ||
| Aug 15 | 08:30 | Retail Sales | Jul | 0.2% | 0.1% | 0.5% | ||
| Aug 15 | 08:30 | Retail Sales ex-auto | Jul | 0.4% | 0.3% | 0.4% | ||
| Aug 15 | 08:30 | Productivity-Prel | Q2 | 2.2% | 2.0% | 0.4% | ||
| Aug 15 | 08:30 | Unit Labor Costs - Prelim | Q2 | 0.7% | 0.5% | 2.9% | ||
| Aug 15 | 08:30 | Empire Manufacturing | Aug | 21.5 | 20.0 | 22.6 | ||
| Aug 15 | 09:15 | Industrial Production | Jul | 0.5% | 0.4% | 0.6% | ||
| Aug 15 | 09:15 | Capacity Utilization | Jul | 78.3% | 78.3% | 78.0% | ||
| Aug 15 | 10:00 | Business Inventories | Jun | 0.1% | 0.1% | 0.4% | ||
| Aug 15 | 10:00 | NAHB Housing Market Index | Aug | 66 | 67 | 68 | ||
| Aug 15 | 10:30 | Crude Inventories | 08/11 | NA | NA | -1.4M | ||
| Aug 15 | 16:00 | Net Long-Term TIC Flows | Jun | NA | NA | $45.6B | ||
| Aug 16 | 08:30 | Housing Starts | Jul | 1275K | 1256K | 1173K | ||
| Aug 16 | 08:30 | Building Permits | Jul | 1320K | 1316K | 1273K | ||
| Aug 16 | 08:30 | Initial Claims | 08/11 | 215K | 217K | 213K | ||
| Aug 16 | 08:30 | Continuing Claims | 08/04 | NA | NA | 1755K | ||
| Aug 16 | 08:30 | Philadelphia Fed | Aug | 22.0 | 23.0 | 25.7 | ||
| Aug 16 | 10:30 | Natural Gas Inventories | 08/11 | NA | NA | +46 bcf | ||
| Aug 17 | 10:00 | Leading Indicators | Jul | 0.5% | 0.5% | 0.5% | ||
| Aug 17 | 10:00 | Univ. of Michigan Consumer Sentiment - prelim | Aug | 98.5 | 97.8 | 97.9 |

Stock Earnings Calender:
Click here for a list of Stocks that are reporting Earnings
**Generally we never hold a position into earnings since the risk/reward is too great
4 - View Live Chart

5 - View Live Chart

6 - View Live Chart

7 - View Live Chart

8 - View Live Chart

9 - View Live Chart
10
11 - View Live Chart

12 - View Live Chart

13 - View Live Chart

14 - View Live Chart

15 - View Live Chart

16 - View Live Chart

17 - View Live Chart

18 - View Live Chart

19 - View Live Chart

20 - View Live Chart

21 - View Live Chart

22 - View Live Chart

23 - View Live Chart

24 - View Live Chart

25 - View Live Chart

26 - View Live Chart

27 - View Live Chart

28 - View Live Chart

29 - View Live Chart

30 - View Live Chart

31 - View Live Chart

32 - View Live Chart

33 - View Live Chart

34 - View Live Chart

35 - View Live Chart

36 - View Live Chart

37 - View Live Chart

38 - View Live Chart

39 - View Live Chart

40 - View Live Chart

41 - View Live Chart

42 - View Live Chart

43 - View Live Chart

44 - View Live Chart

45 - View Live Chart

46 - View Live Chart

47 - View Live Chart

48 - View Live Chart

49 - View Live Chart

50 - View Live Chart

51 - View Live Chart

52 - View Live Chart

53 - View Live Chart

54 - View Live Chart

55 - View Live Chart

56 - View Live Chart

57 - View Live Chart

58 - View Live Chart

59 - View Live Chart

60 - View Live Chart

61 - View Live Chart

62 - View Live Chart

63 - View Live Chart

64 - View Live Chart

65 - View Live Chart

66 - View Live Chart

67 - View Live Chart

68 - View Live Chart

69 - View Live Chart

70 - View Live Chart

71 - View Live Chart

72 - View Live Chart

73 - View Live Chart

74 - View Live Chart

75 - View Live Chart

76 - View Live Chart

77 - View Live Chart

78 - View Live Chart

79 - View Live Chart

80 - View Live Chart

81 - View Live Chart

82 - View Live Chart

83 - View Live Chart
84 - View Live Chart

85 - View Live Chart

86 - View Live Chart

87 - View Live Chart

88 - View Live Chart

89 - View Live Chart

90 - View Live Chart

91 - View Live Chart

92 - View Live Chart

- Hide Player Link to Newsletter Audio
Update Required
To play the media you will need to either update your browser to a recent version or update your Flash plugin.
- Hide Player Link to Newsletter Audio
Update Required
To play the media you will need to either update your browser to a recent version or update your Flash plugin.