Education: MACD Kiss
Disclaimer: Intraday Chart Links will show up as daily charts unless you have an active stockcharts.com membership and are signed in, you can sign up here.
1
The MACD Kiss is a technical analysis setup that I have discussed and utilized for many news. Below I have put together detailed examples of this very simple technique.
The MACD is one of the most commonly used technical indicators, if you don't know what a MACD is I suggest you read up on it first. The MACD indicator is a momentum type indicator that is useful for trend purposes such as when the MACD is above or below zero, and for reversals of trend when the MACD lines cross one another. However one of the most common of the MACD indicator is to note positive and negative divergences between the price of the instrument and the MACD indicator. There is simply an overwhelming amount of information and examples showing the MACD indicator used in this manner that you can find on the internet and in books.
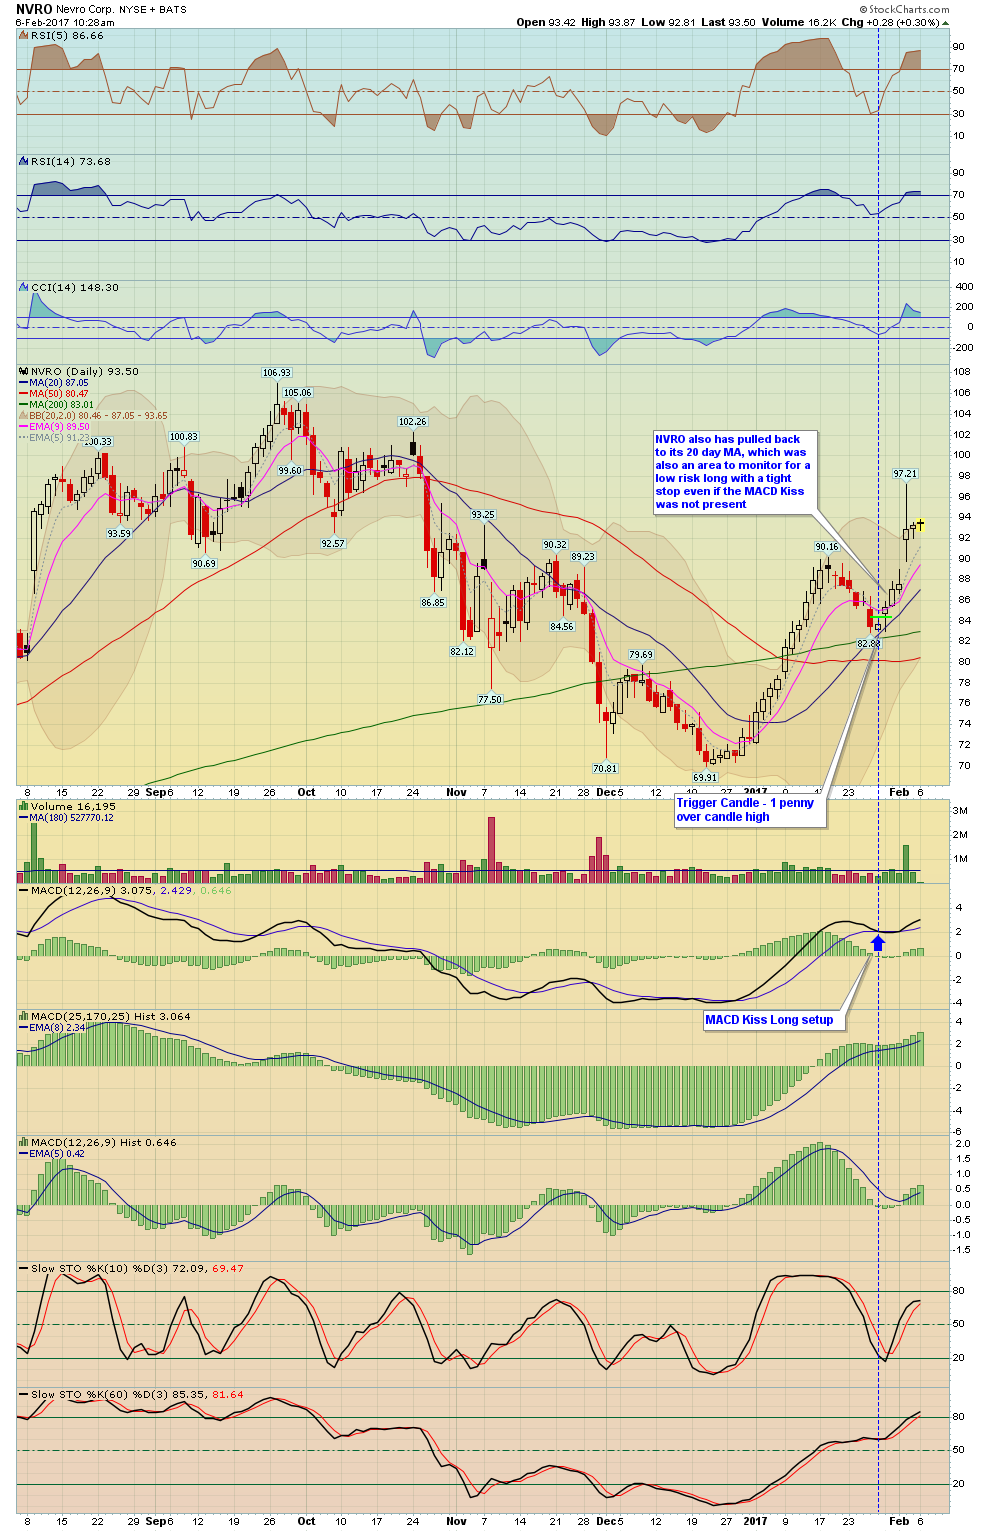
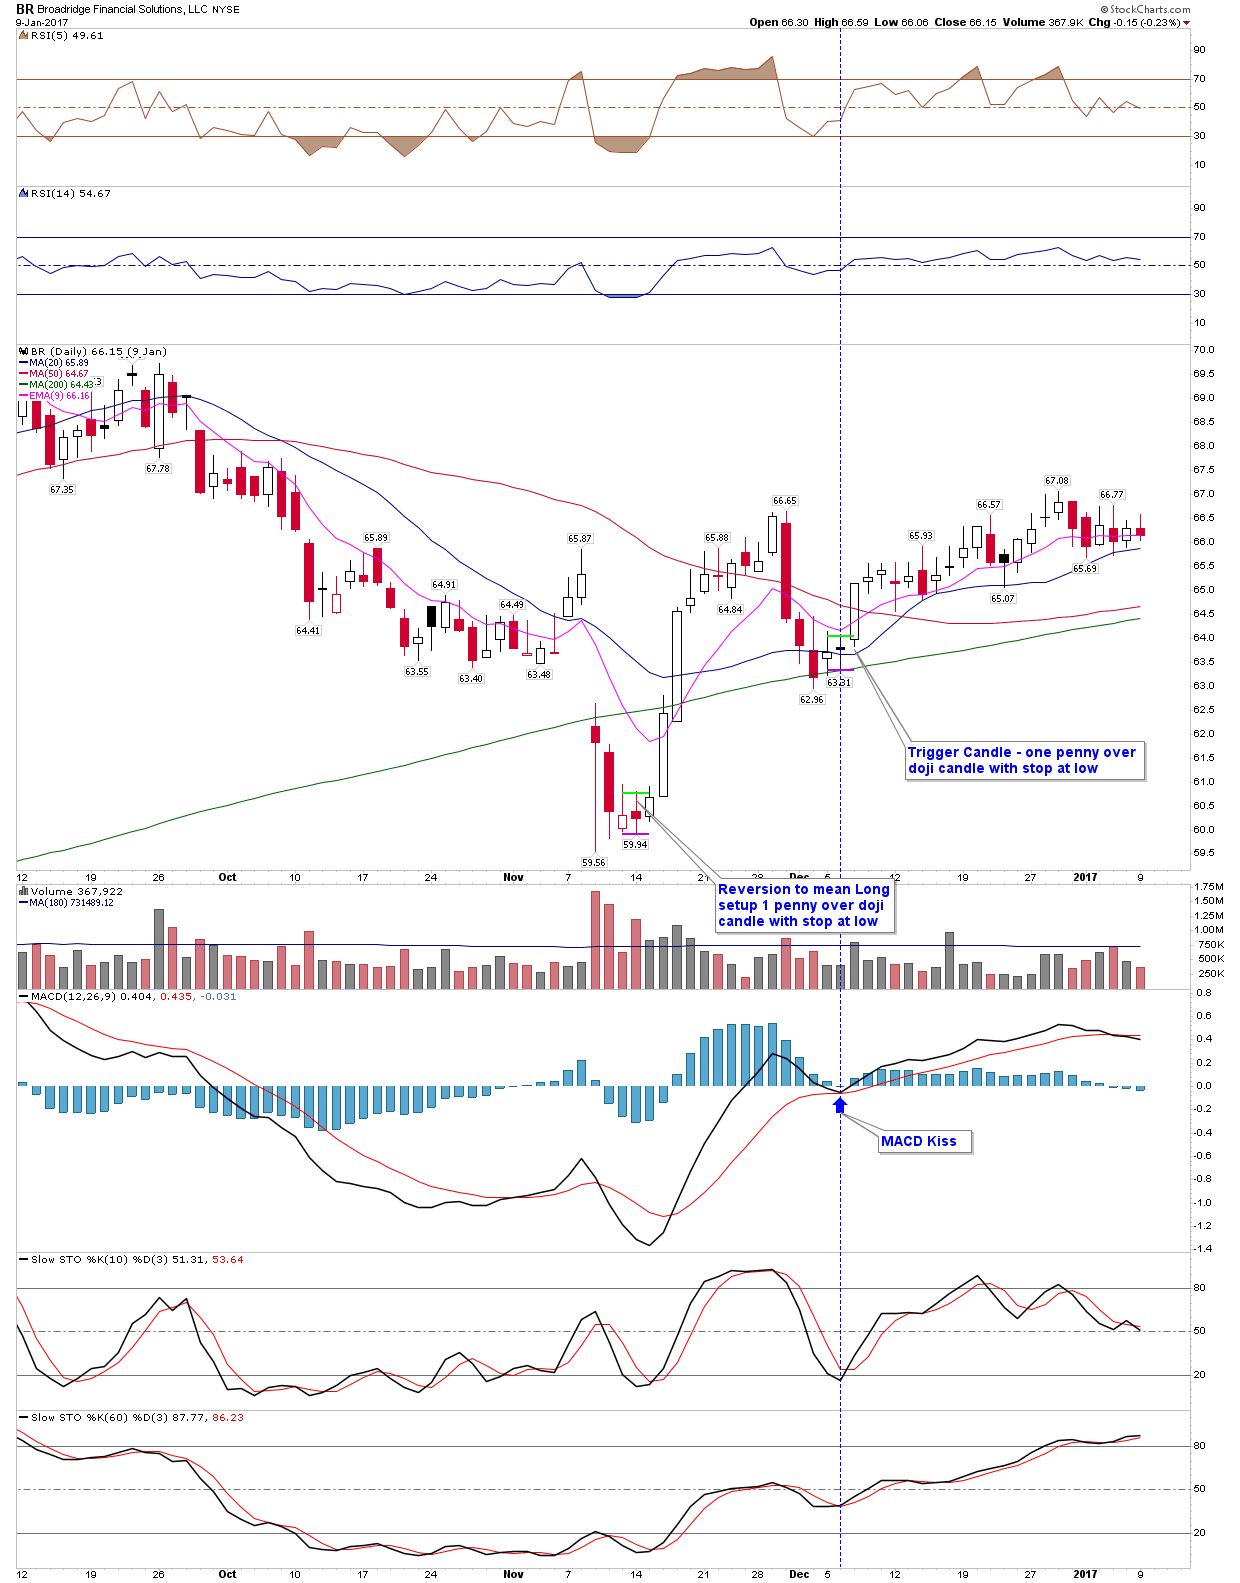
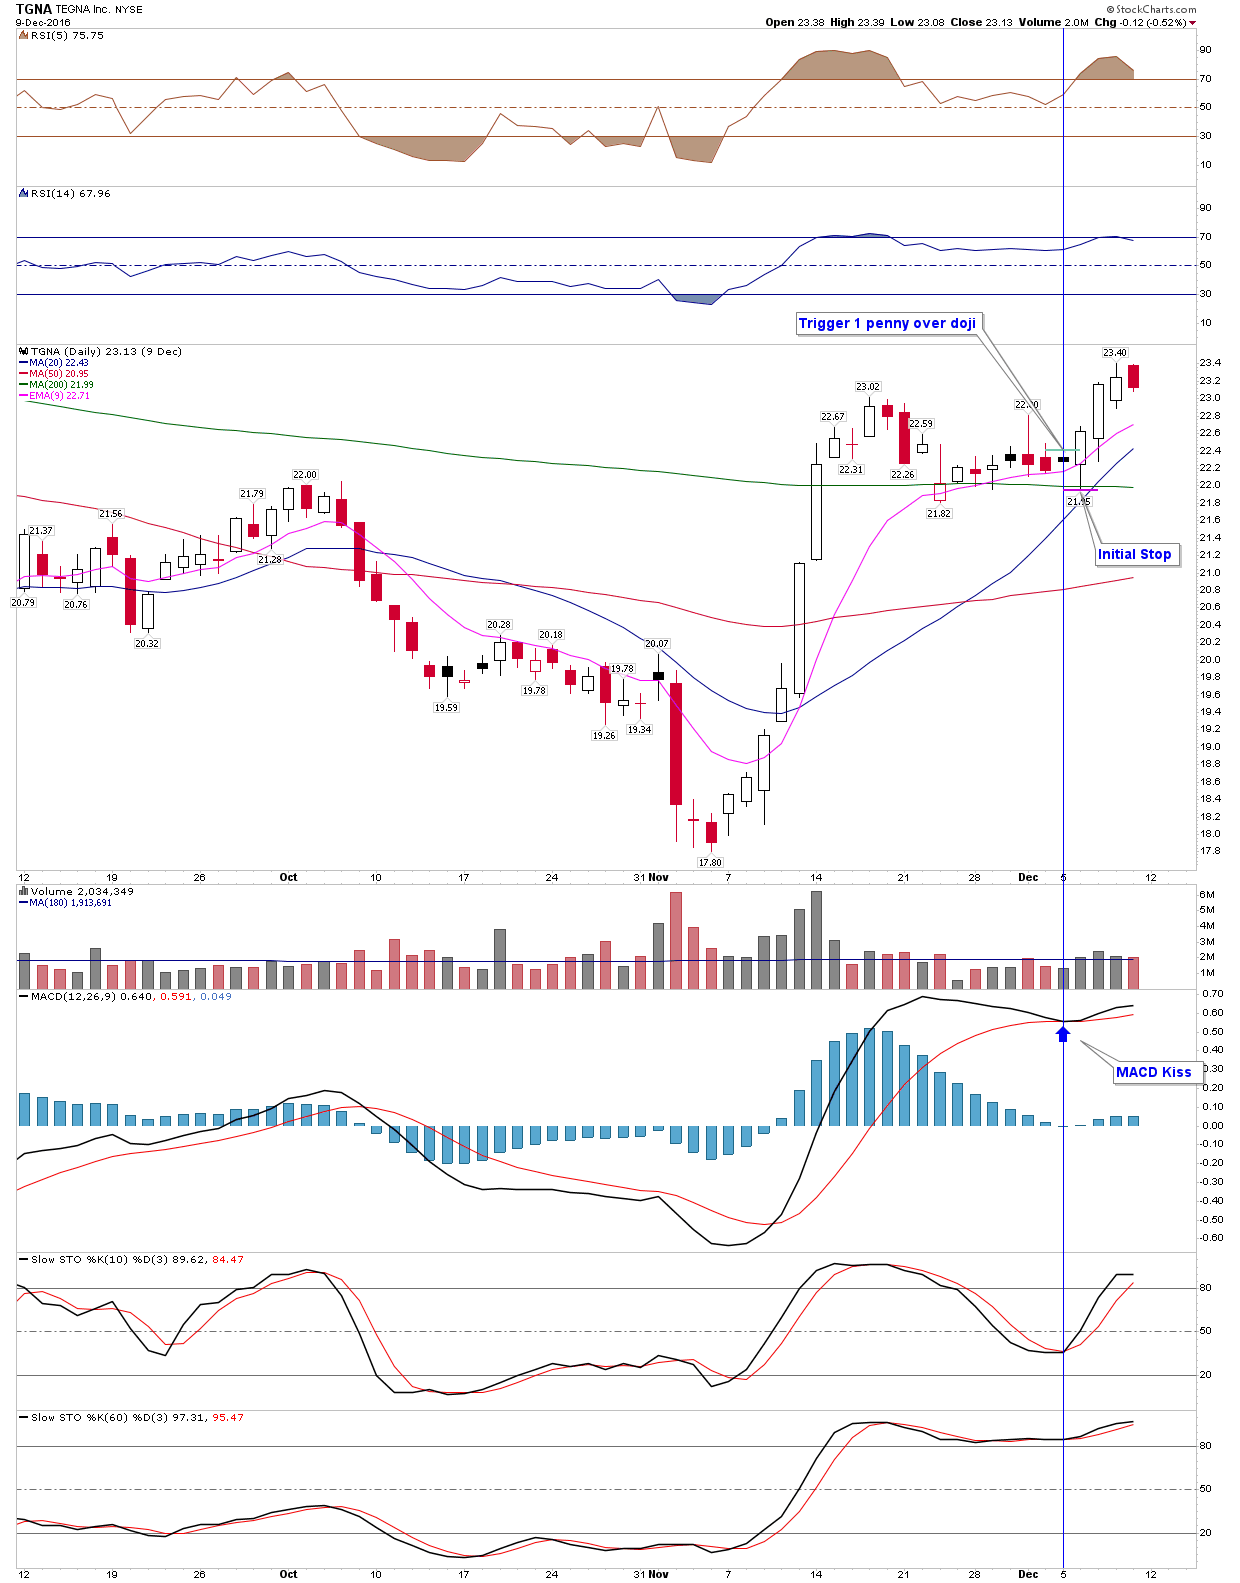
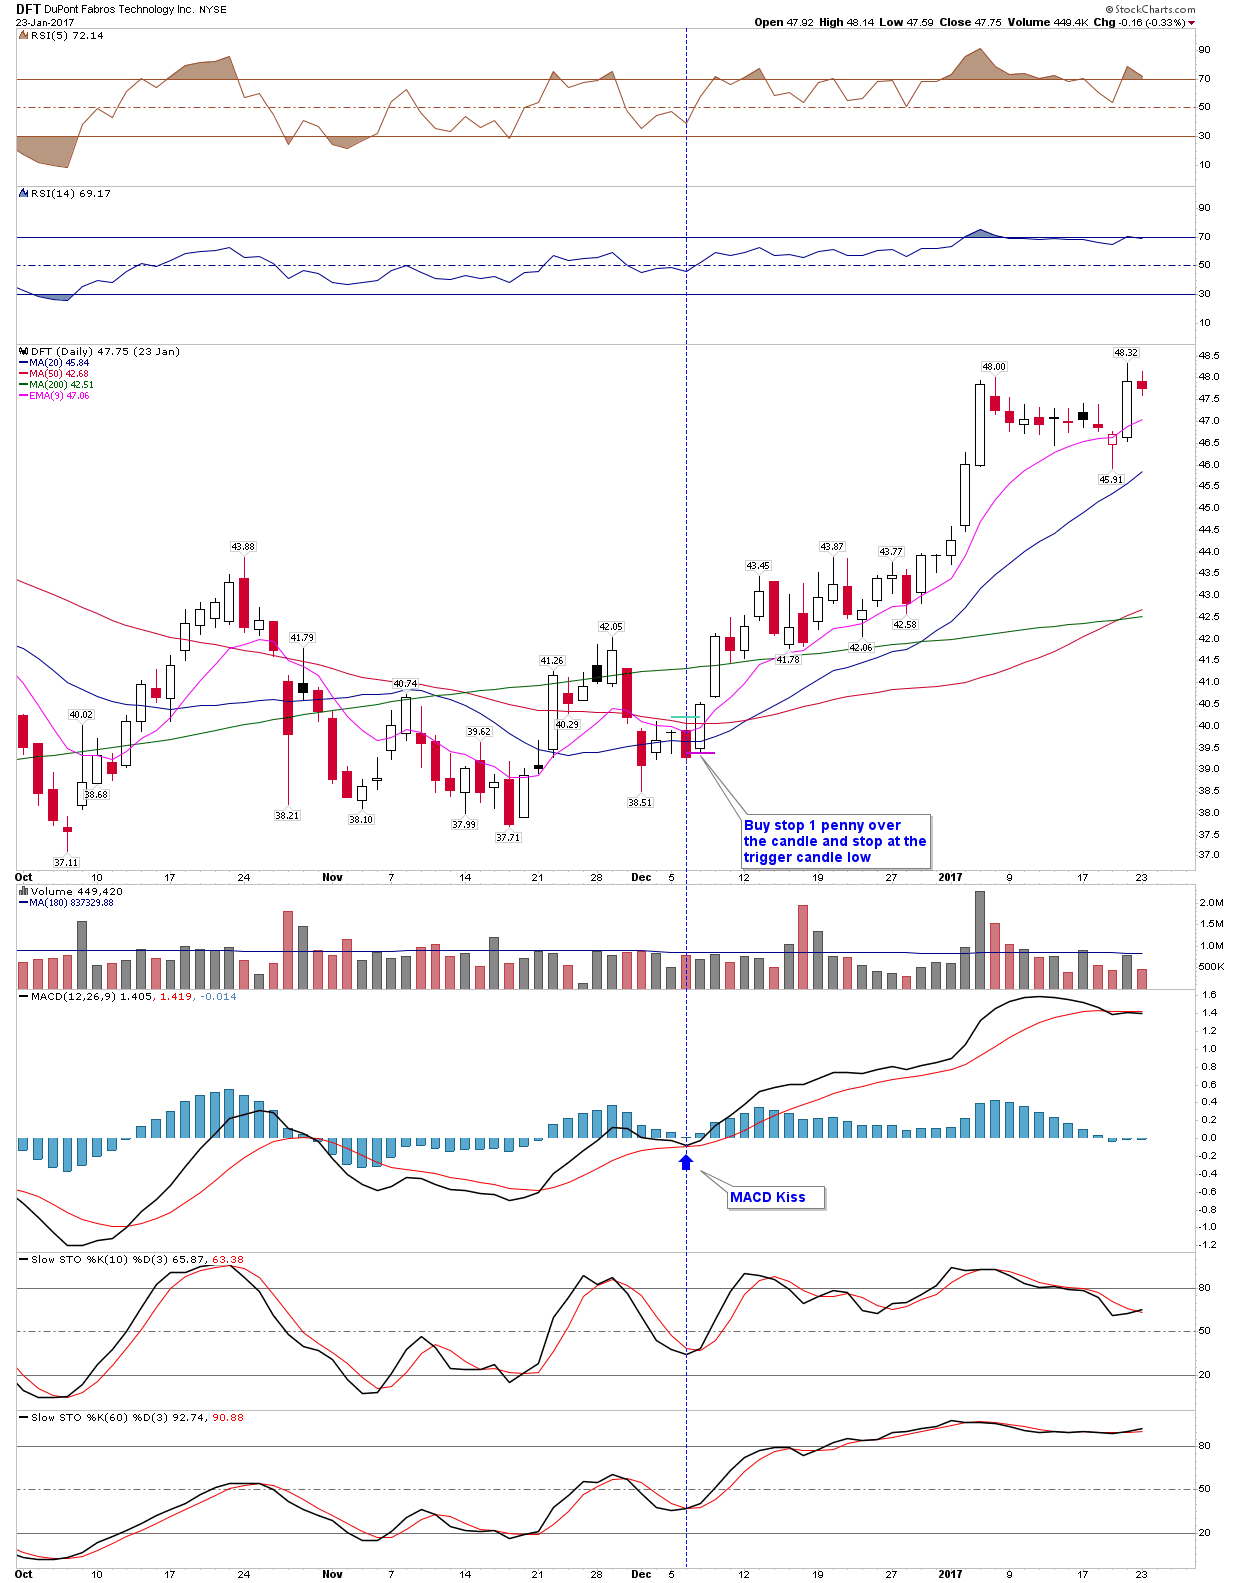
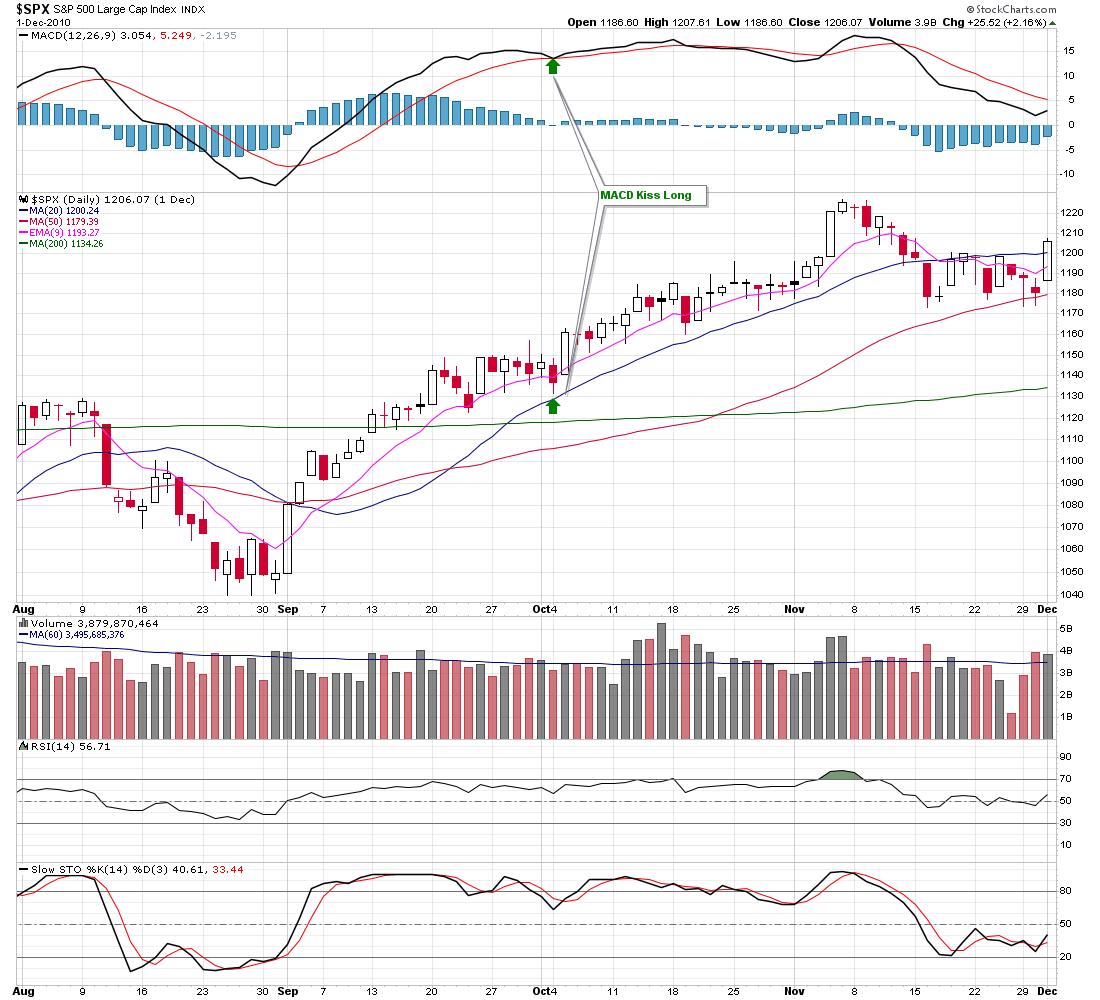
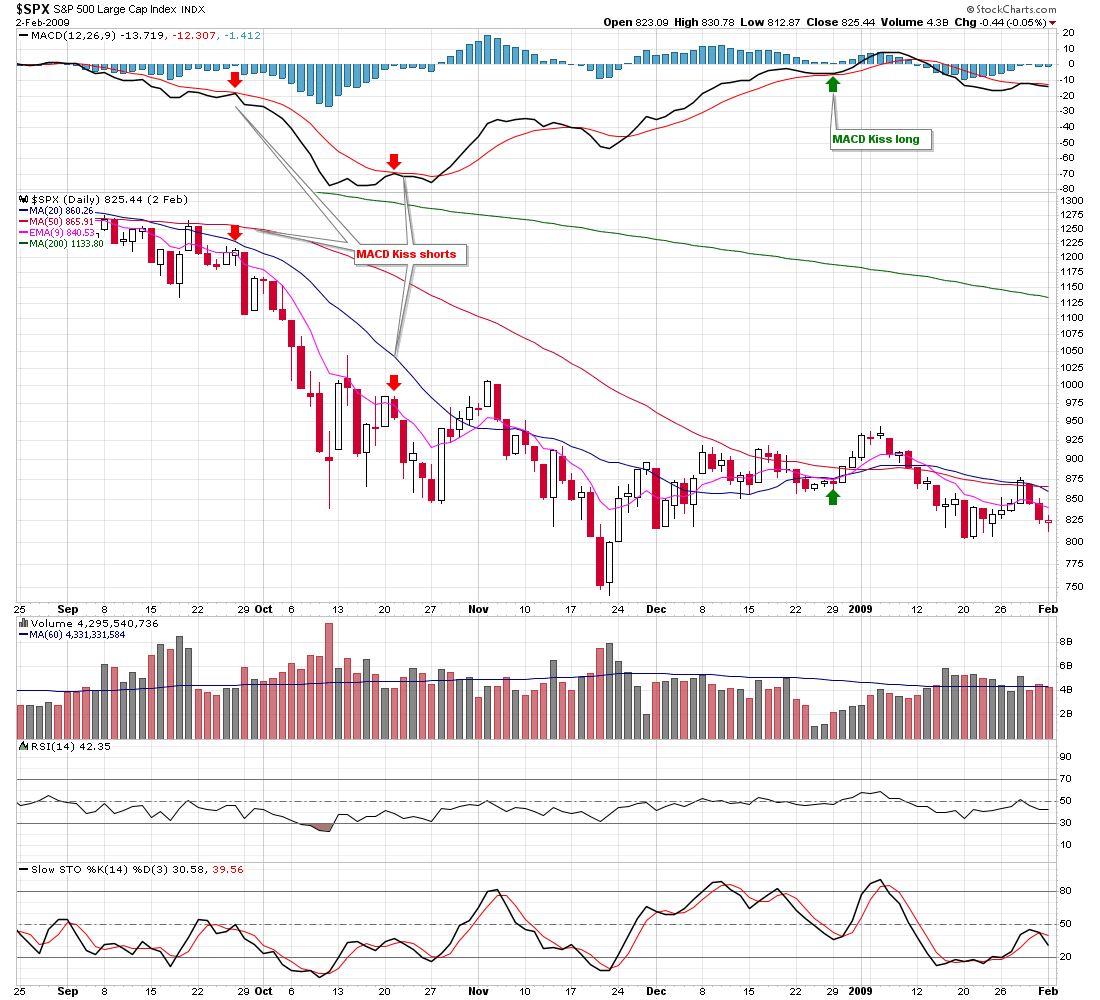
MACD Kiss: However I think one of the least used or known techniques is a technique I came up with that I call the 'MACD Kiss'. The MACD is composed of two lines, the MACD line and the MACD average. The MACD Kiss occurs whenever the lines converge together together coming close to one another or nearly touching one another. Whenever the MACD and MACD average lines come close together (Kiss) one can think of this as a 'breakpoint' or akin to a support and resistance, i.e. the lines are either going to cross one another or suddenly reverse and resume the current trend at hand.
The MACD Kiss Trade Setup: Whenever these MACD lines come close to one another it can provide either a low risk long enter (if the trend has been up), or a low risk short (if the trend has been down). However one does not simply go long or short whenever the MACD lines 'kiss', a trigger is needed, because in many cases the MACD lines will cross. Example, my trigger for a positive MACD kiss setup would be placing a buy stop 1 penny over the high of the candle especially if it's a doji candlestick (or 1 tick for futures), or at approximately 50% of the candle range if it's a large sold candlestick, while my initial stop goes at the candle low. The reverse is true for shorts or negative MACD Kiss setups.
Additional Notes:
- In my observation the MACD Kiss works best whenever the instrument has been trending i.e. a stock has been up trending and has a pullback within that trend, which allows the MACD lines to come within close proximity to one another - vs a very sideways choppy trend where the MACD lines are simply going sideways and prone to a lot of whipsaws.
- Like most trading and technical analysis there's an 'art' to this that over time that will allow you to 'calibrate' your eye to choose the setups that work the best, and where to place buy and sell stops.
I've placed a few images below and may add more over time as I see them.
2 - View Live Chart
3 - View Live Chart
4 - View Live Chart
5 - View Live Chart
6 - View Live Chart
7 - View Live Chart