Educational Newsletter: Typical Market Trend Day 5 min SPX
Disclaimer: Intraday Chart Links will show up as daily charts unless you have an active stockcharts.com membership and are signed in, you can sign up here.
1
What we call 'Trend Days' are days when the market has a strong gap up in the morning that is not sold into, but instead strengthens and holds up well most of the day. One thing that makes these Trend Days interesting is that they tend to occur on news and play out in a very predictable and similar manner with intra day pullbacks being buying opportunities, these are not days to look for shorting the market. We have posted 100's of examples of this phenomenon over the years on the Trading Community Blog, thus it's only logical to place some examples in the Education section for future reference for members.
These 'Trend Days' tend to play out in a very similar manner:
1. The cash market gaps strongly higher, typically on some kind of news (but news is not required could simply be on technicals).
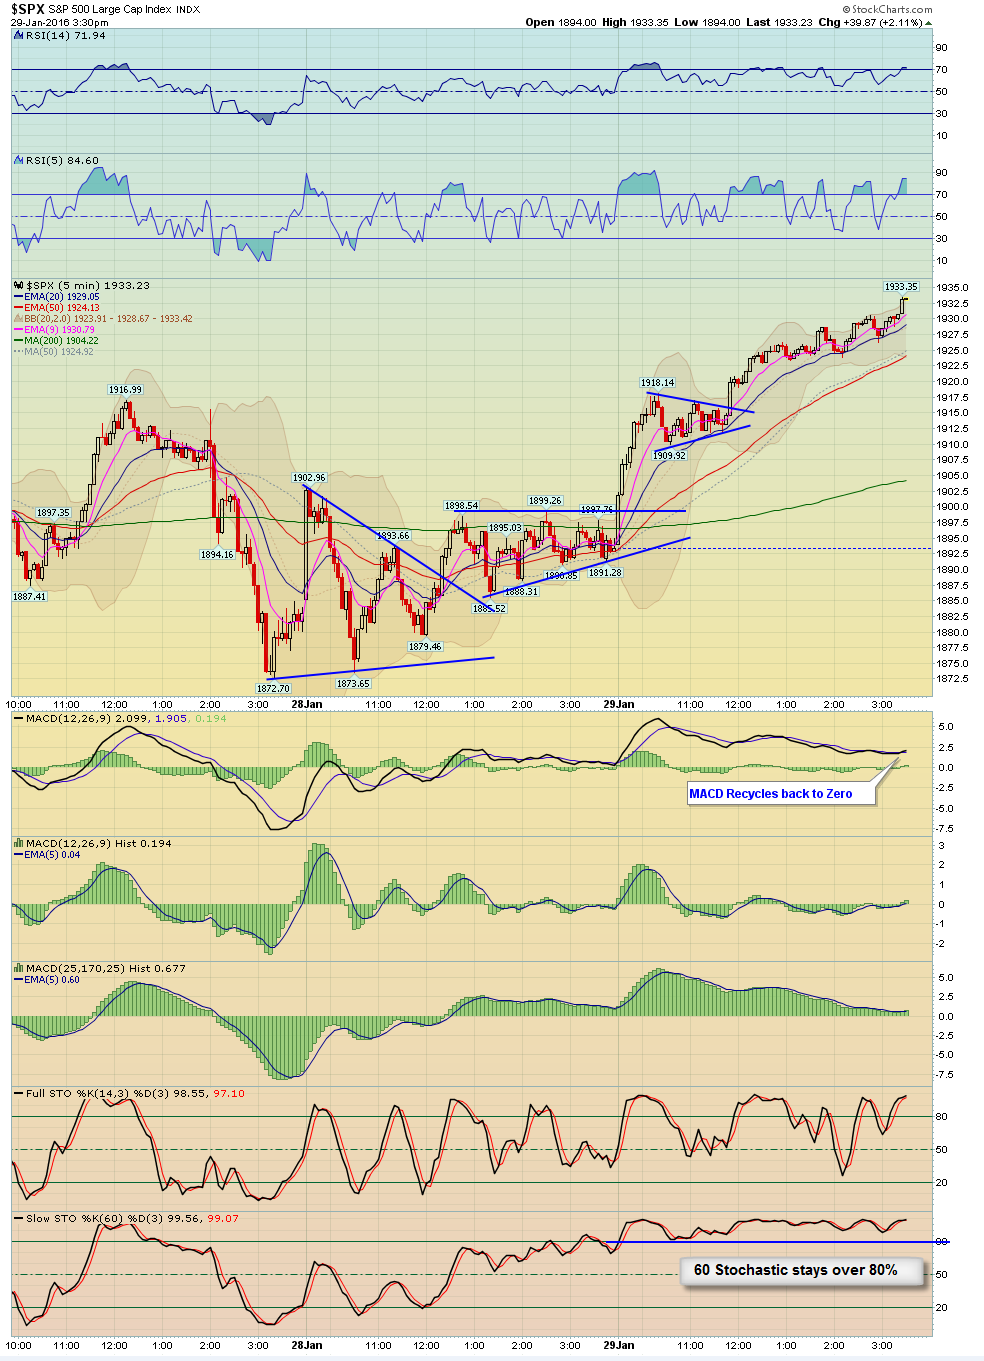
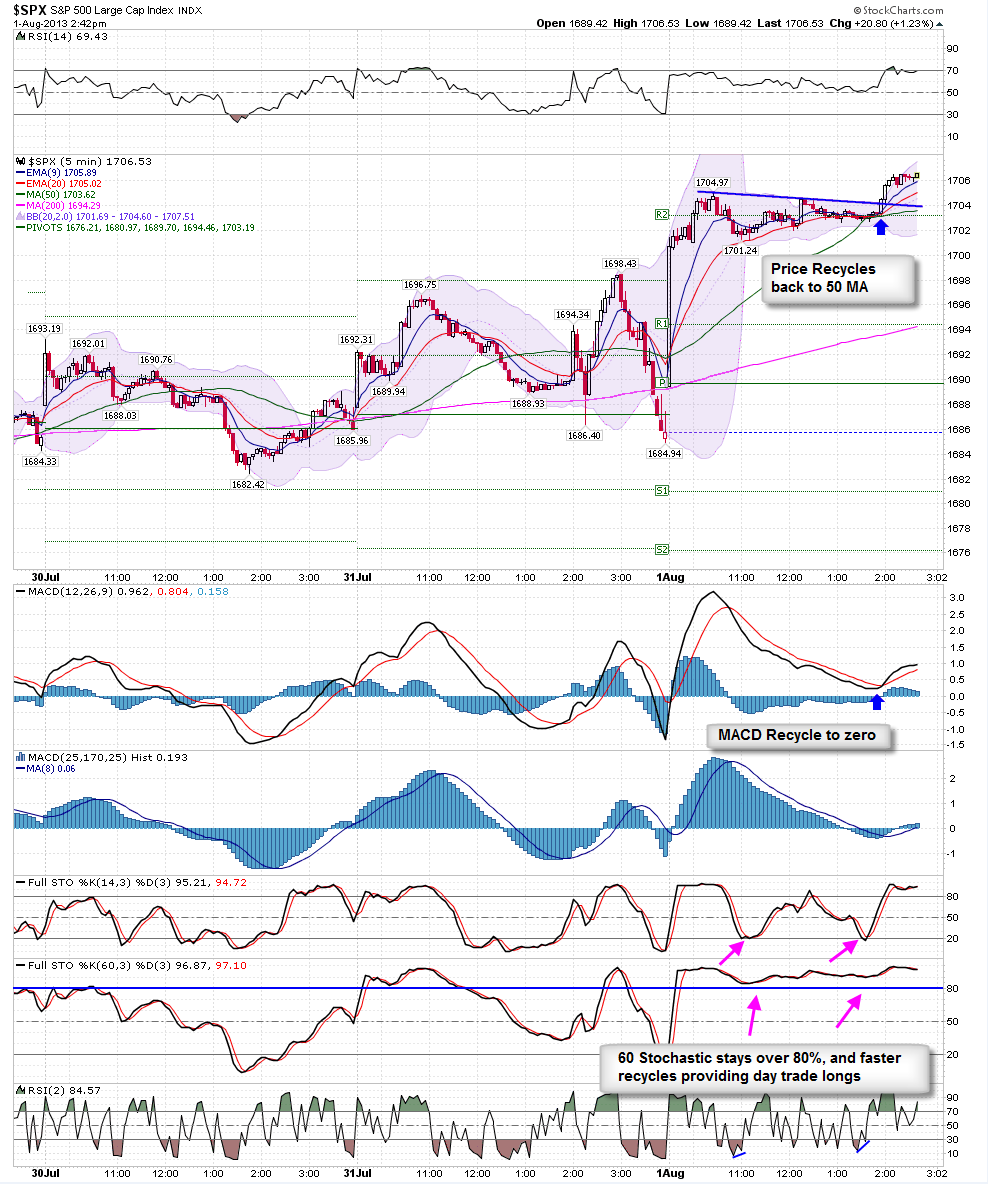
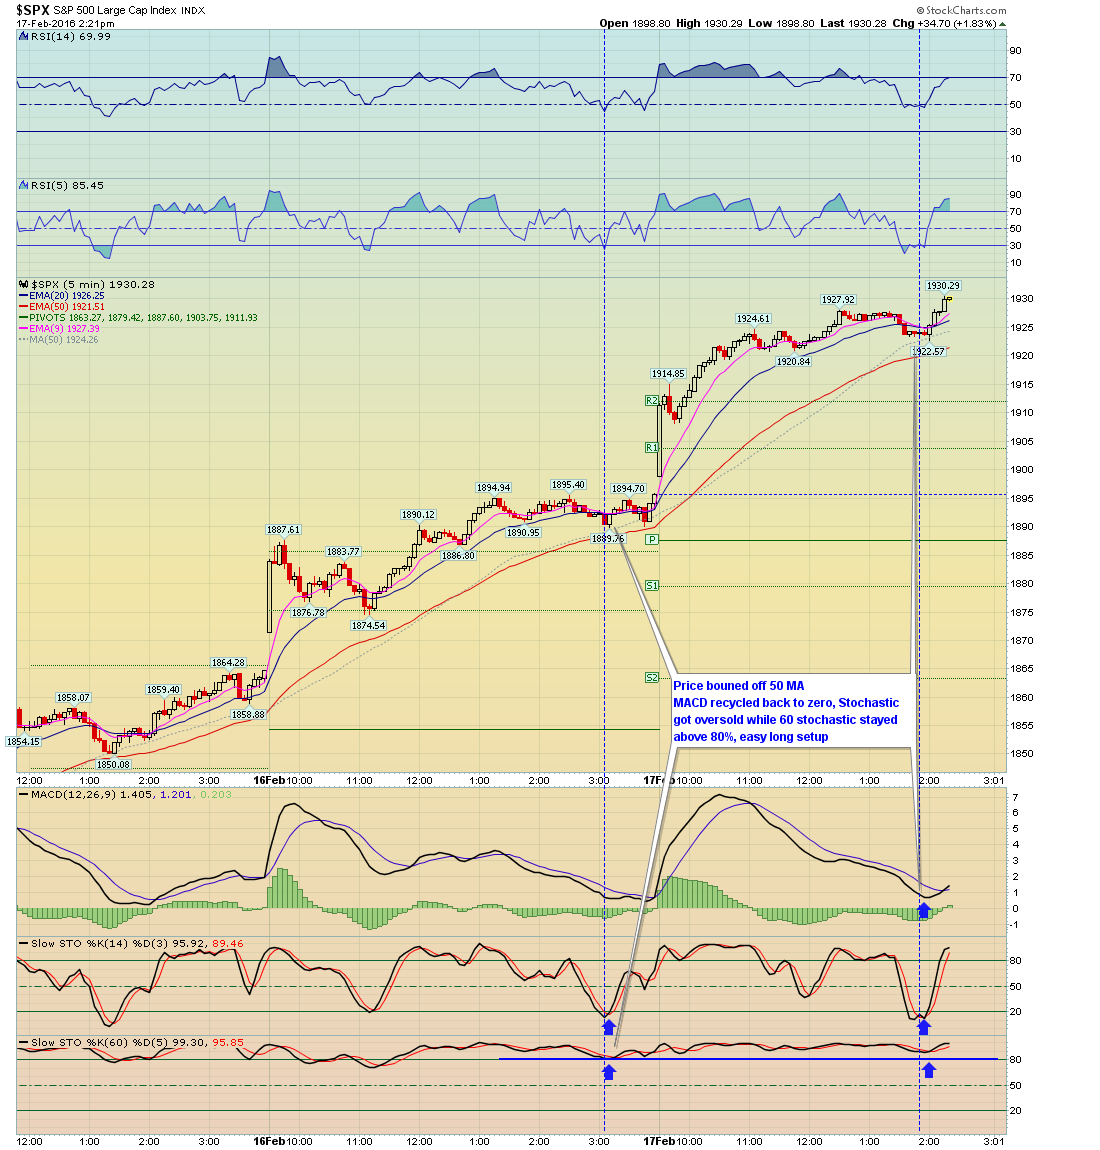
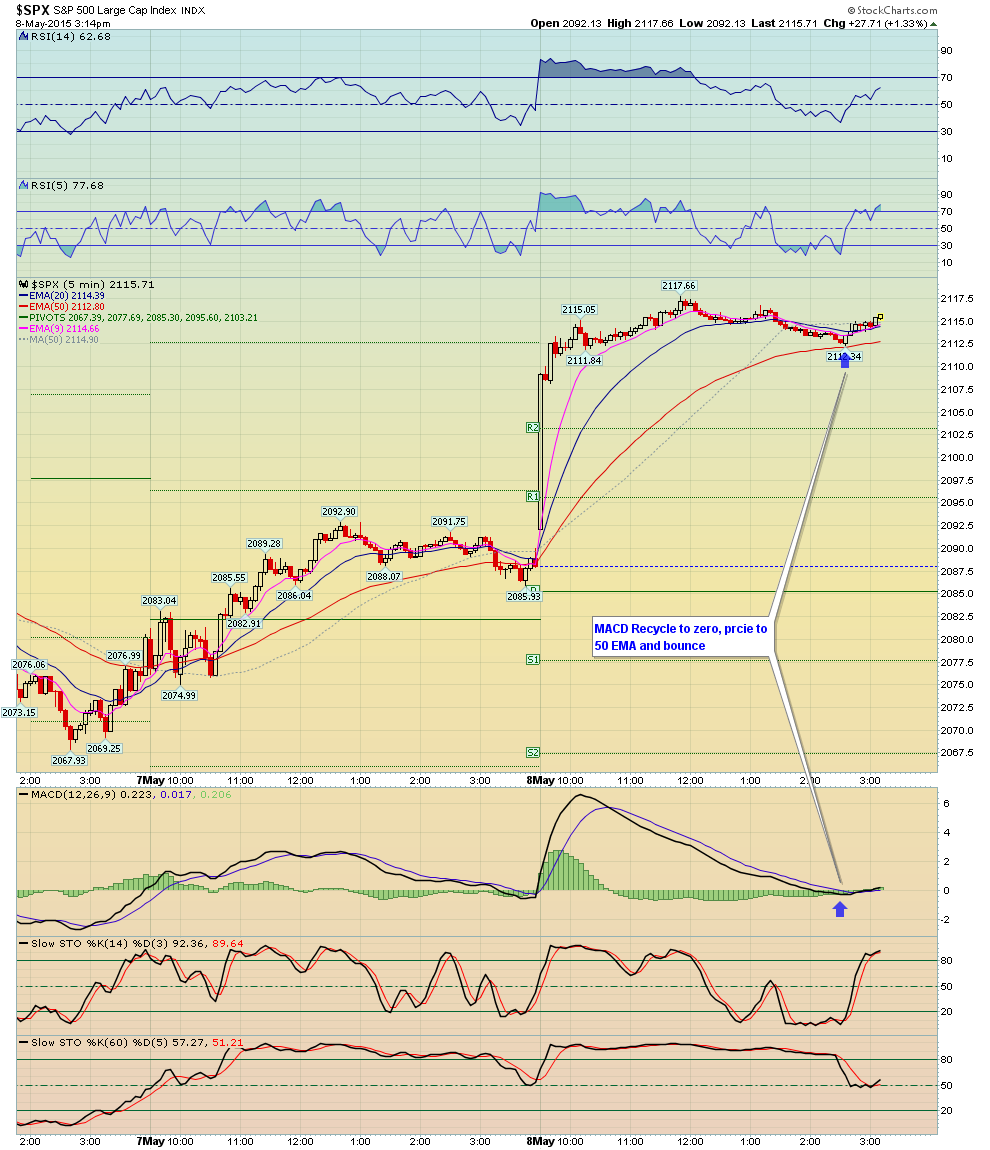
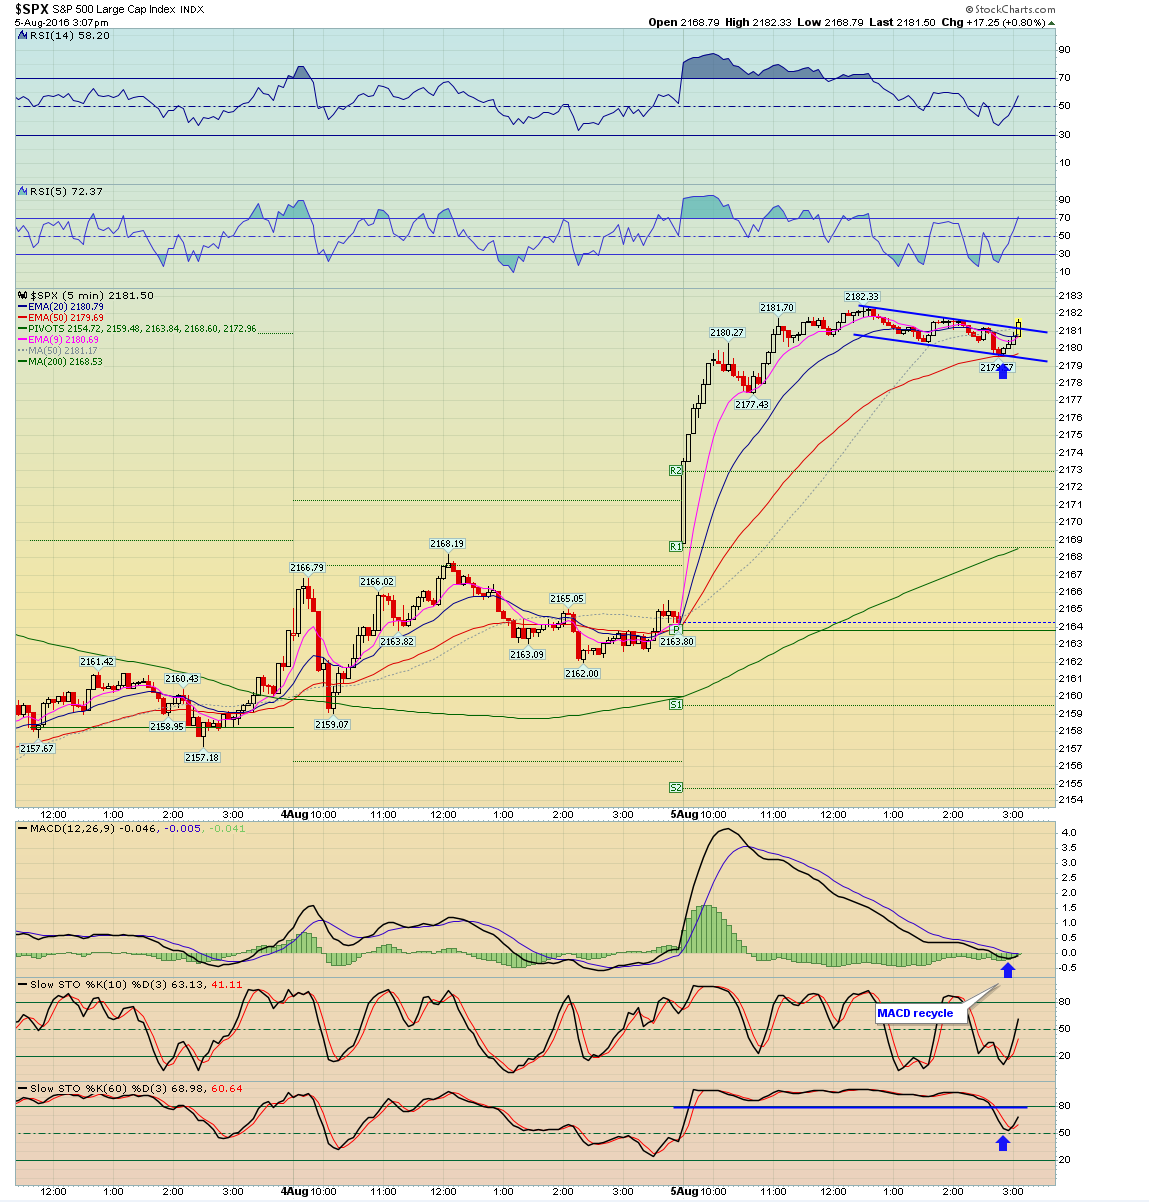
2. There is no attempt to fill the gap, one could employ a 15 - 20 min gap rule as a guideline (the low of the 15/20 min is not taken out), however one only has to look at price action. Price tends to gap and runs strongly higher for the first 2 - 3 hrs. Then price will will typically consolidate for a couple hours into the early afternoon, which in many cases allows price to recycle back to near the 50 MA.
The following statements below pertain to a 5 min chart of the SPX, SPY, or ES
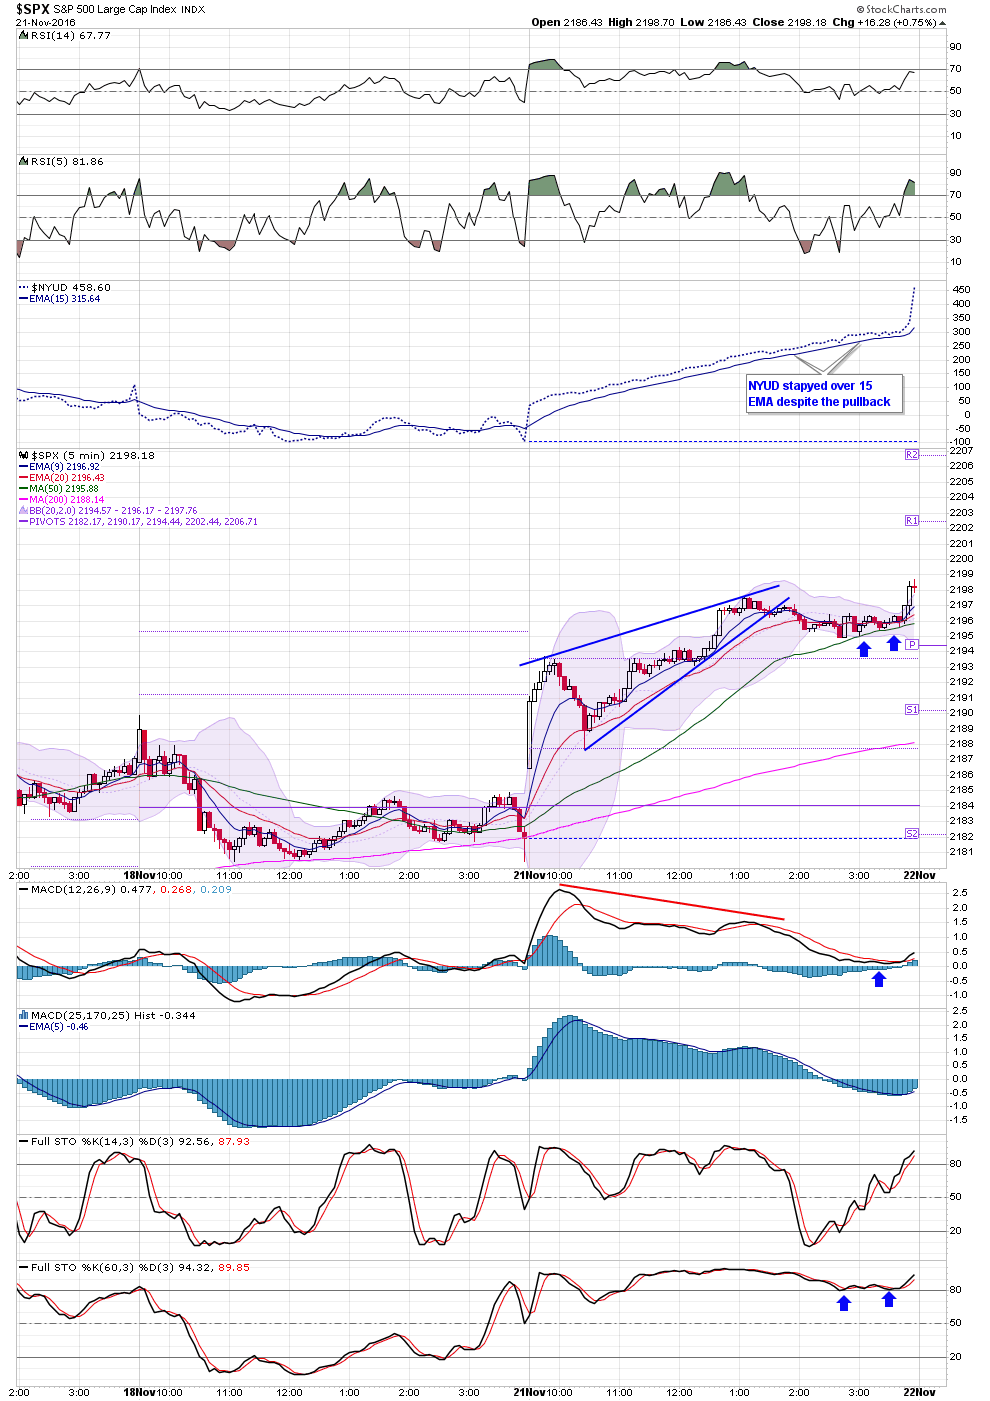
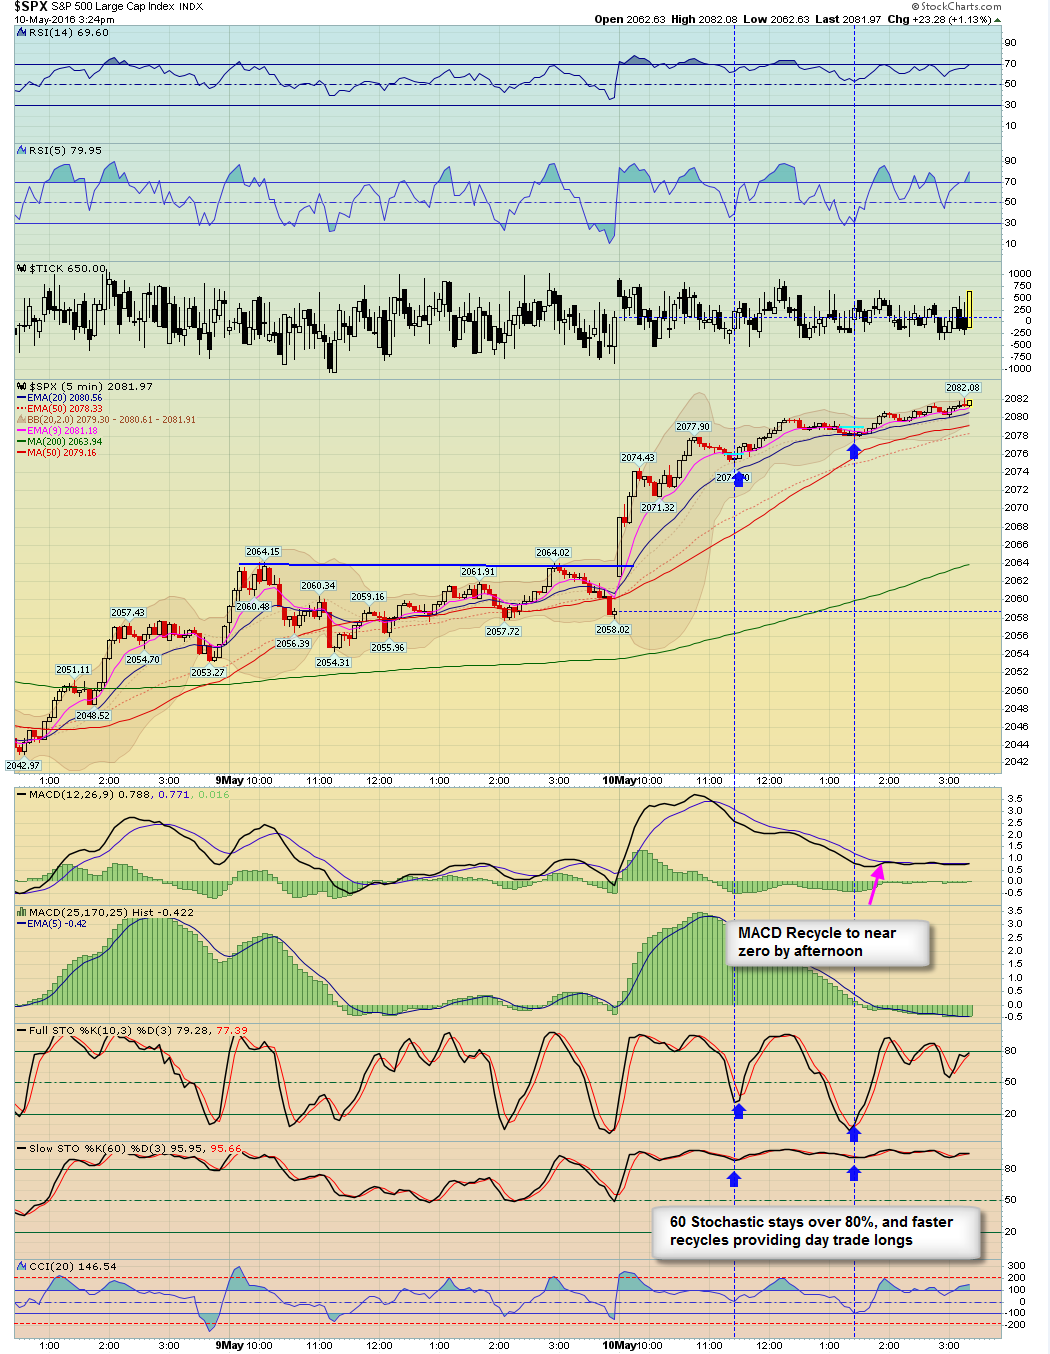
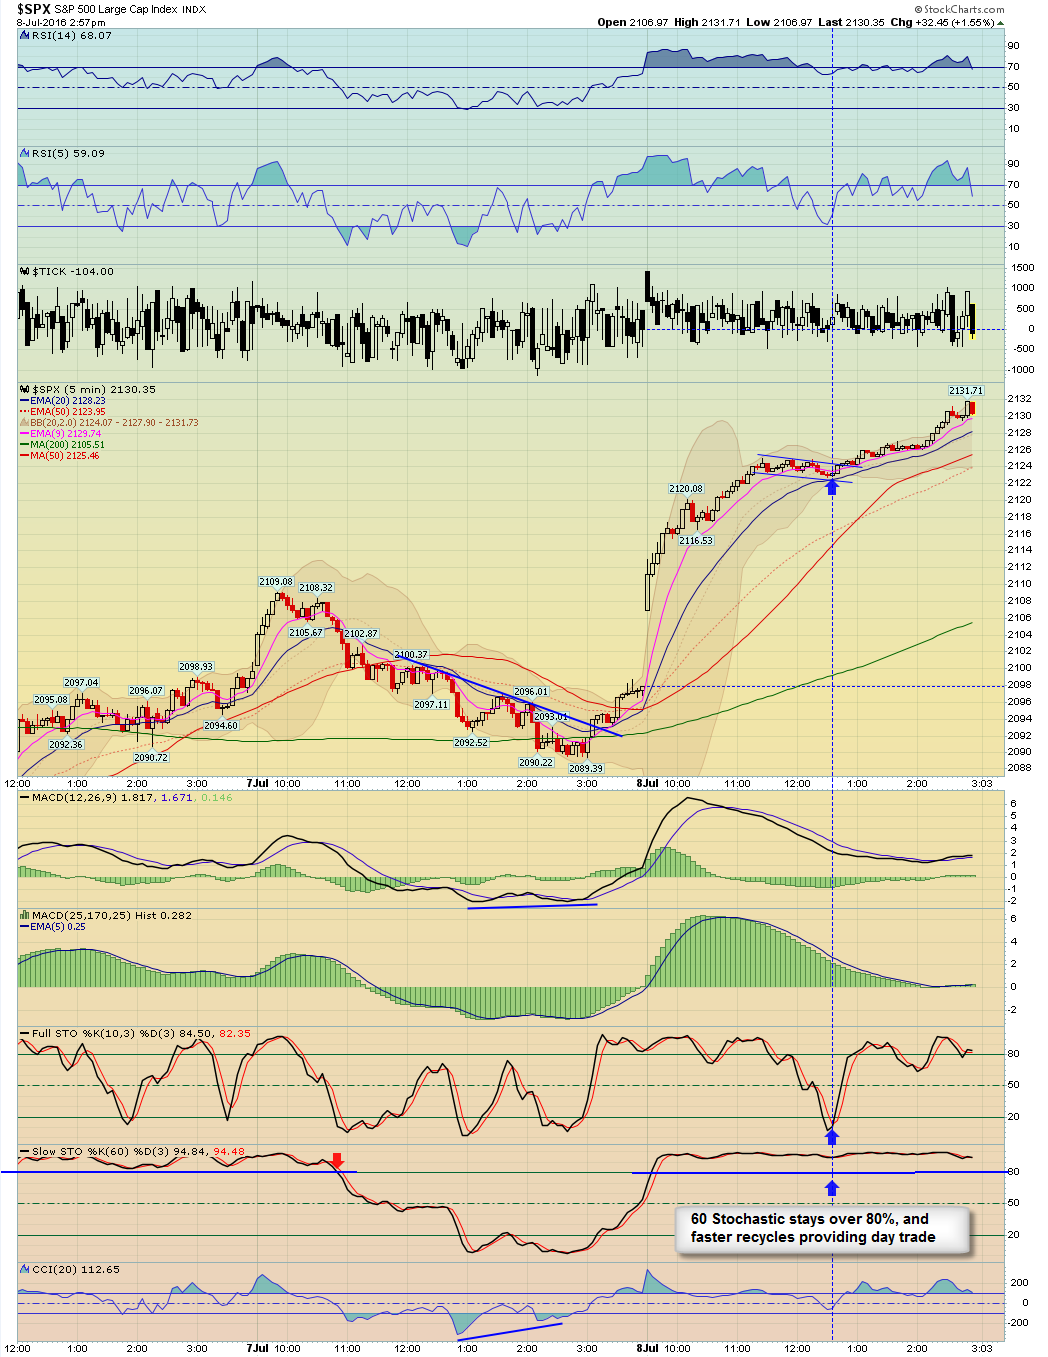
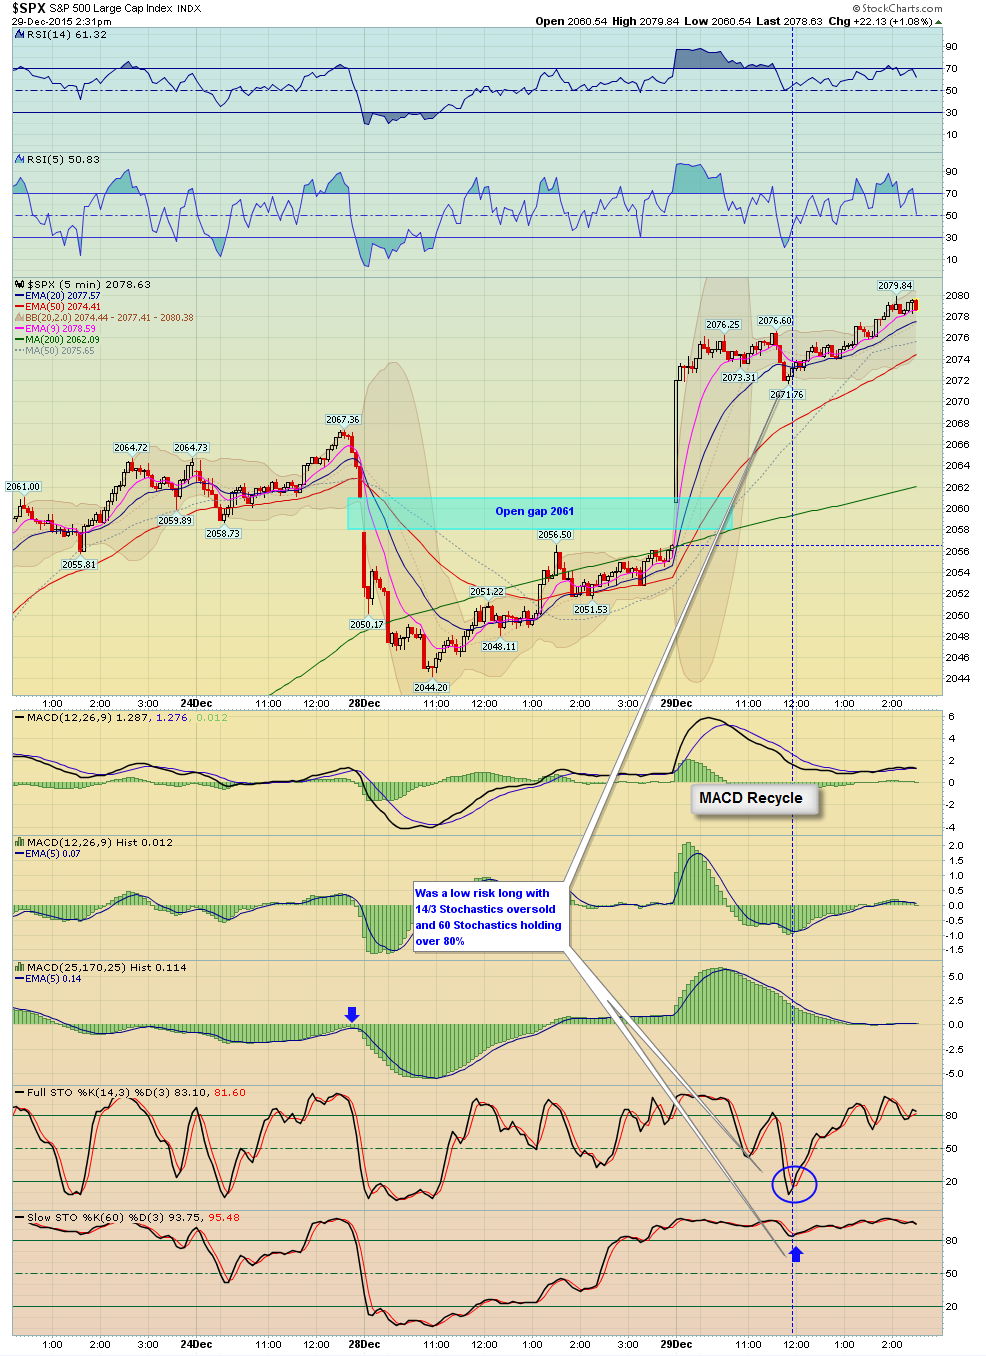
3. A 60 length Stochastic will remain over 80% for all day or most of the day (typically if it does fall below 80% it will be very late in the day)
4. A faster 10 length Stochastic is a nice guide, when it recycles to oversold conditions while the slower 60 length Stochastic remains over 80% provides low risk buying opportunities for day trades
5. MACD will push strongly higher for the first couple hrs, but will then recycle back to near the zero level by the afternoon, and price will typically try to make a new afternoon high with MACD divergence. By the way typically this divergent high will play out with a pullback the next day.
6. Price will generally remain above the 50 SMA, and many times price will recycle back and get close to this MA by the afternoon and many times is a low risk intra day buying opportunity.
7. The NYUD indicator will remain strongly over it's 20 EMA
2
3
4
5
6
7
8
9
10