Detailed Discussion on Max Consecutive Down Days on SPX and Dow
Disclaimer: Intraday Chart Links will show up as daily charts unless you have an active stockcharts.com membership and are signed in, you can sign up here.
1
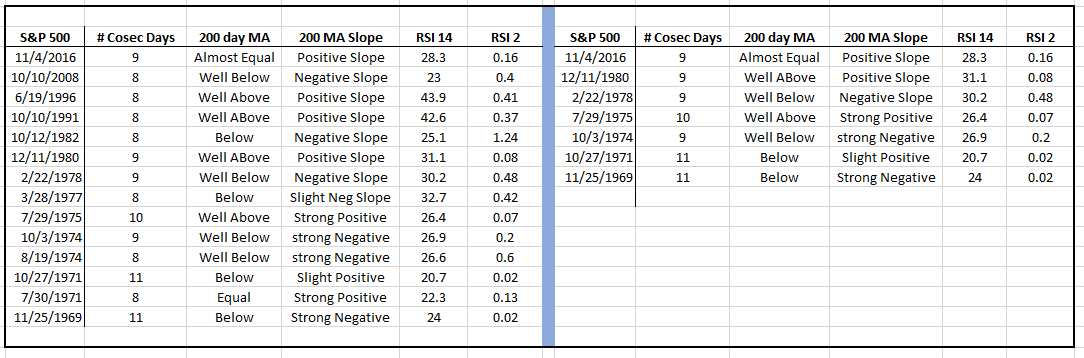
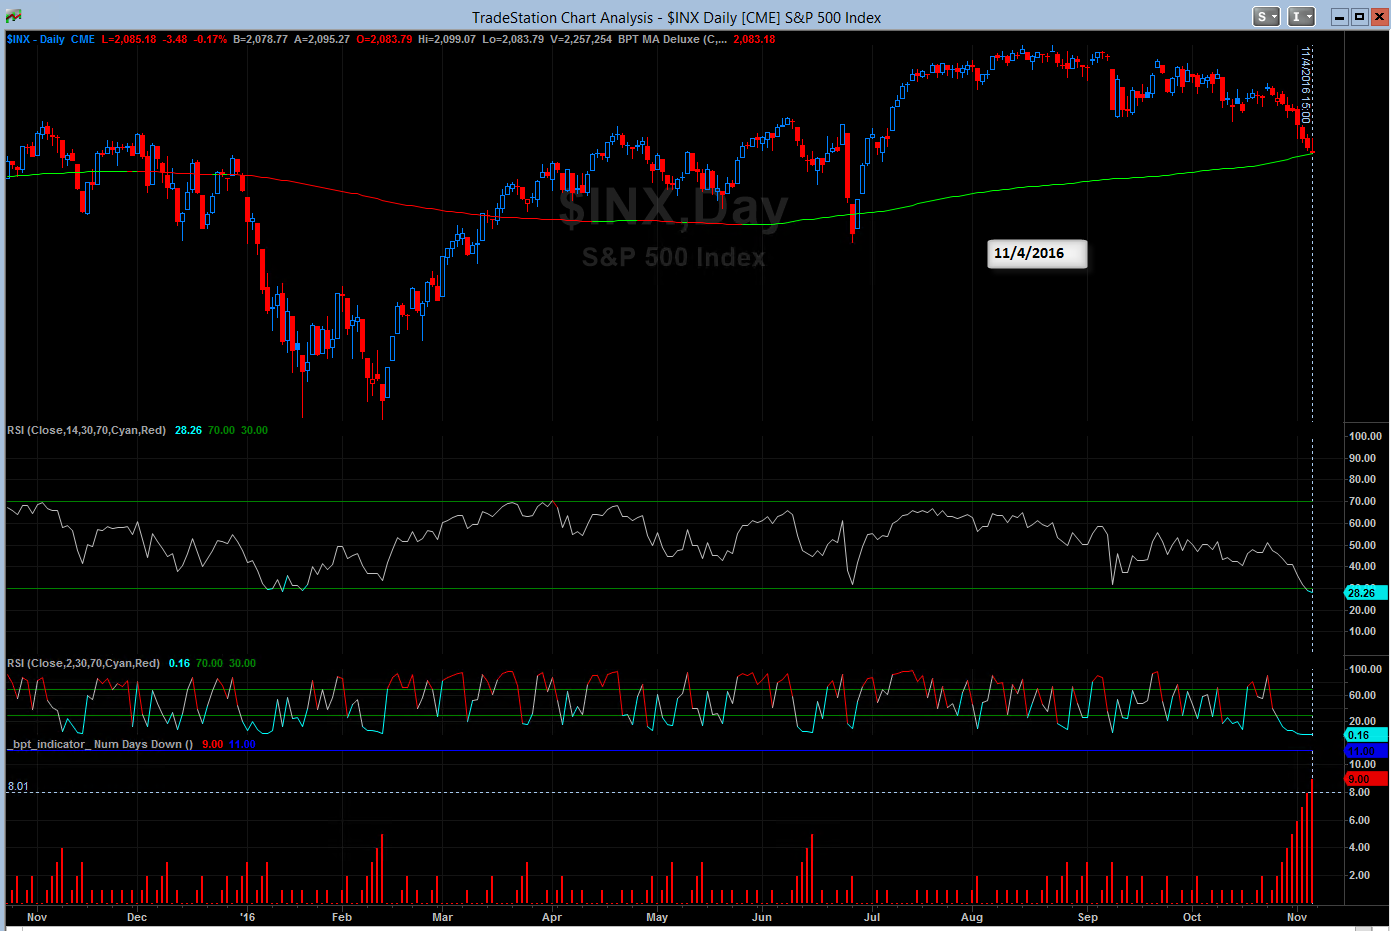
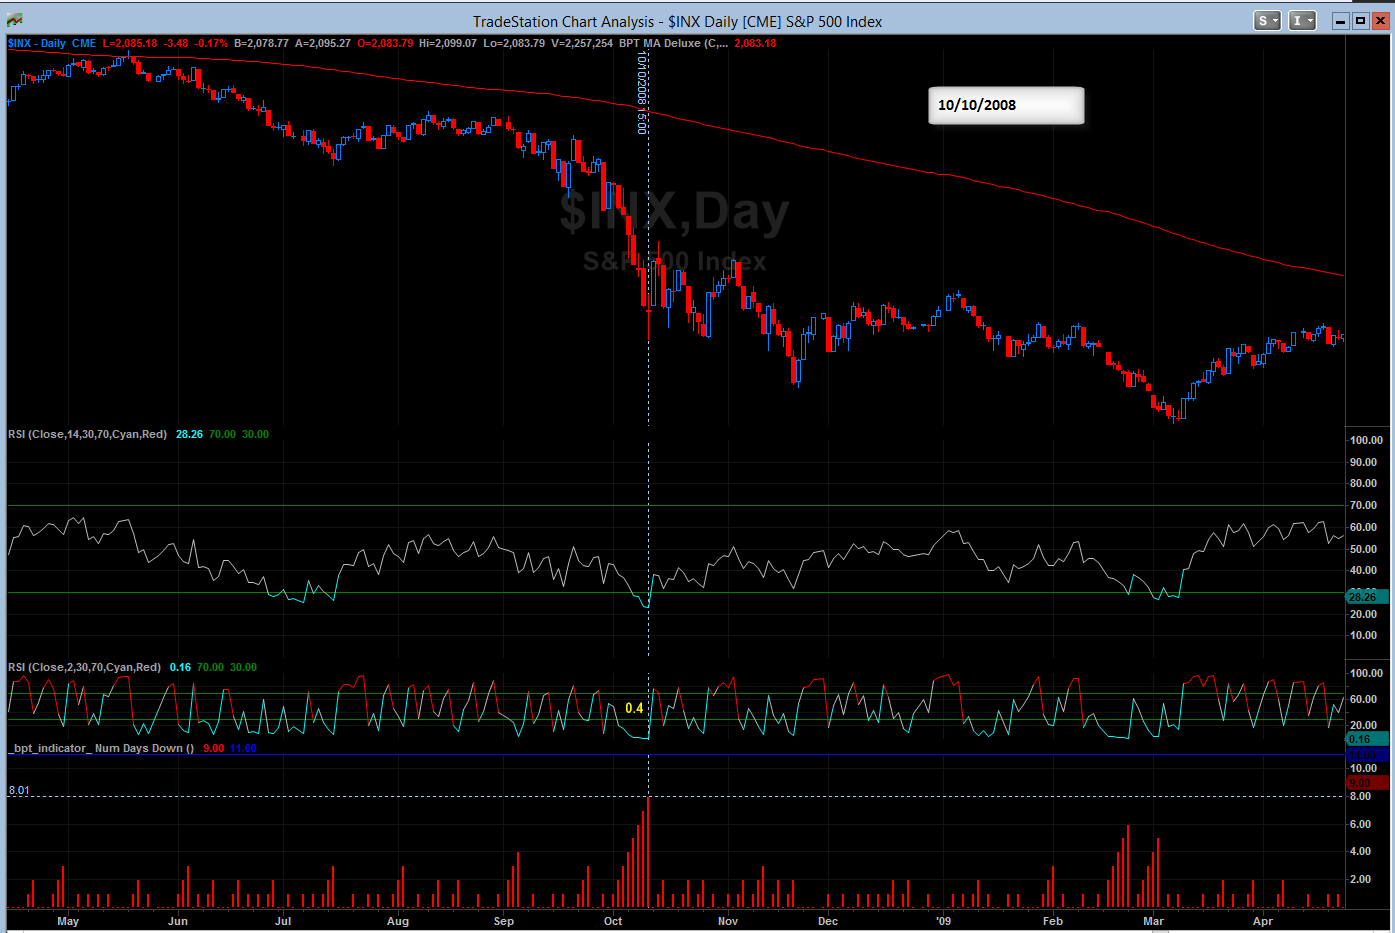
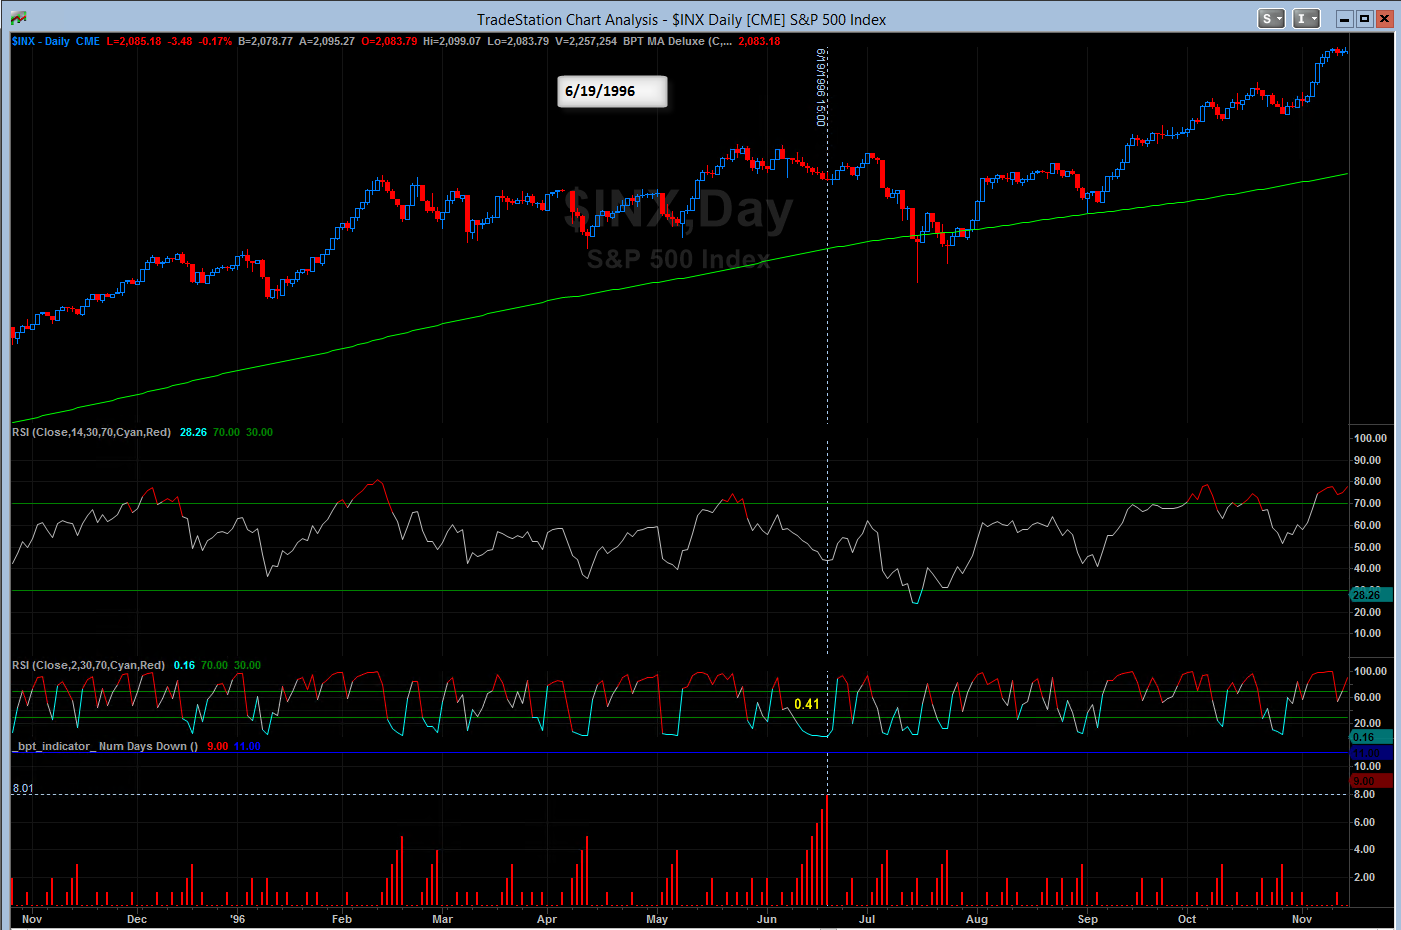
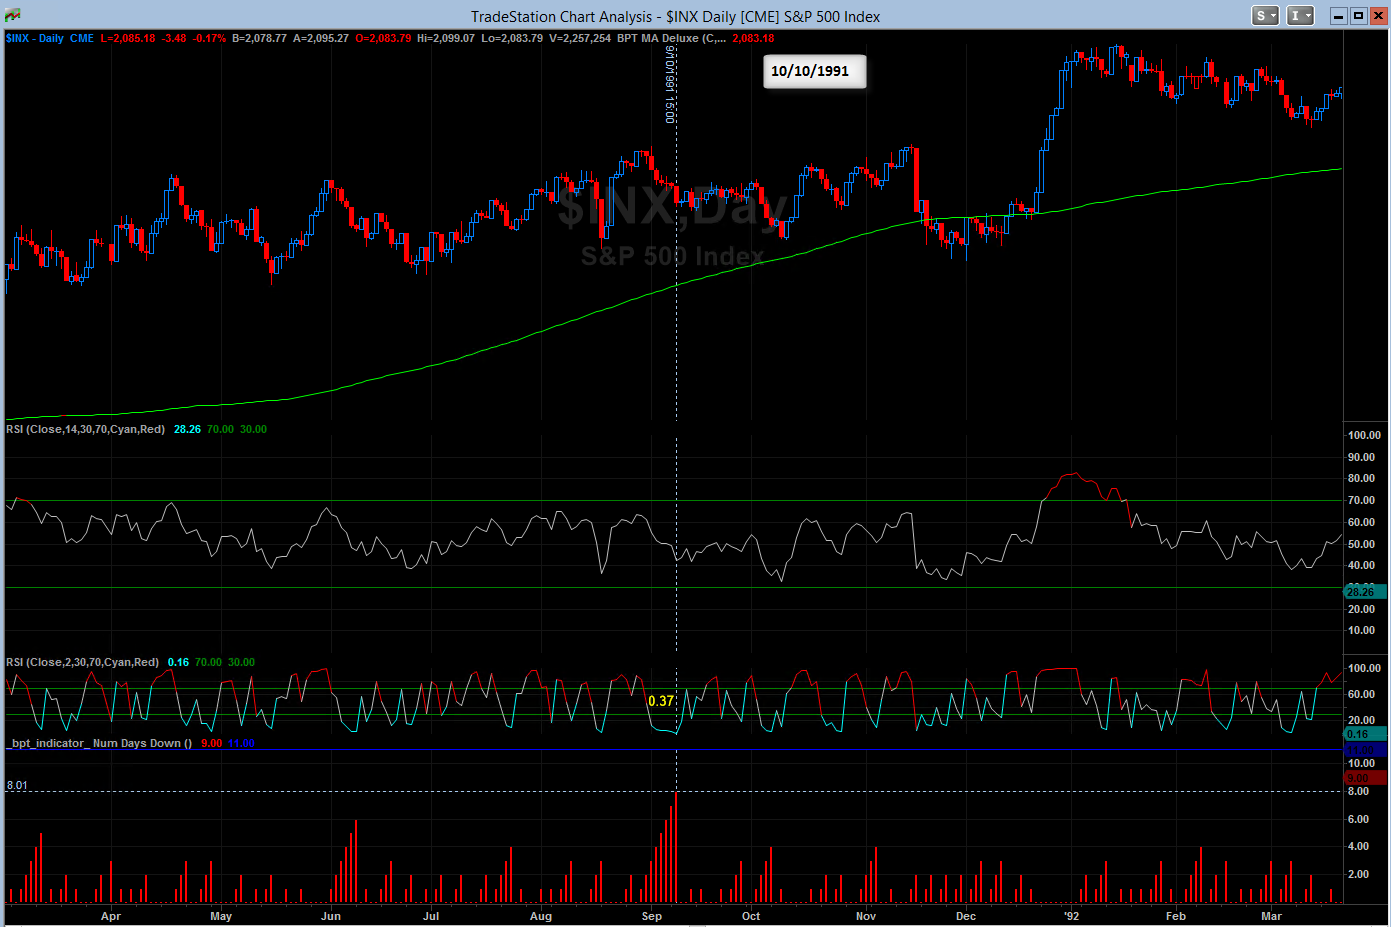
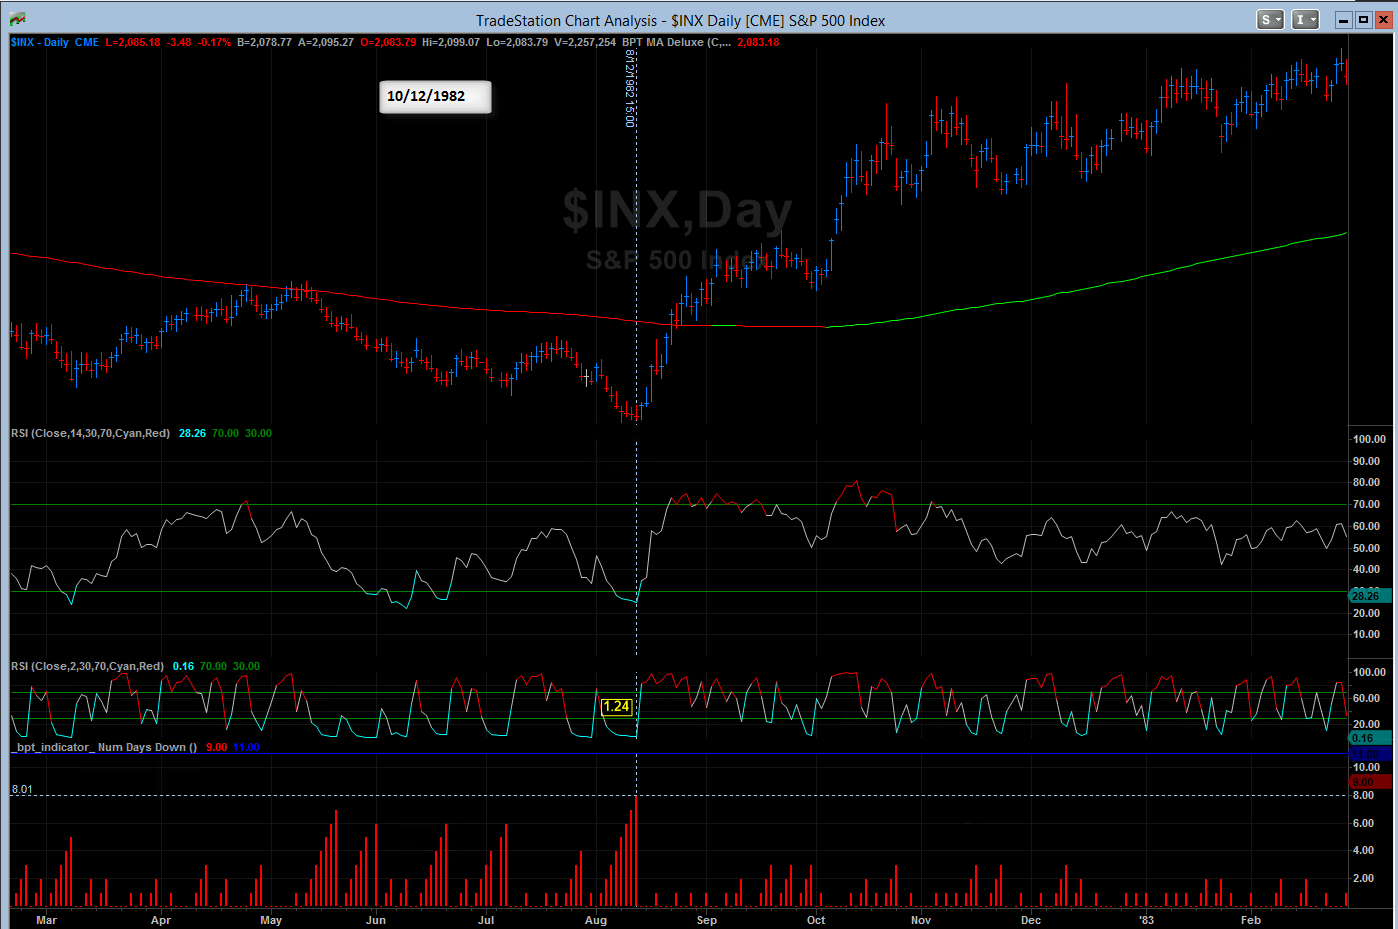
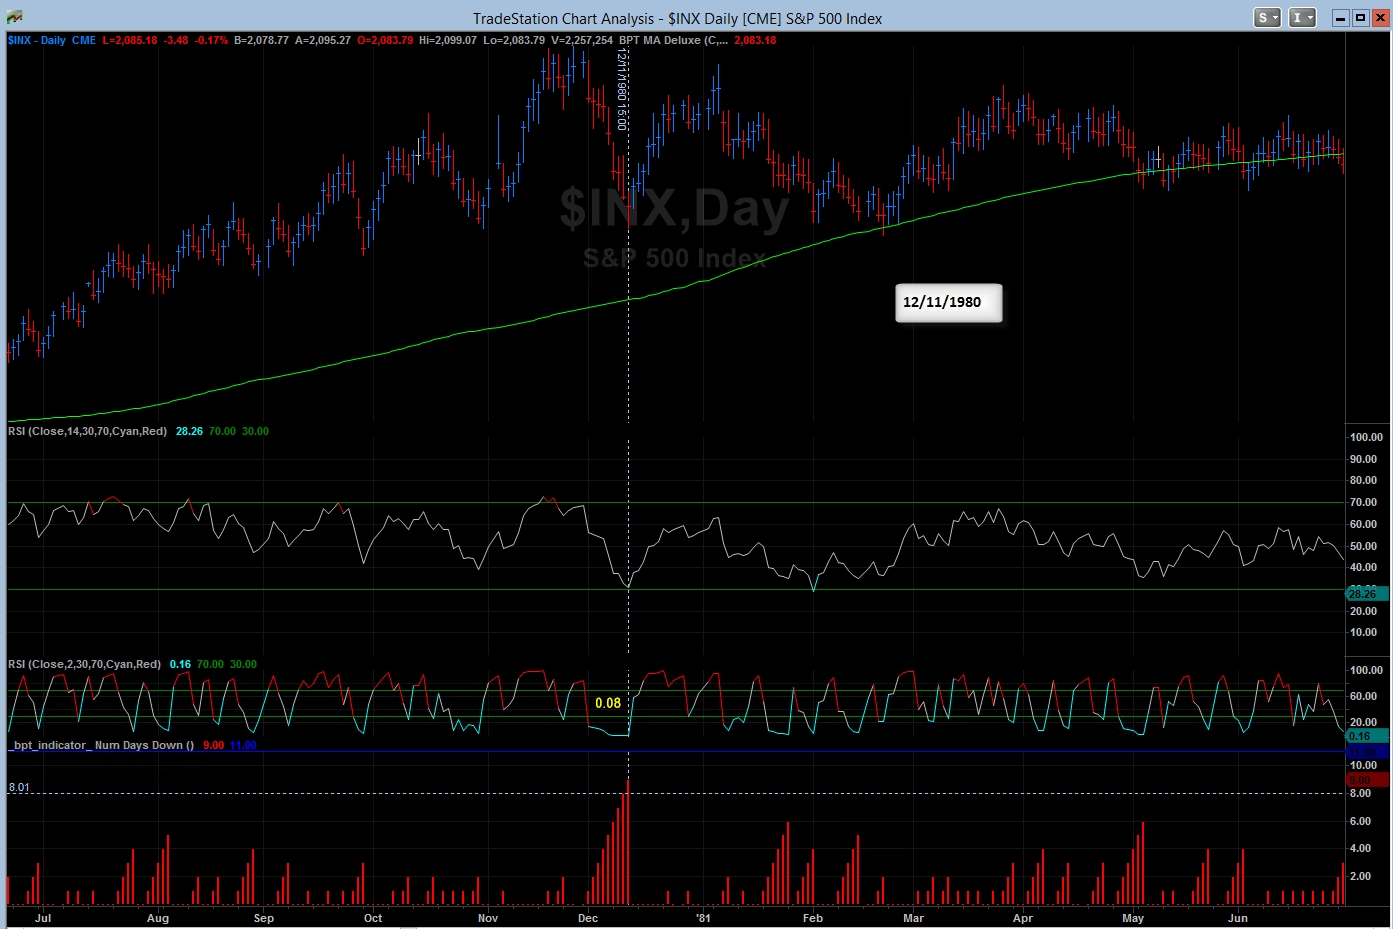
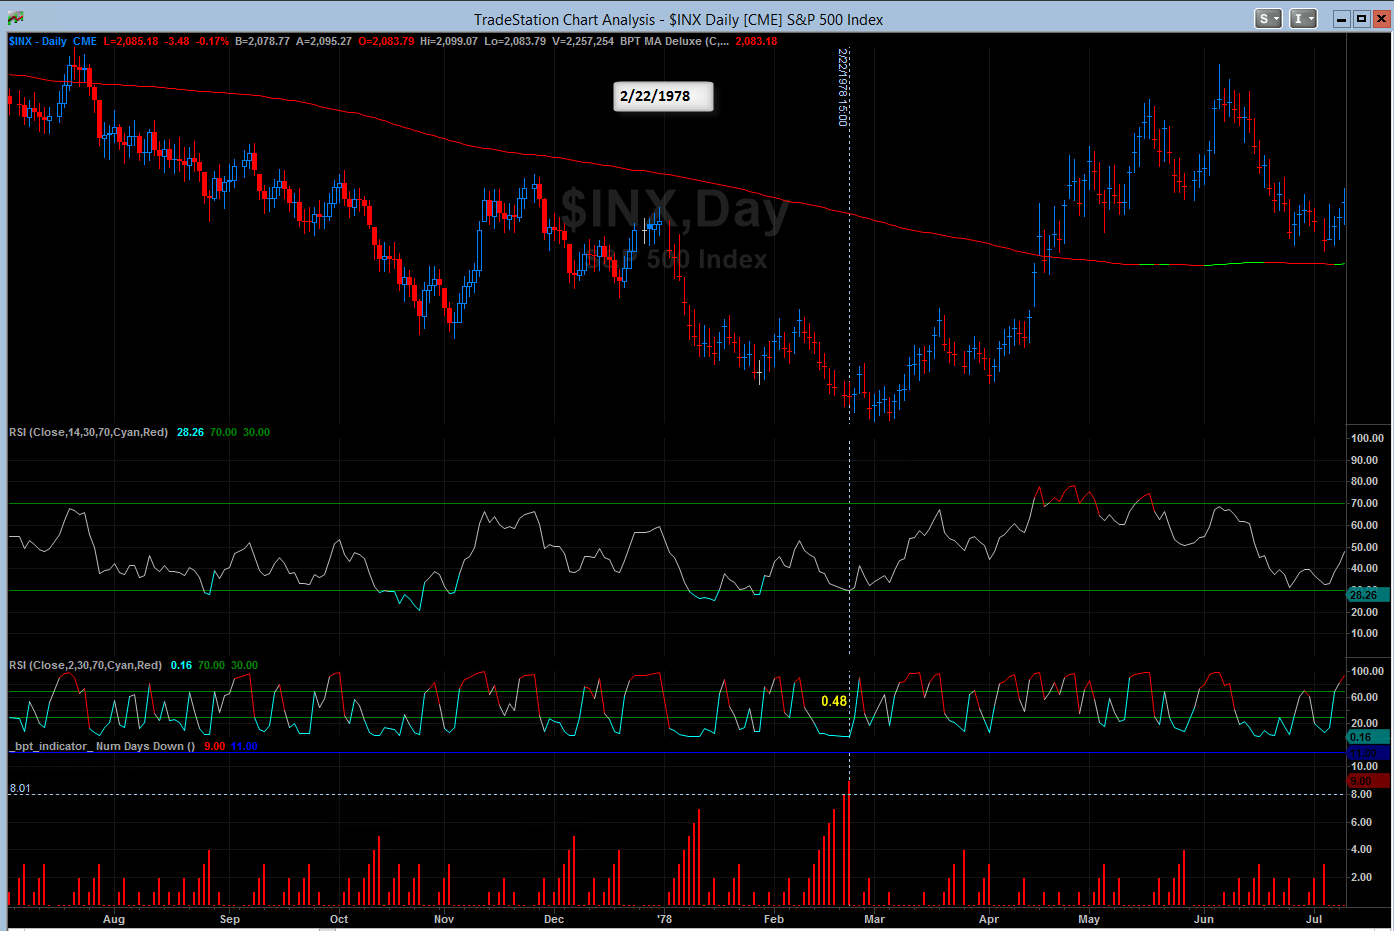
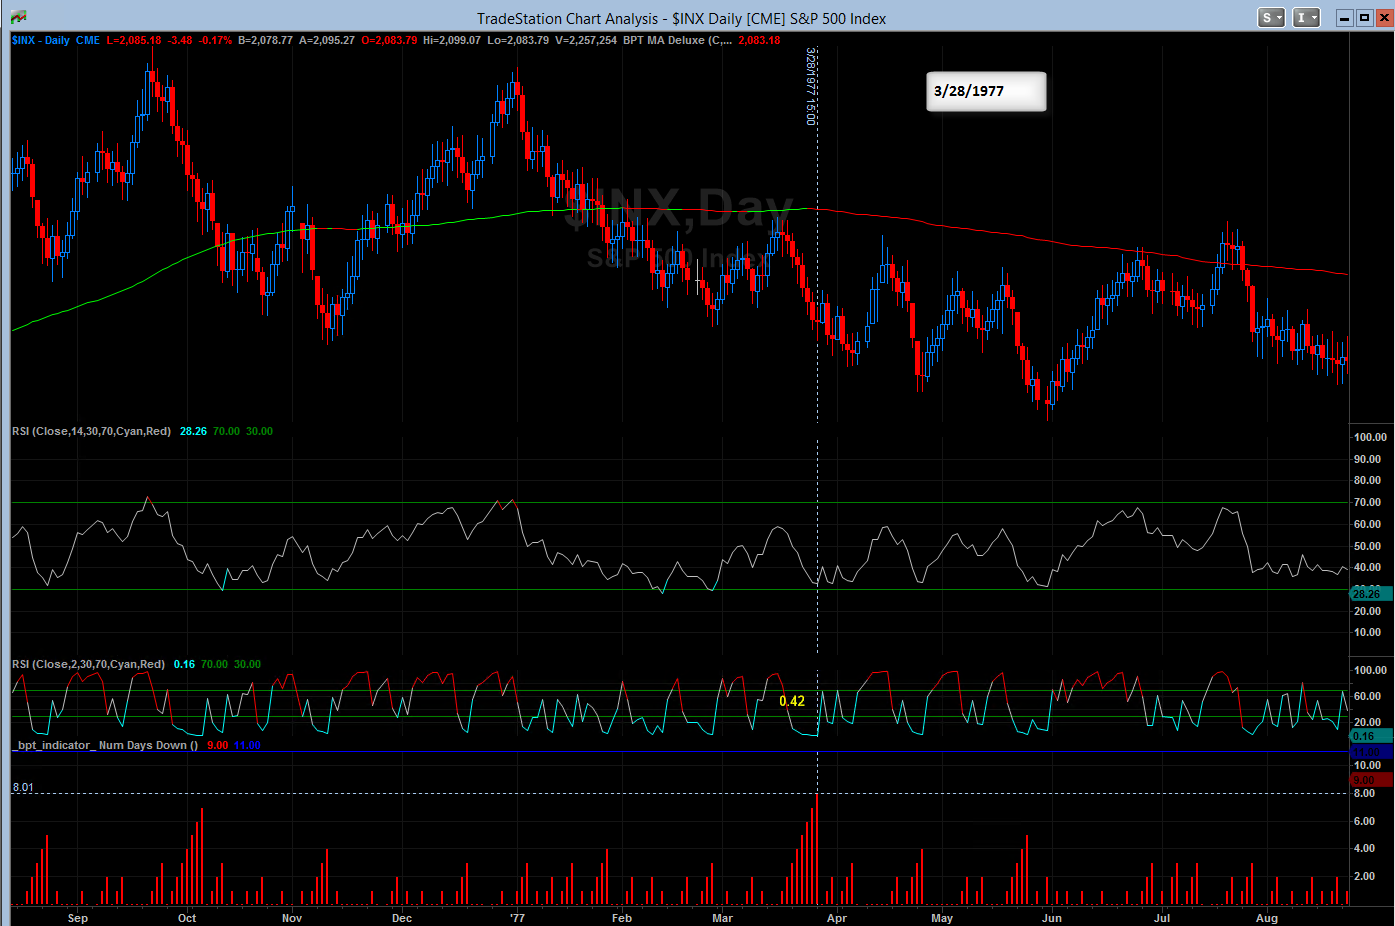
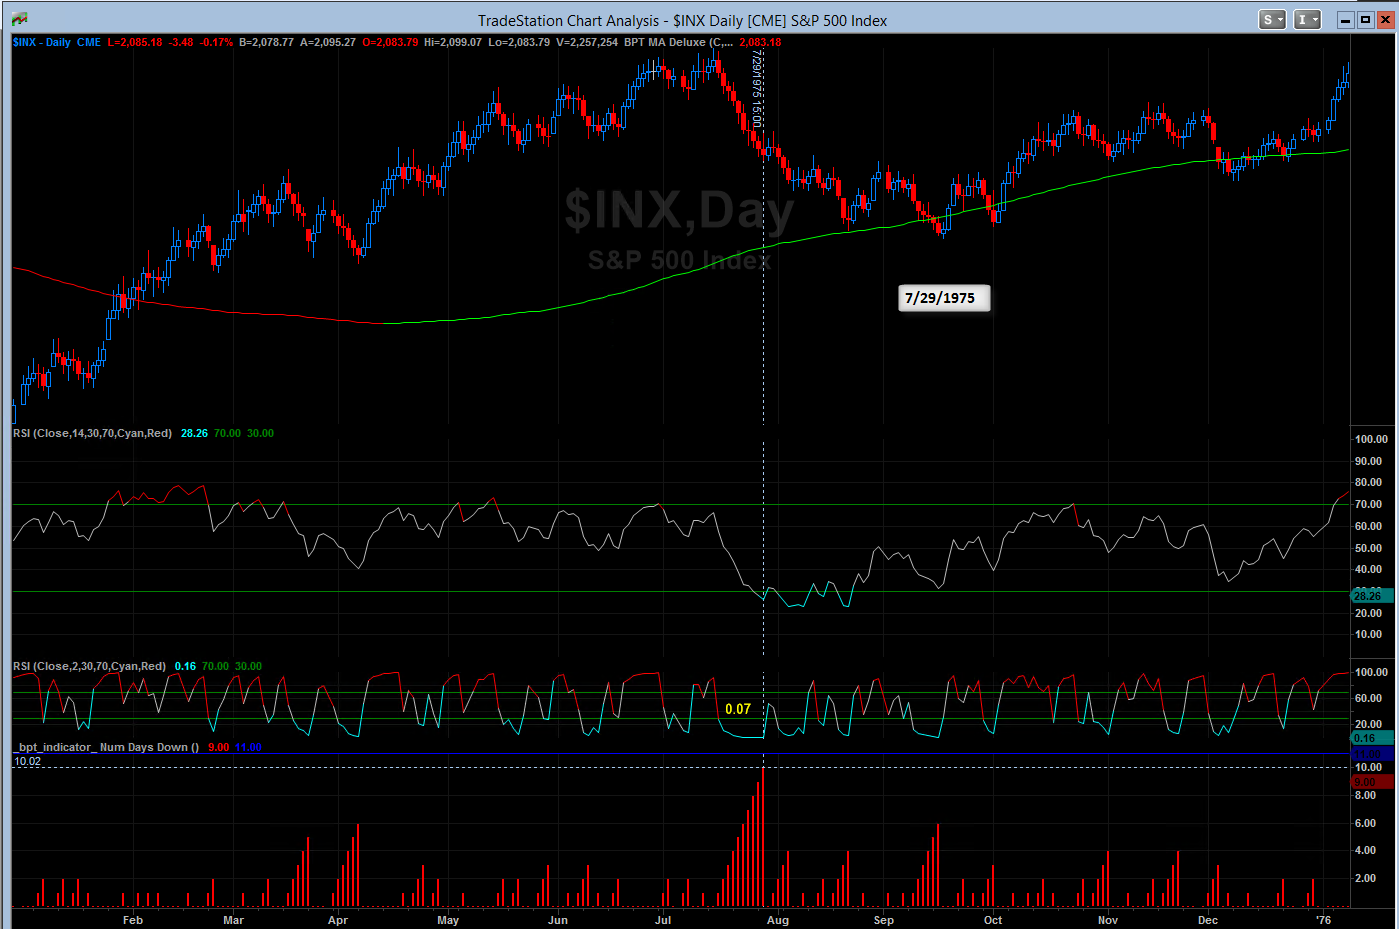
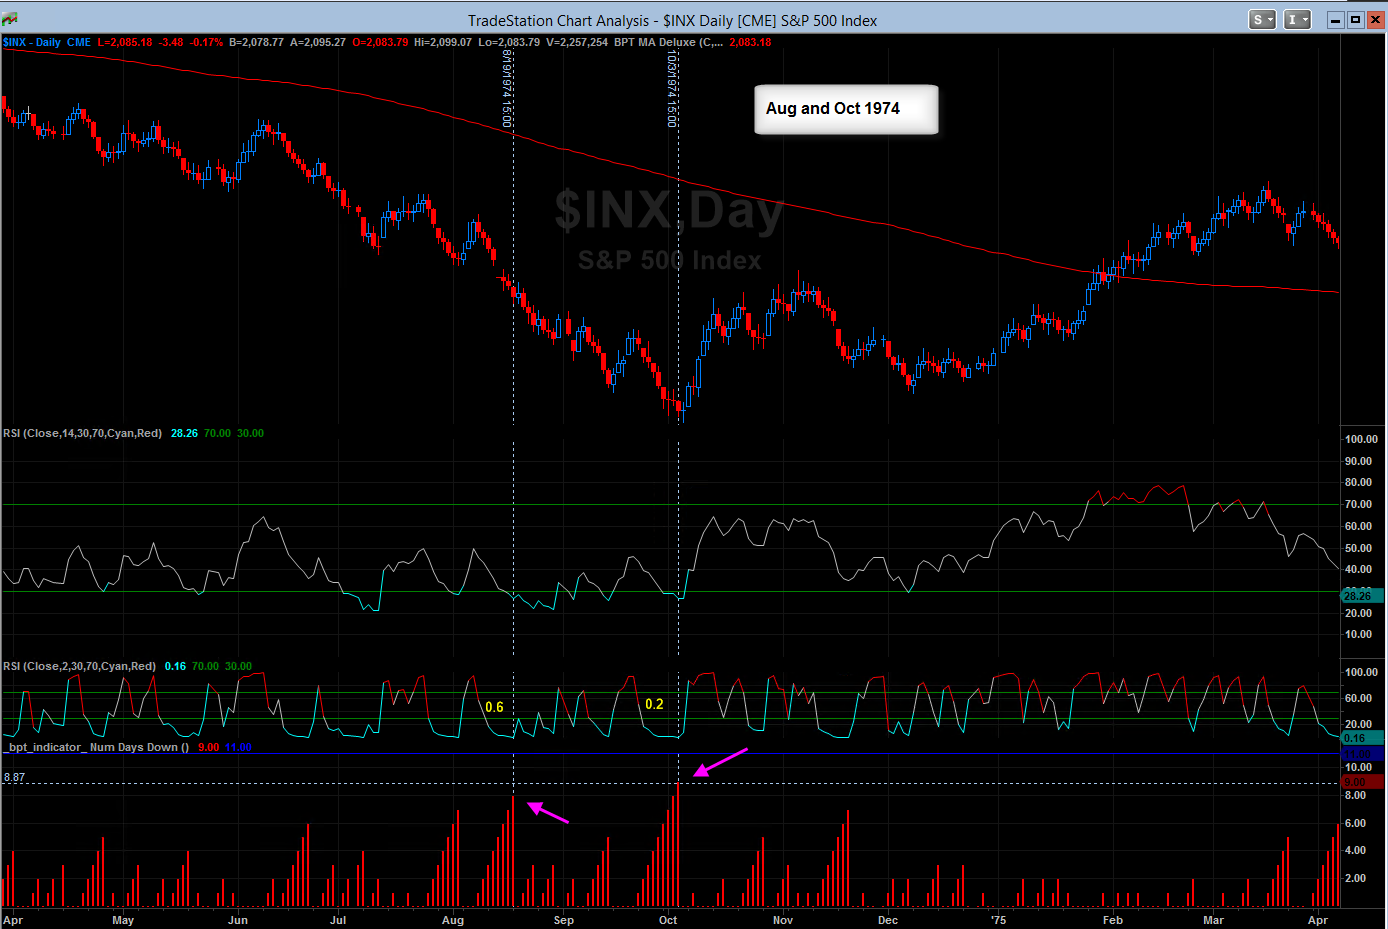
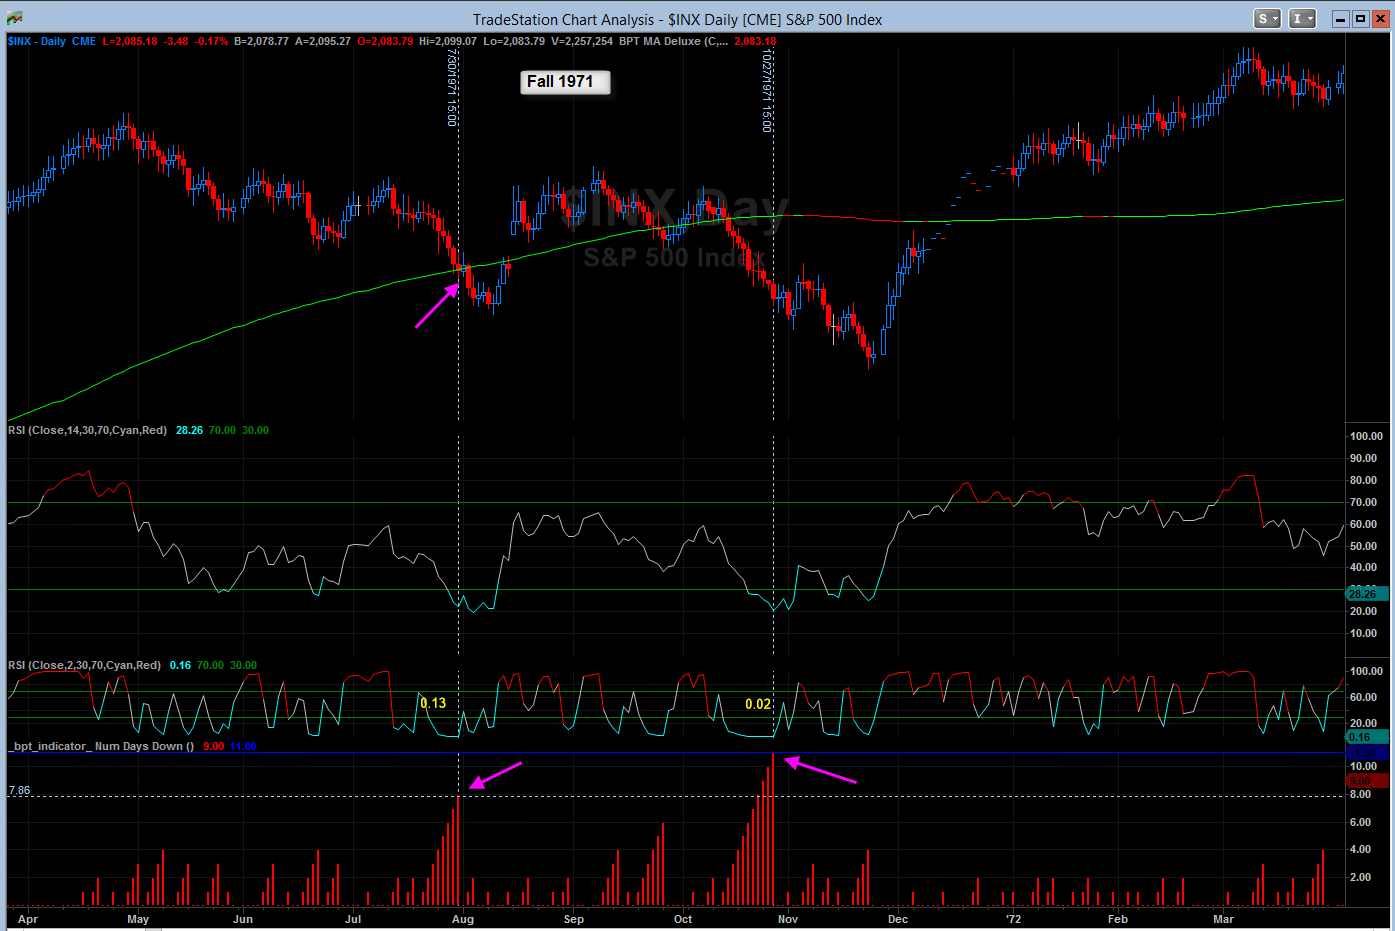
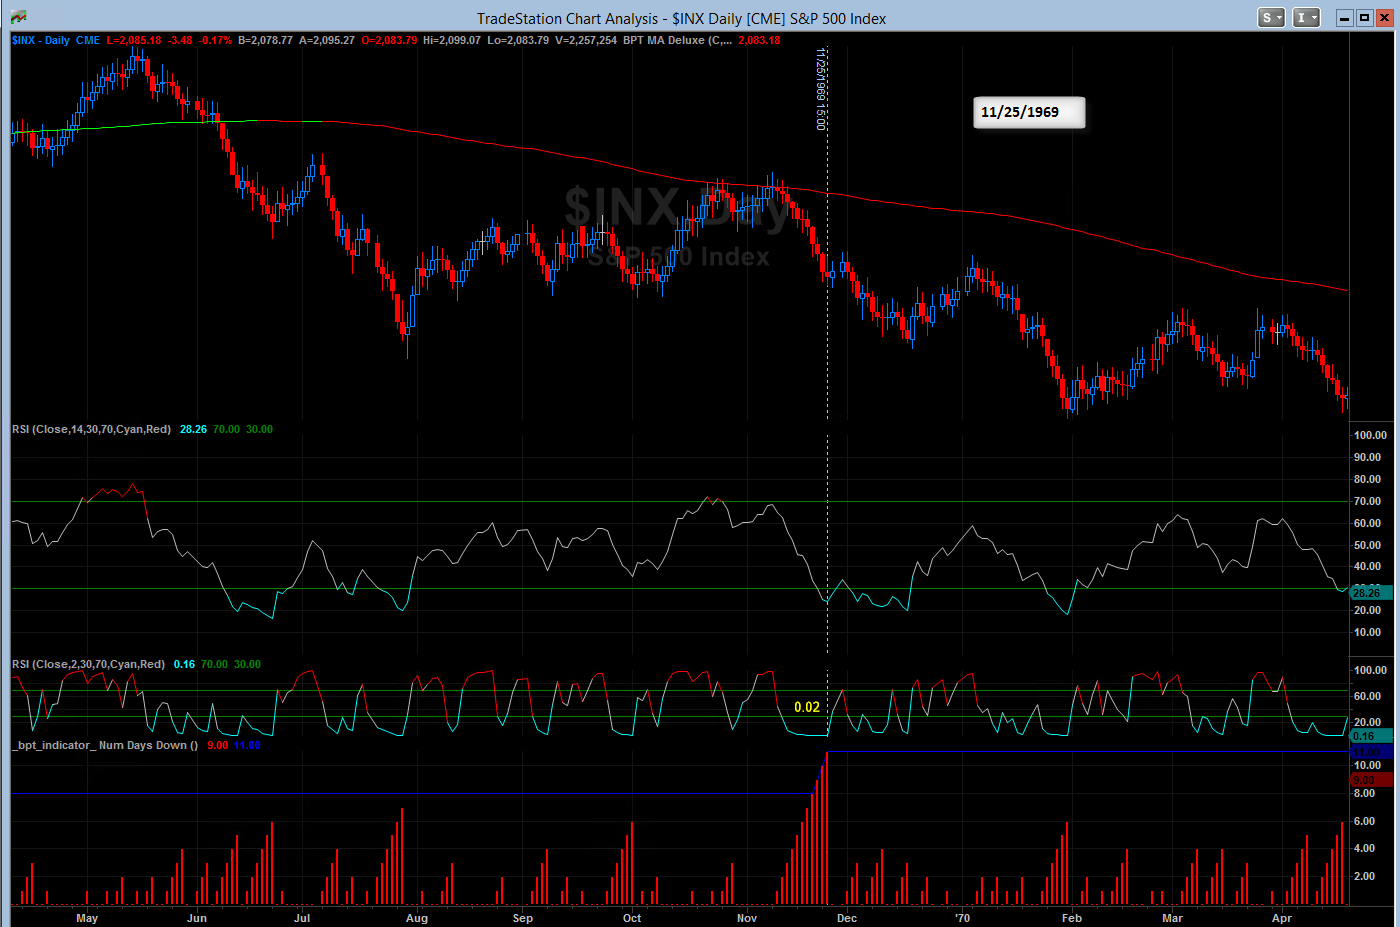
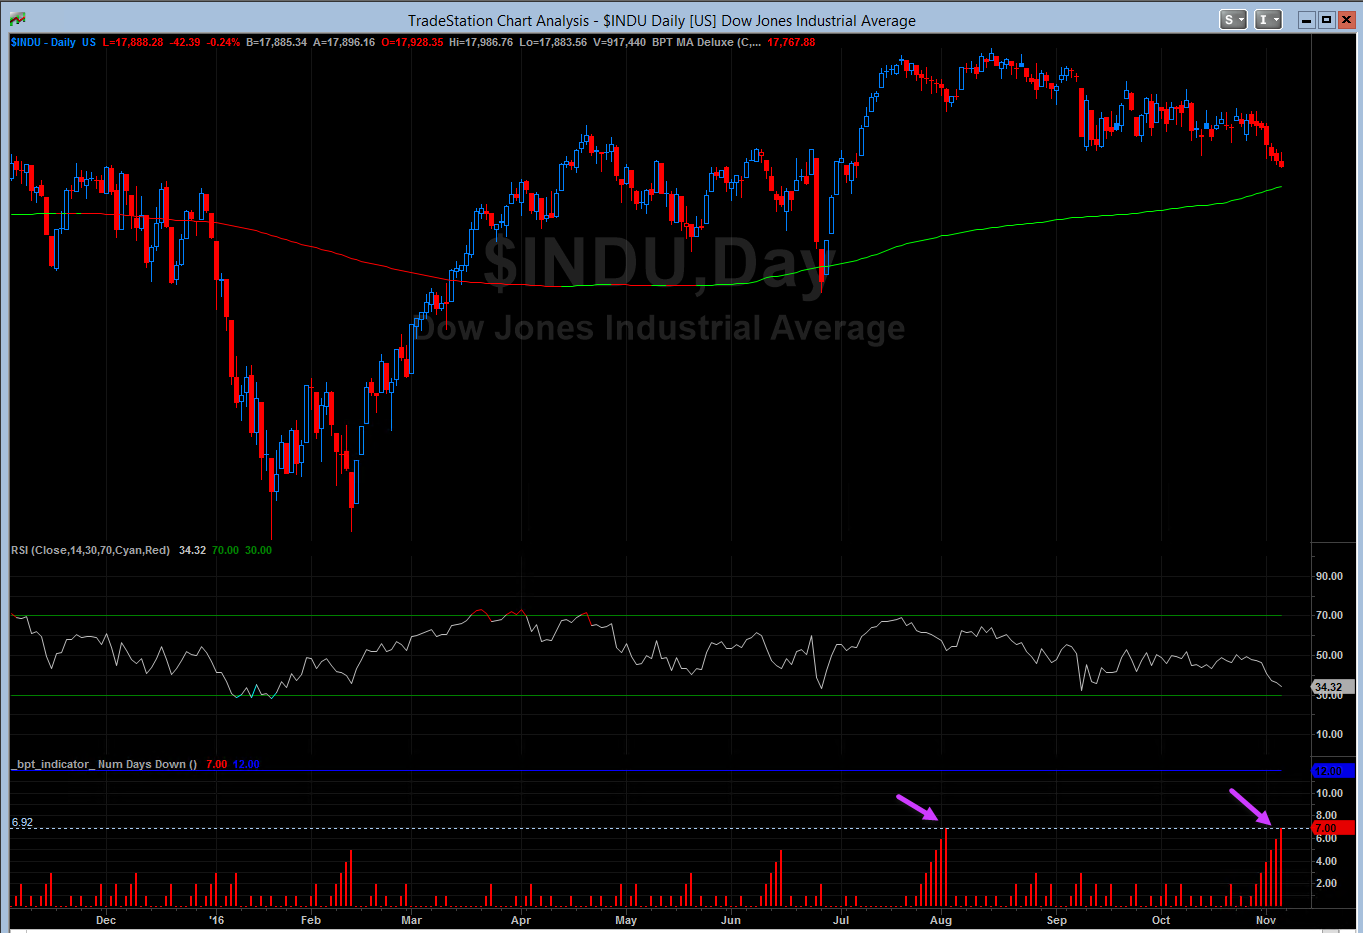
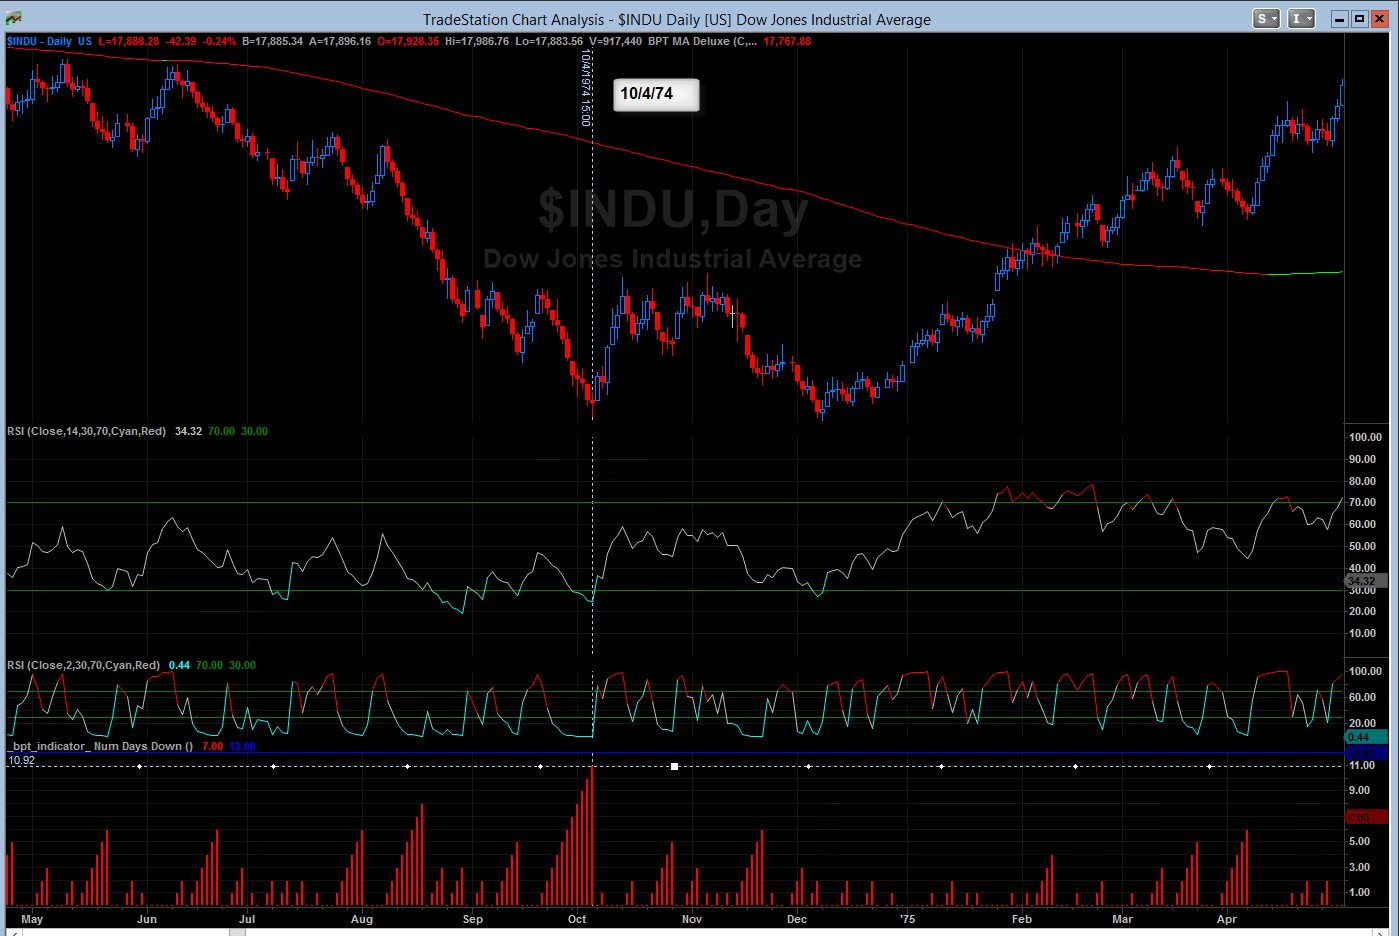
The table below shows dates as well as the status of a few key indicators, when the S&P 500 has had at least 8 or more consecutive down days in a row going back 50 years! The table on the left data shows 8 or more consecutive days, while the table on the right only shows 9 days or more, all presented in descending order by date. Also below I show the chart for each date listed below and on each chart I list the 200 day MA along with the RSI 14 and RSI 2 indicators.
Please listen to my detailed audio discussion as I also show what happened on and after each date these selloffs occurred
----
2
3

4
5
6
7
8
9
10
11
12
13
14
15
16
- Hide Player Link to Newsletter Audio
Update Required
To play the media you will need to either update your browser to a recent version or update your Flash plugin.