Hello everyone and happy Sunday, I hope you are having a nice weekend! Regarding the newsletter that will be posted late afternoon, and I'm also planning to do a Youtube Video as well.
However here's a simple chart I posted on the Trading Community regarding the market in the short-term, trying to make it as easy or as simple as I can make it.
First off last Thursday Steve and I both called the wave b bear flag bounce, which is why we went home short on Thursday despite the Jobs report coming out on Friday as we viewed Thursday's bounce as a bear flag wave b, which played out on Friday's open.
Now what??
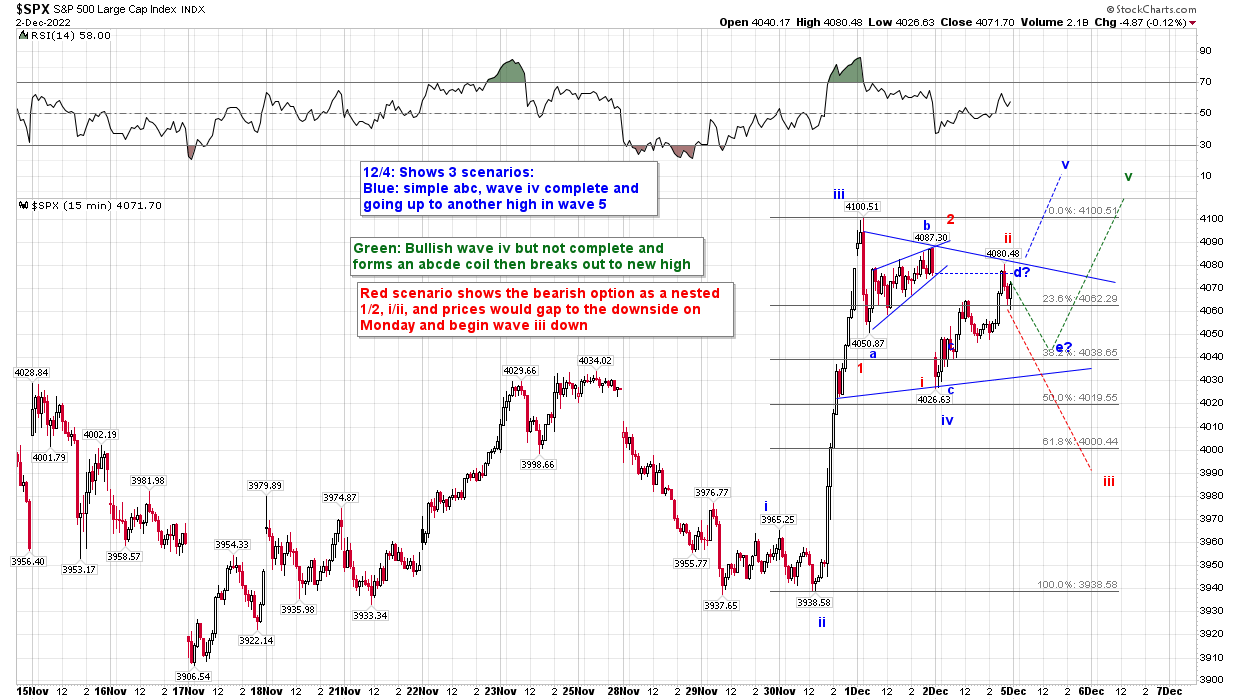
Here's a new 15 min chart, I show 3 scenarios: two short-term bullish ones and one bearish one in Red.
1. Blue scenario shows a simple abc completed wave iv, and we should go up in wave v right away on Monday
2. Green scenario shows an wave c completed on Friday morning but the pattern is going to form a more complex coil abcde pattern, wave d and e and then break out to a new high
3. Red scenario shows the bearish option as a nested 1/2, i/ii, and prices would gap to the downside on Monday and begin wave iii down
since the move has been up and the 'bulls' have the football, I lean to one of the bullish options. Again by bullish I mean short-term, not long term
Matt