Good evening everyone, here
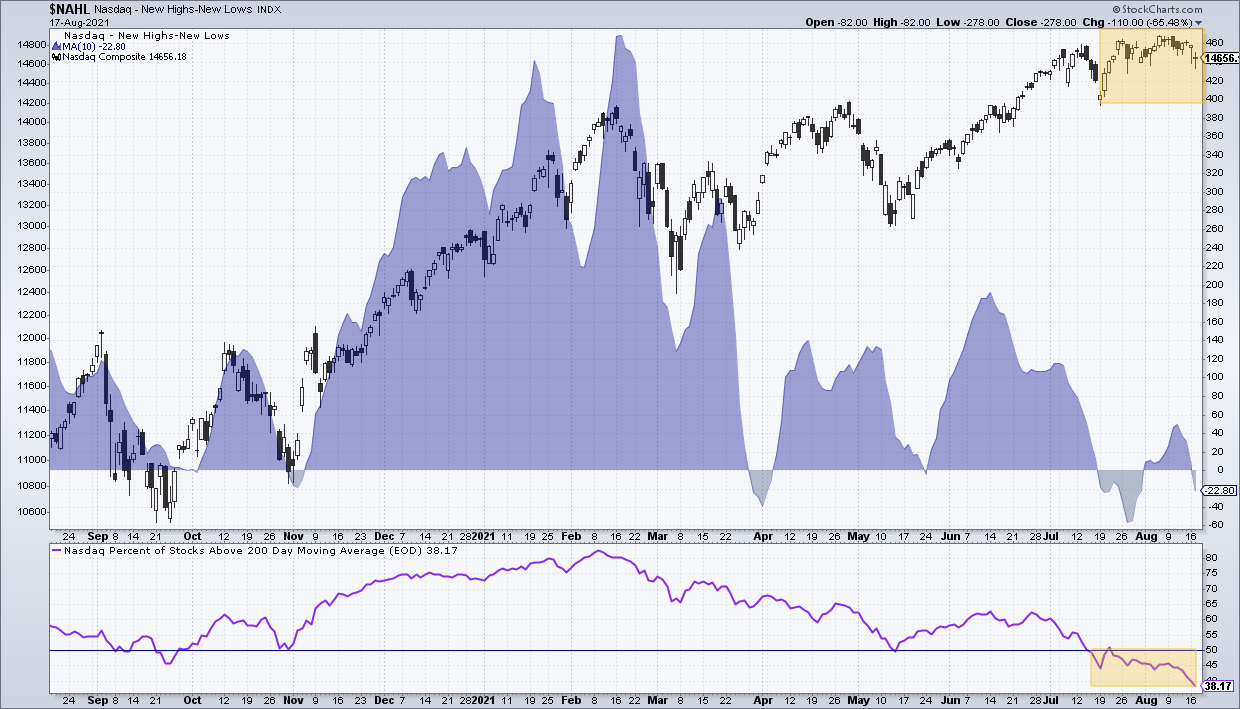
As you know I've been discussing this chart for the past few trading sessions, the NAHL and the % of stocks in the Nasdaq above their respective 200 day MA. Here's a video showing a more in-depth discussion of this indicator and how it behaved in the past. Most of the time in the past by the time this has fallen to less than 40%, the market had already been down trending for a period of time, not like it is now only 1.5% off the highs LOL
NAHL chart