System Overview:
This is a long term trend following mechanical system based on the S&P 500 going back to 1961. The system utilizes a monthly chart of the SPX and a variety of power indicators and price action that are designed to catch and keep one invested in major bull market runs, but also signal you to get ‘out of dodge’ whenever it signals an on coming bear market. This system has caught every major bull/bear market and greatly out-performed simple buy and hold, which the majority of ‘lazy’ financial advisers have their clients follow today.
The system is a long term system mainly suited for non-traders such as mom and pops and family and friends, who are simply trying to manage their 401K or IRA retirement accounts and want to greatly outperform the ‘buy and hold’ mentality of their peers and the mantra on Wallstreet that most brokers and investment advisers still preach and practice. However this system is somewhat boring, and what I affectionately call my ‘paint dry system’ because it is like watching paint dry due to the length of time in the market, see the statistics tables below. Therefore again, this is not a system for those of you who want and crave action, however as you will see from the table of statistics below, as well as the video, the system has done very well and you will greatly outperform the masses via this system because it keeps you from taking the large 30% – 60% draw downs in your account that can take many years to recover from. For example those who held their market related mutual funds through the horrific 2008 bear market took until late 2013 to get back to break even! However if you avoided the 60% decline of the bear market in the safety of cash, your account would be up 170% vs just over break even for the buy and holder!! This is where the power of this system come in, avoiding the bear markets. The market goes up over the long haul in a stair step formation, if you can avoid the down steps (bear markets) your money will grow exponentially faster than your peers over the long haul.
Statistics:
Note the two tables below, one is long and short, and one is long only, which would mirror the average 401K where the person does not short, but simply goes to a cash/money market account when the system signals an exit. Note the comparison between buy and hold vs this system, there is no comparison.
Key Statistics: See the tables below:
– A $10,000 initial investment from Nov 1962 turned into $2.65M or 265 times the initial investment, vs only $370K or 37 times the initial investment for traditional buy and hold.
– The system is typically in the market for an average time of 38 months and in cash for 10 months
– The 2nd table below accounts for interest that would have accrued during the times that the system was in cash, the compounding effect over time adds quite a bit a of return, see the 2nd table, the initial investment gained 437 times the original investment vs only 37 times the initial investment!
– If all investors (non-traders) and traditional financial advisers simply followed this system, they would beat 99% of their peers. It is a bit boring however because of the length of time between signals, and is why it’s affectionately called the ‘paint dry’ system.
Note: These statistics are kept up to date inside the website: This is a pitch page that is not actively updated in real time, members can see the real time activity.
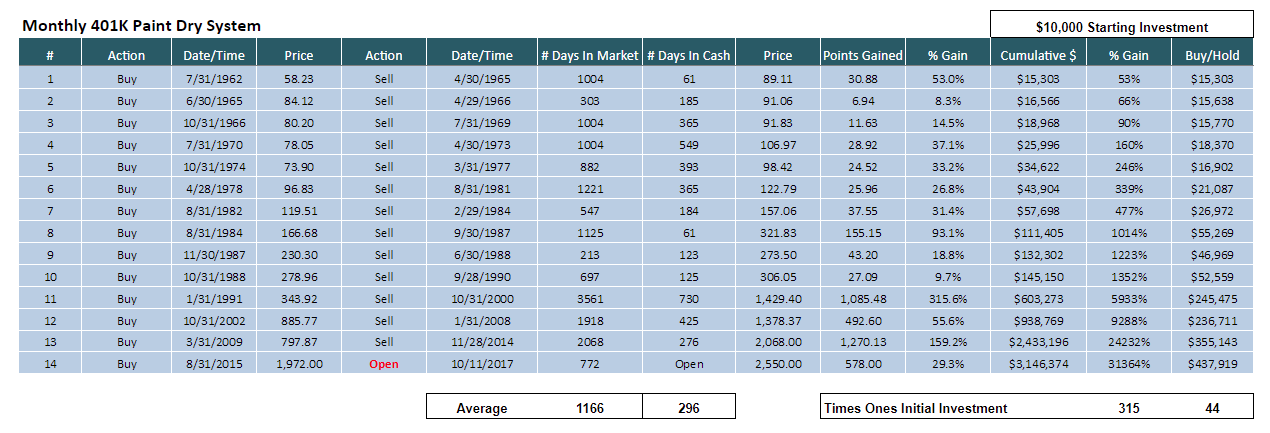
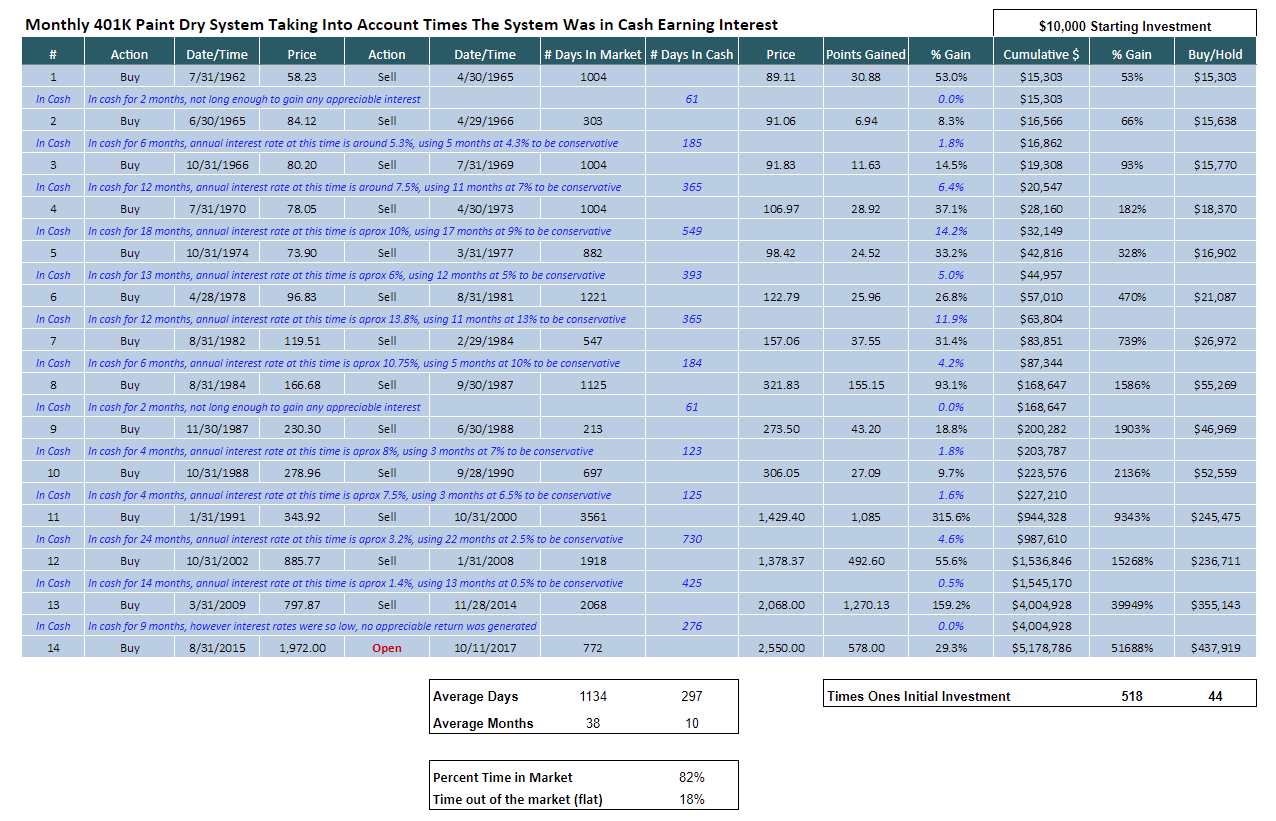
Chart Images:
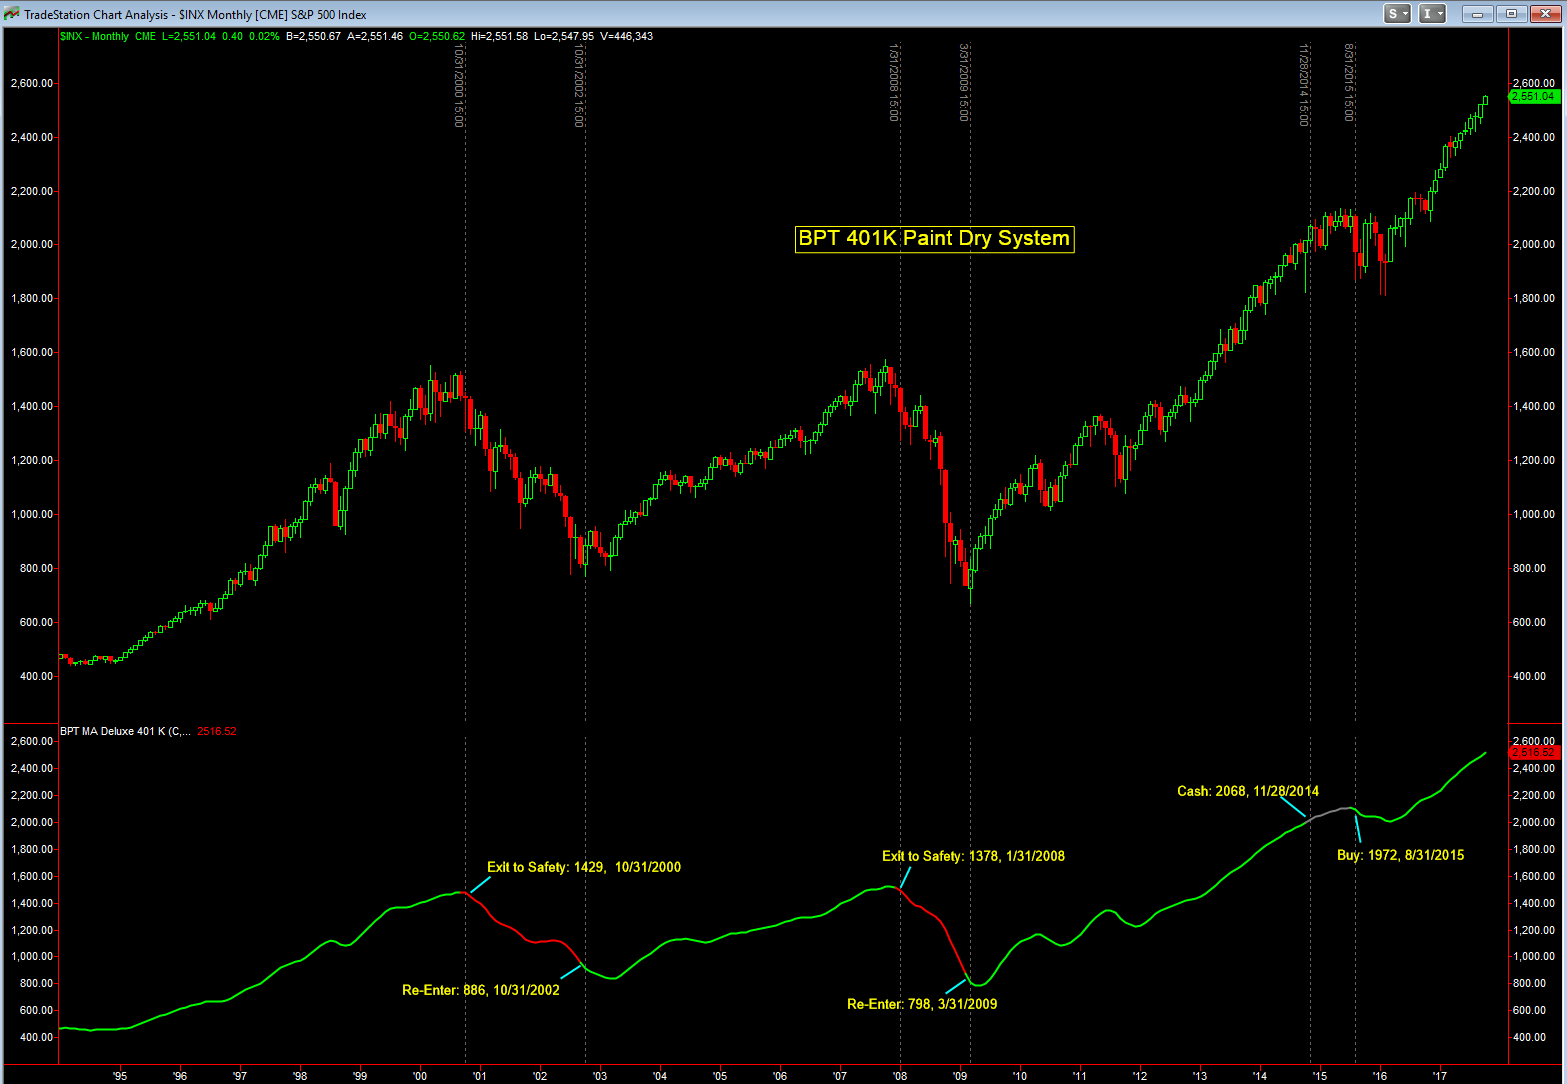
Below are the graphical images showing the system trades on the monthly S&P 500 cash index. Please note, because this is a monthly system, I will not be updated the first image, which shows the current trade each and every day, maybe only once a week or once a month since it is a monthly chart and the fact that the trades last so long for the system. However if the system does a trade I will update it and let everyone know via email and in the newsletters:
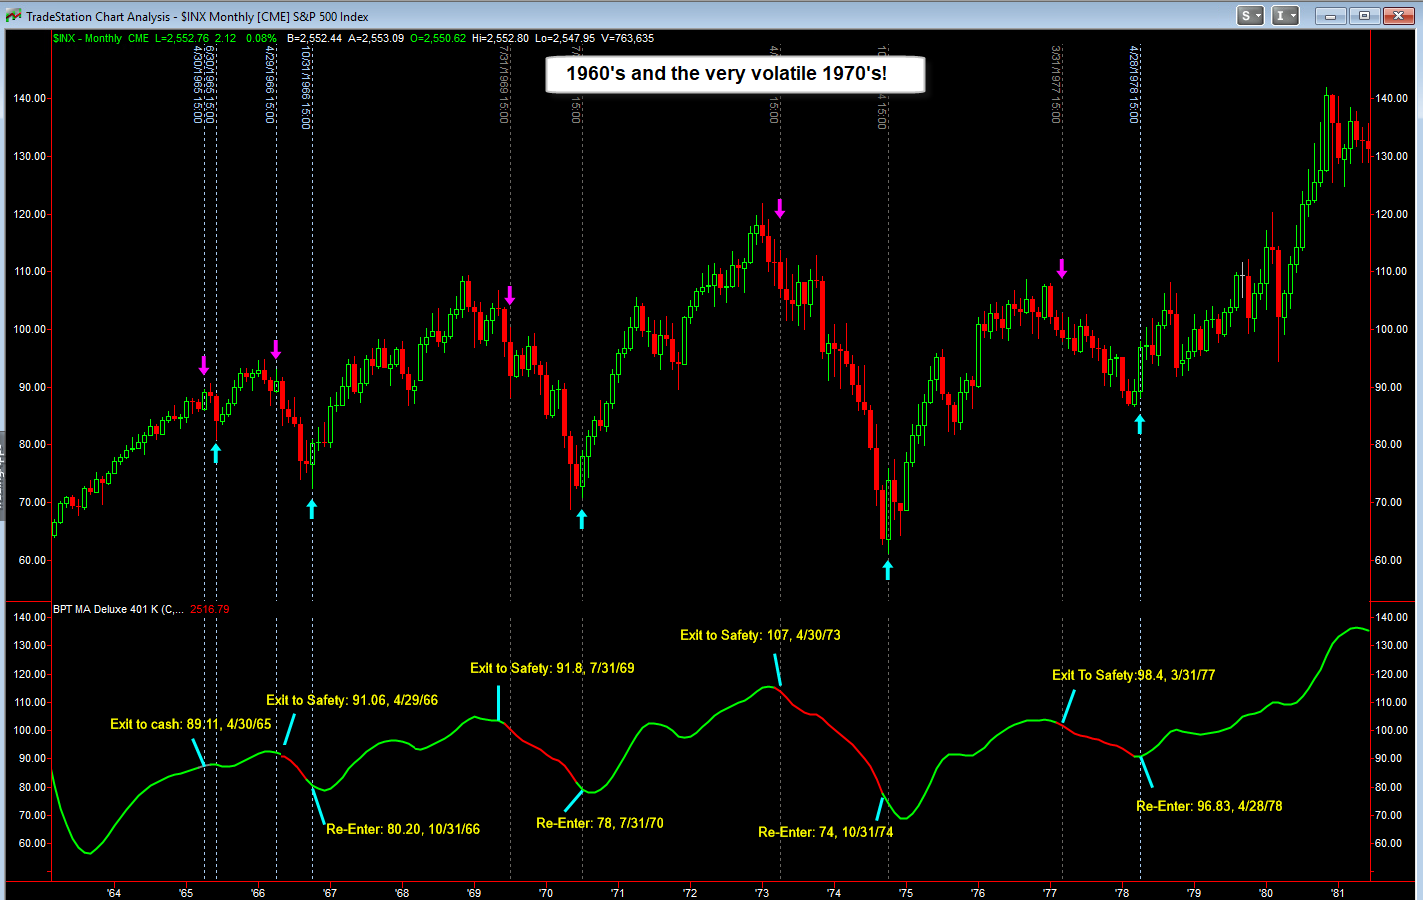
The first image below shows the current trade and history and the images below show the system trades going all the way back to the 1960’s!
Trades from the mid 1990’s to present
Trades from the 1977 – 1993 to present
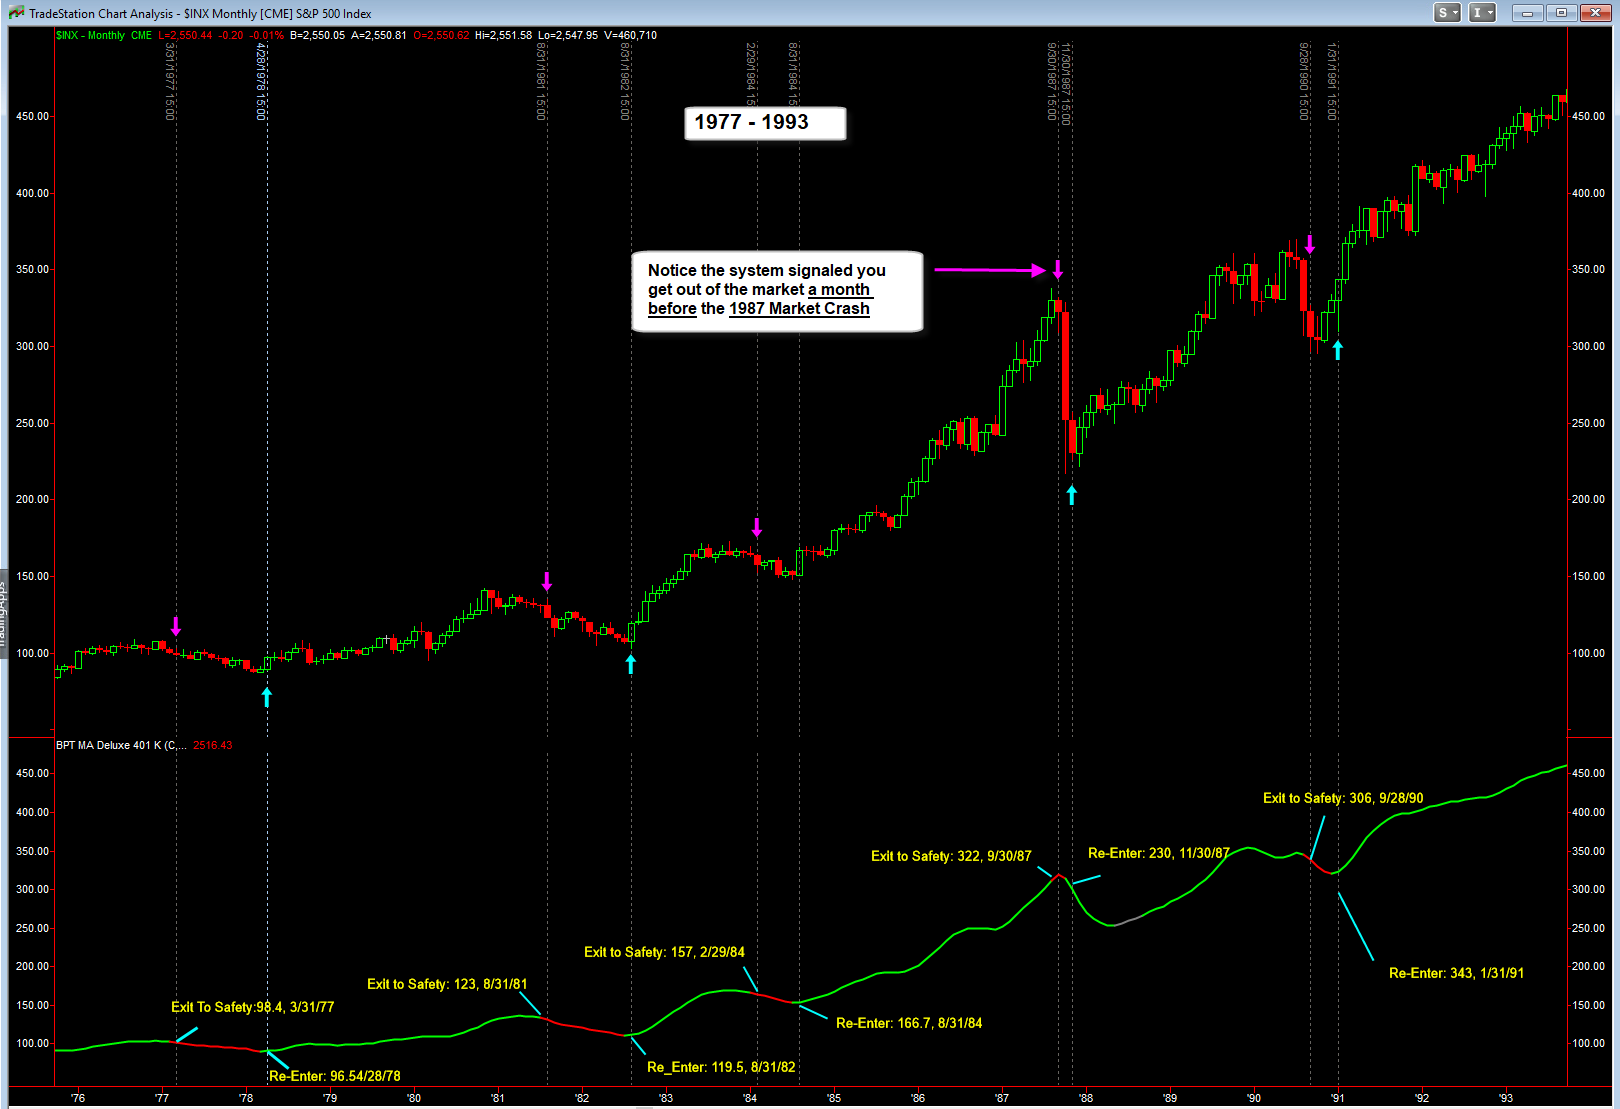
The image below shows the system on the S&P 500 from 1977 to 1993. Again while it’s not gonna get you out at exact tops or bottoms, it does a great job at keeping you in the main trends (80 – 90% of the bull market up-trends) and out during bear market corrections.
Also note that the system signaled you to get out 1 month before the 1987 market crash!! Then had you buy back in long after the crash! This process of avoiding the major corrections and only riding the uptrends causes a huge compounding effect in long term 401K accounts!