Comprehensive Weekend BPT Newsletter July 21st, 2019 - free
Disclaimer: Intraday Chart Links will show up as daily charts unless you have an active stockcharts.com membership and are signed in, you can sign up here.
1
Please Note: I have two other newsletters this weekend, one on Trade ideas, and one on precious metals. I already sent out my list on the precious metals stocks, providing you a real time URL to my master Google Spreadsheet.
----------
Table of Contents:
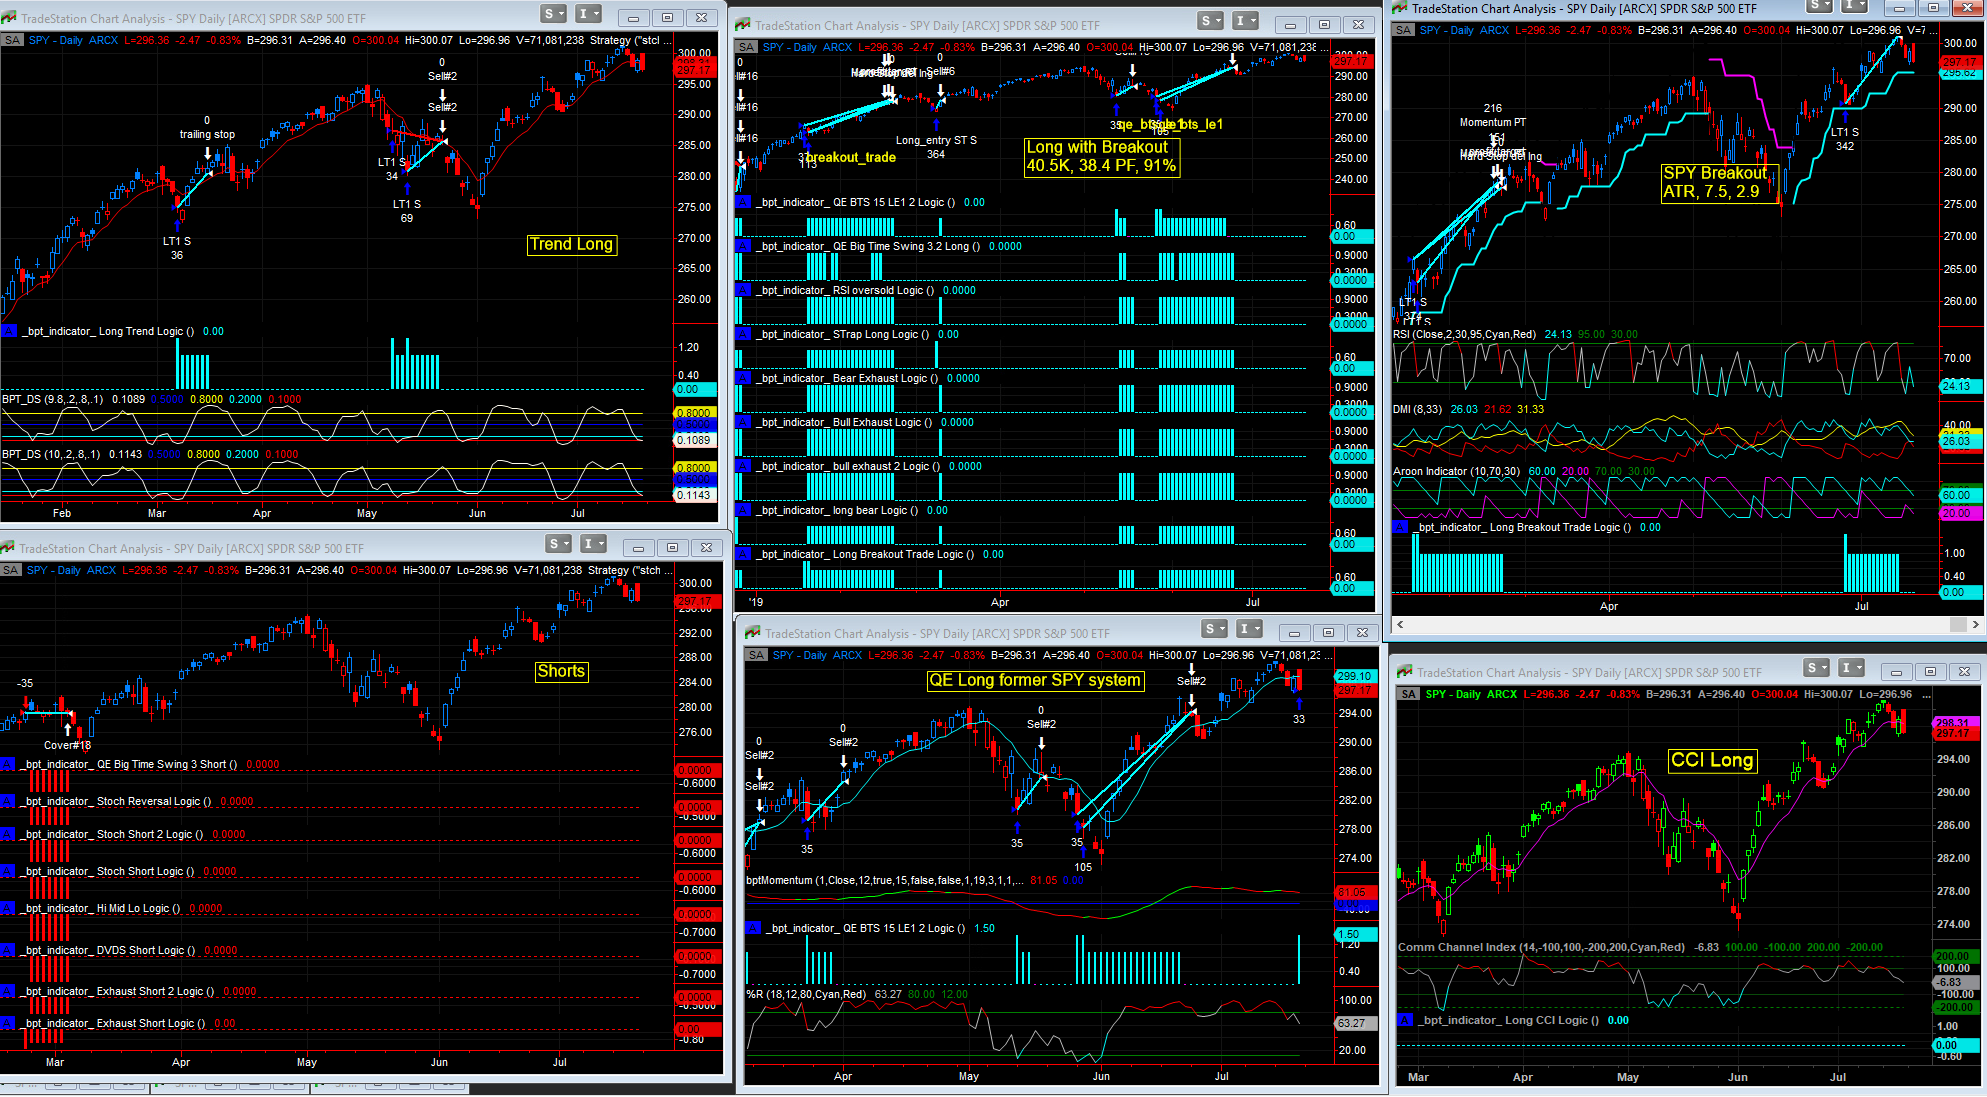
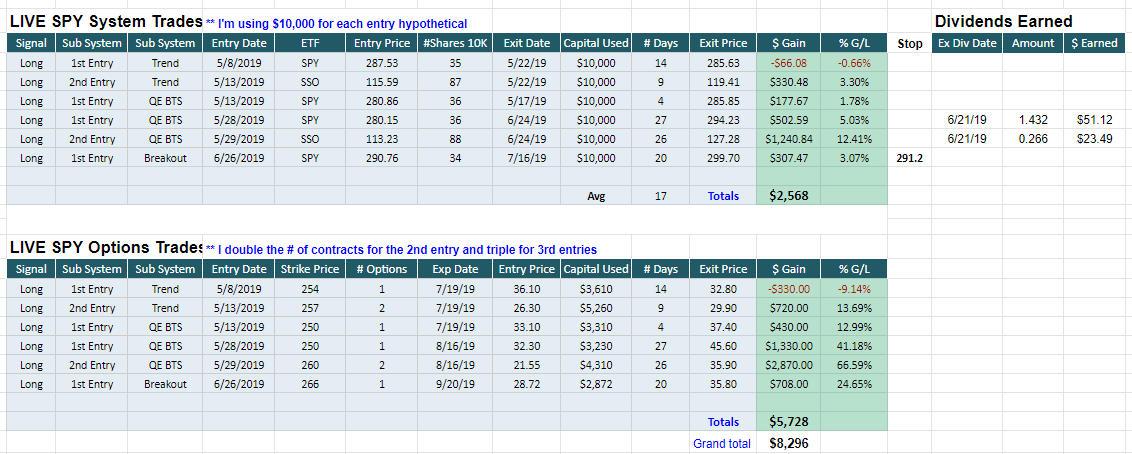
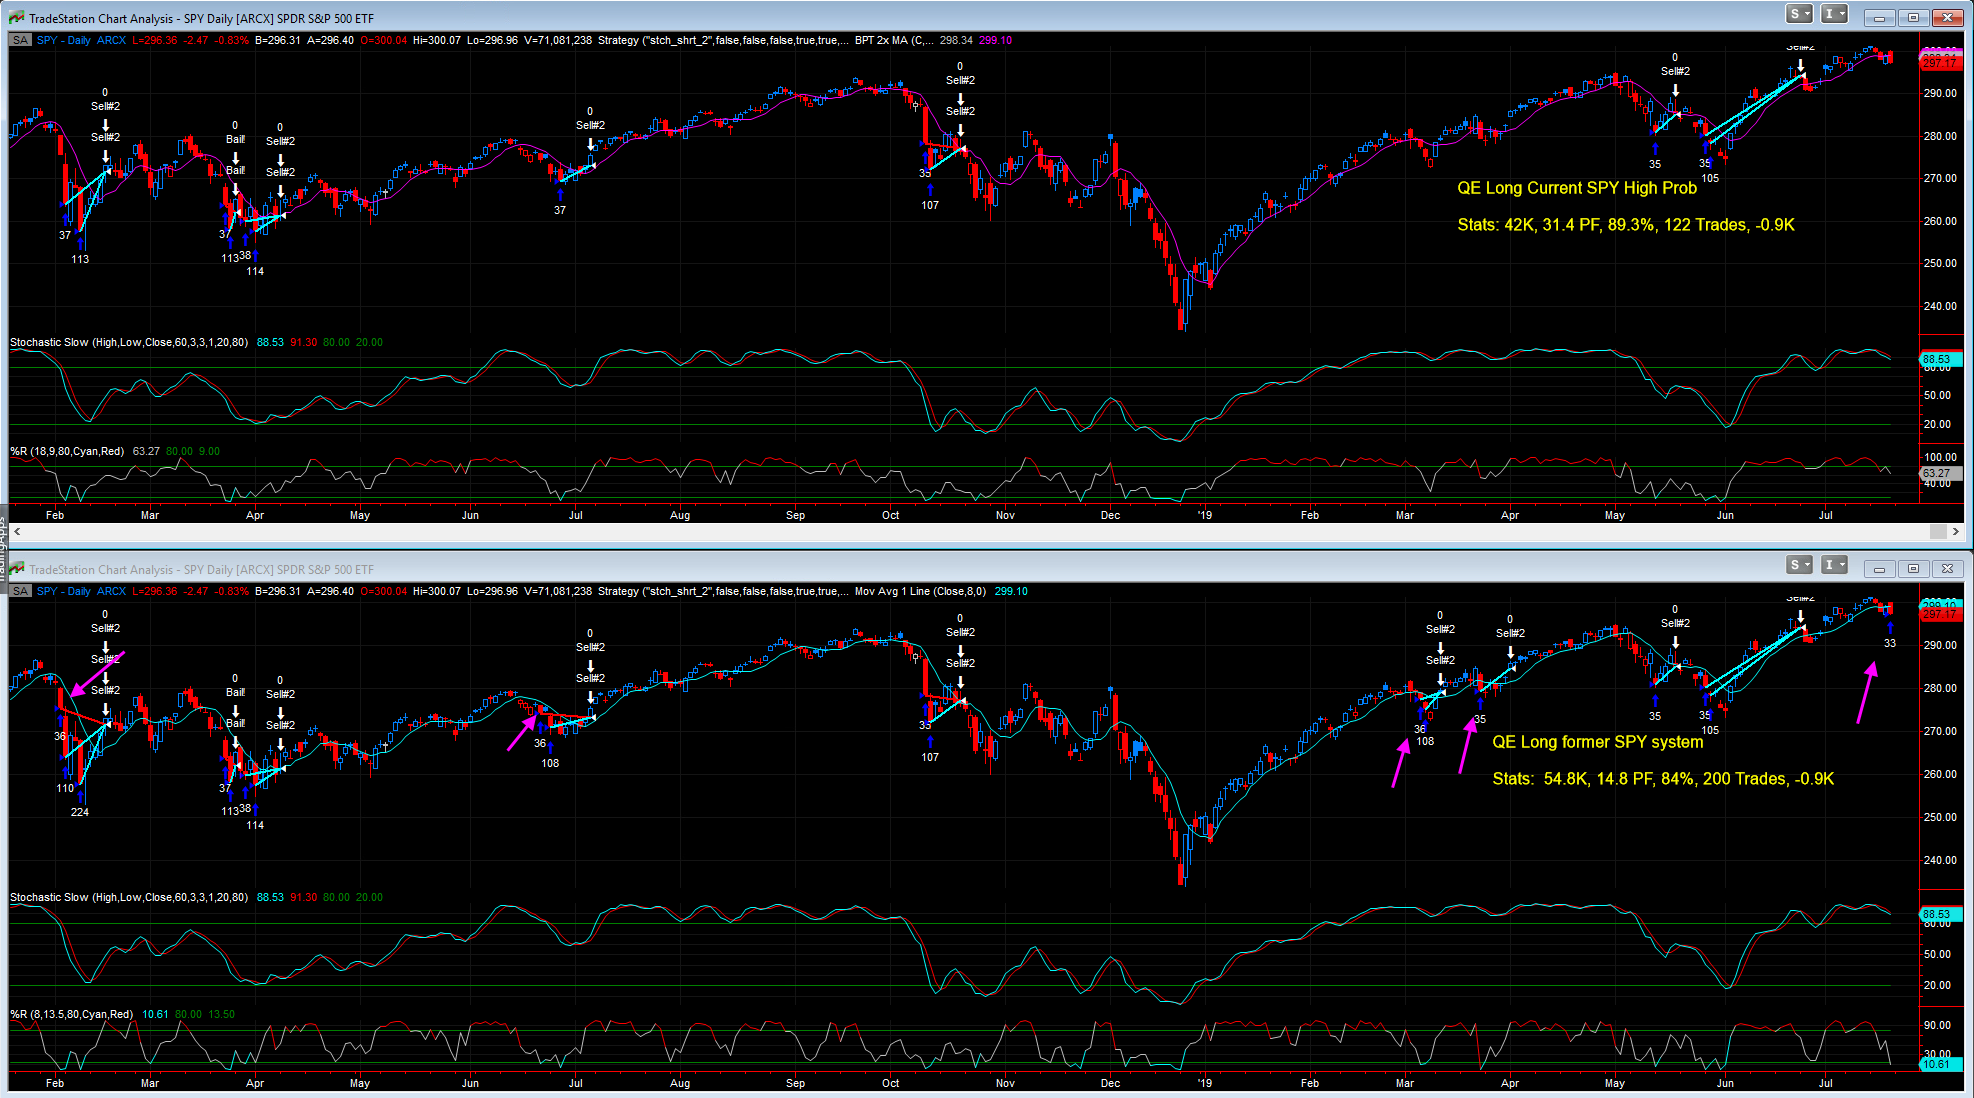
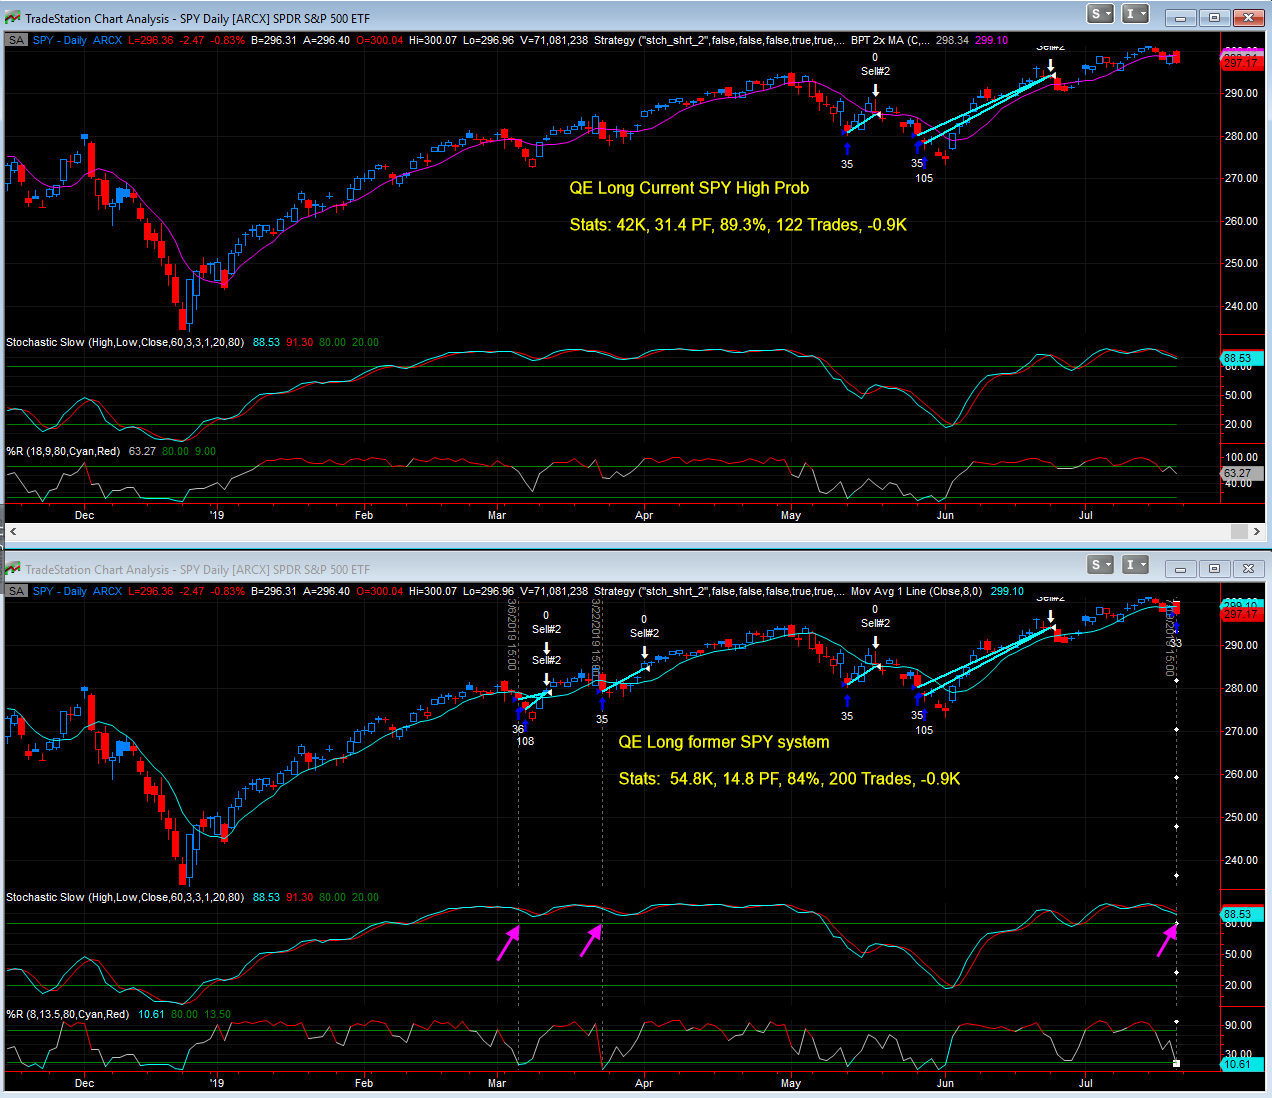
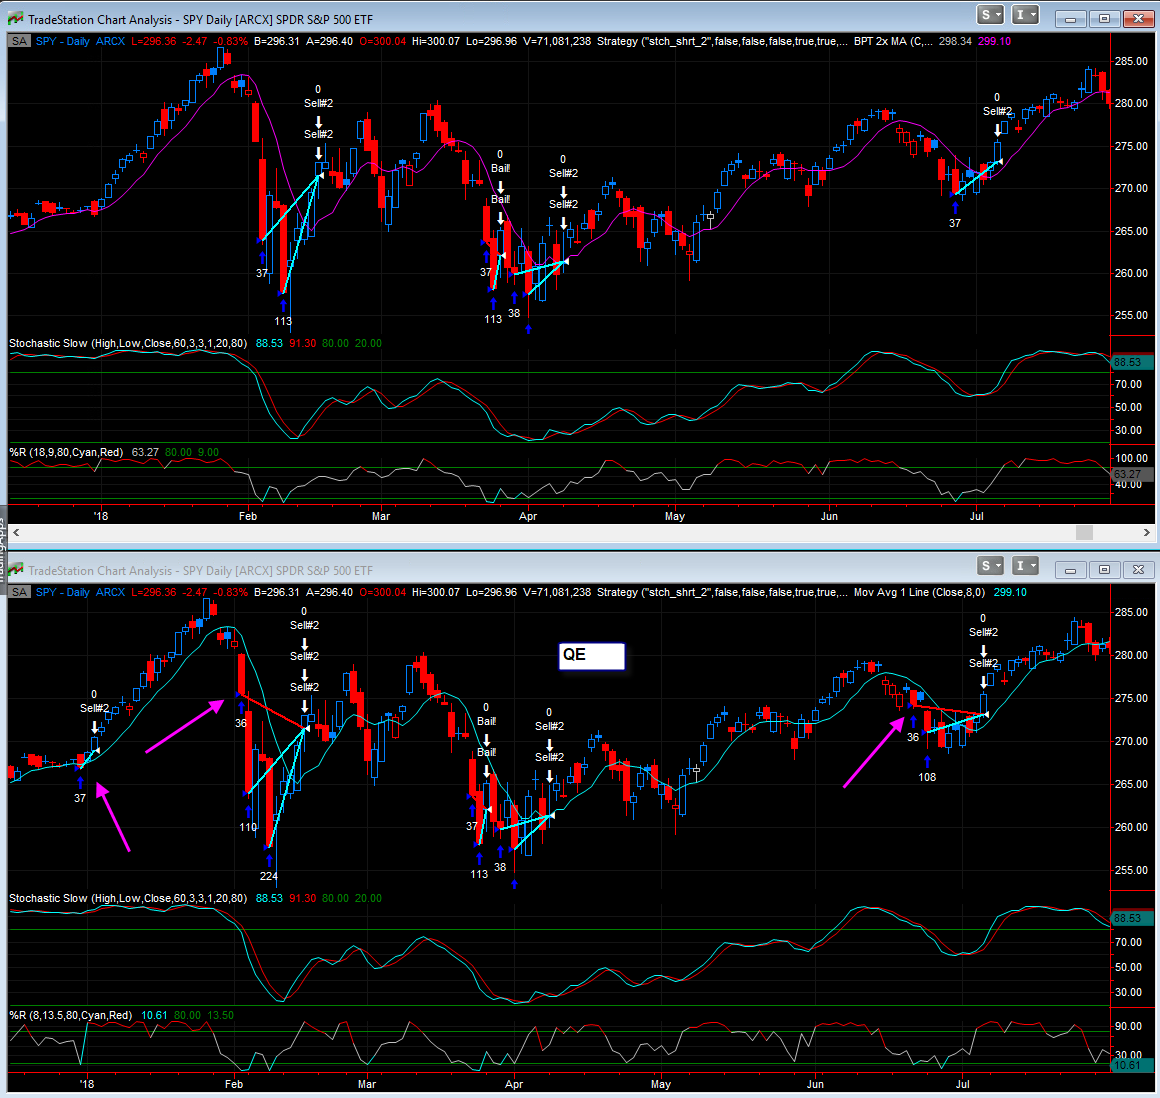
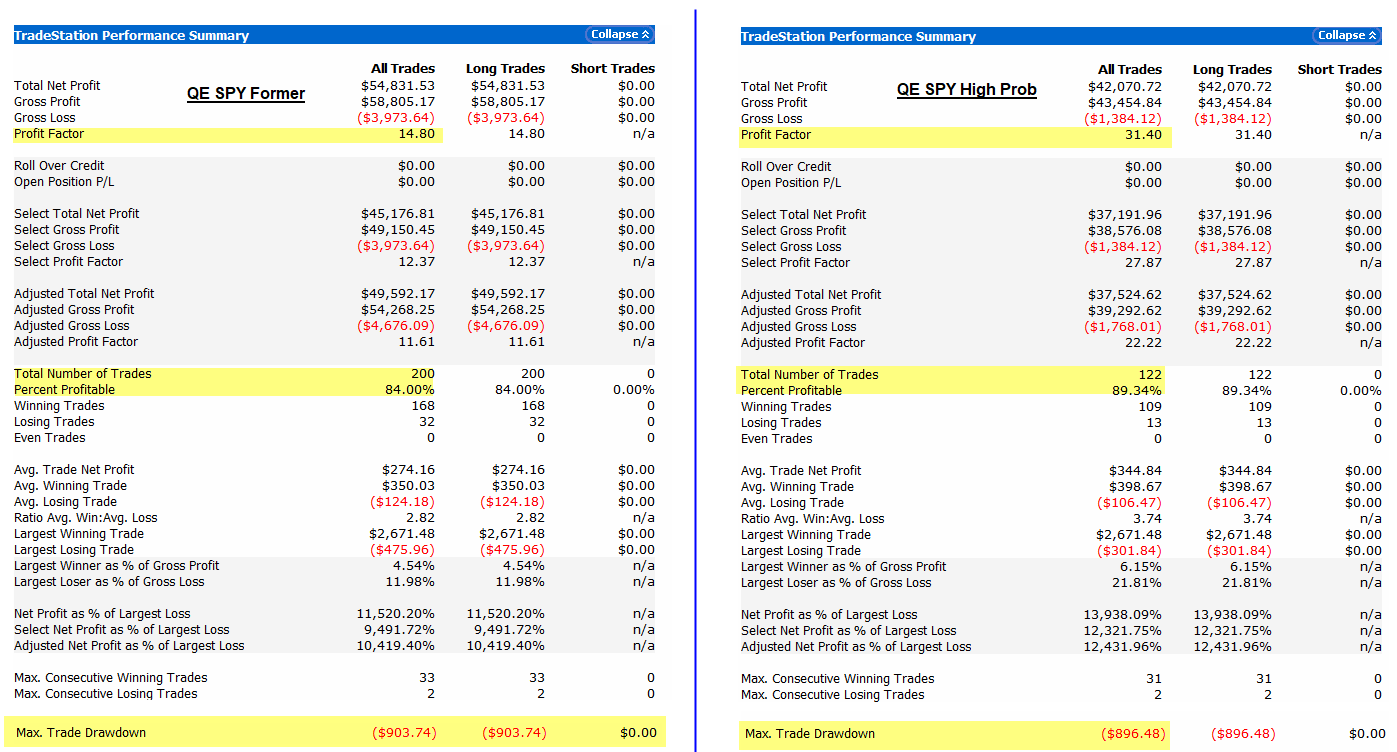
SPY Pro system comments
1. Glance at last Week Stats, Upcoming Economic Table, Earnings Release Dates
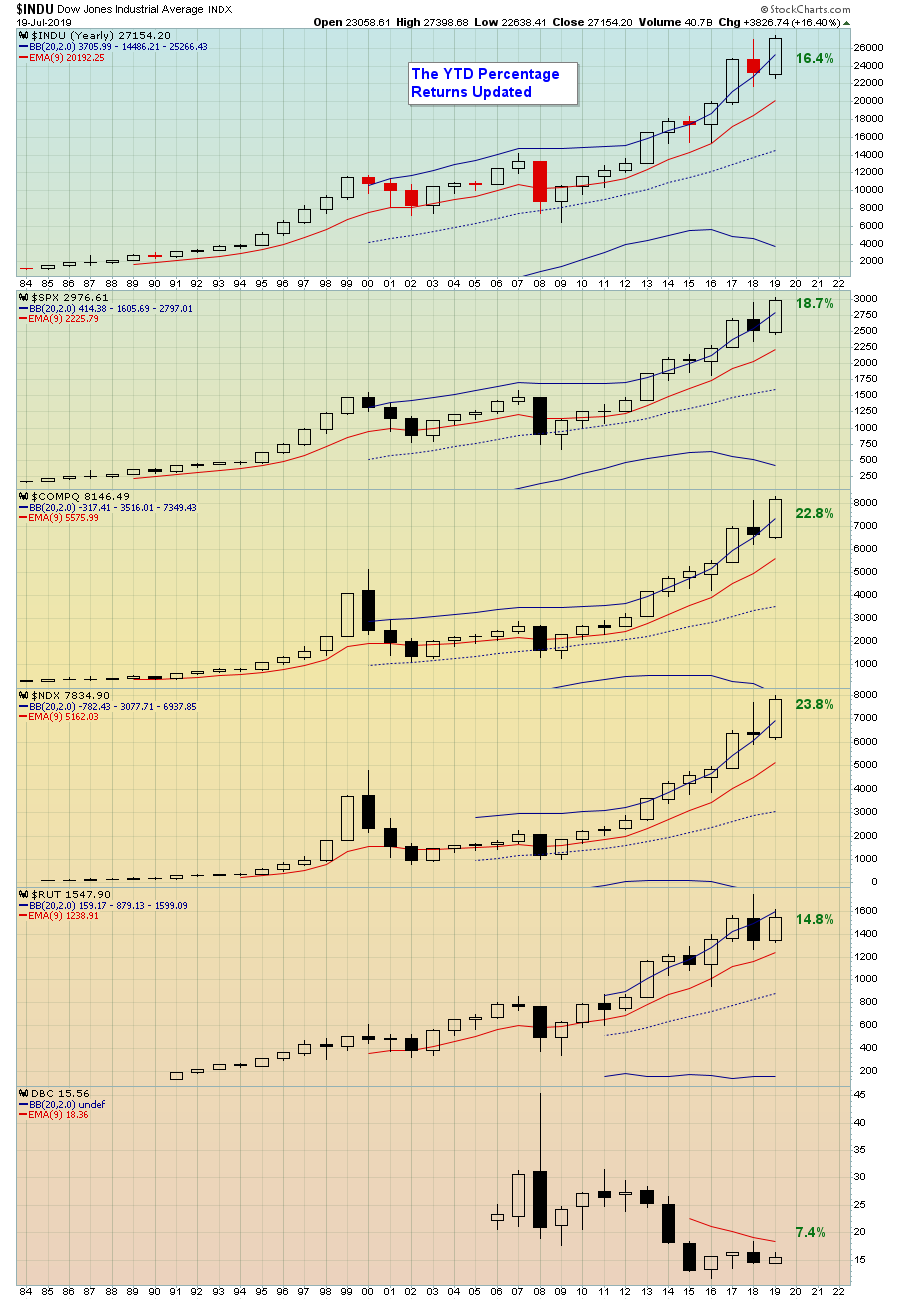
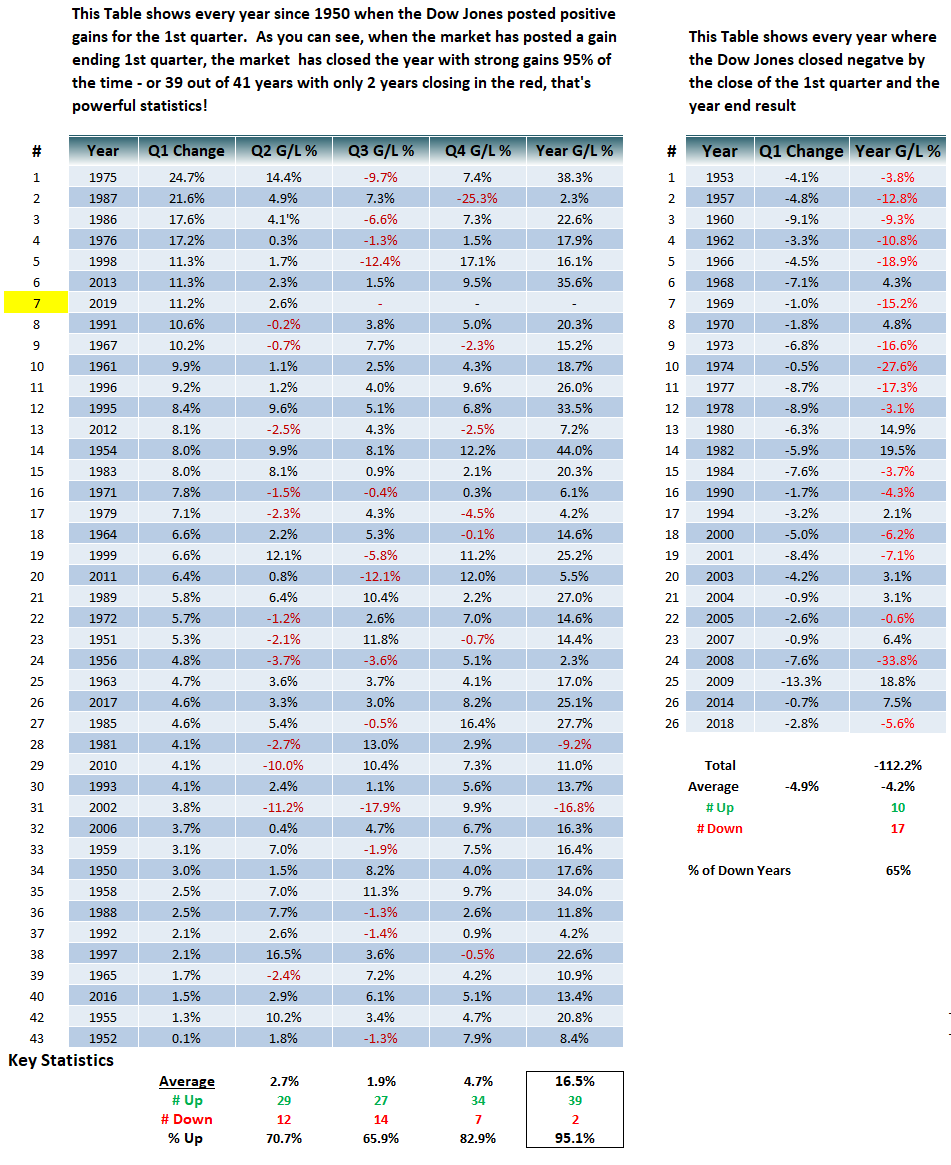
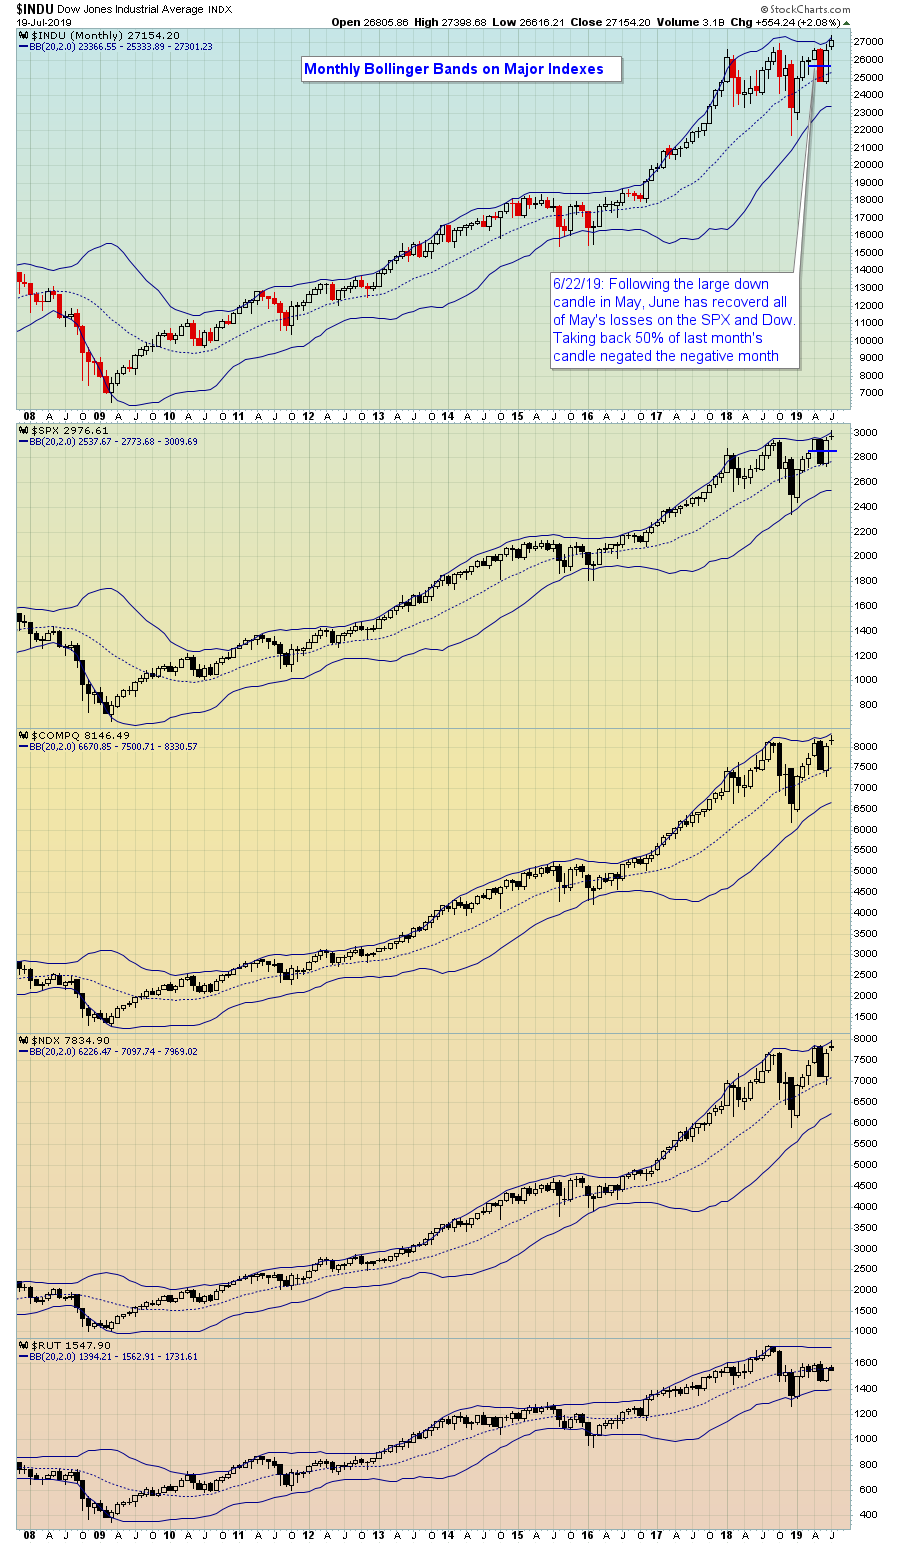
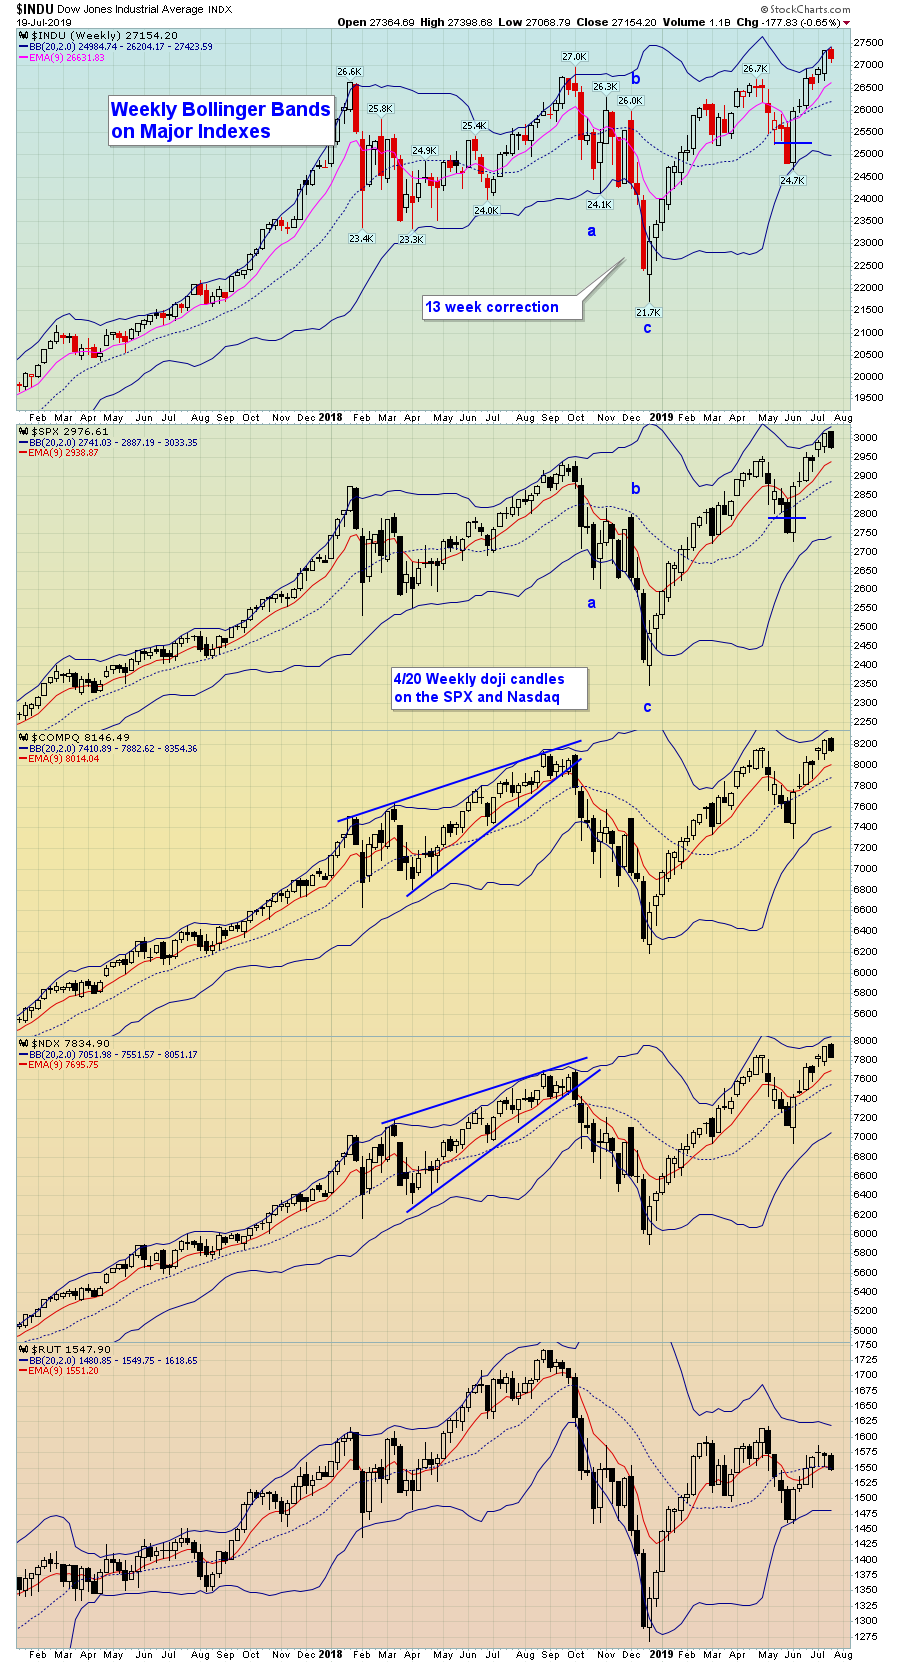
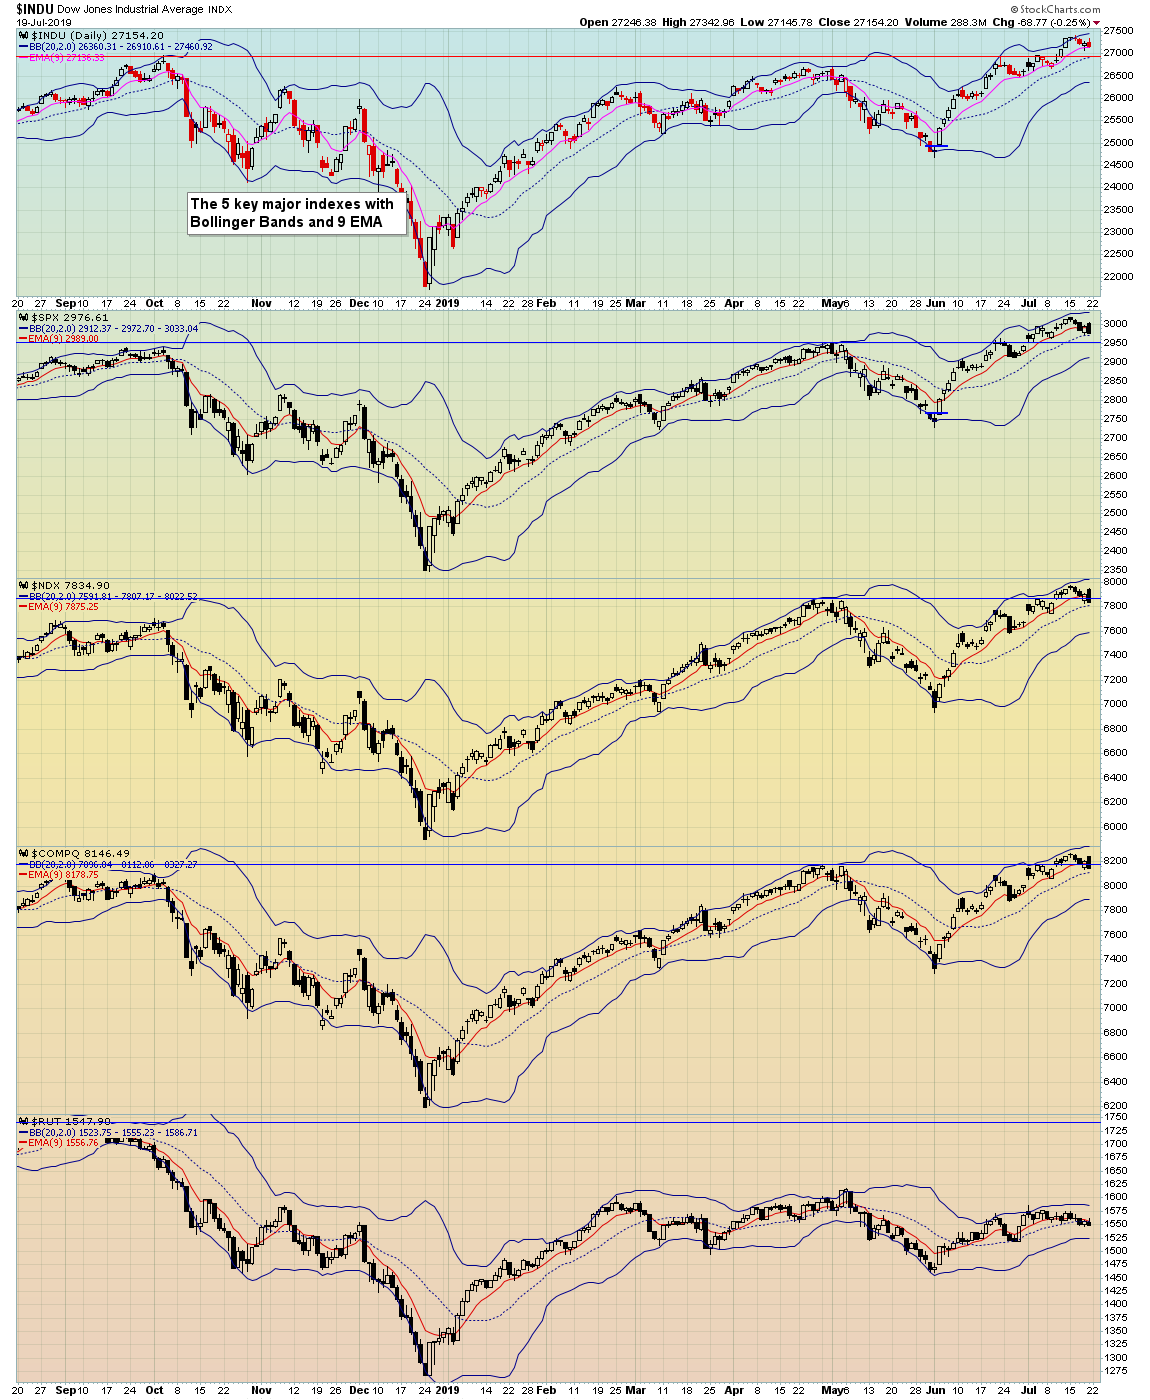
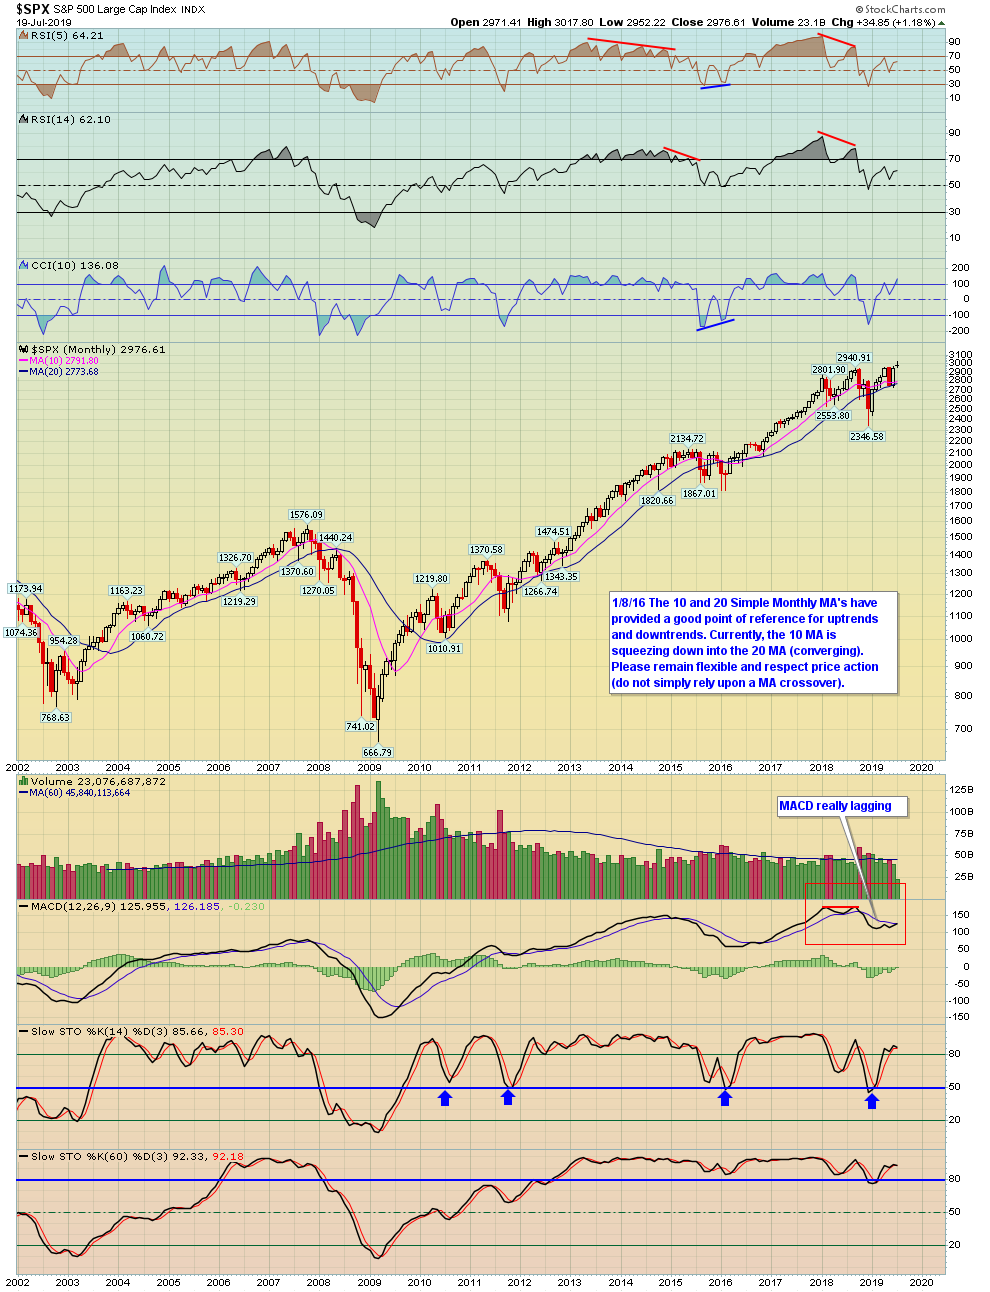
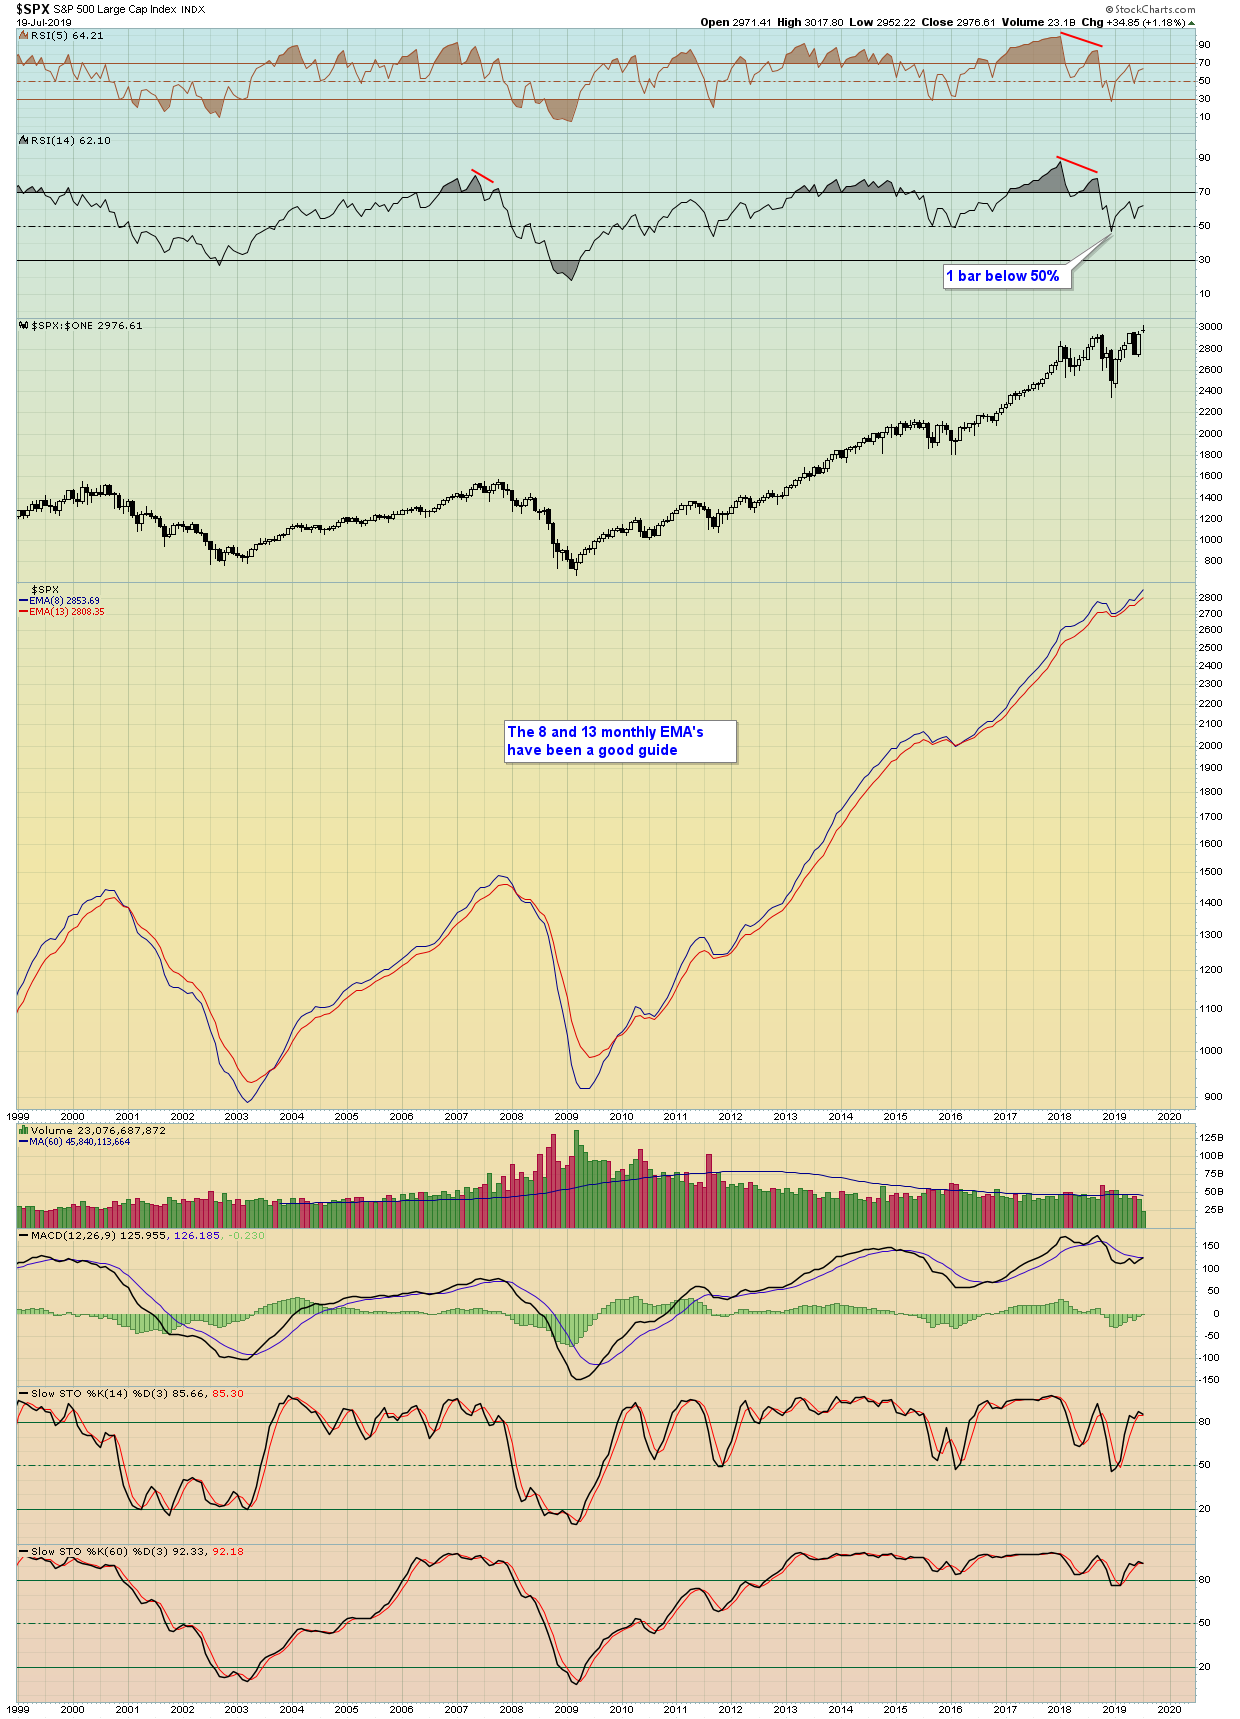
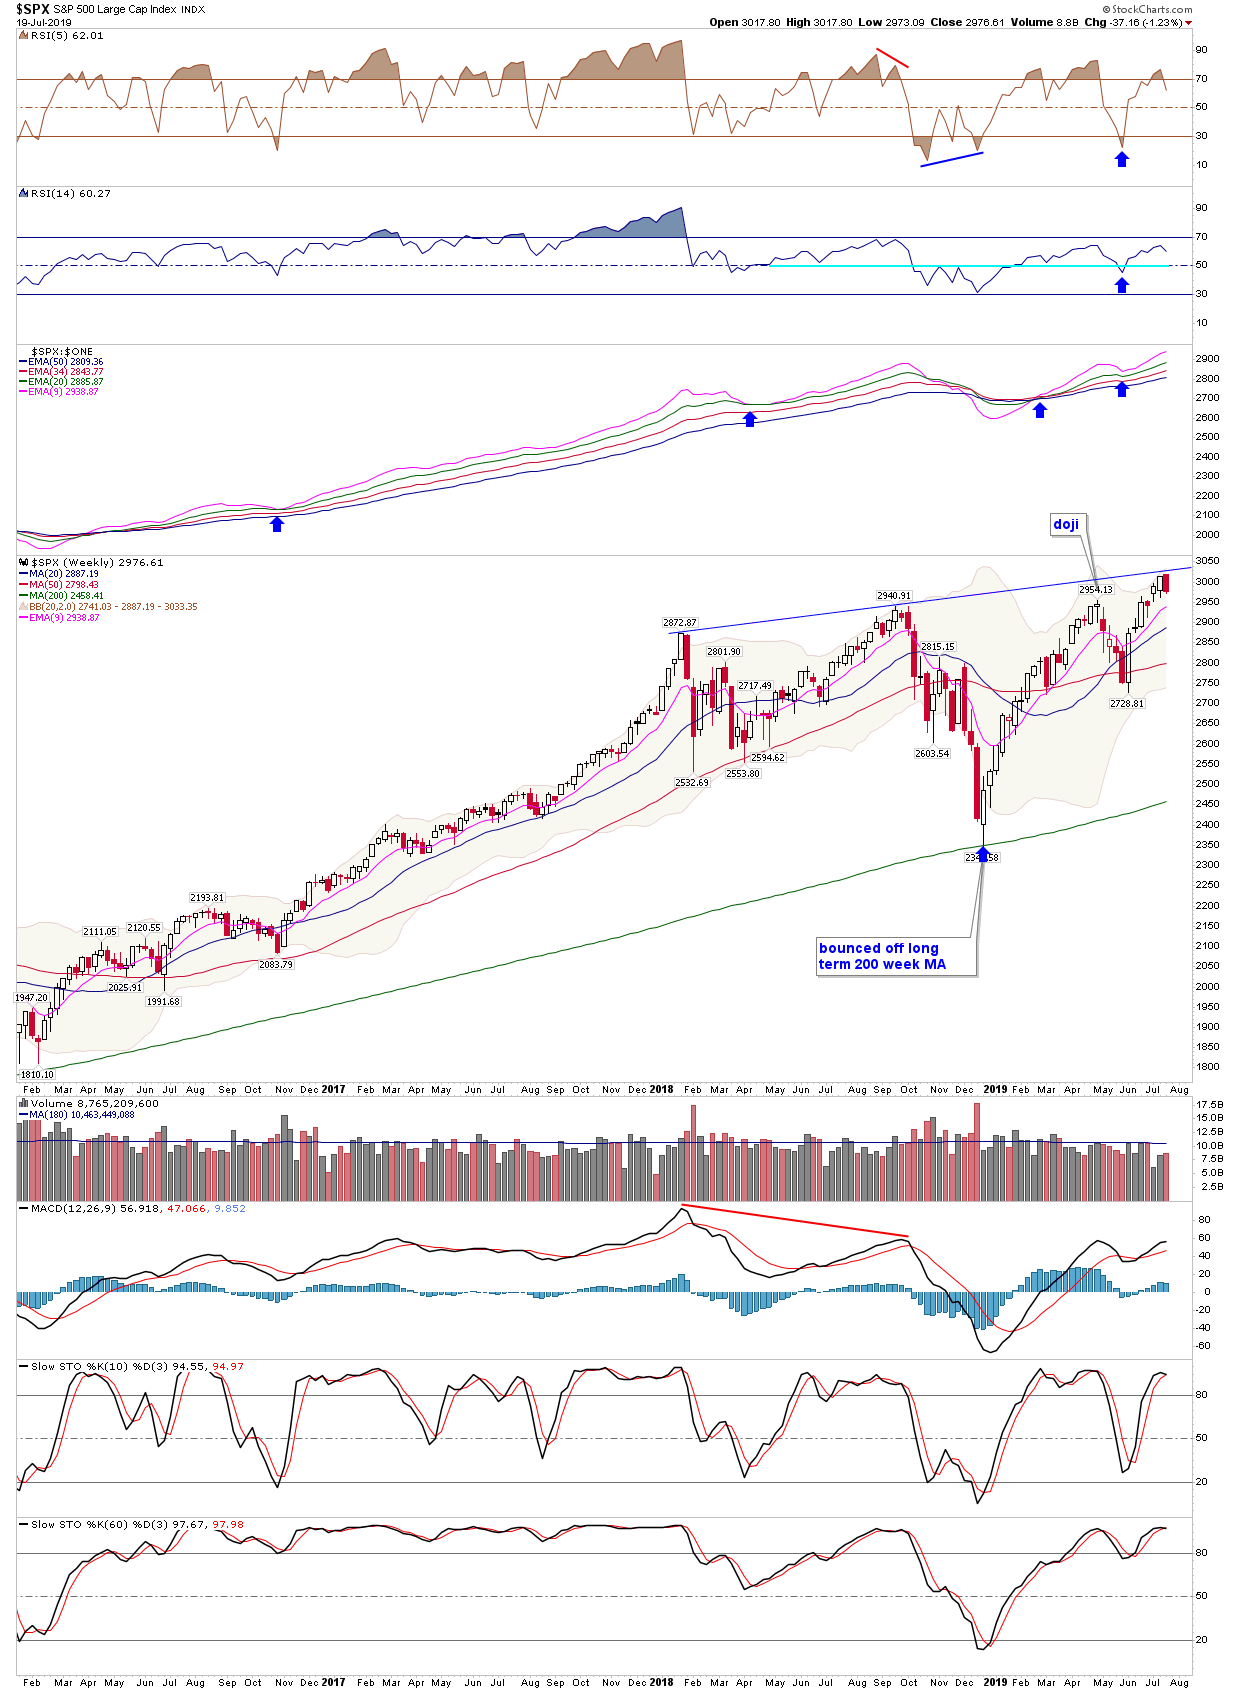
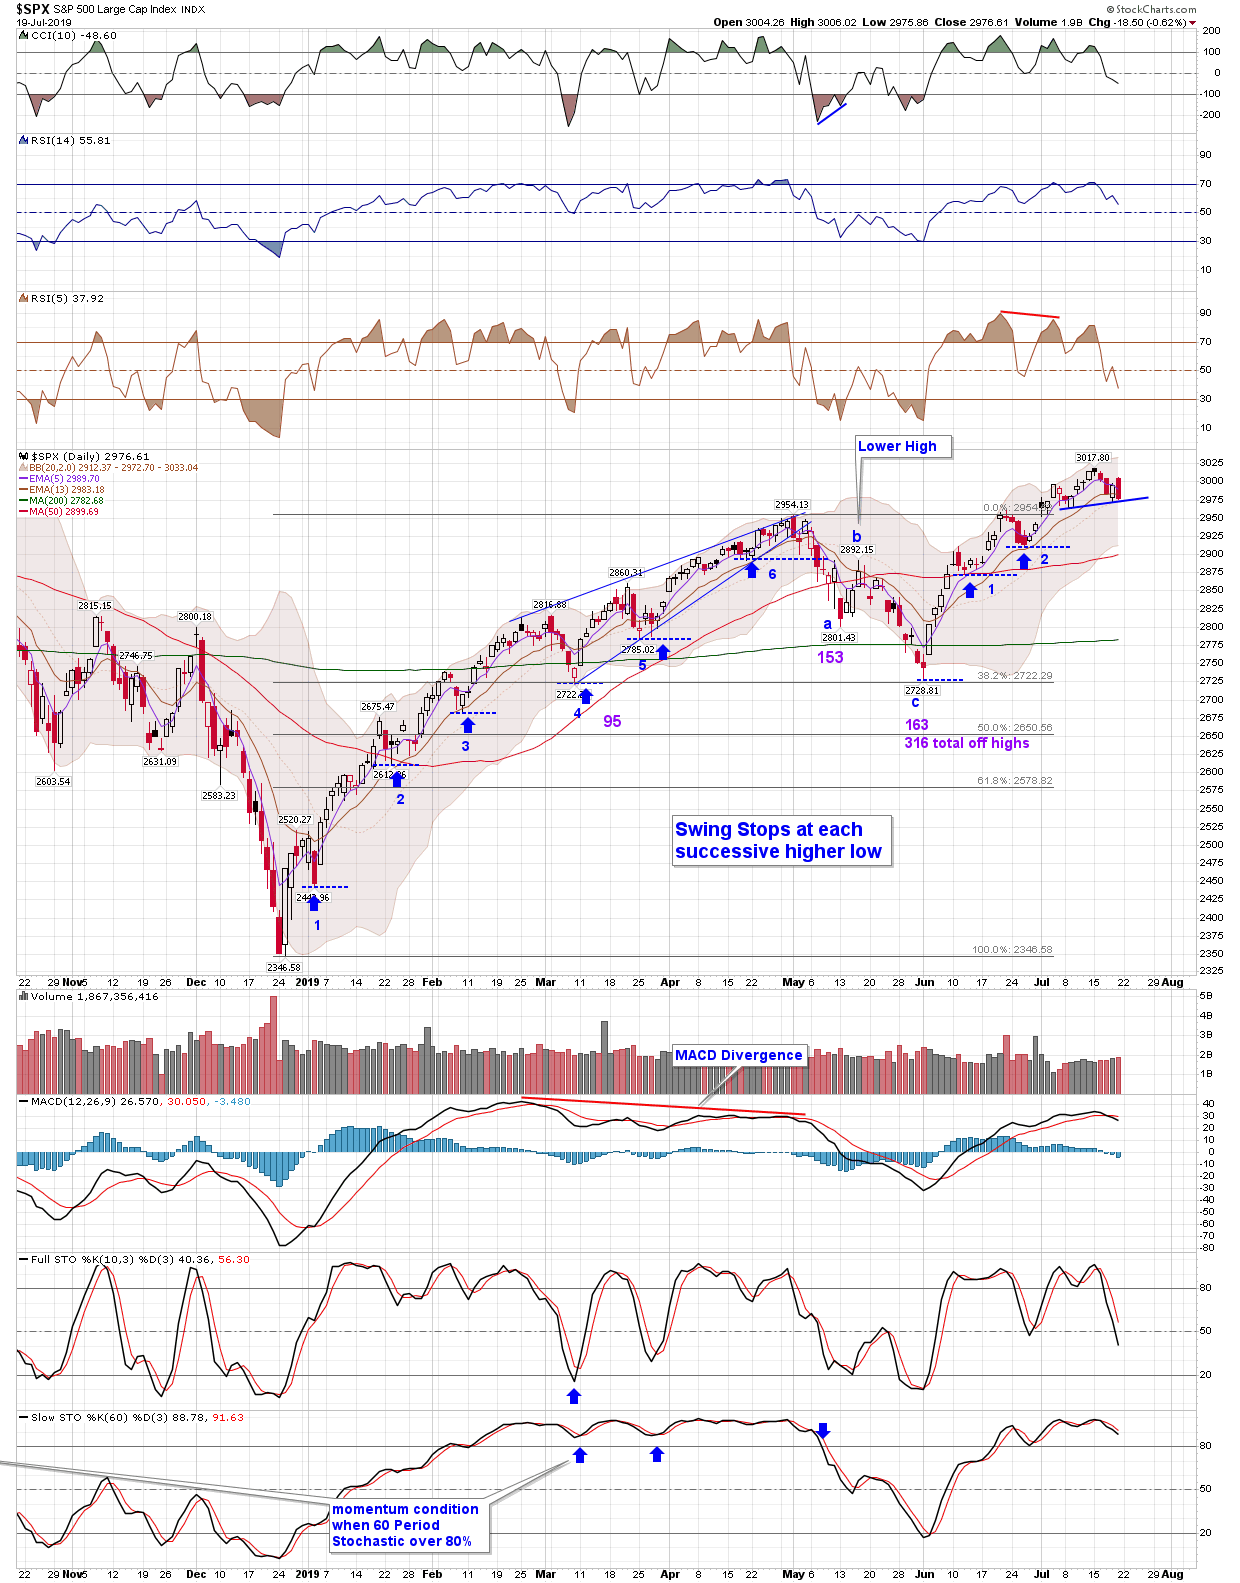
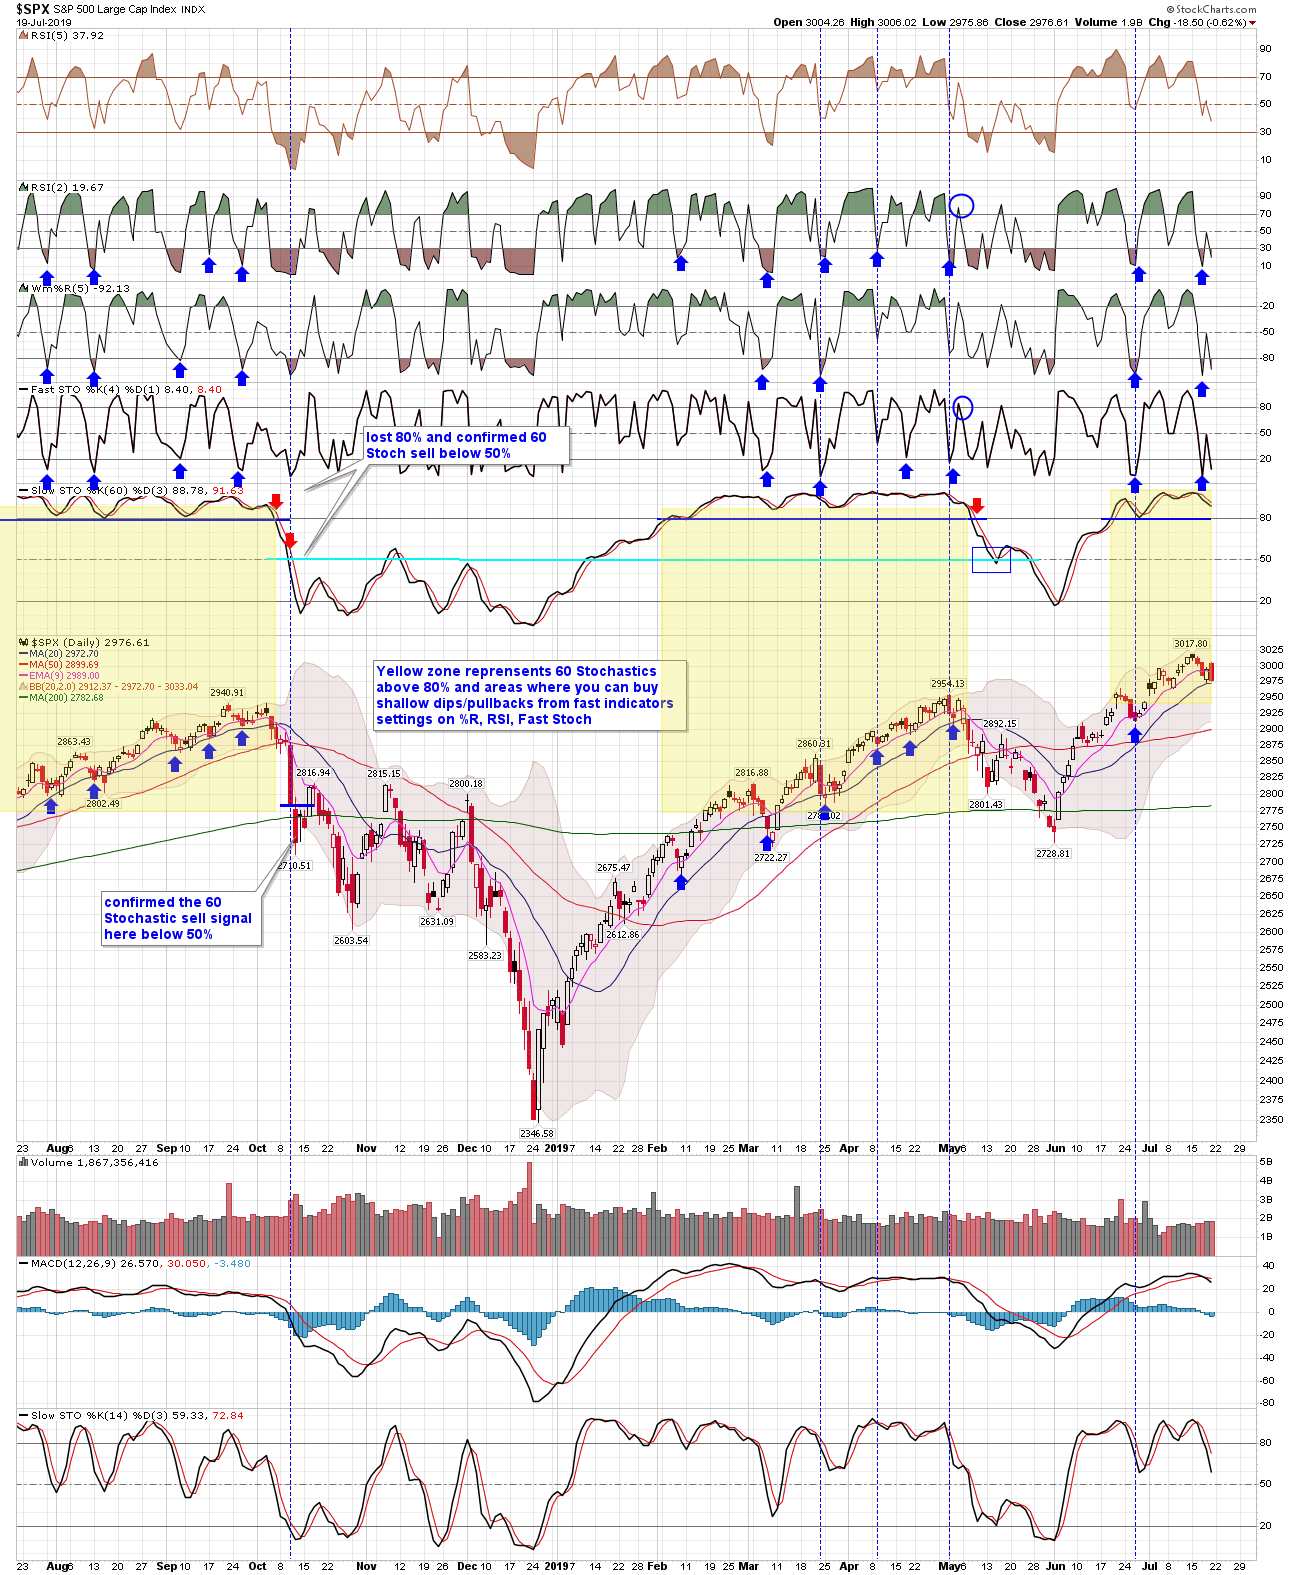
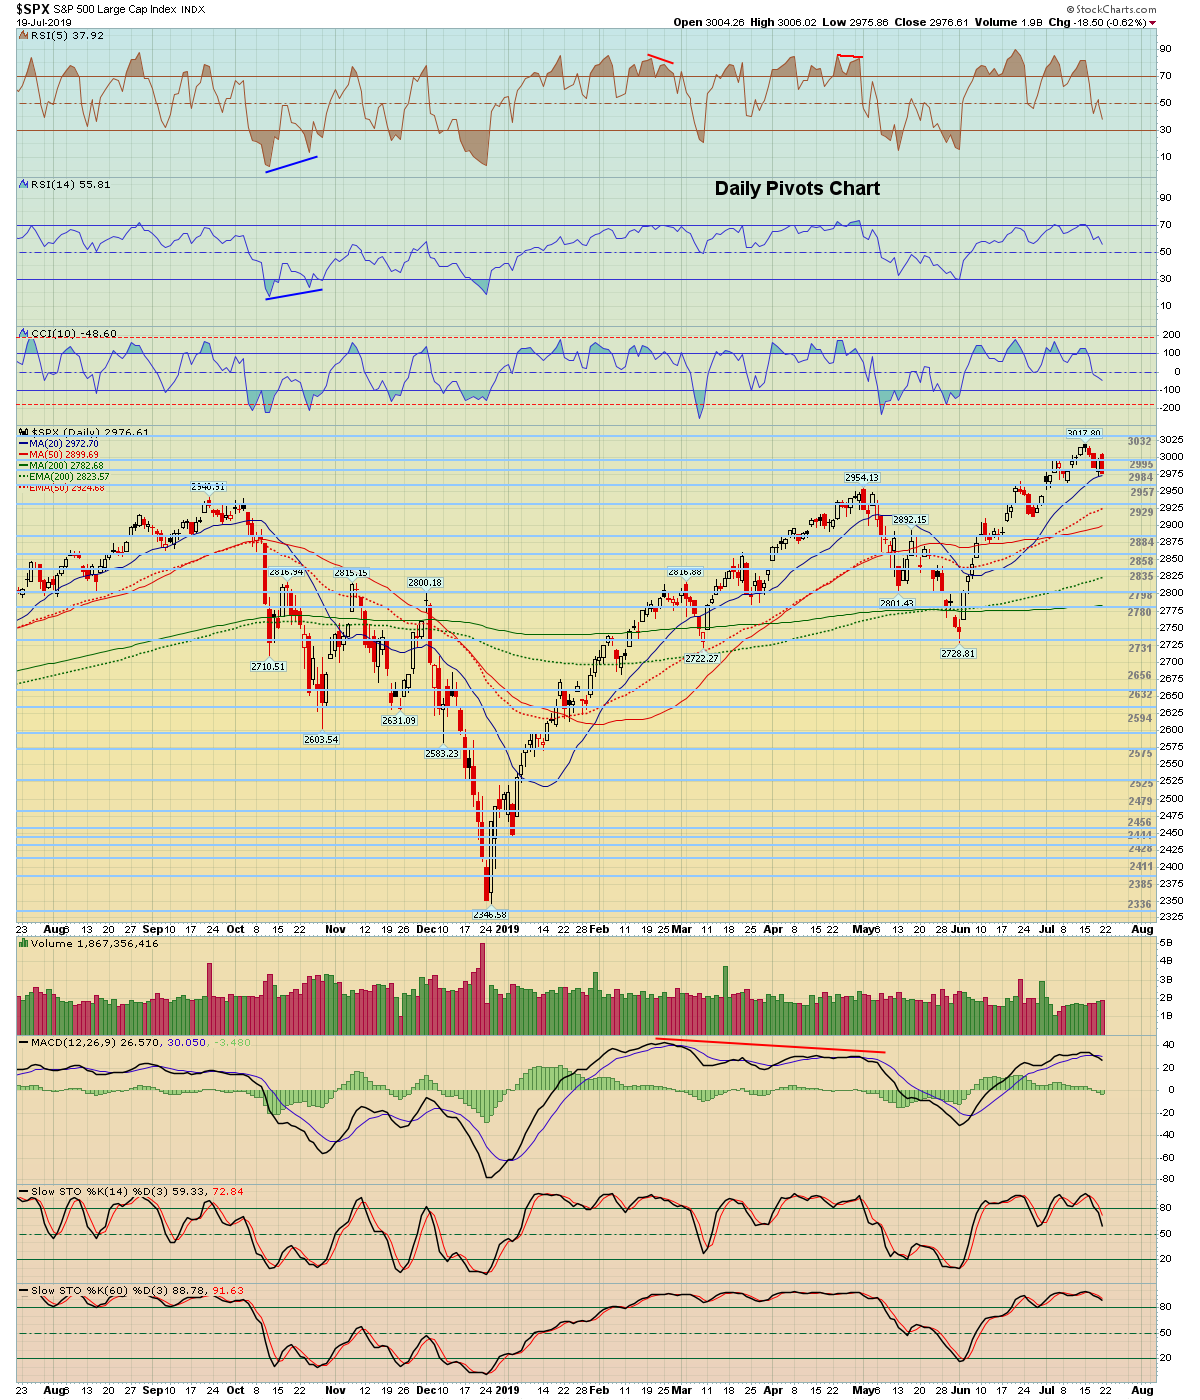
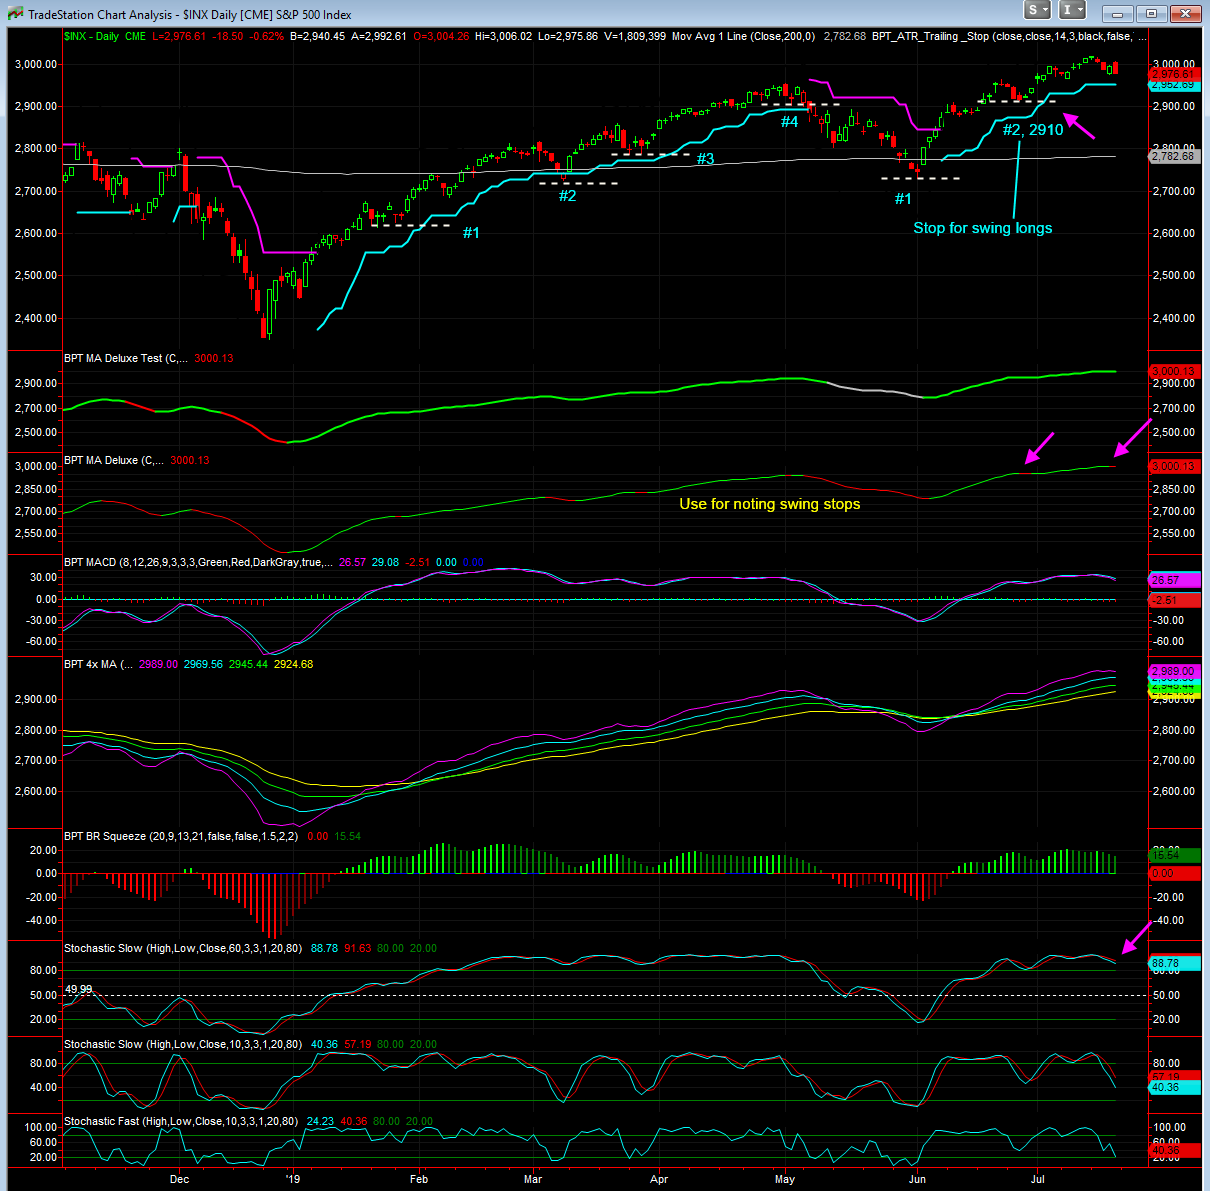
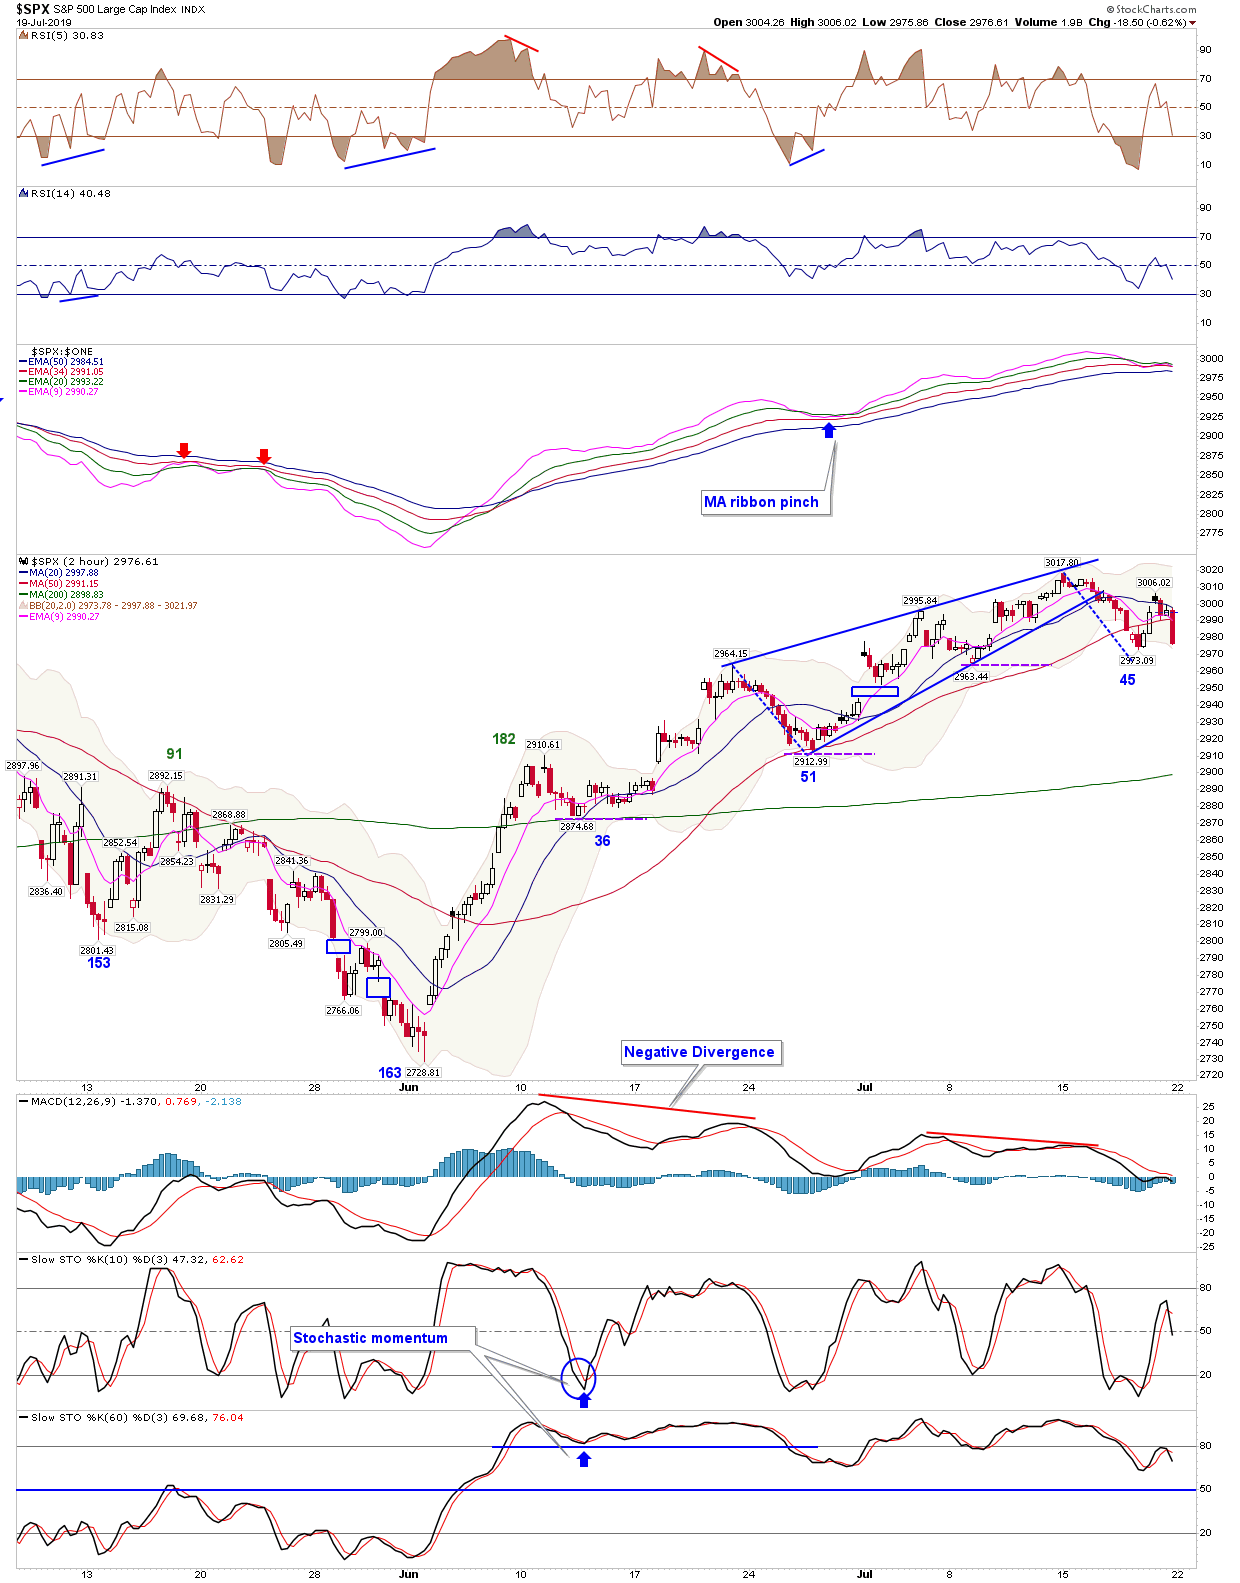
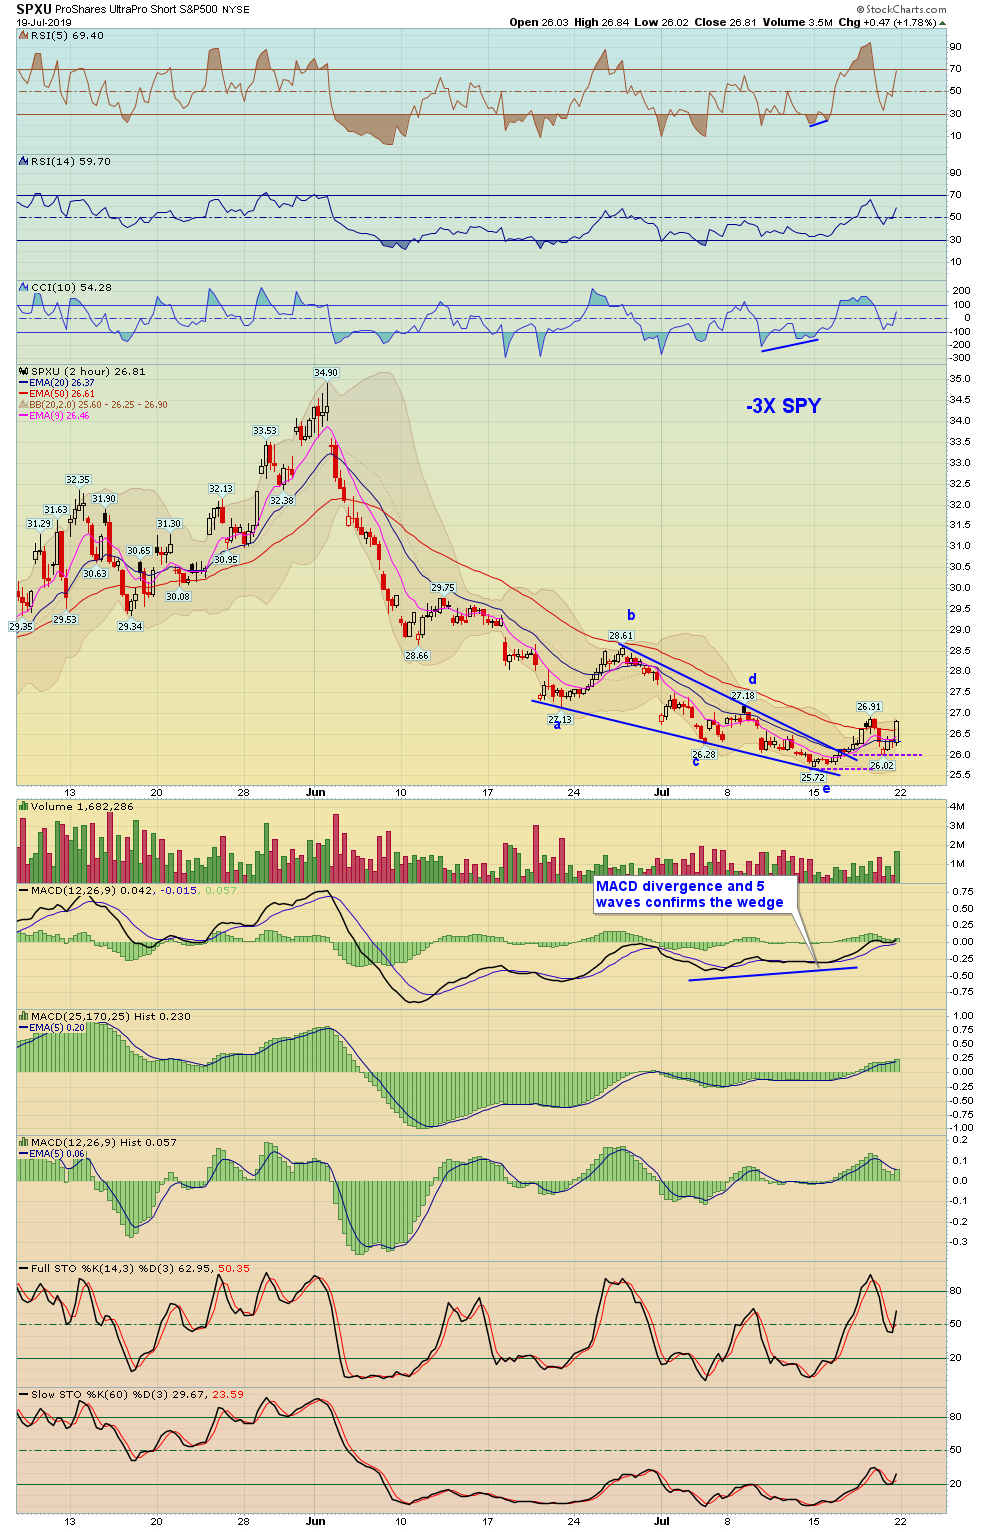
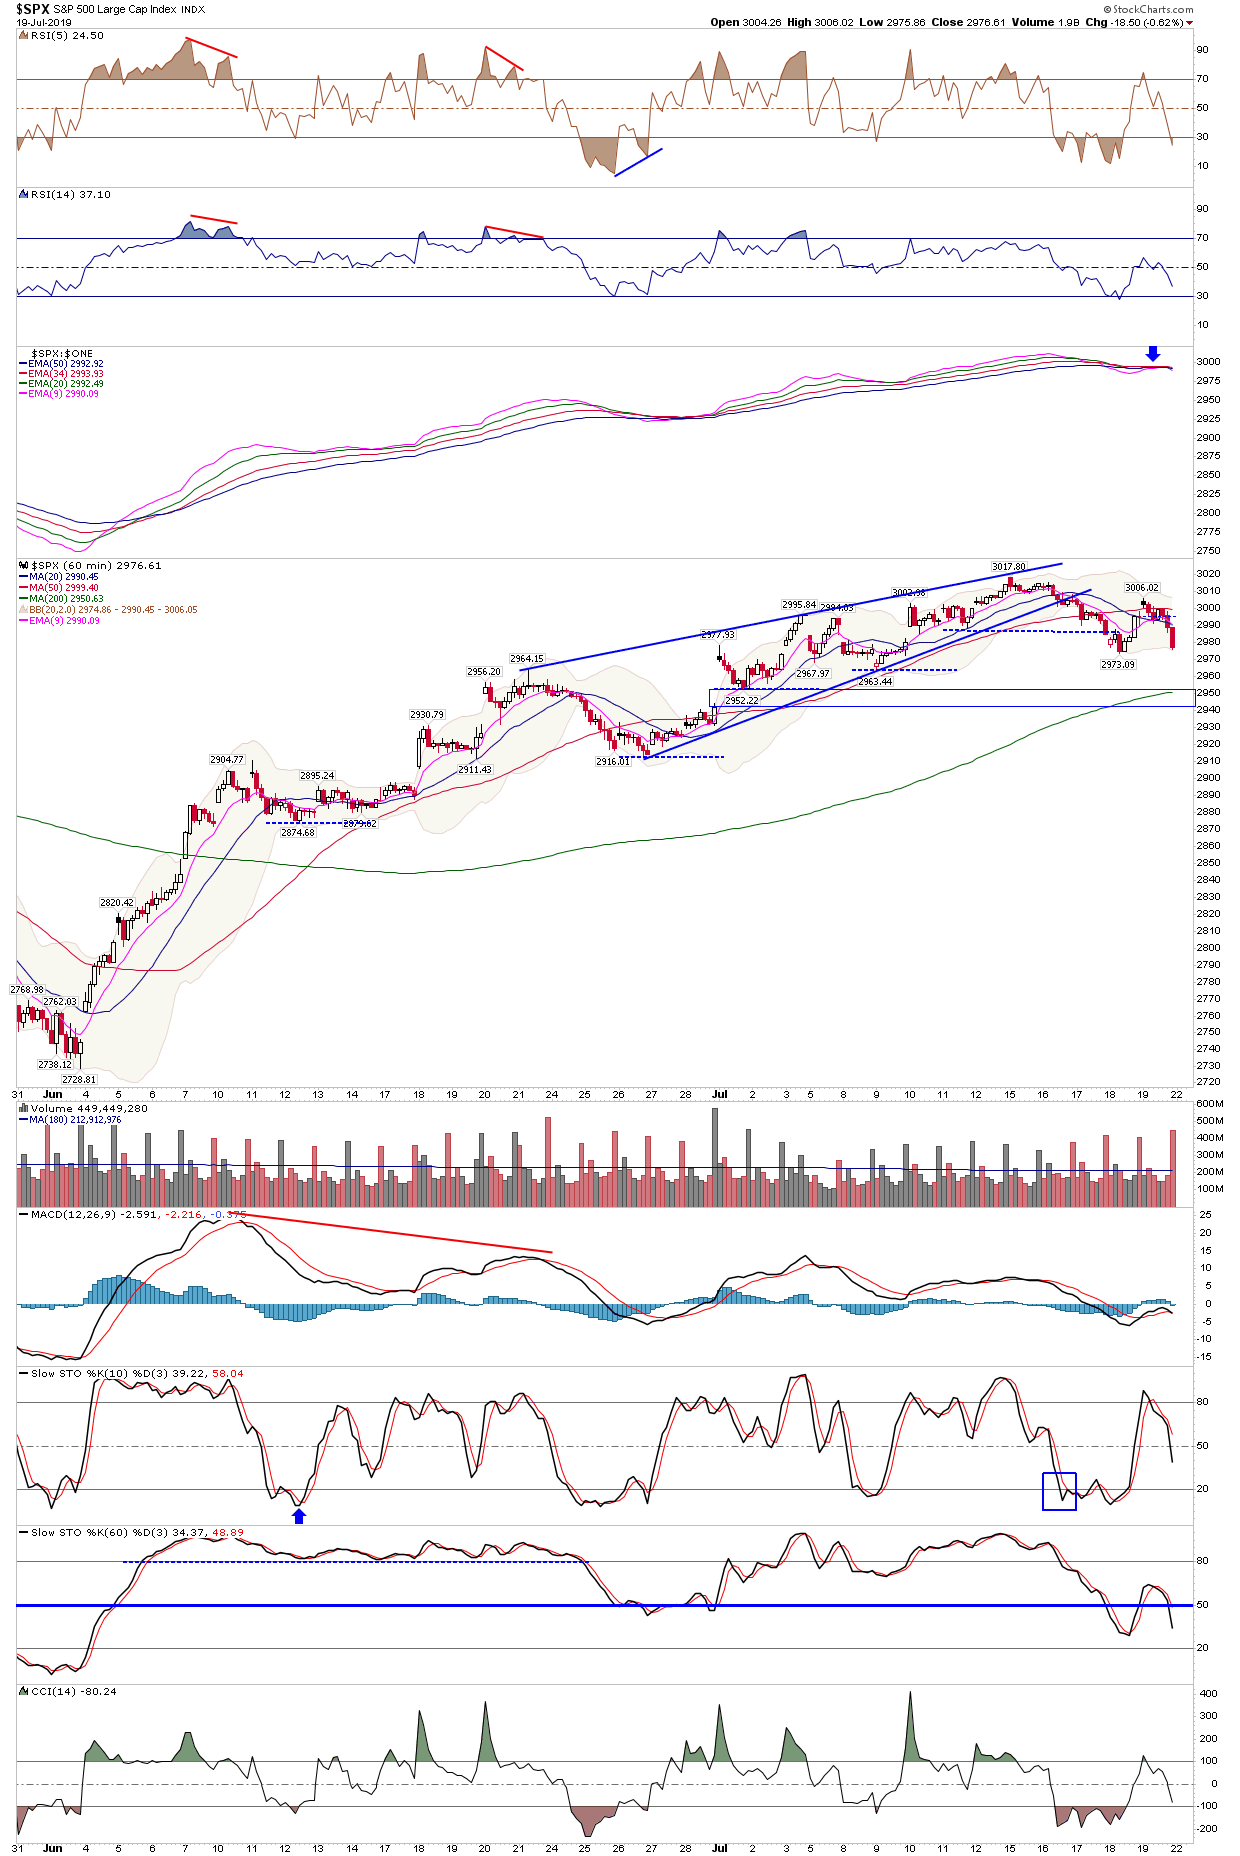
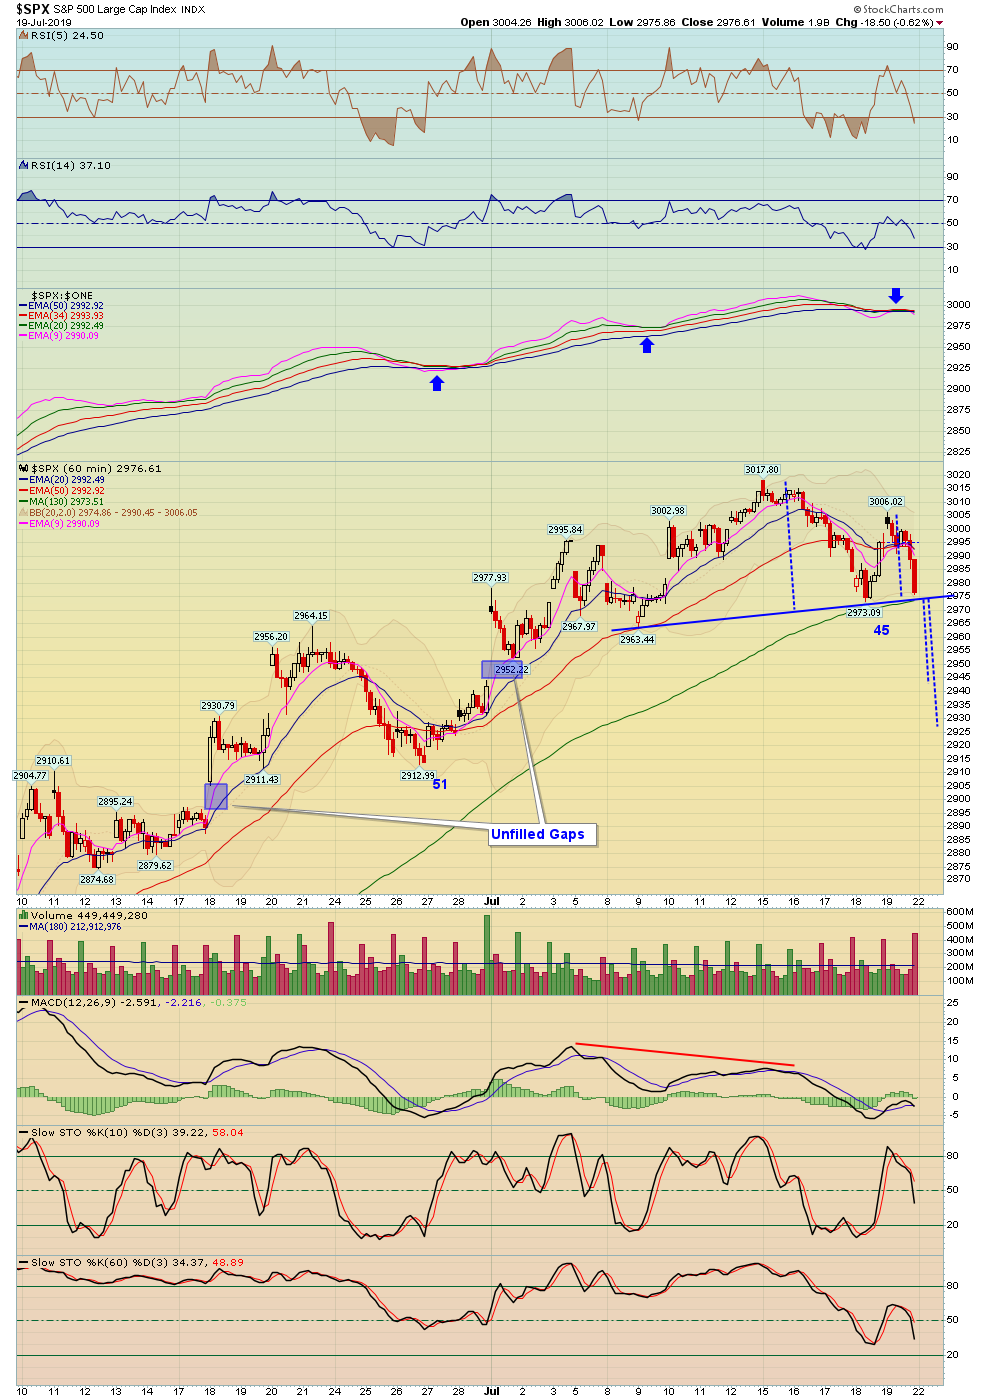
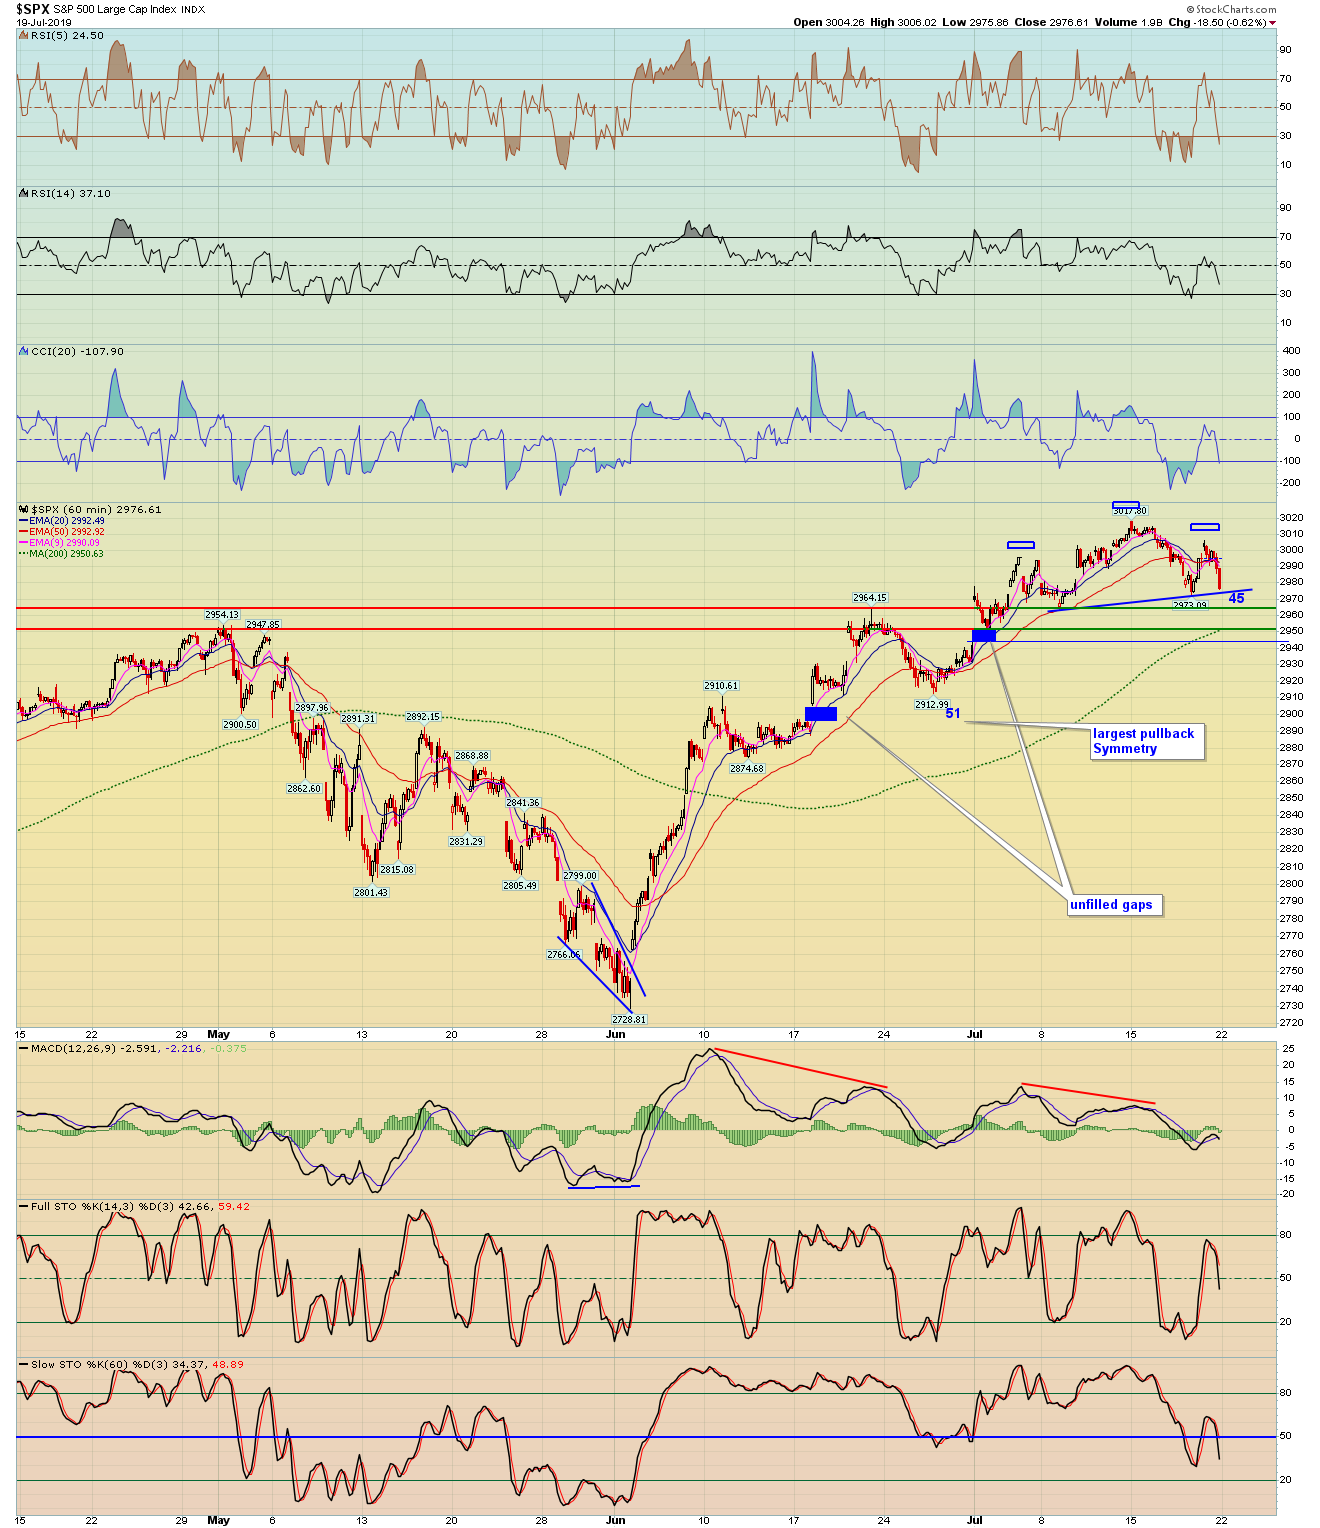
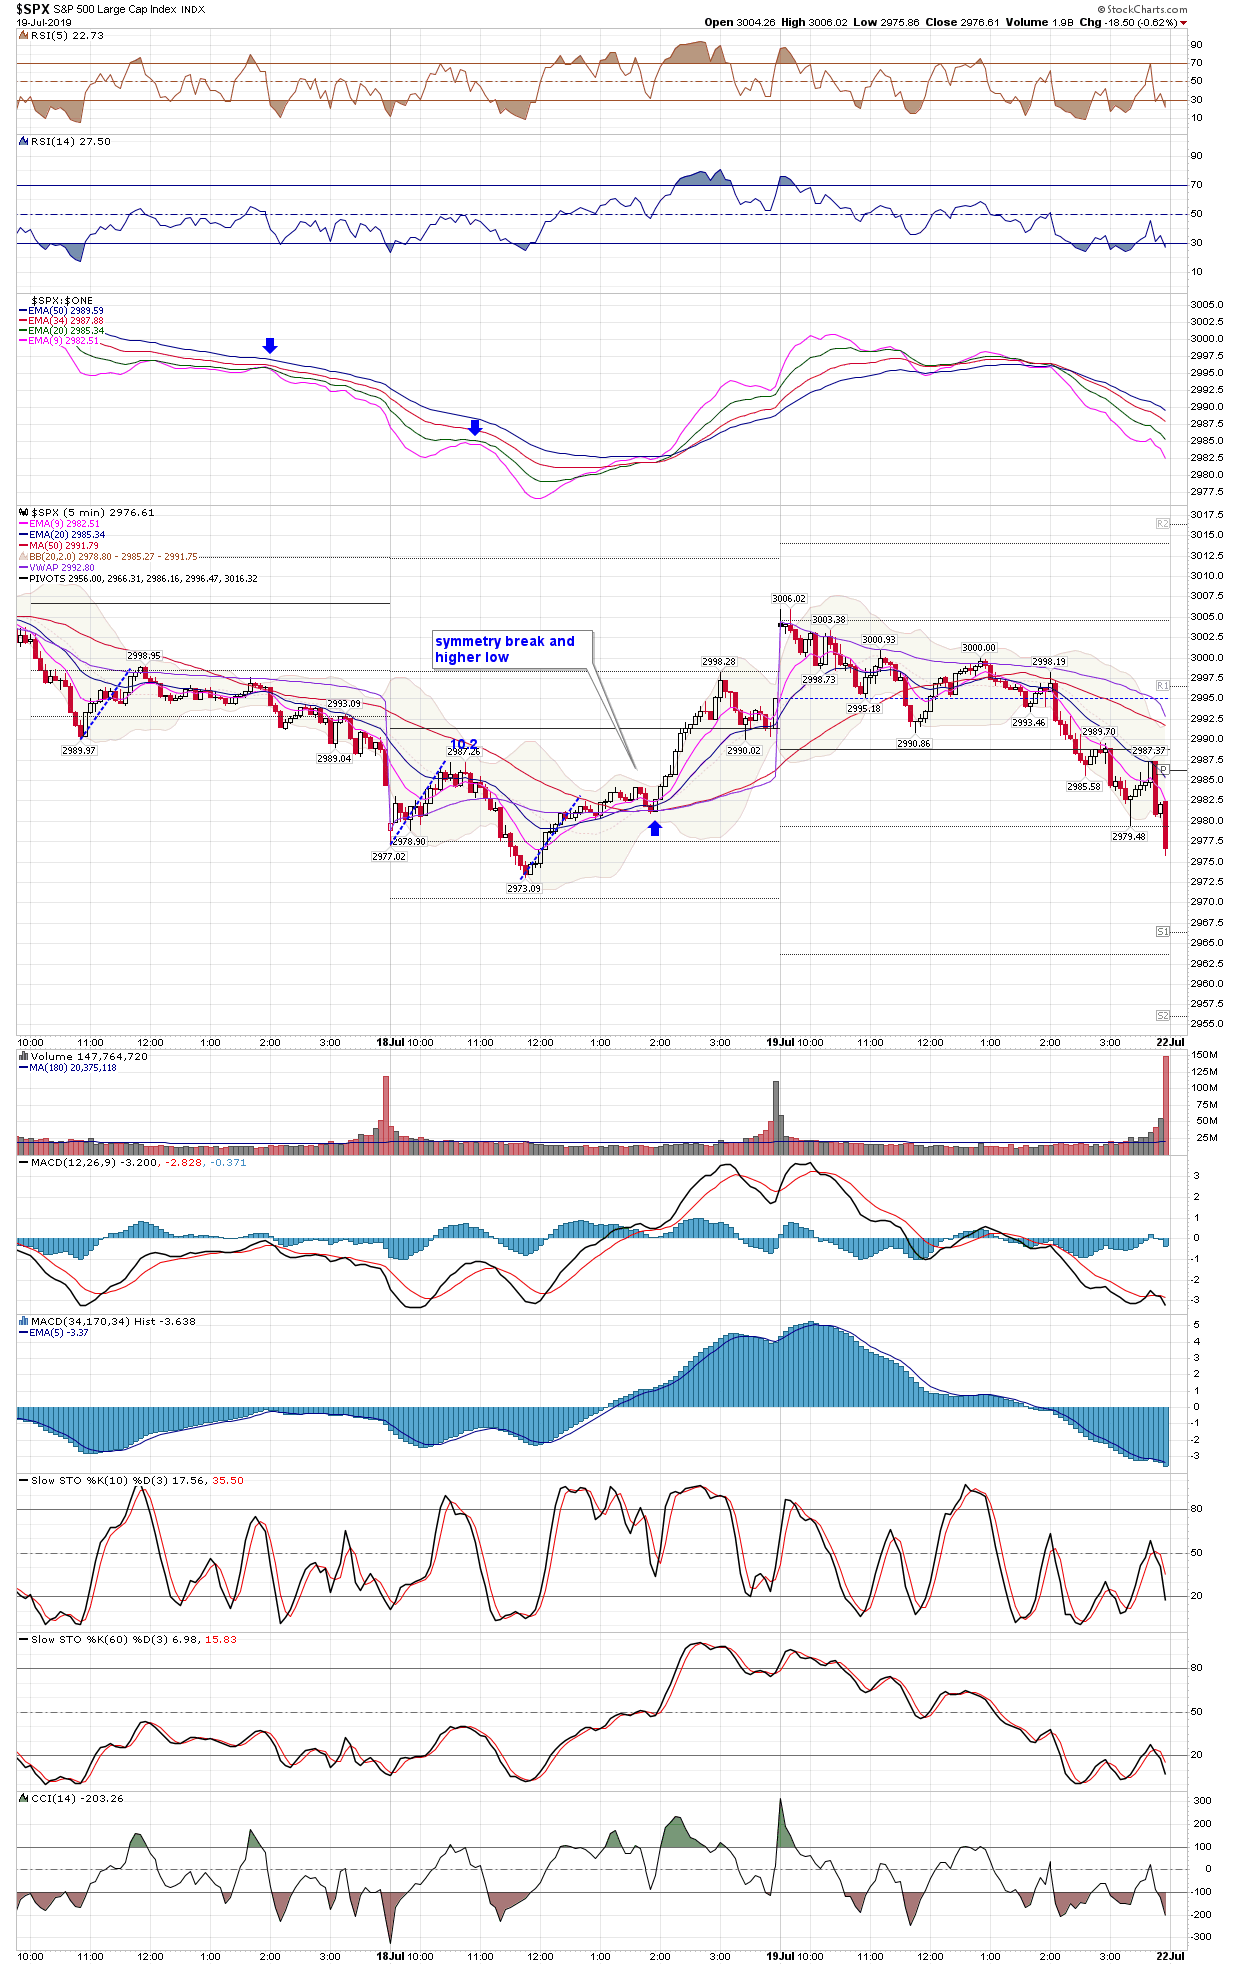
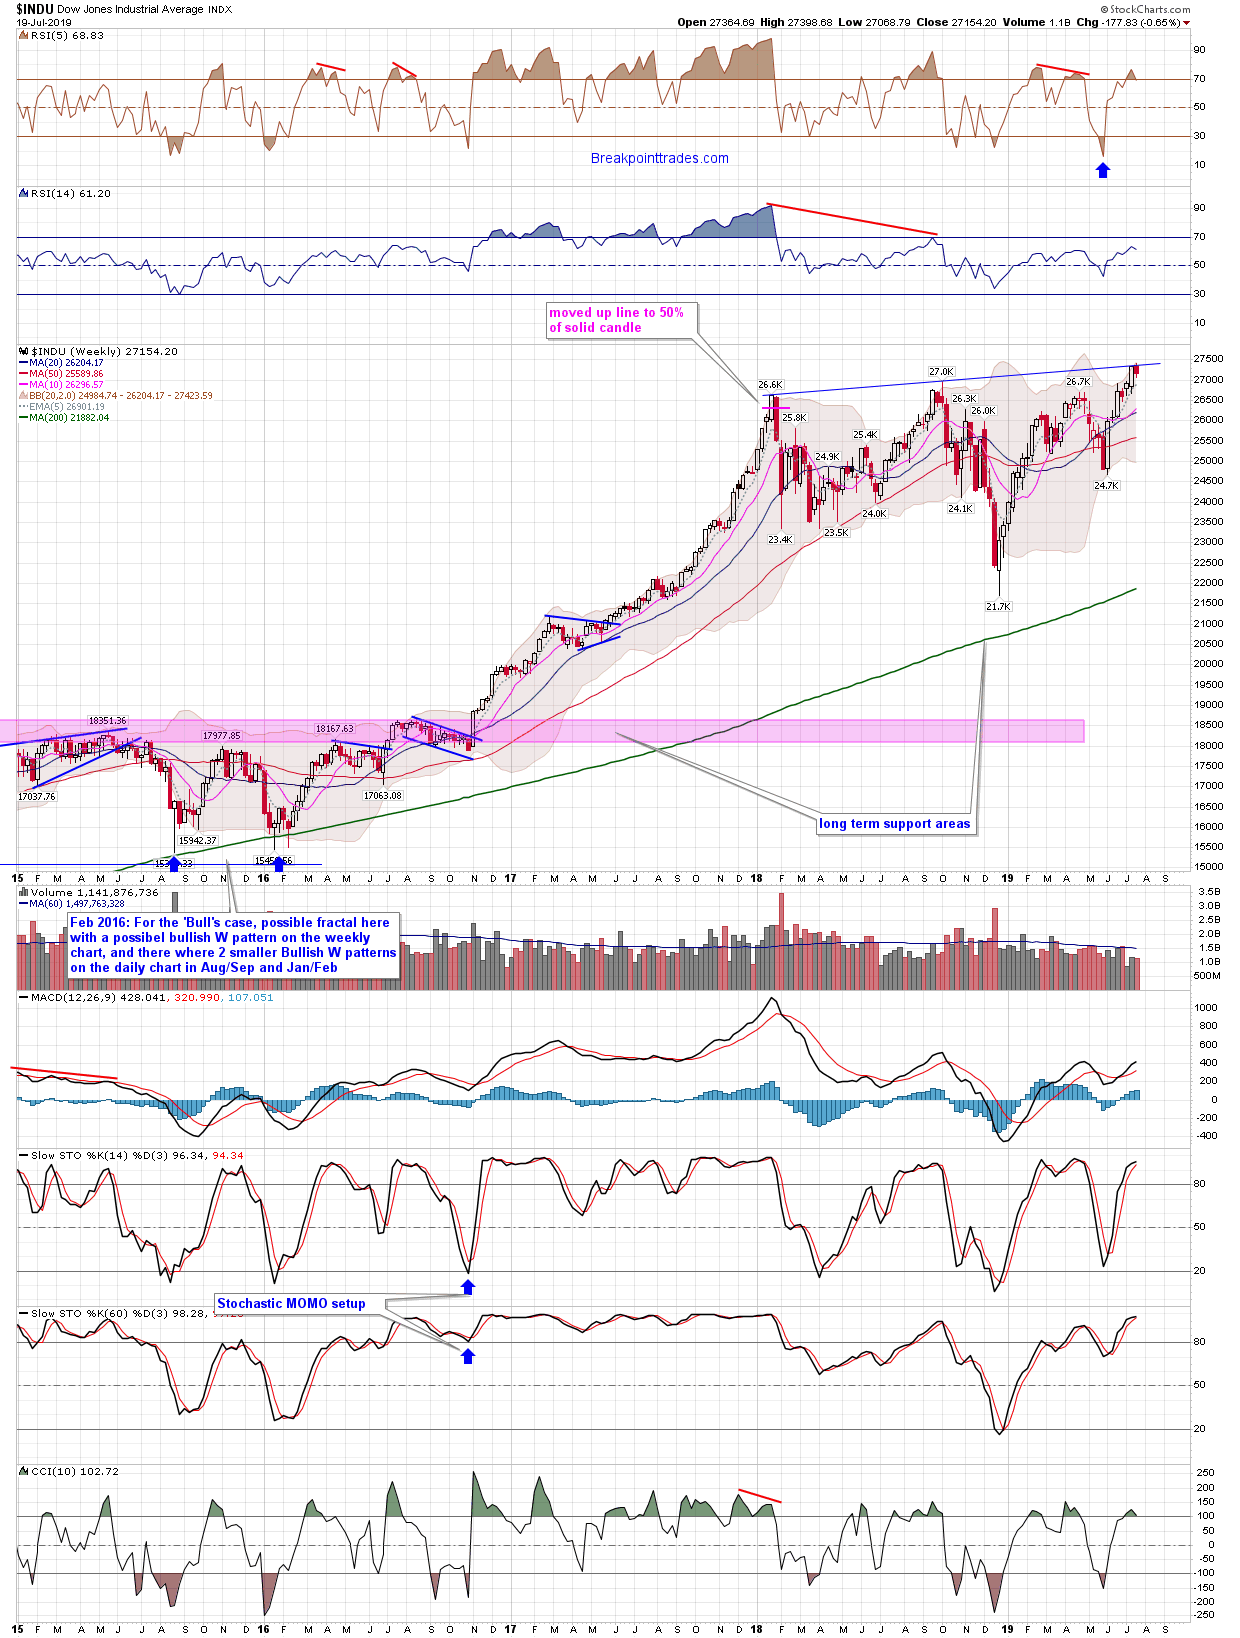
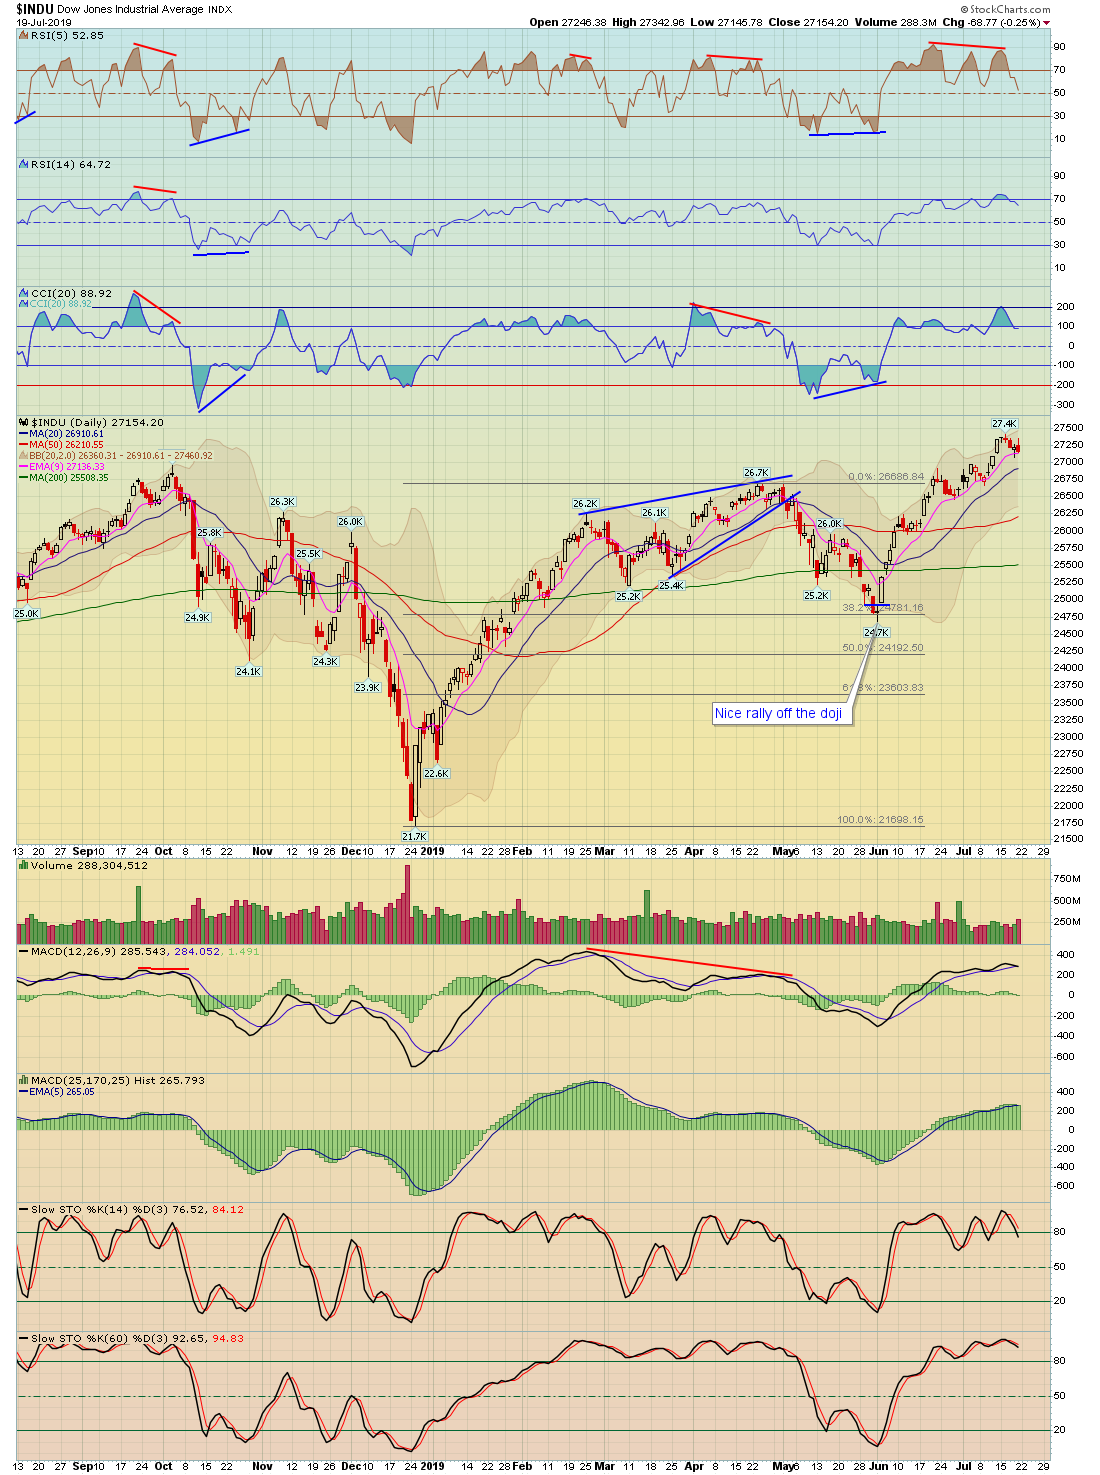
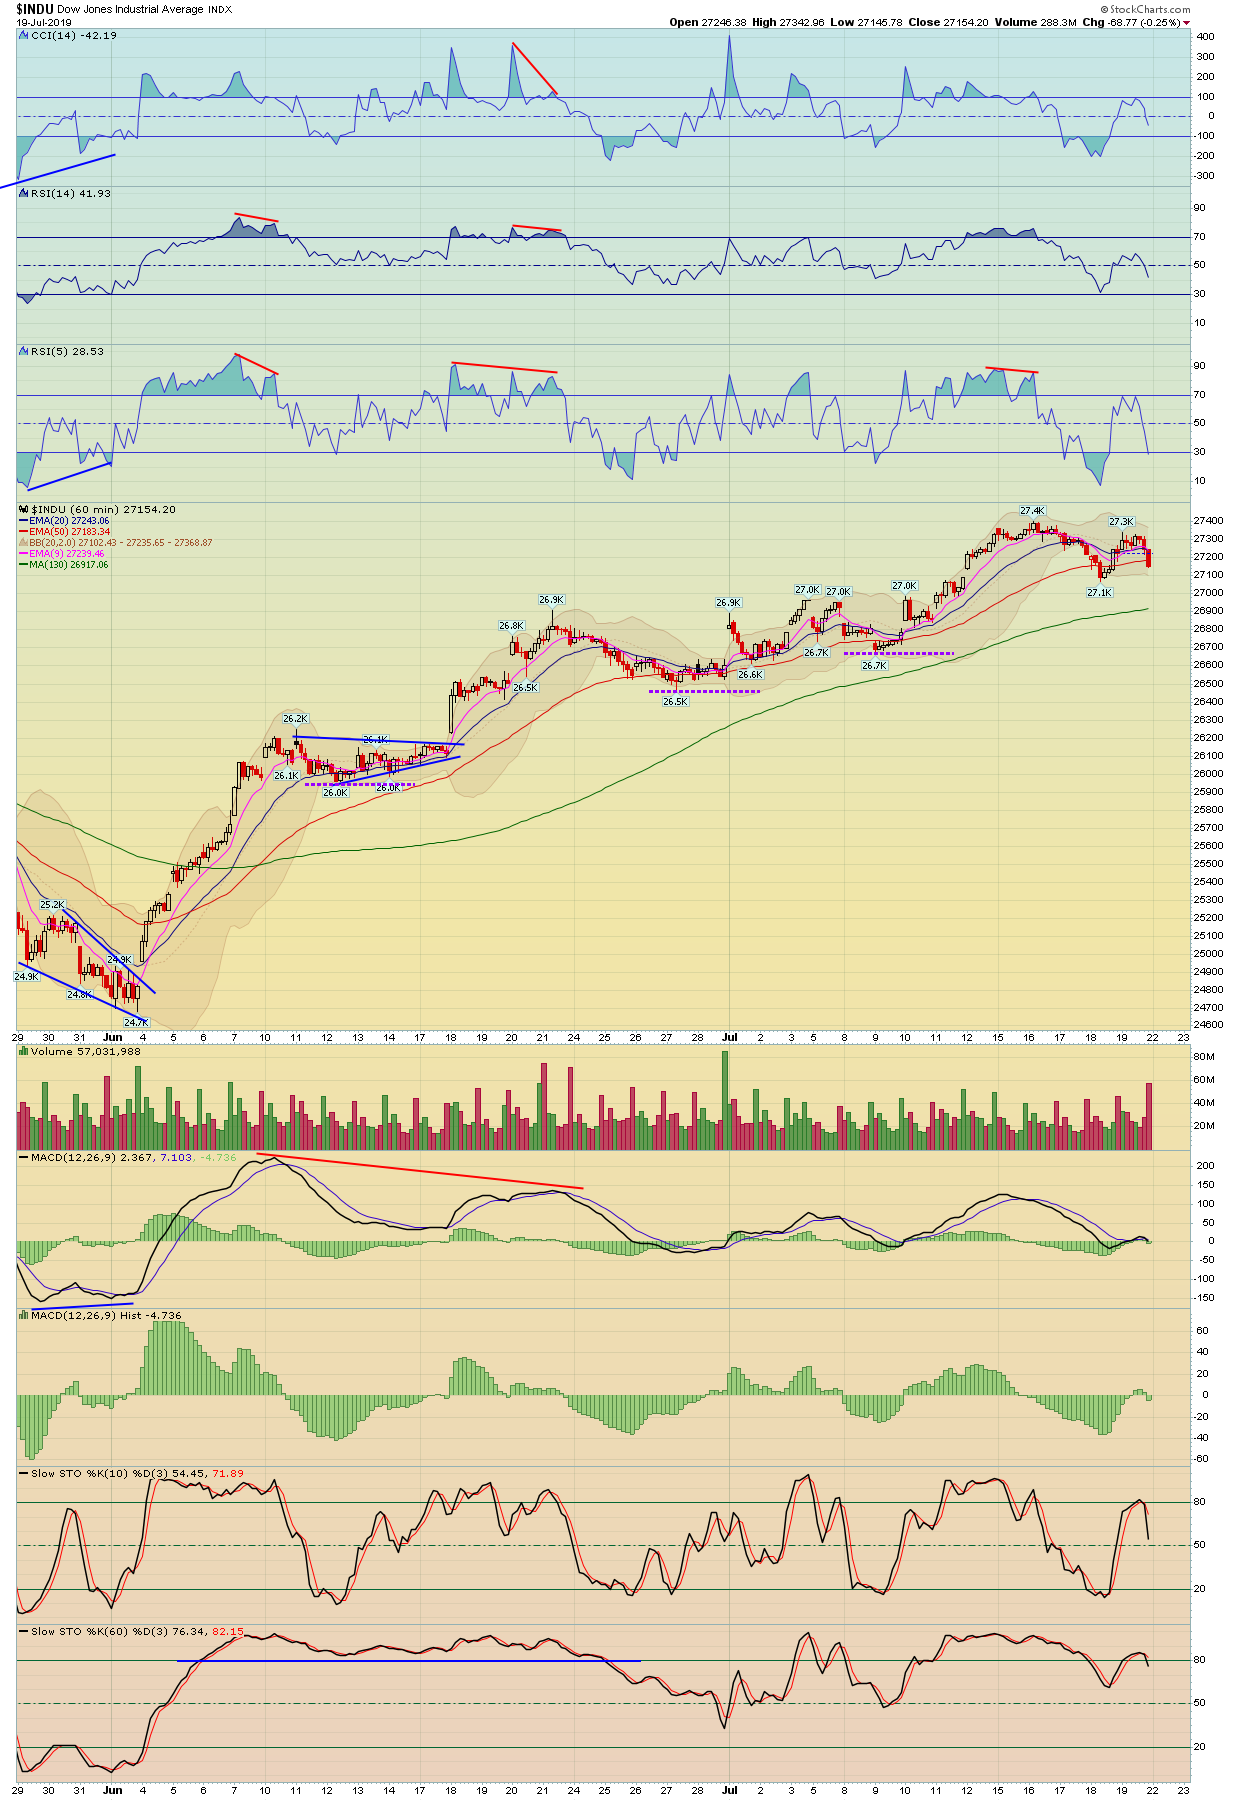
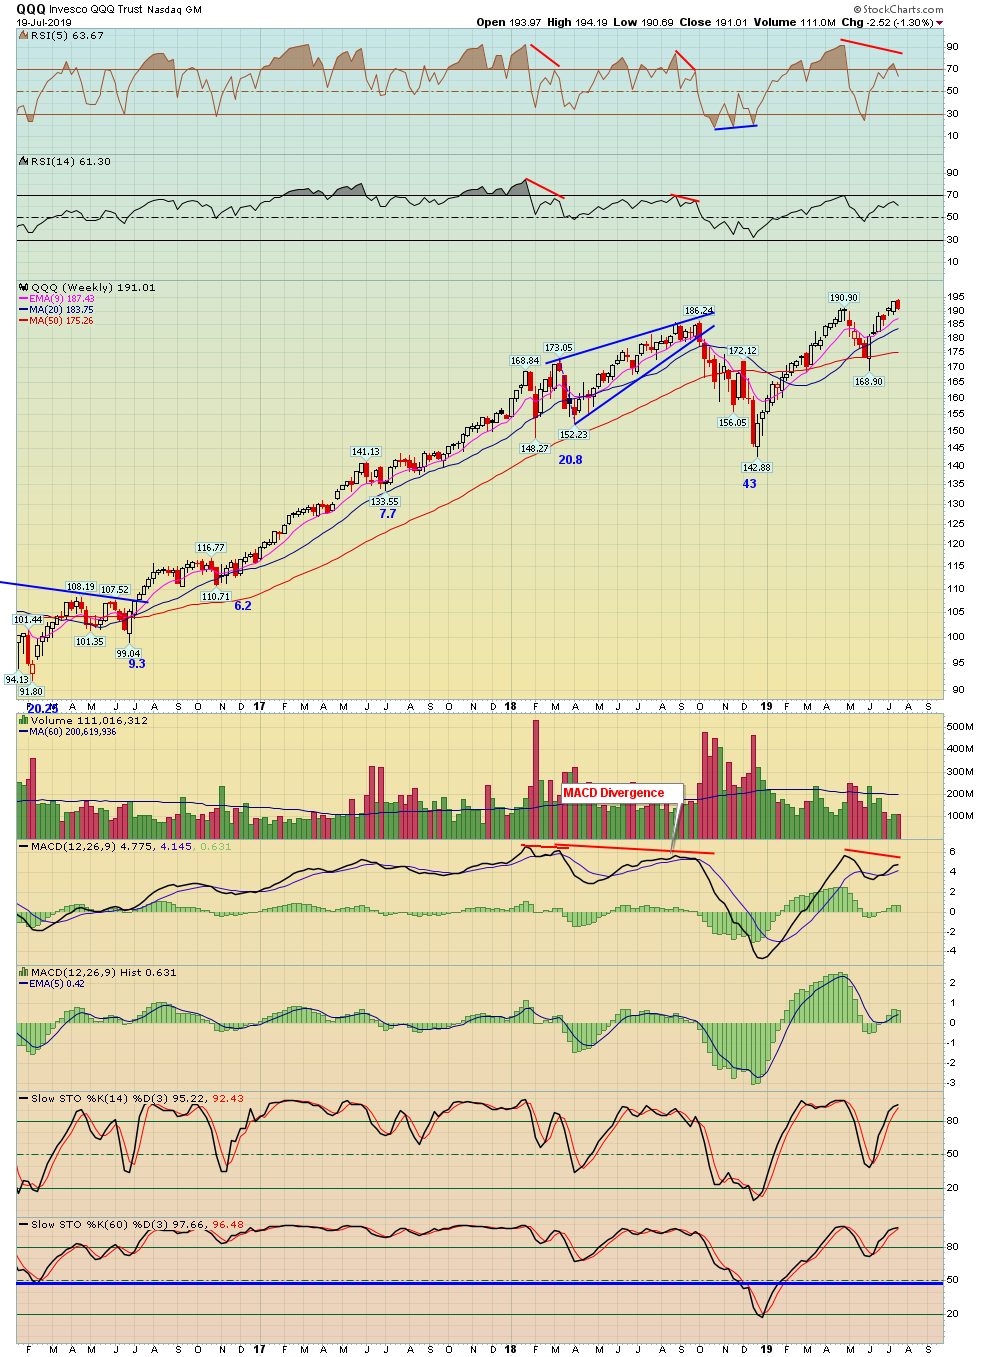
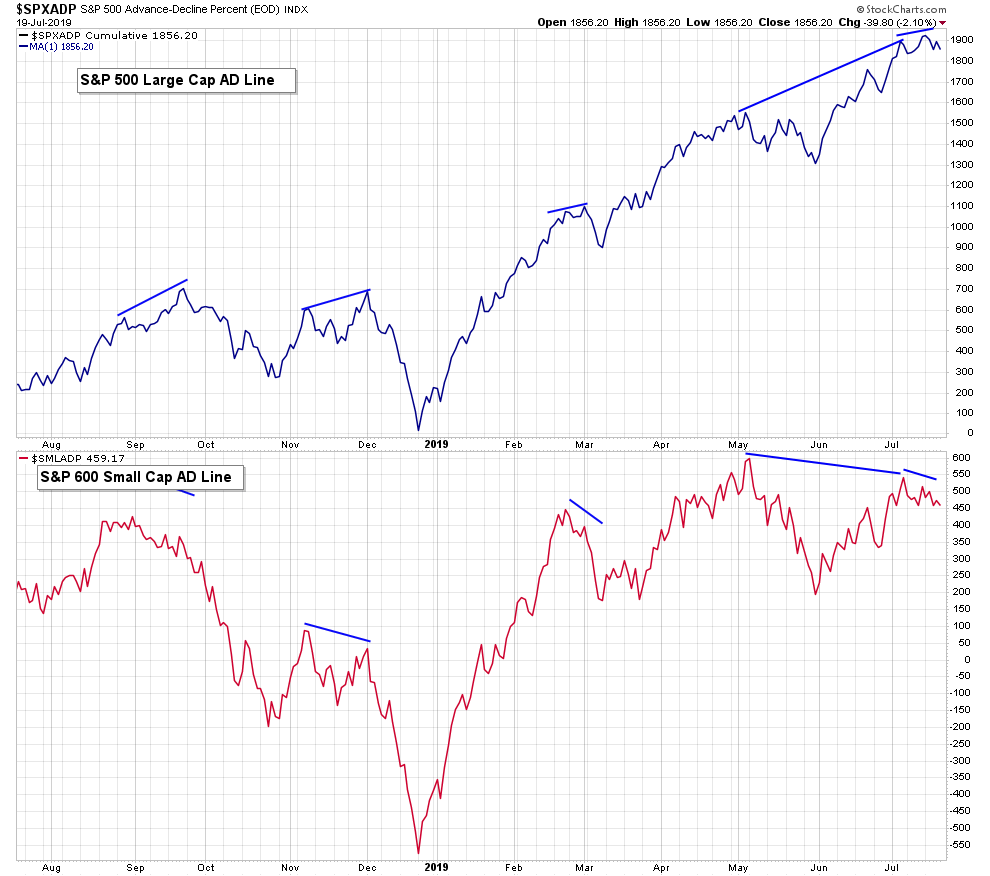
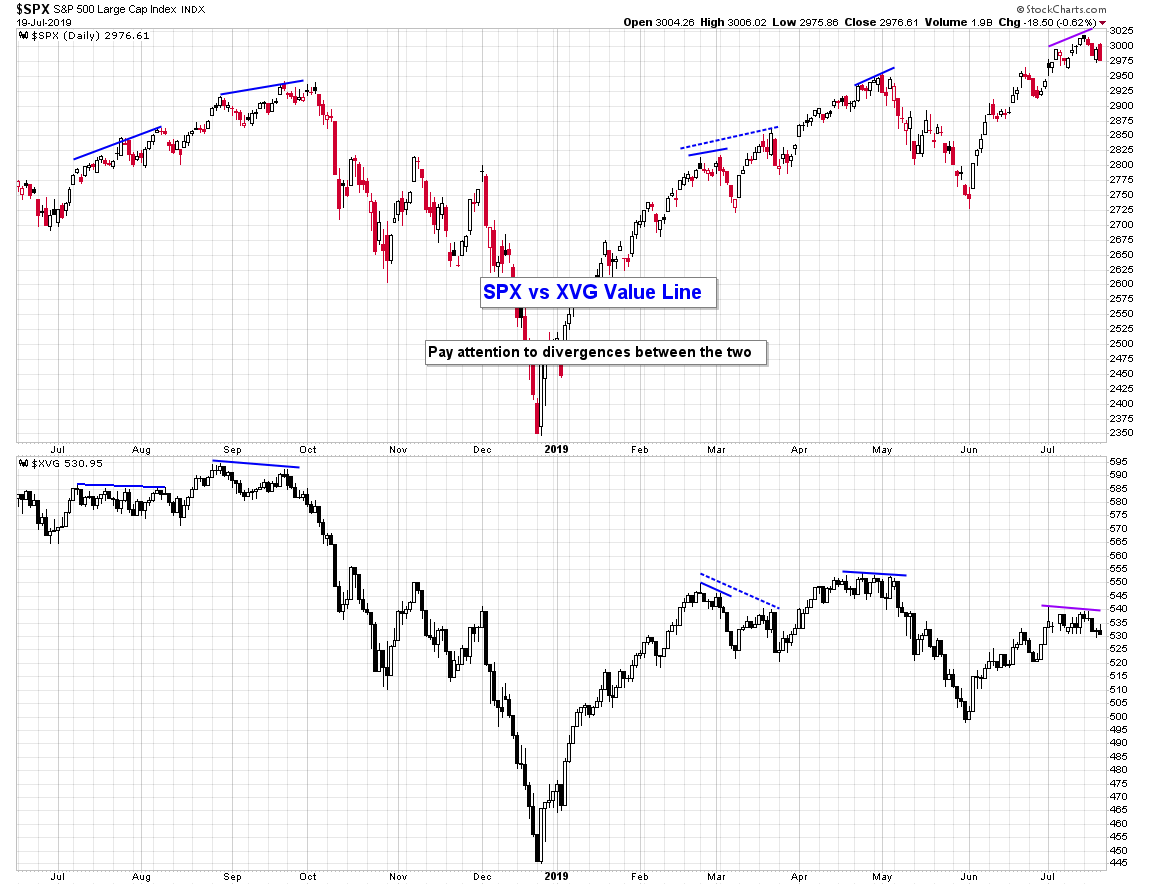
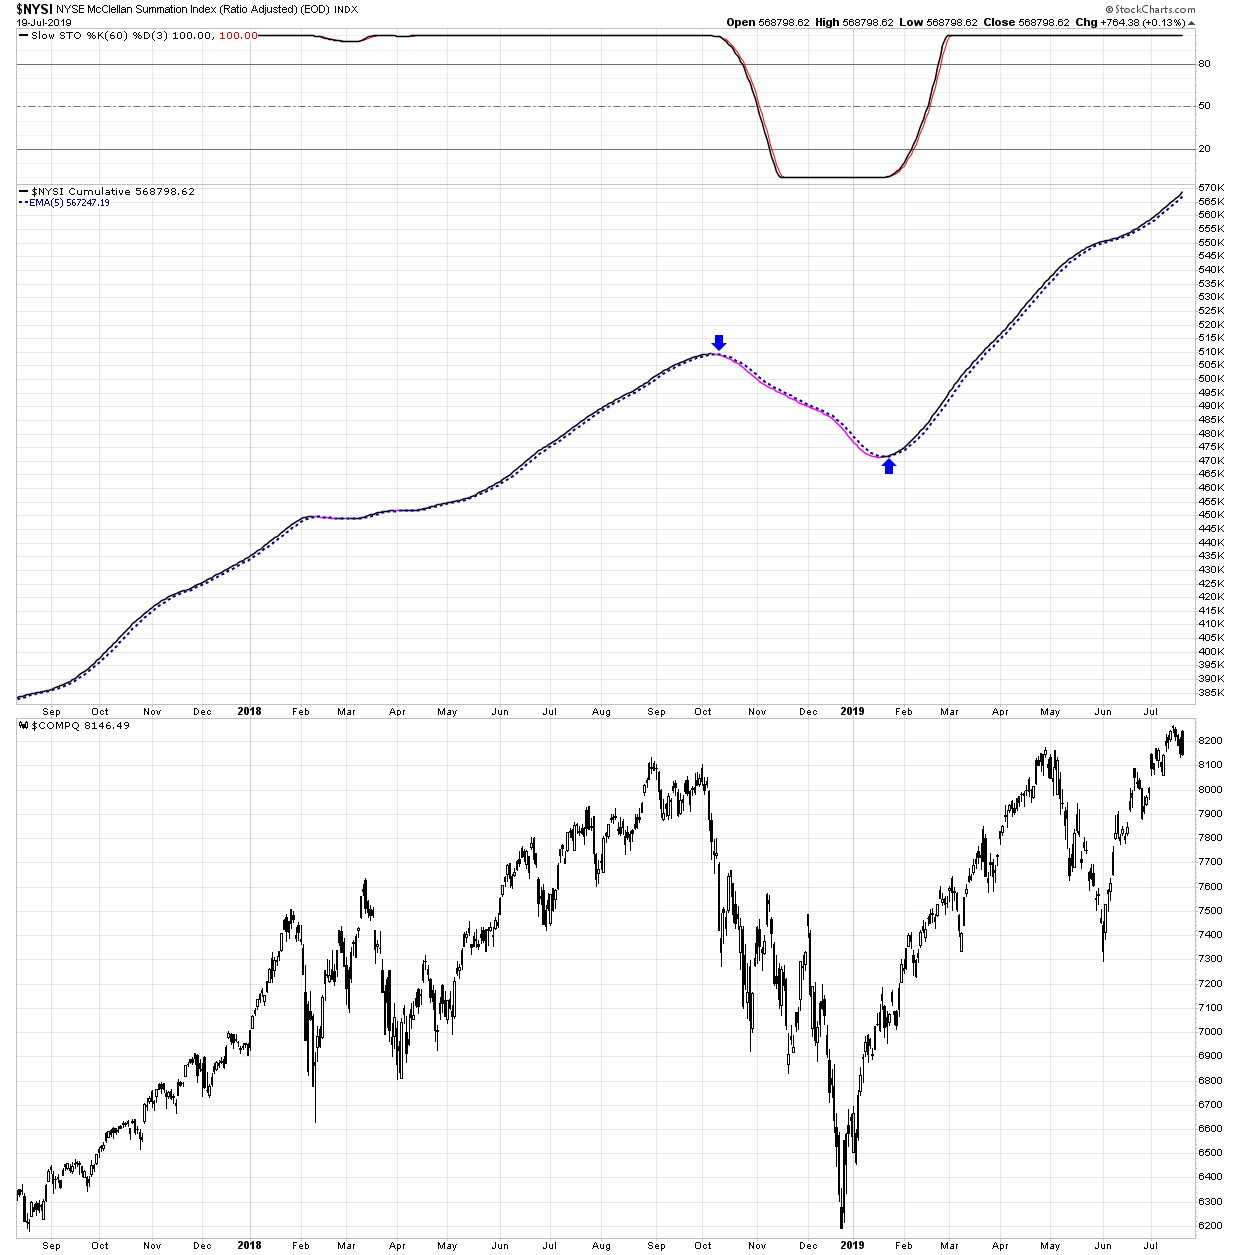
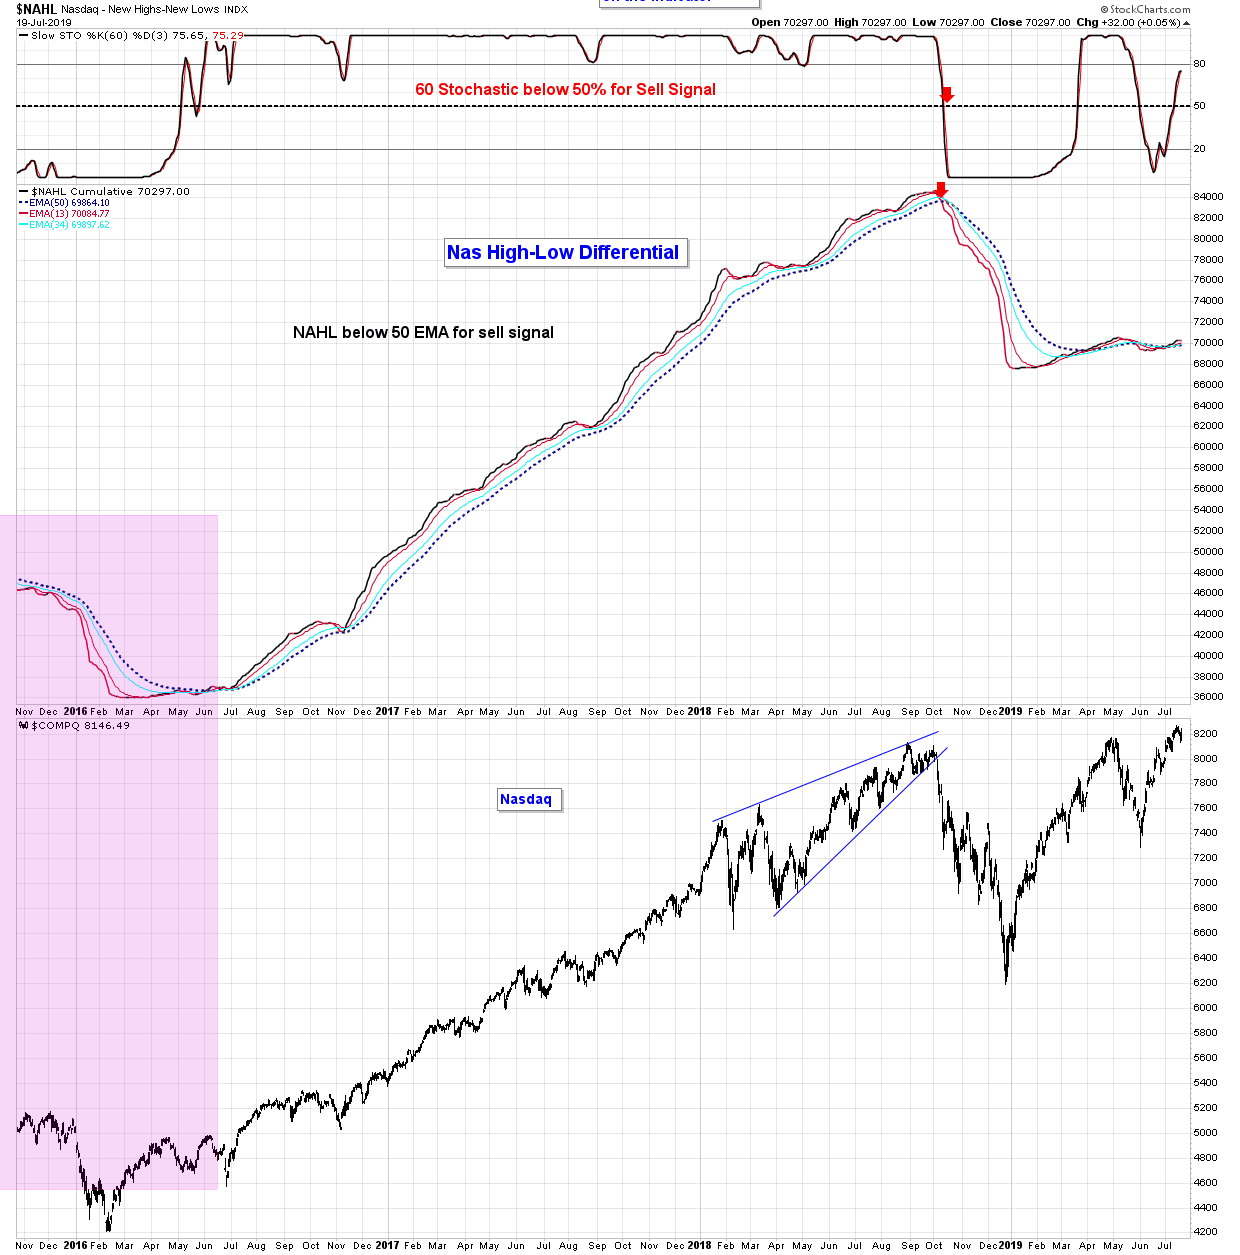
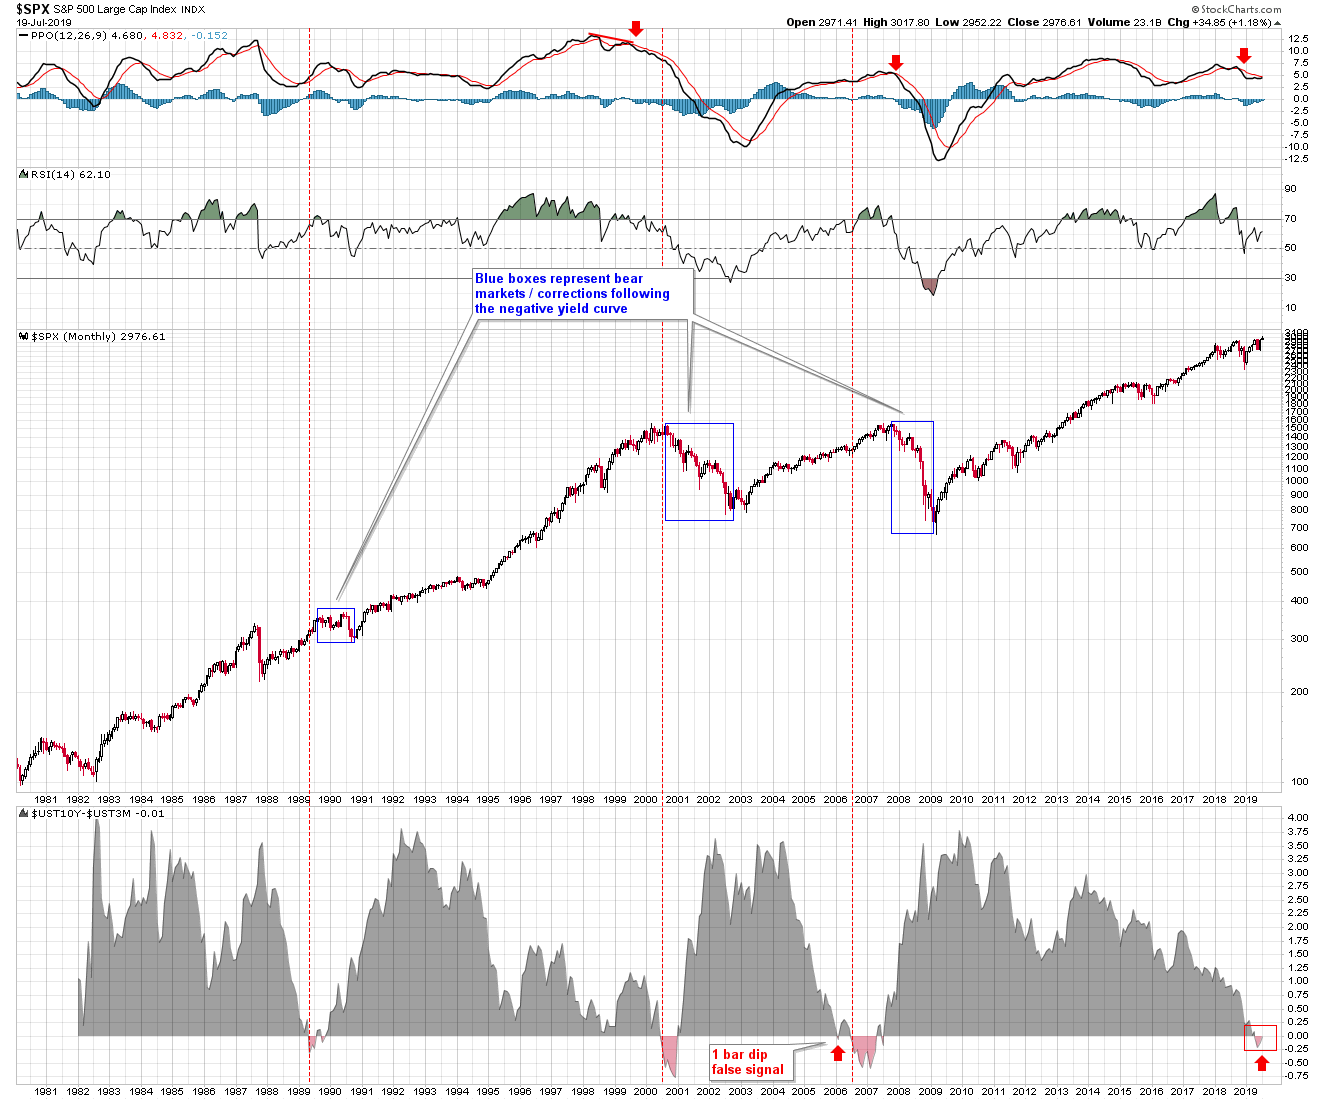
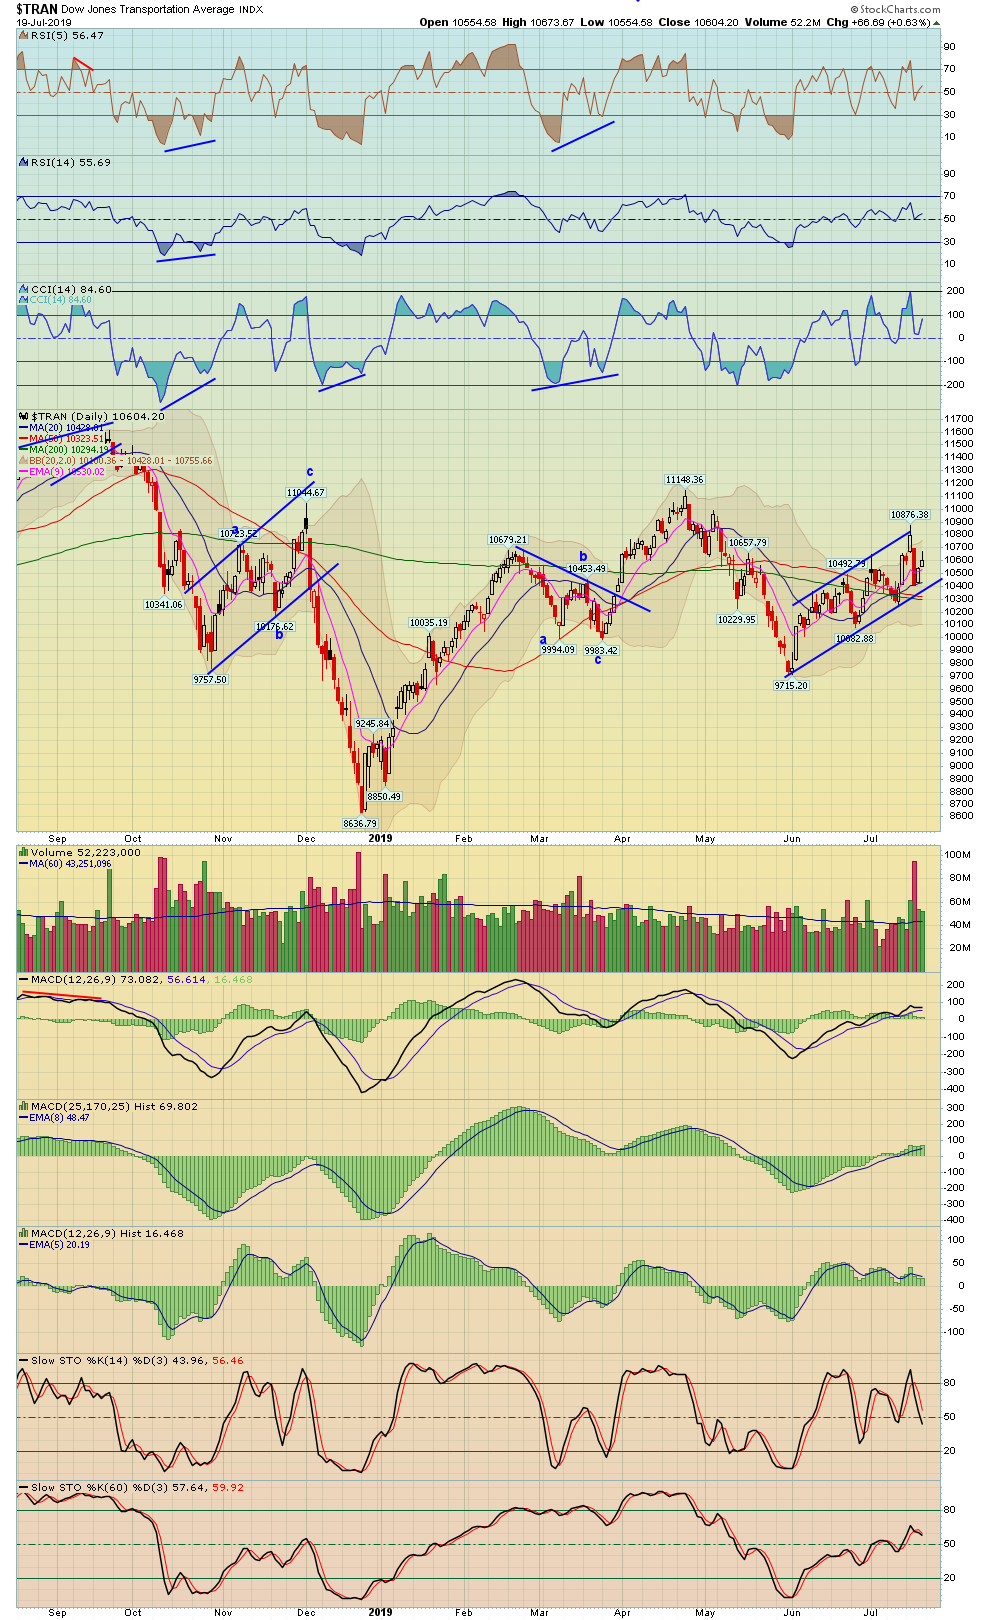
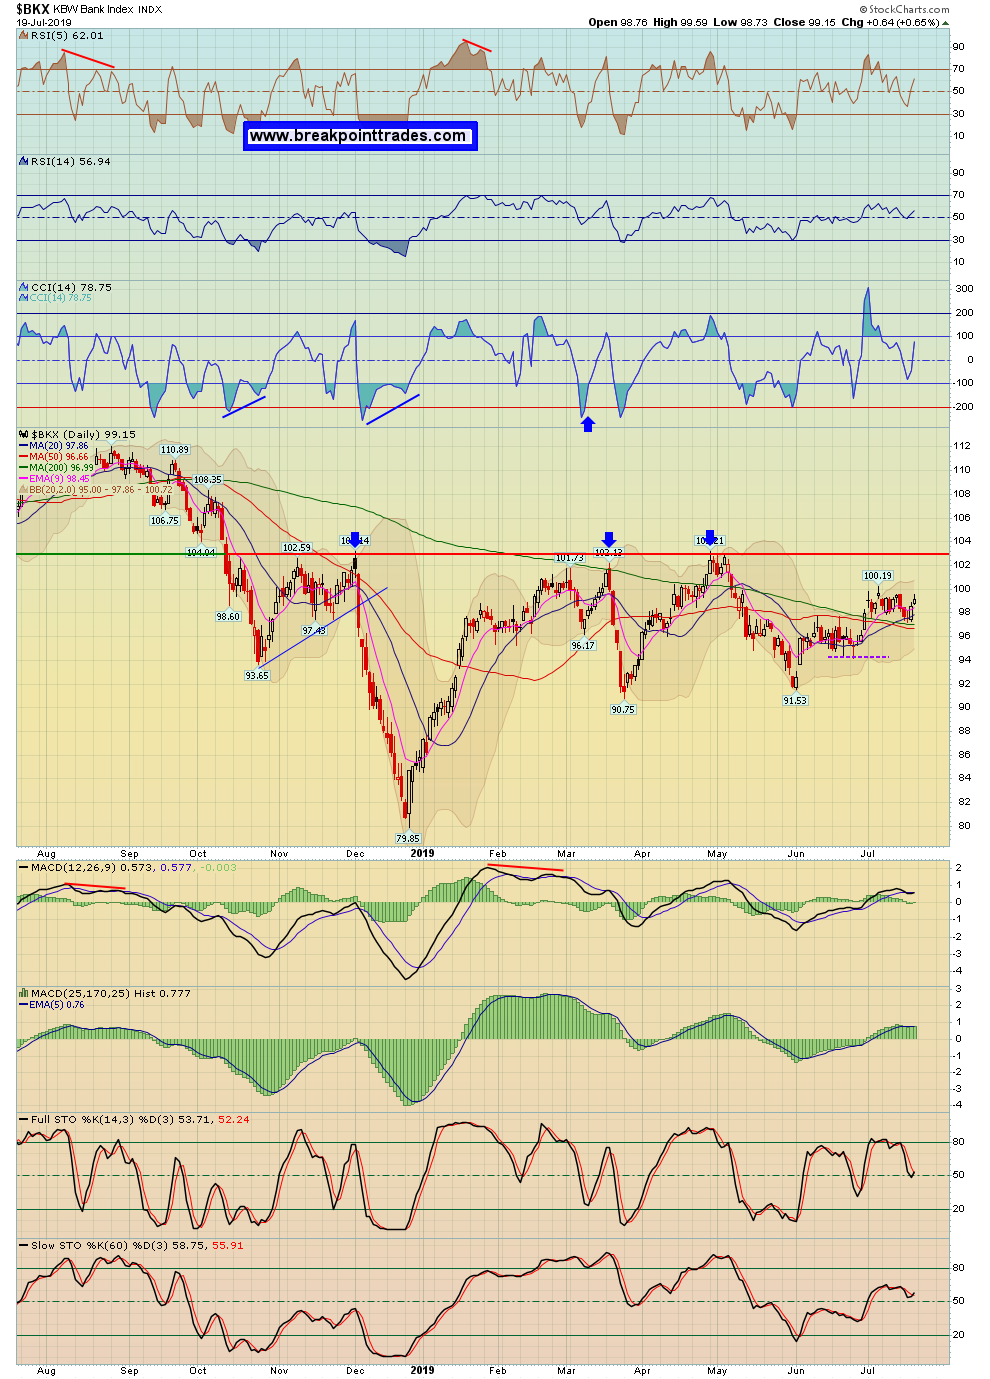
2. Review of the Major Indexes/Indicators
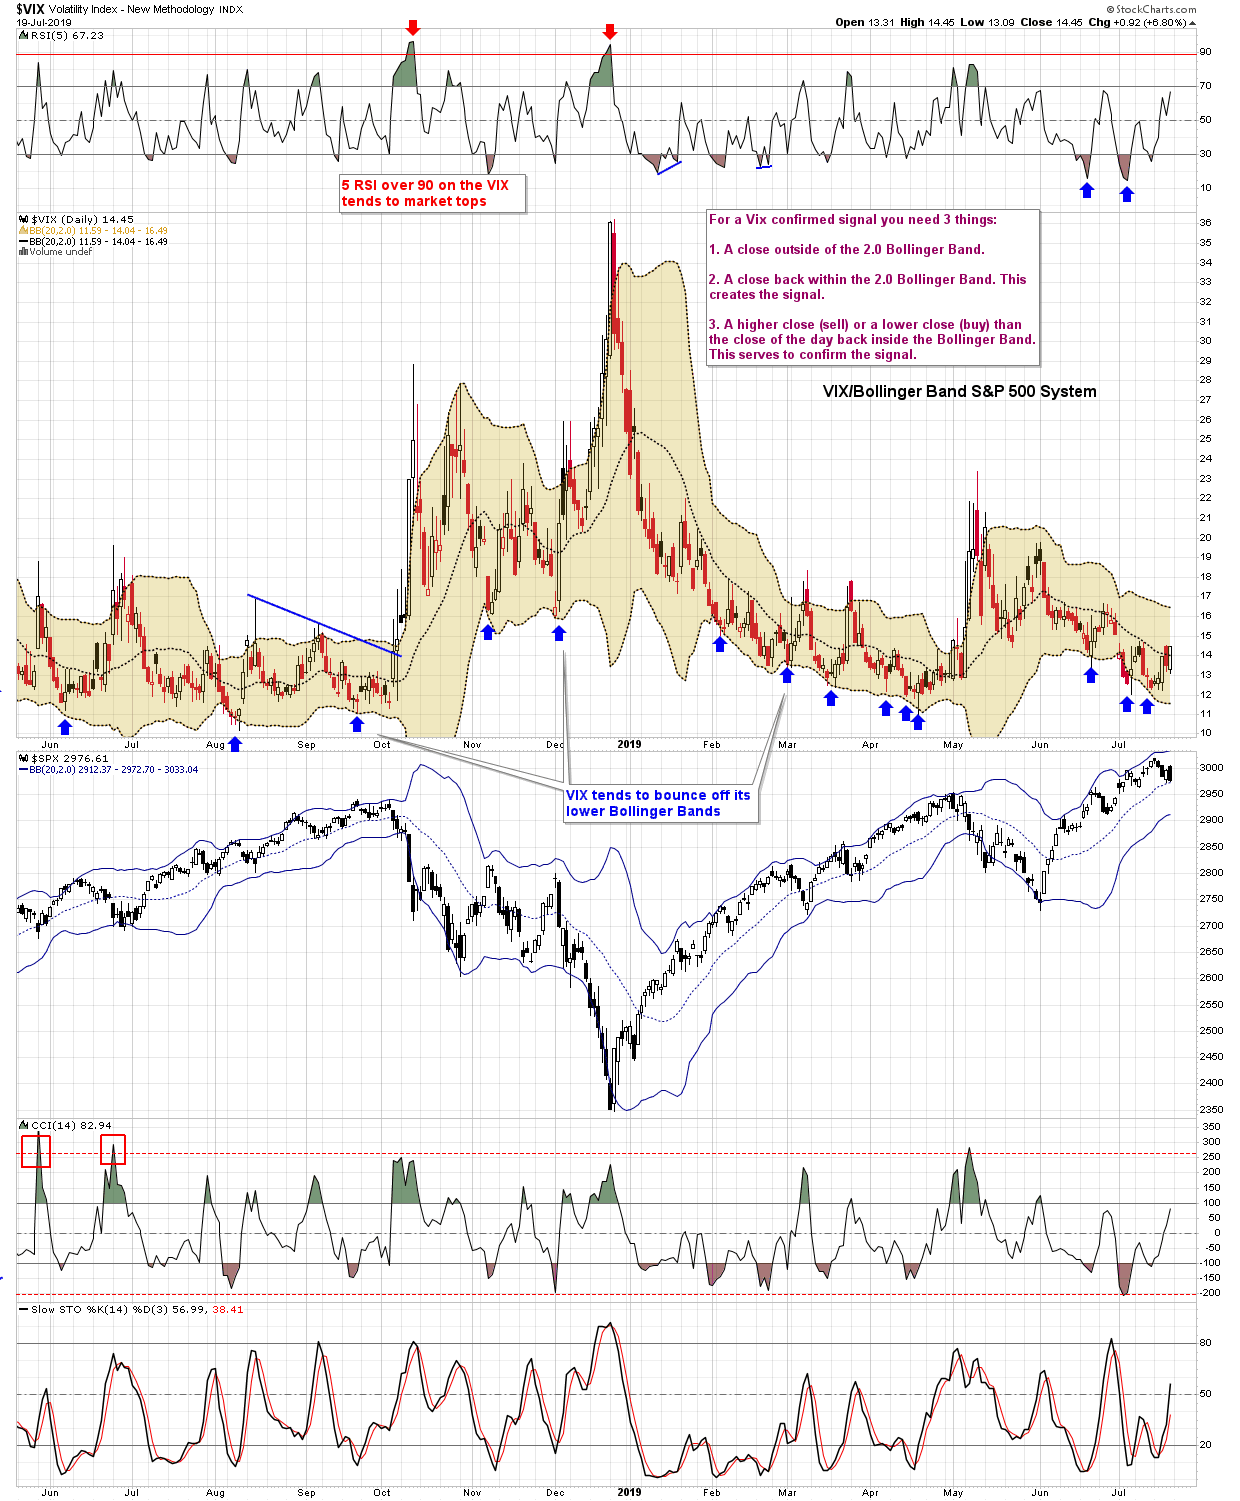
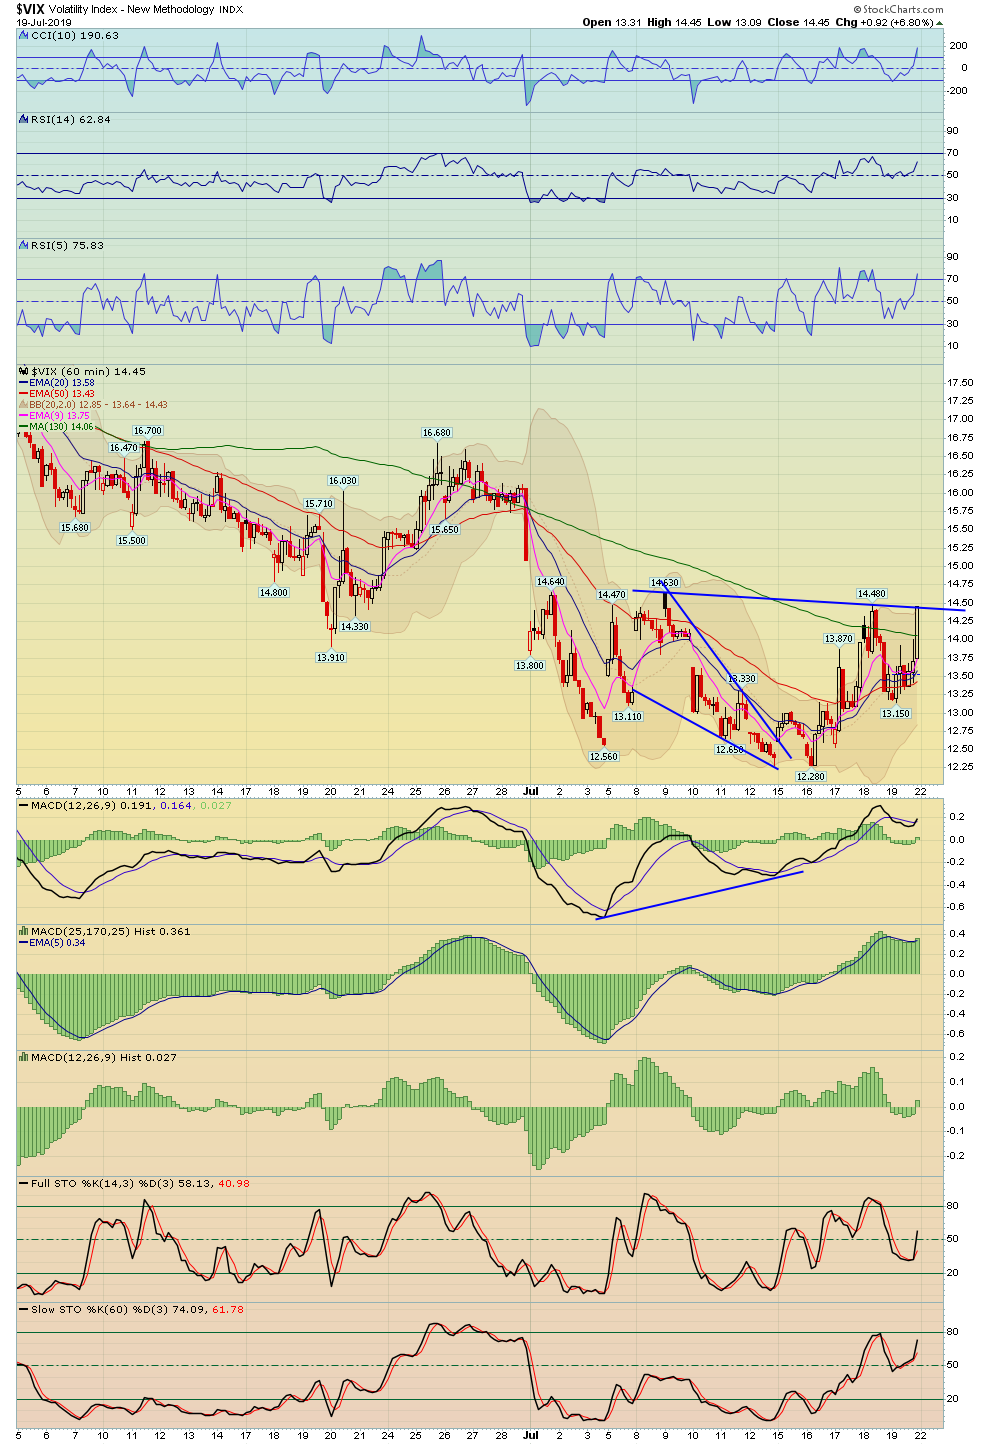
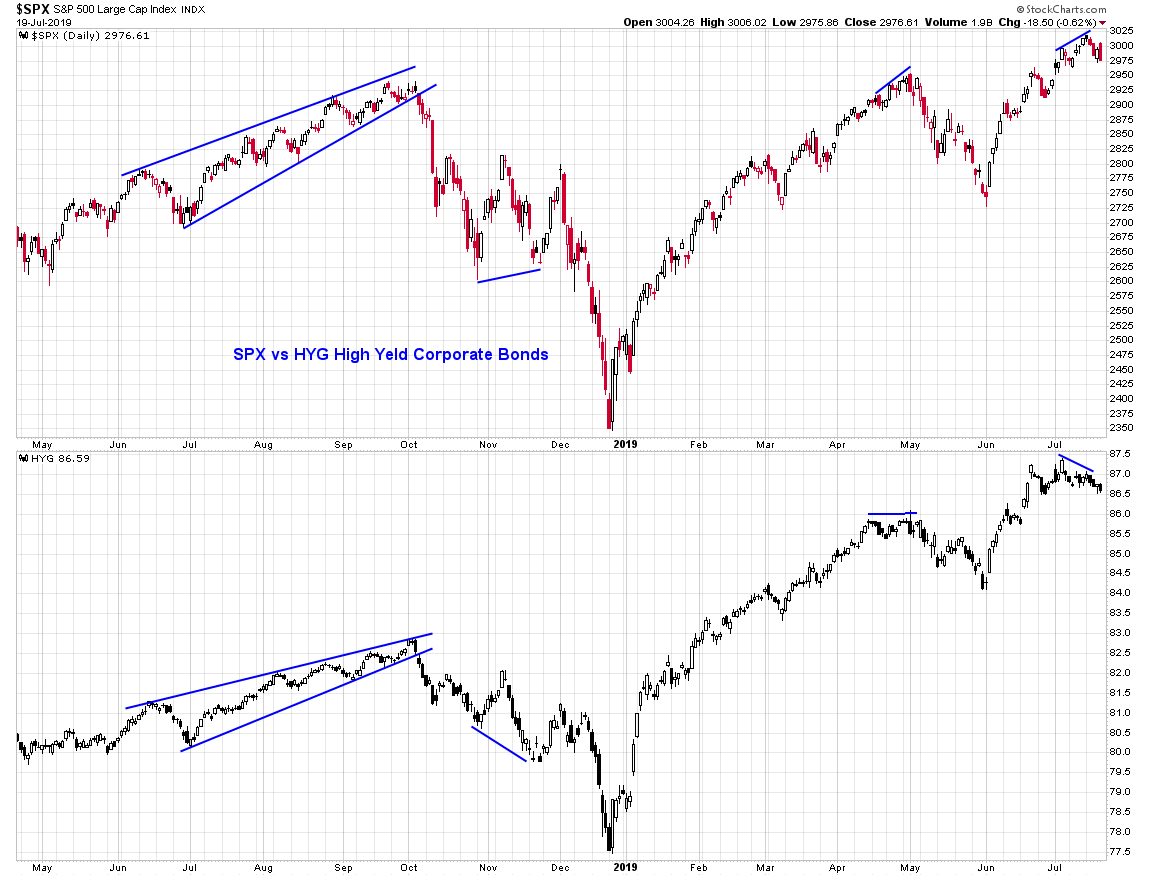
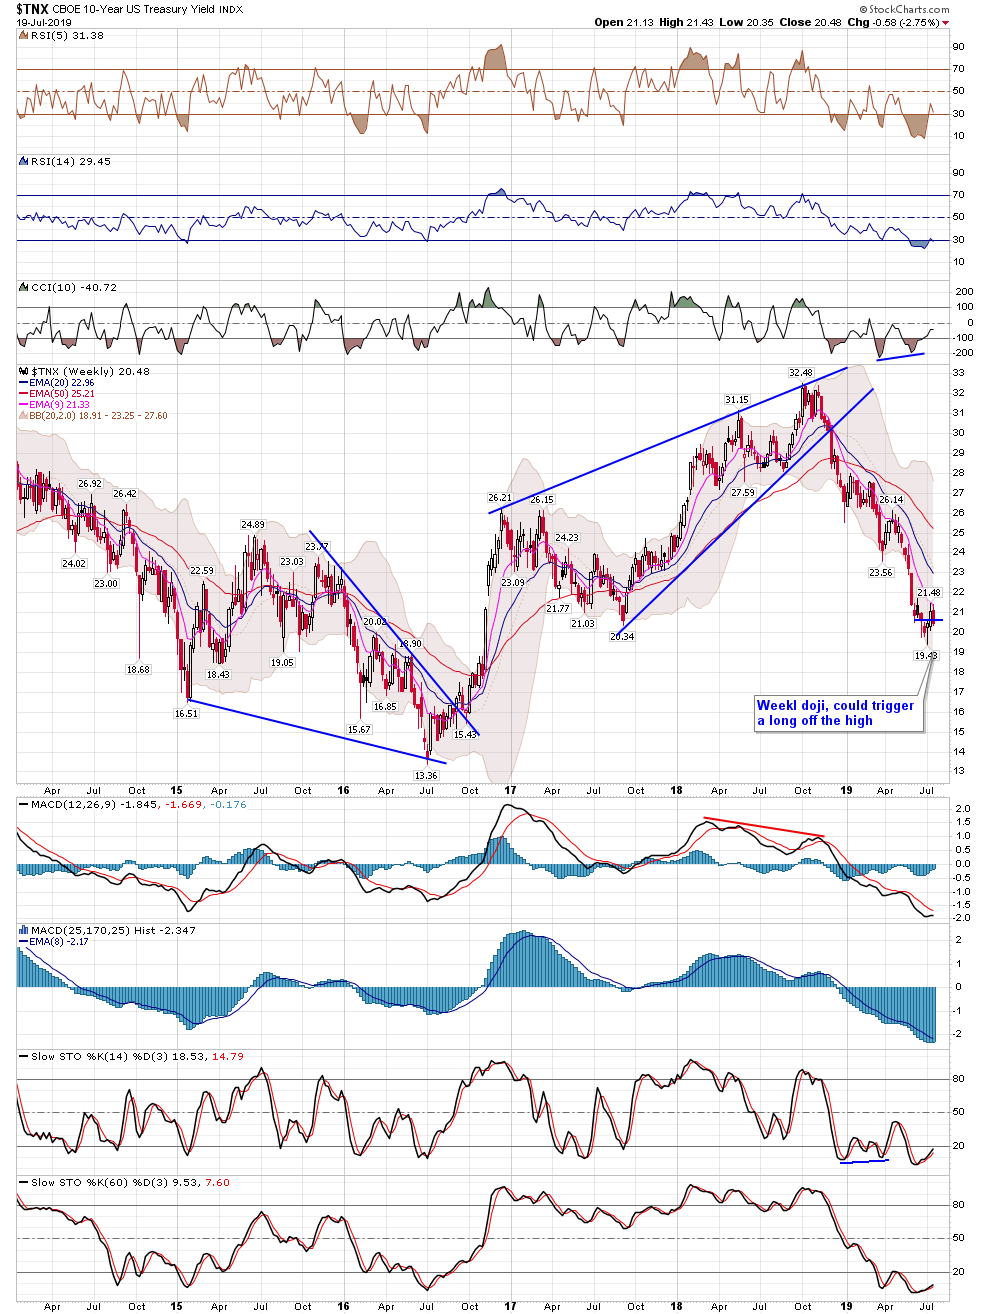
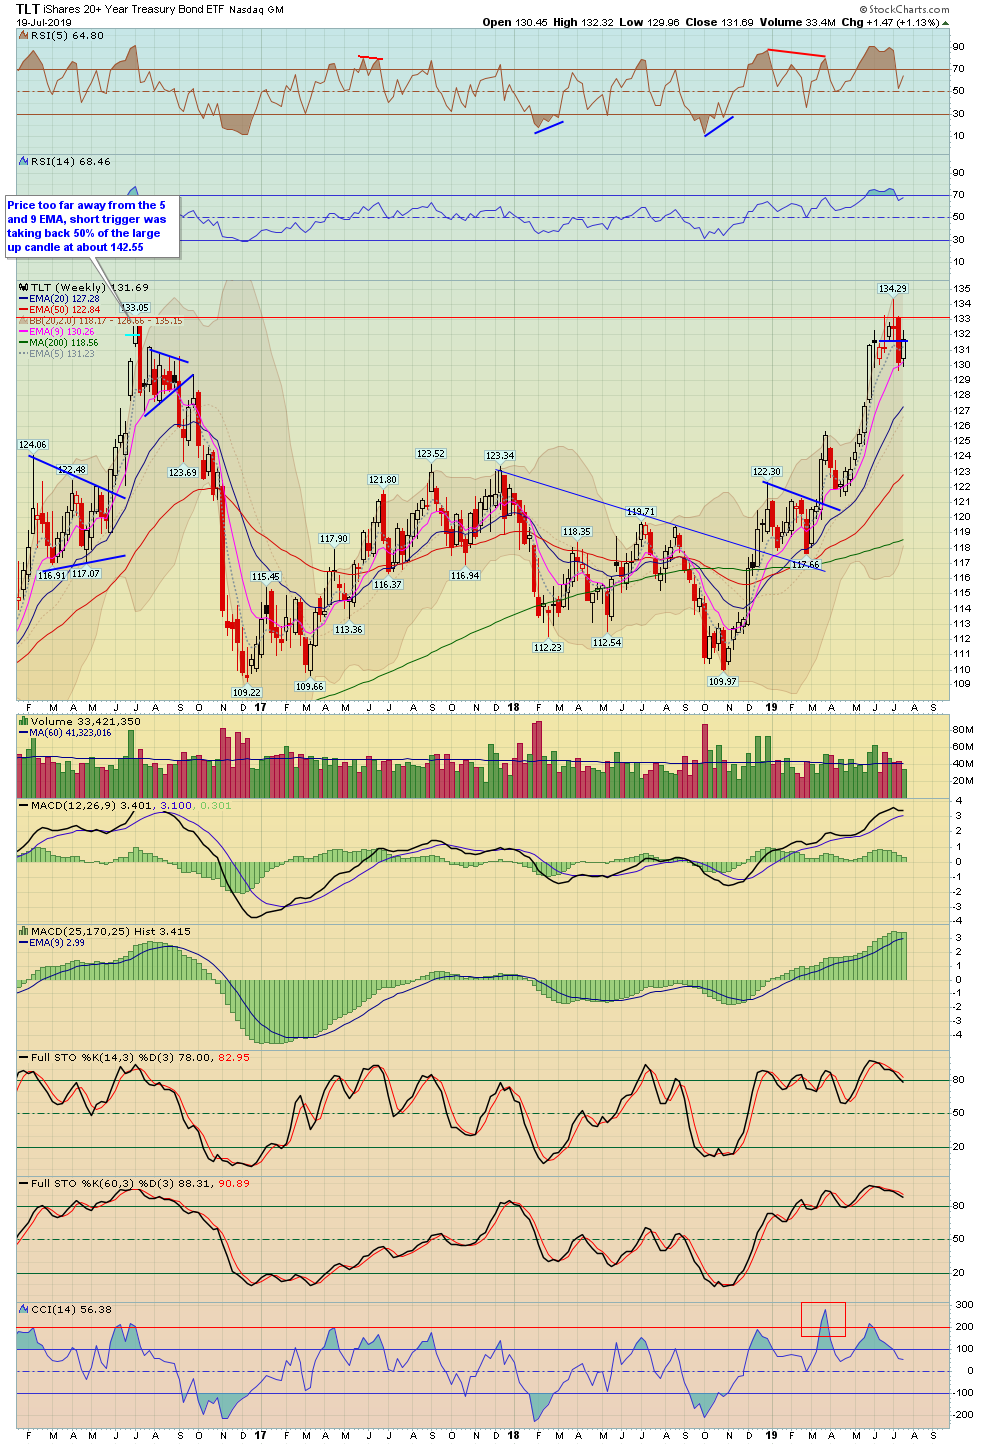
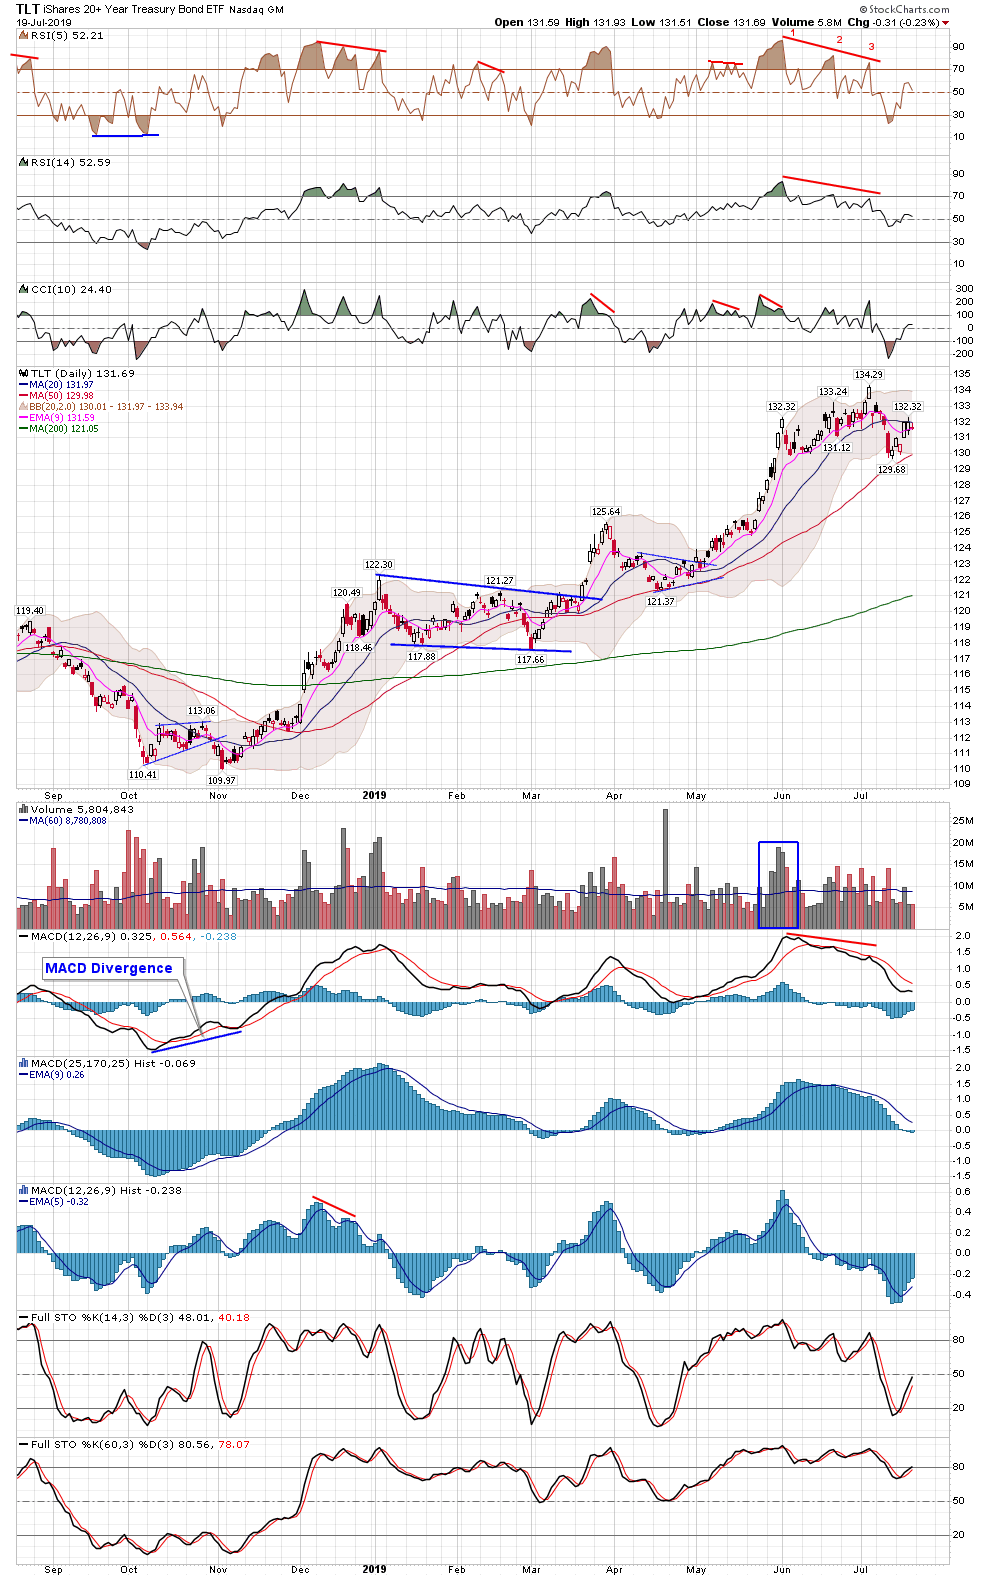
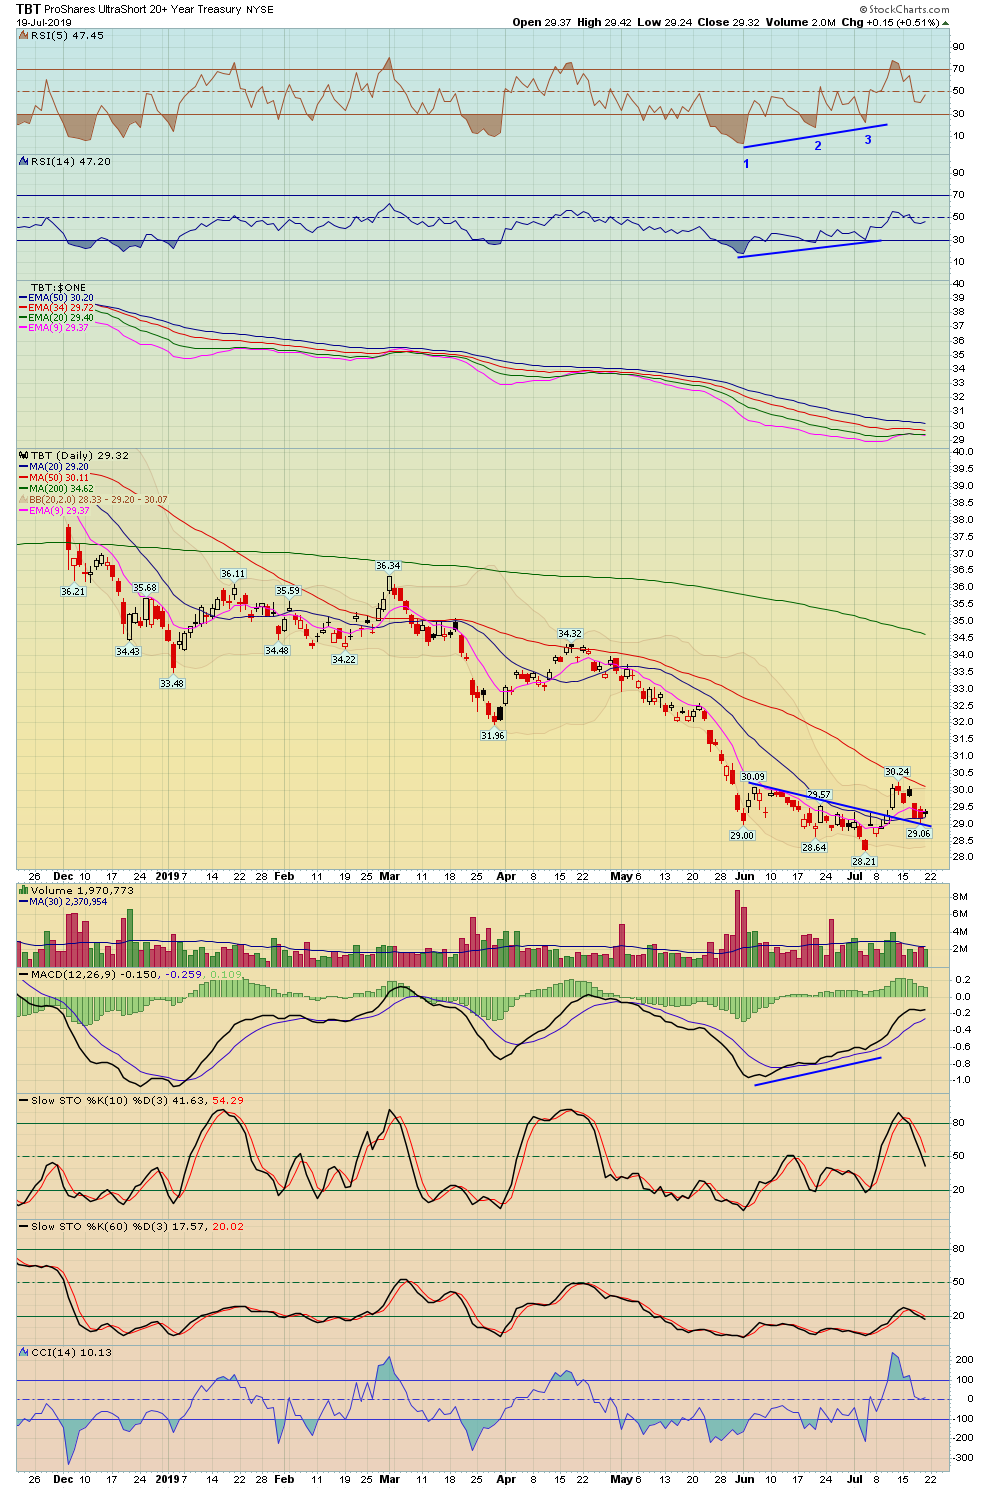
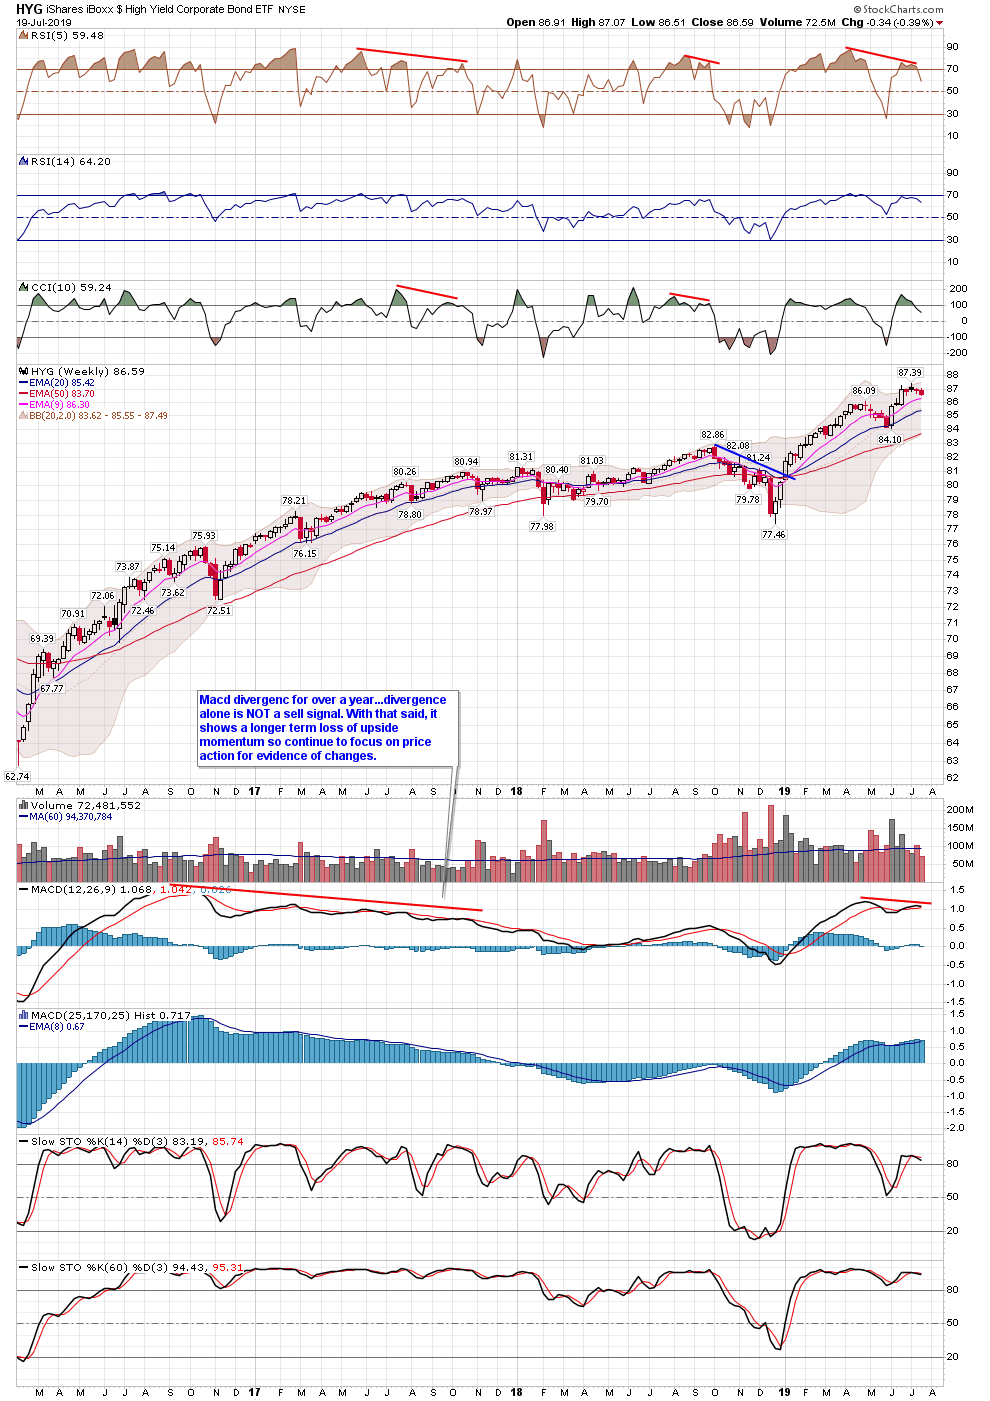
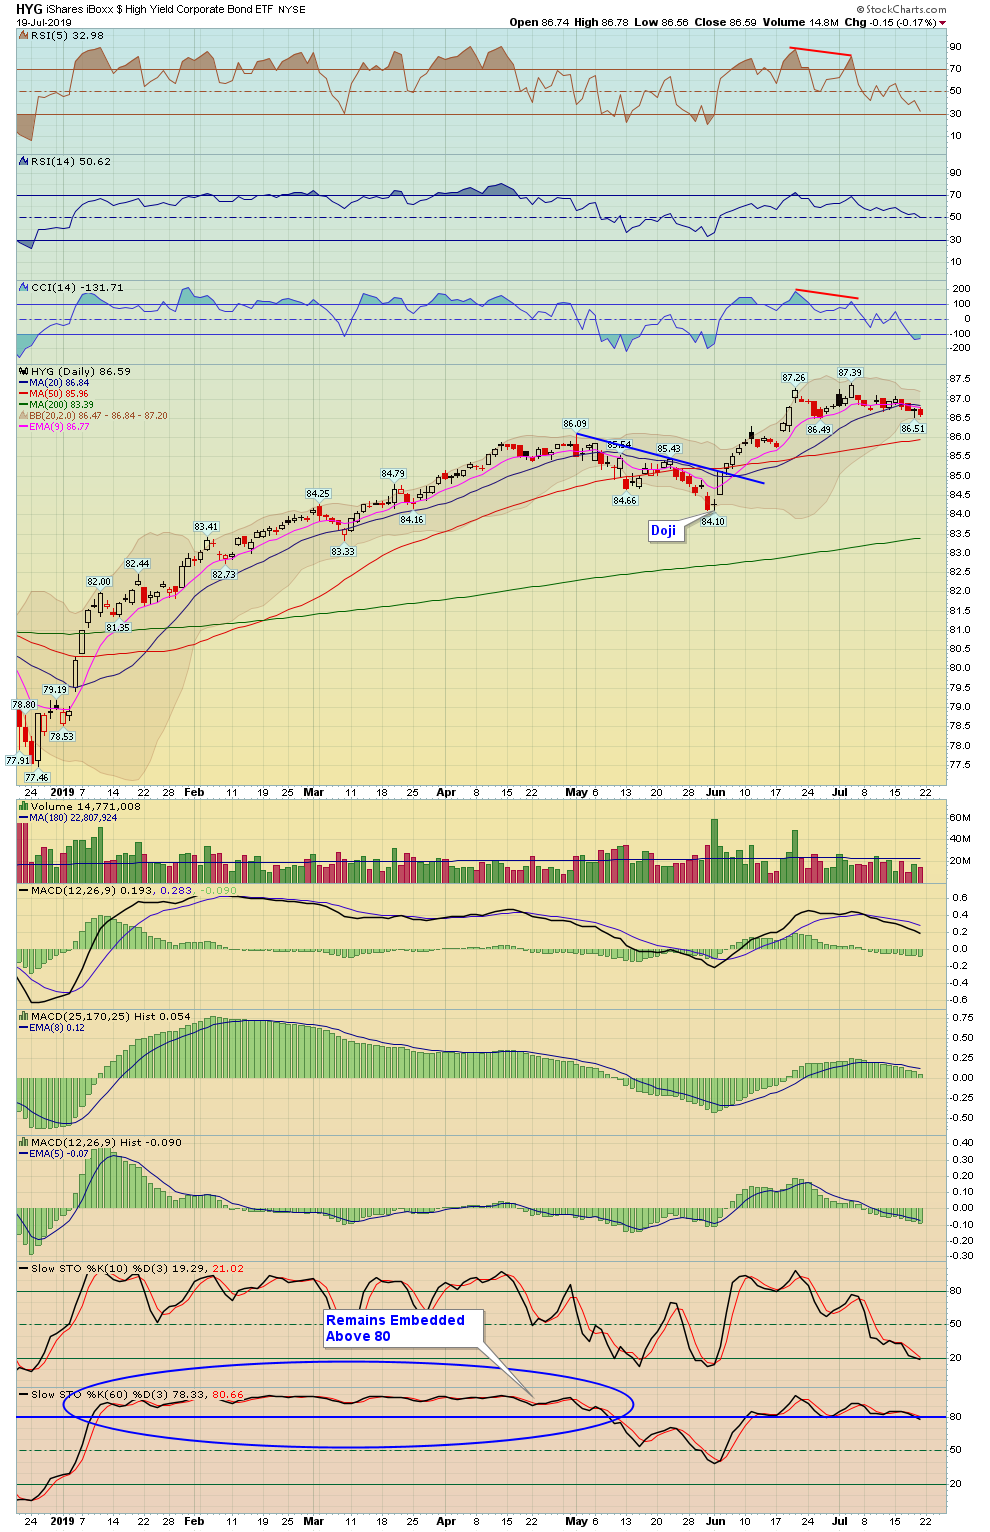
3. Quick Overview Important Indicators VIX etc and Bonds via TLT and HYG
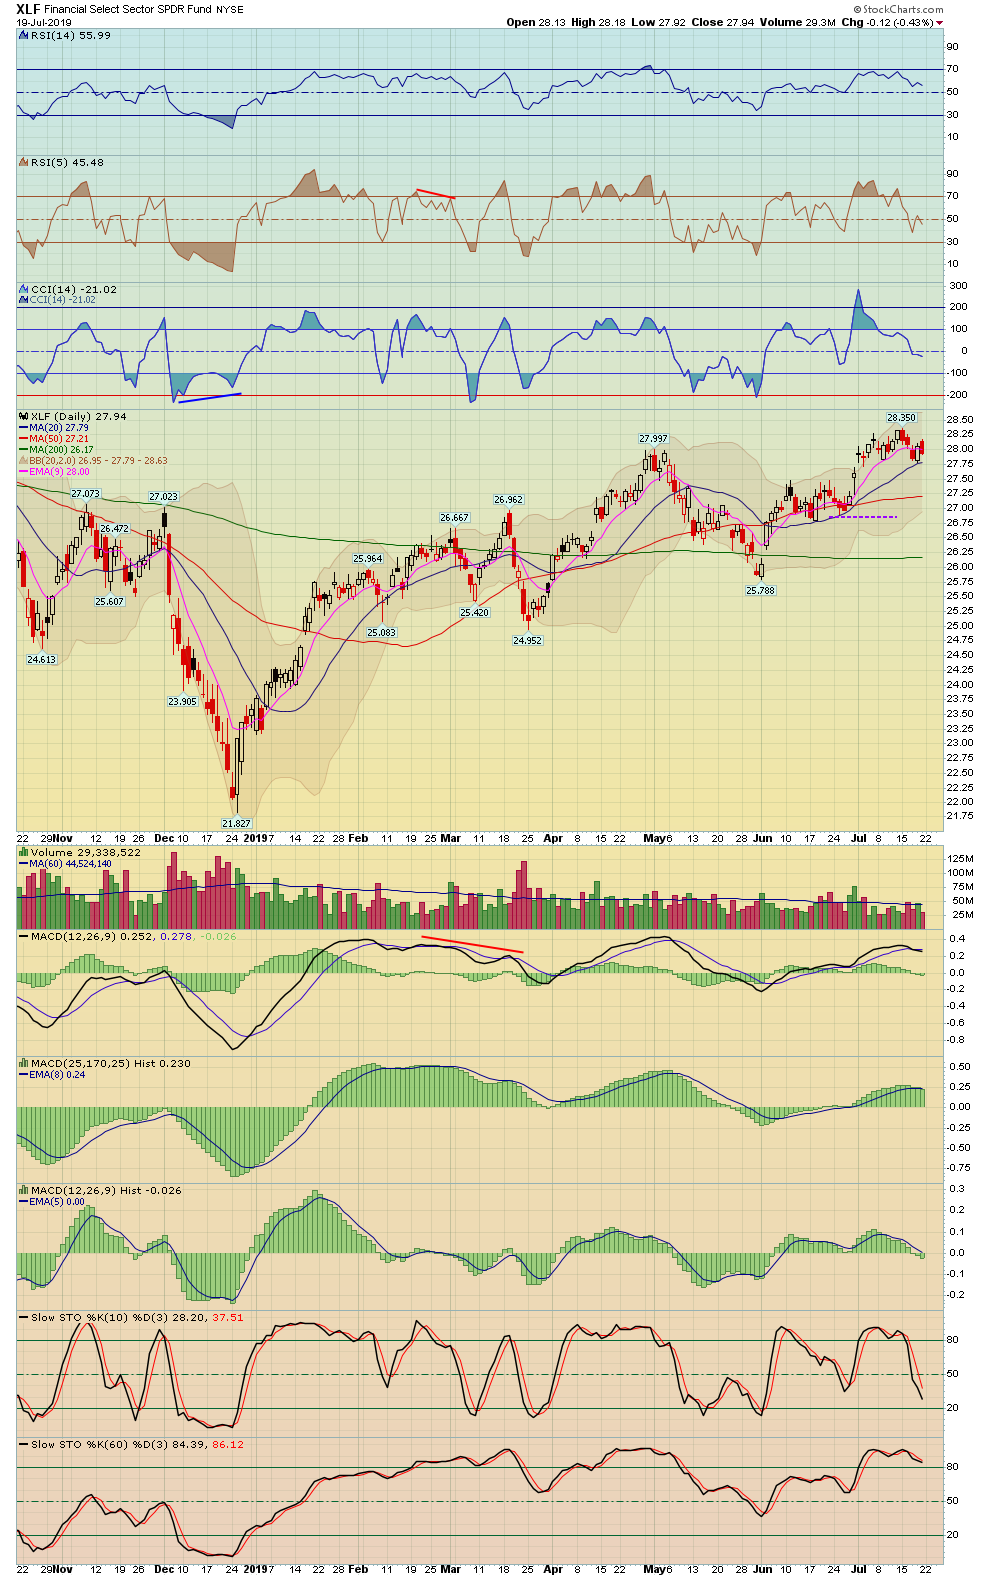
4. Examine All Sector Charts
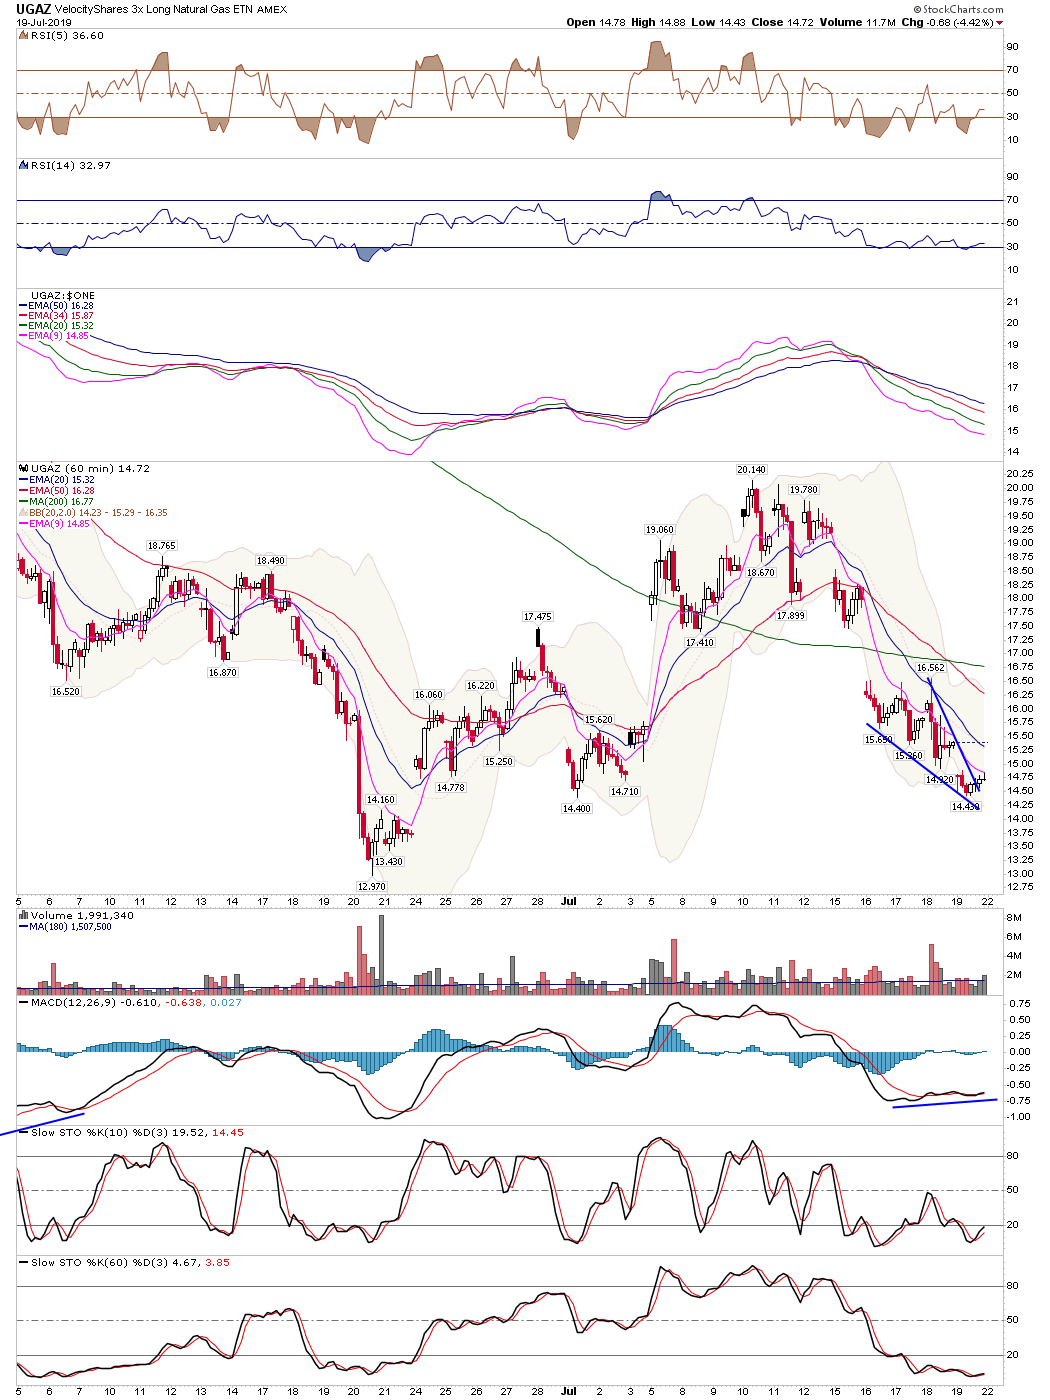
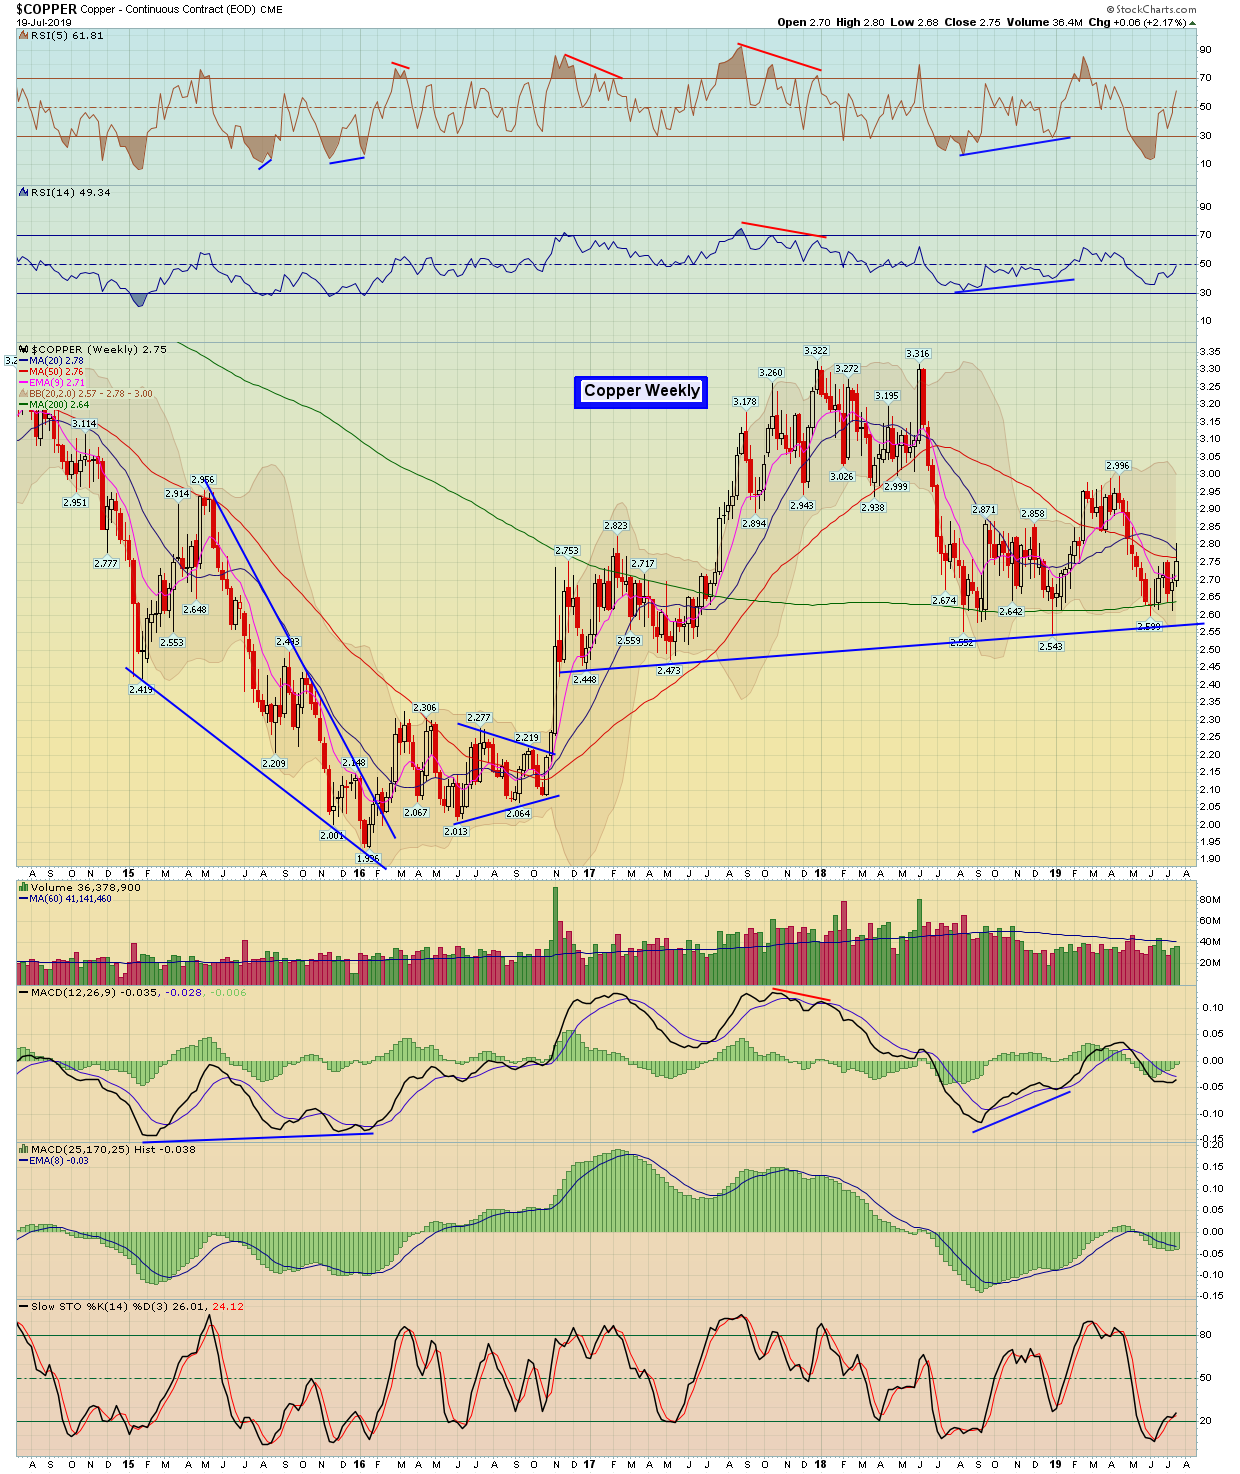
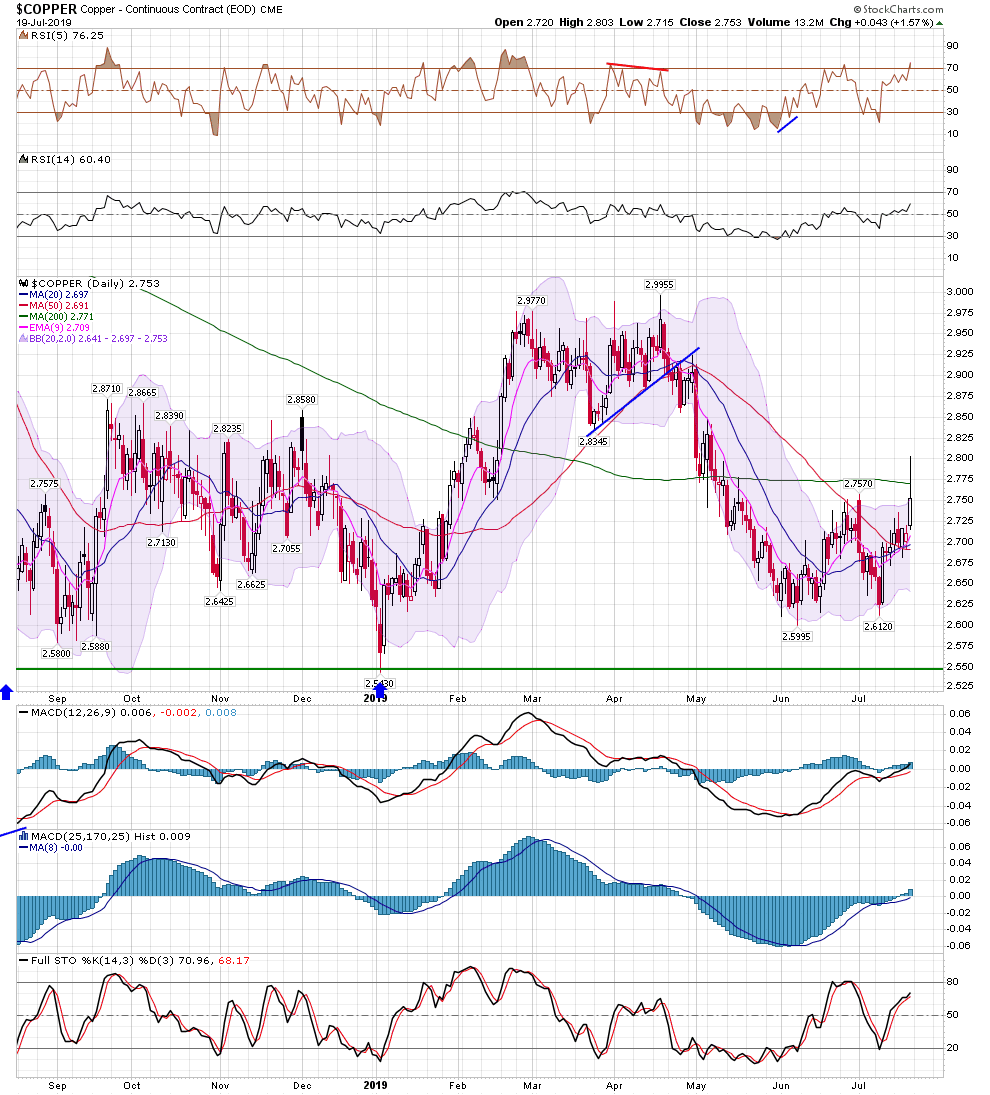
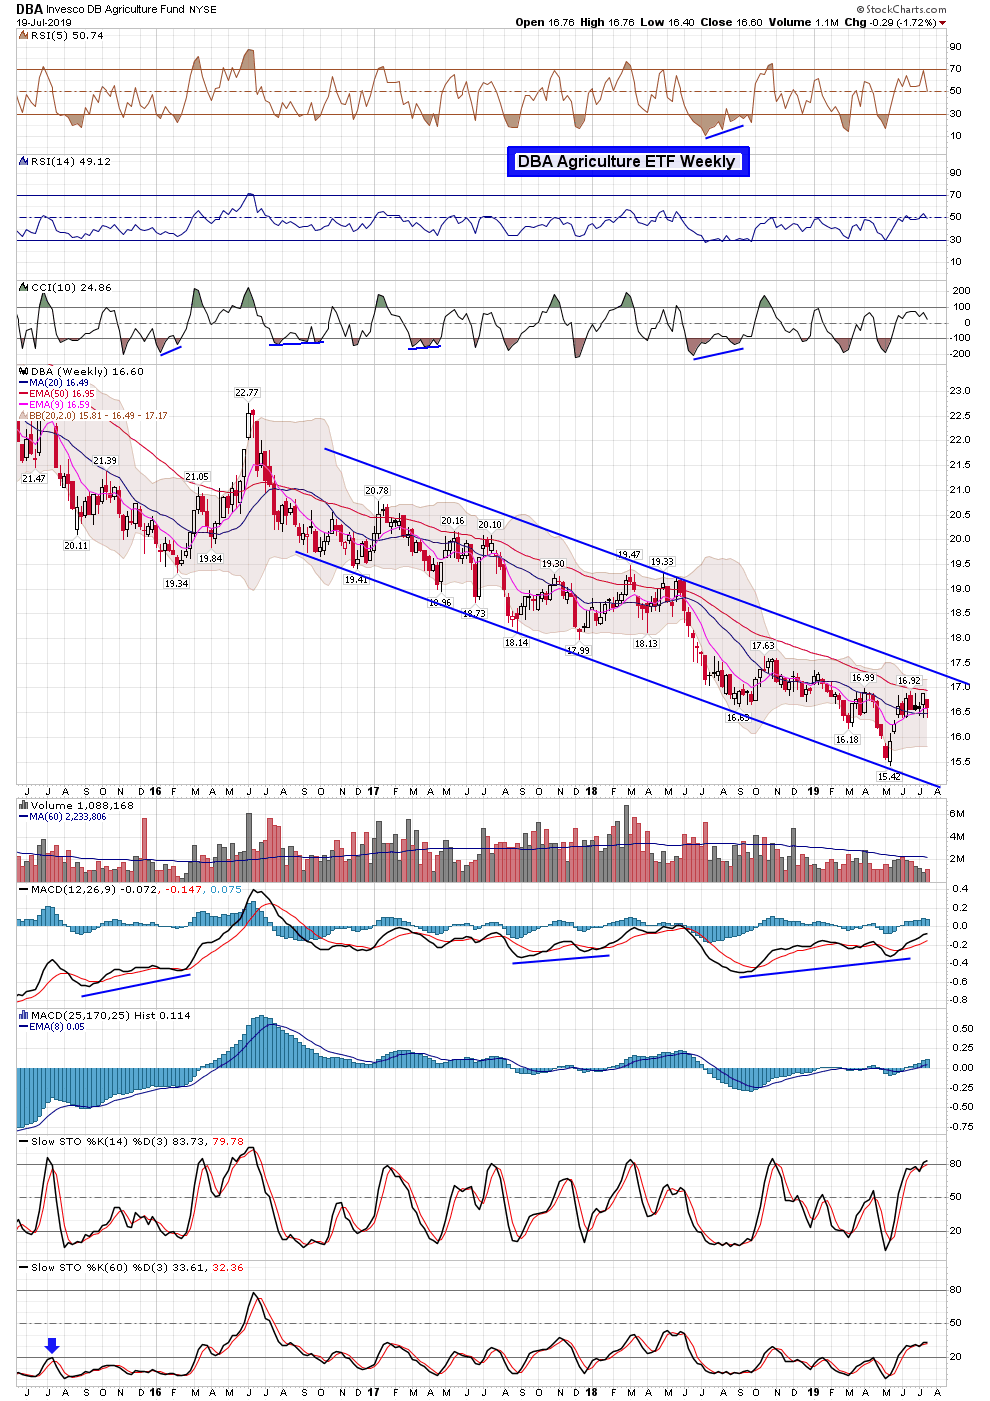
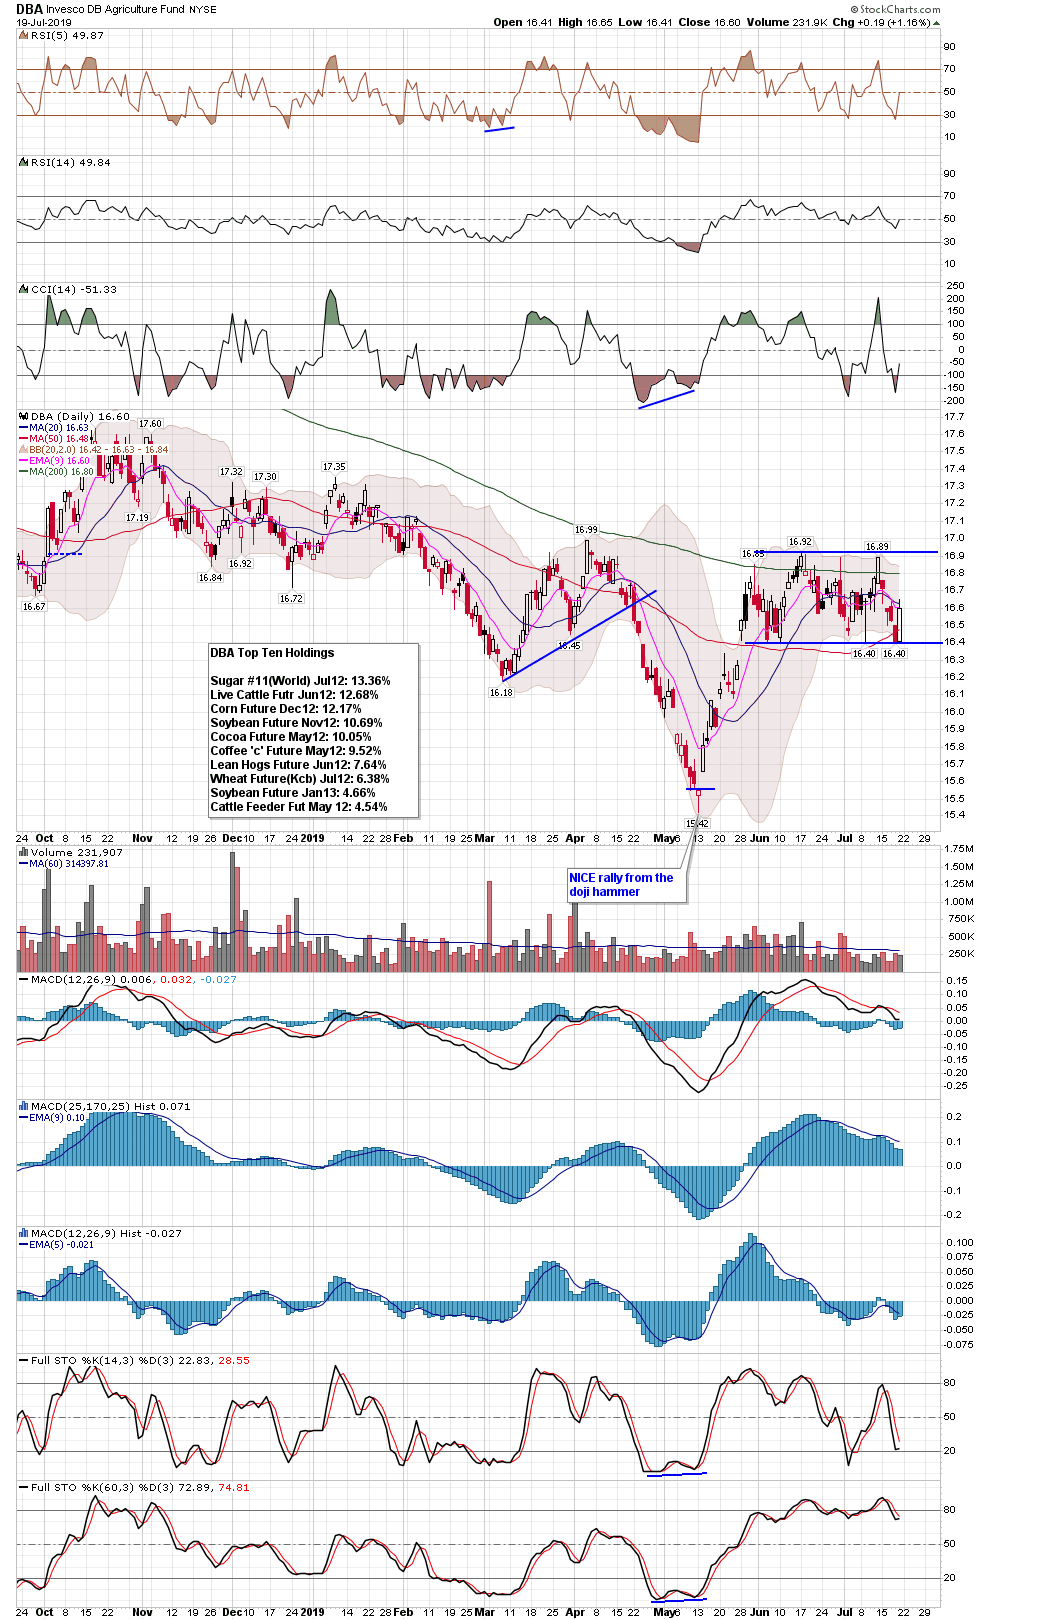
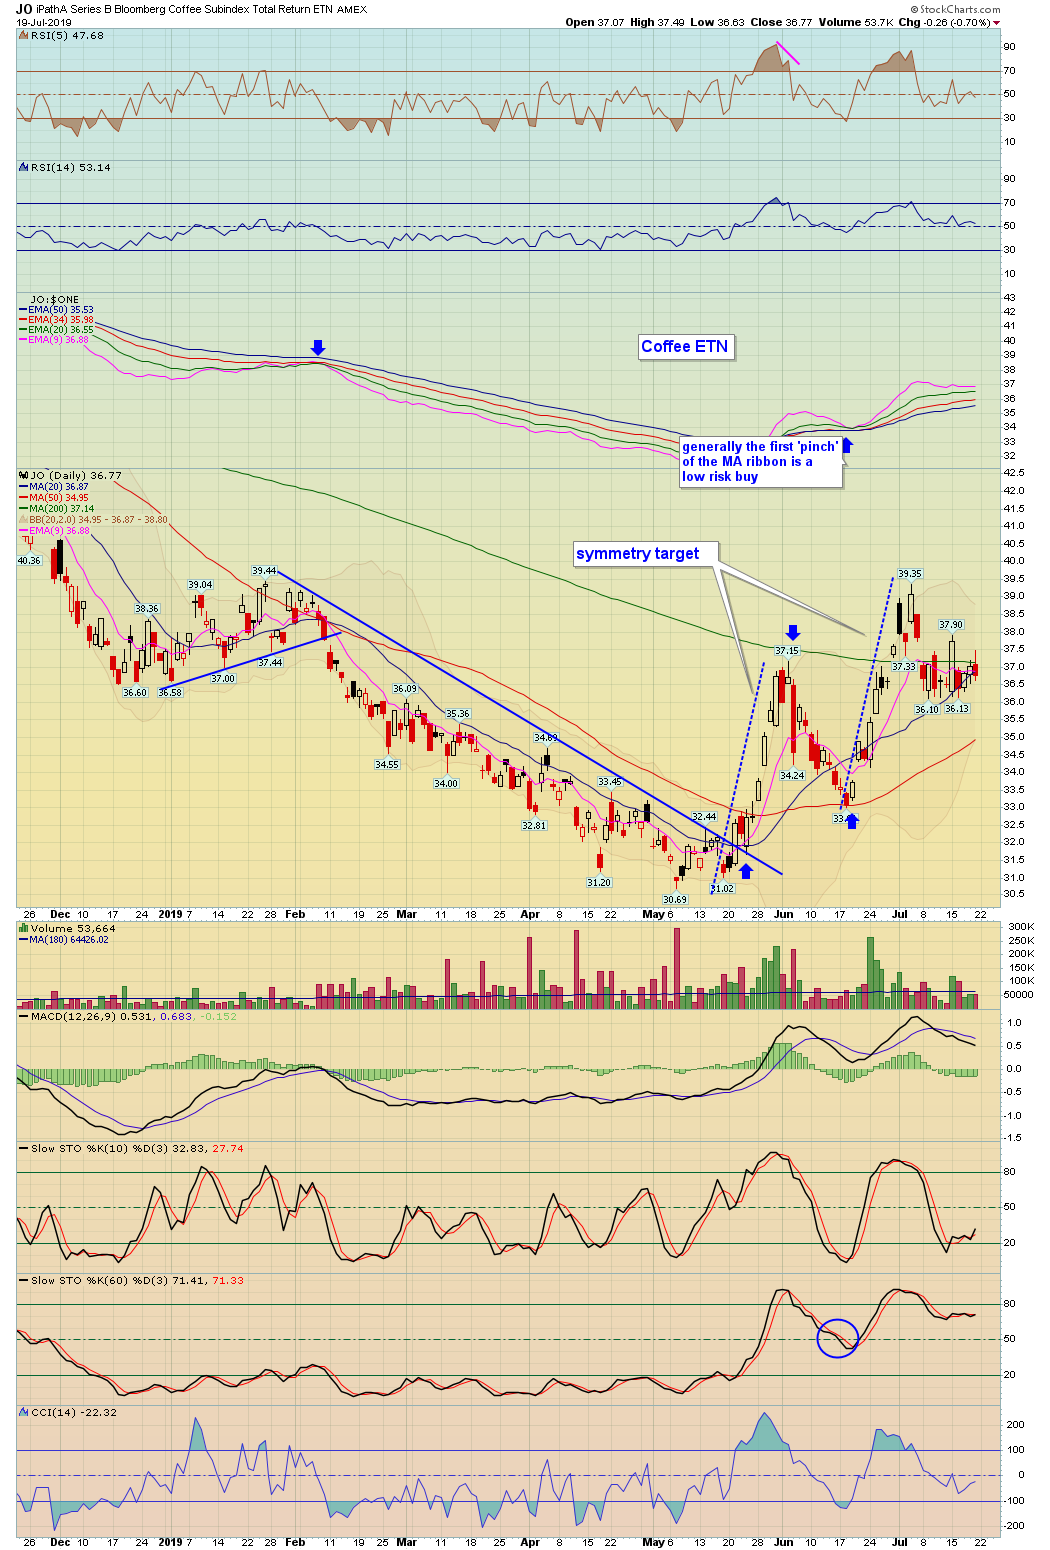
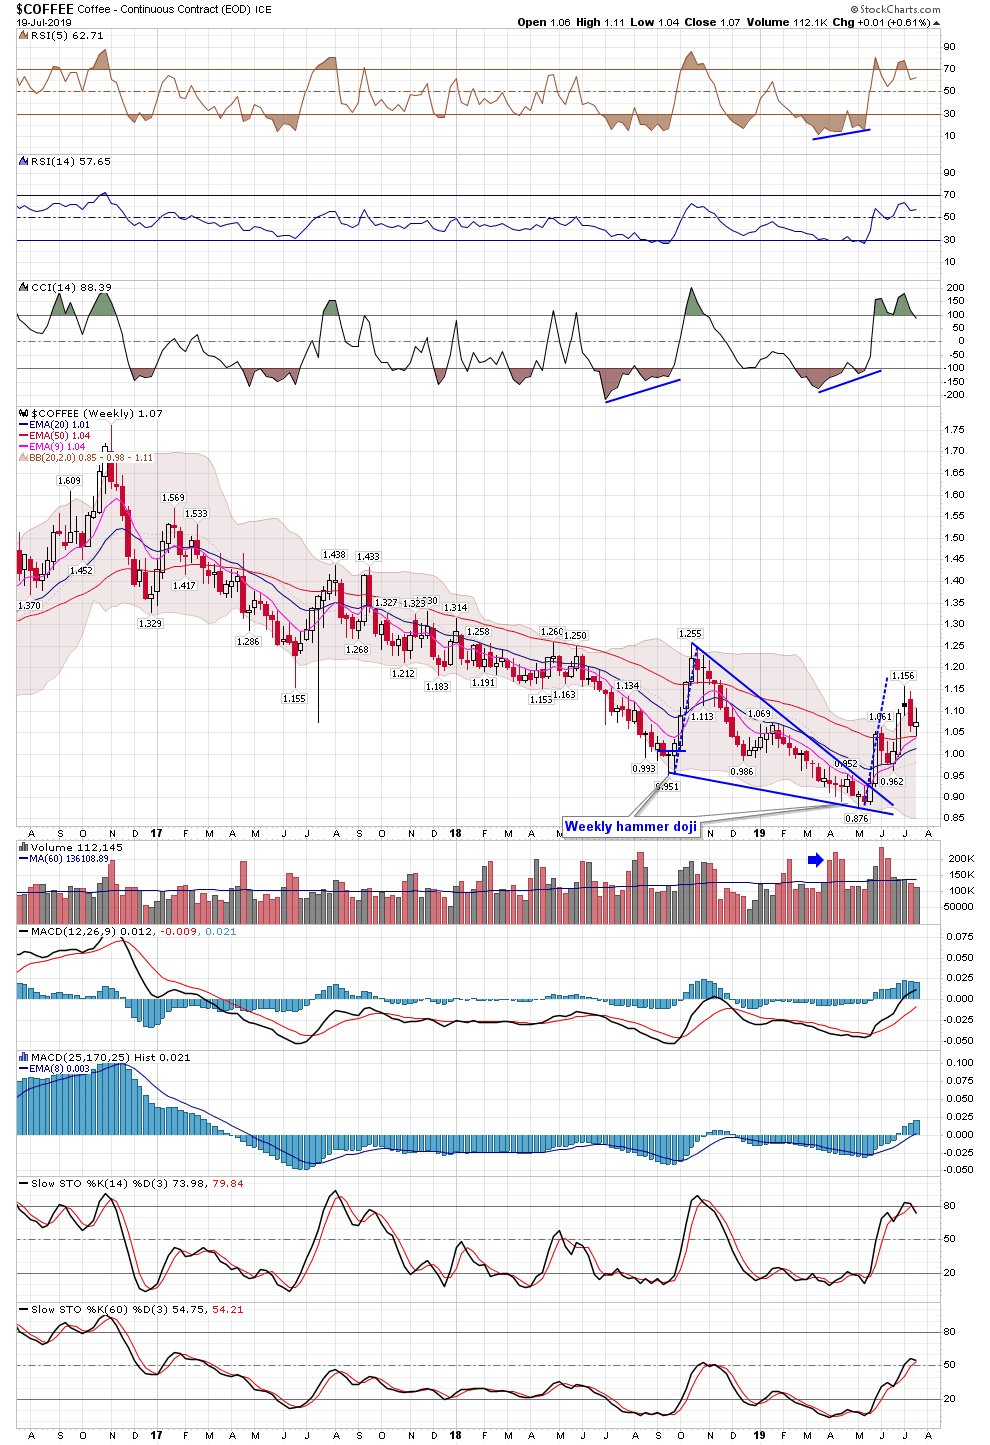
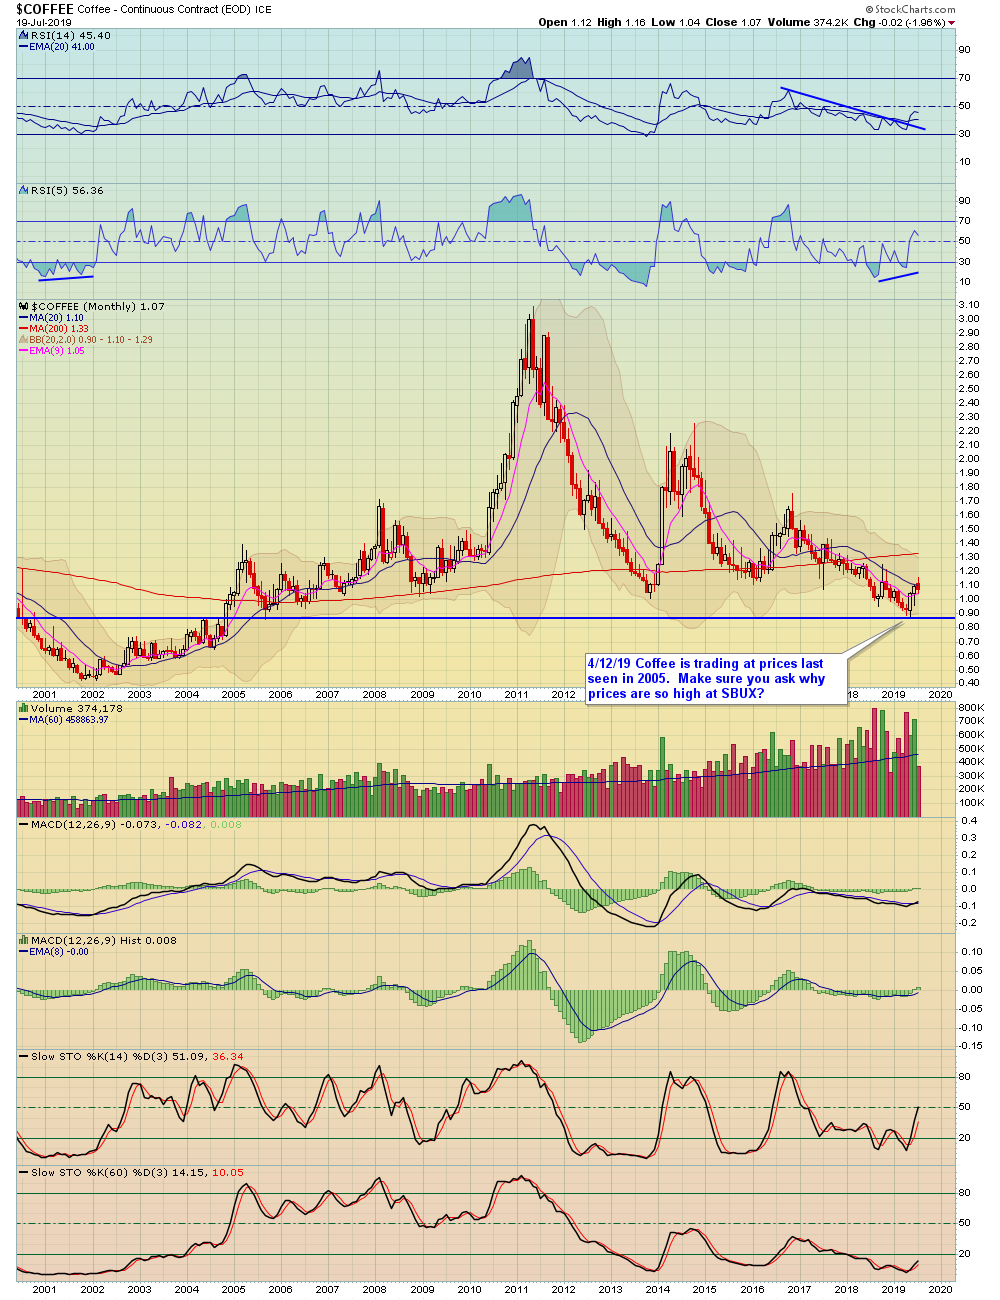
5. Commodities (Crude Oil, Natural Gas, Copper, DBA, Jo Coffee)
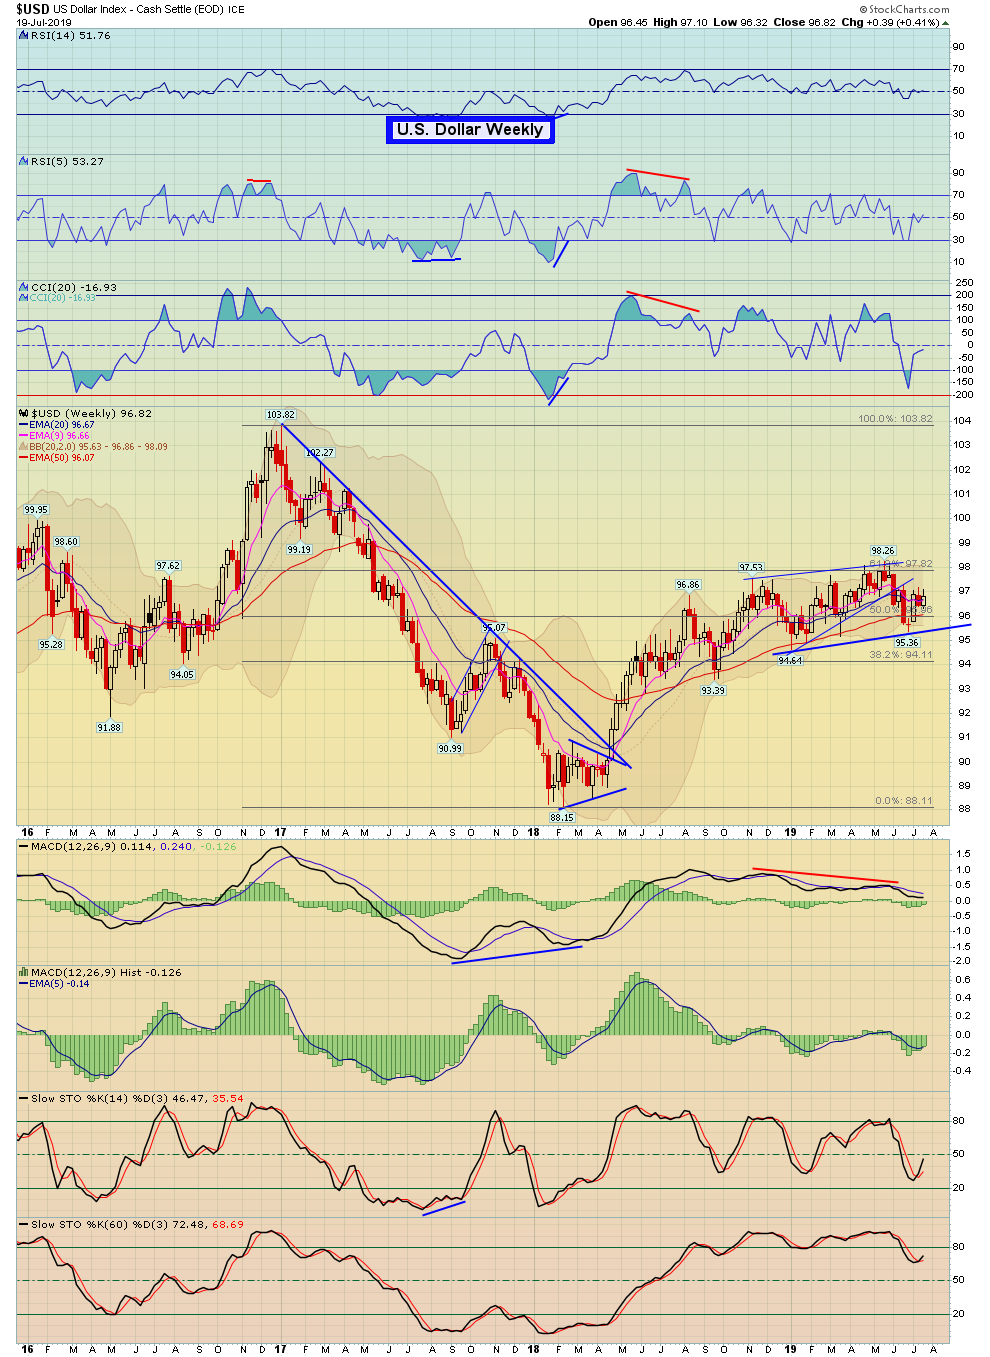
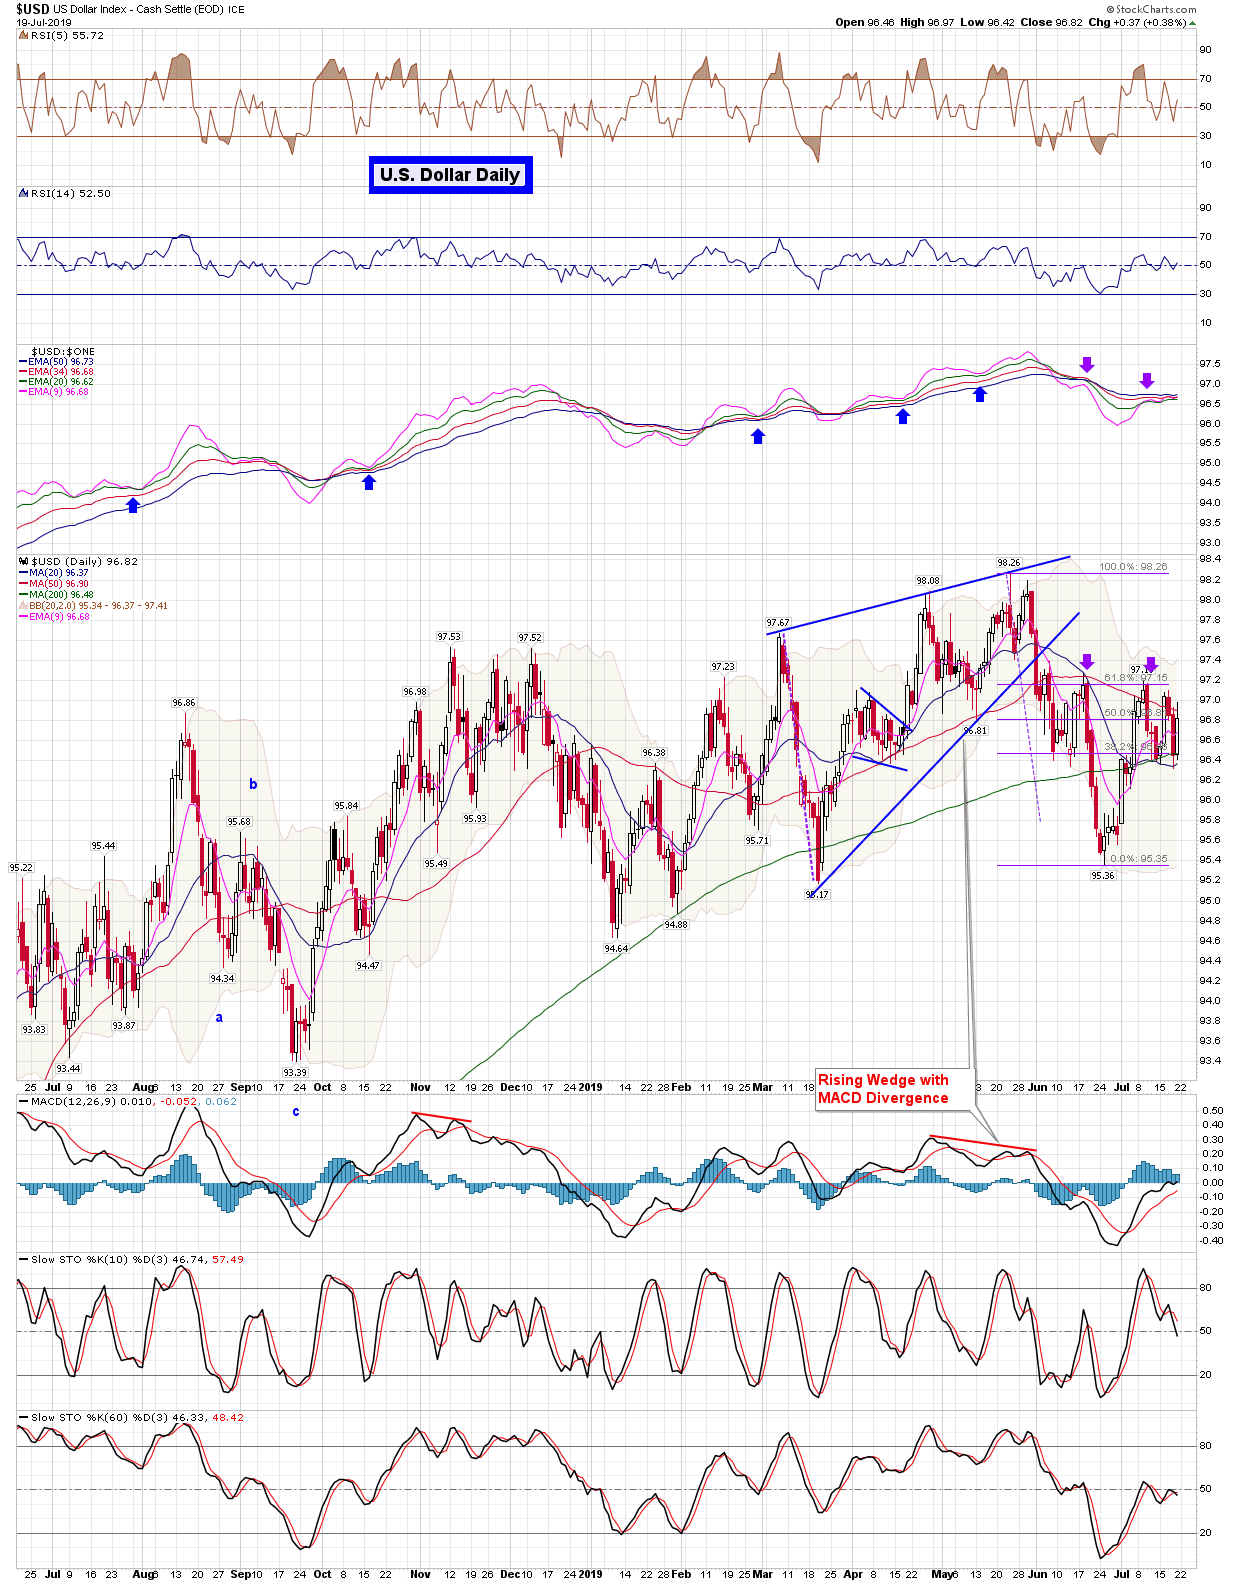
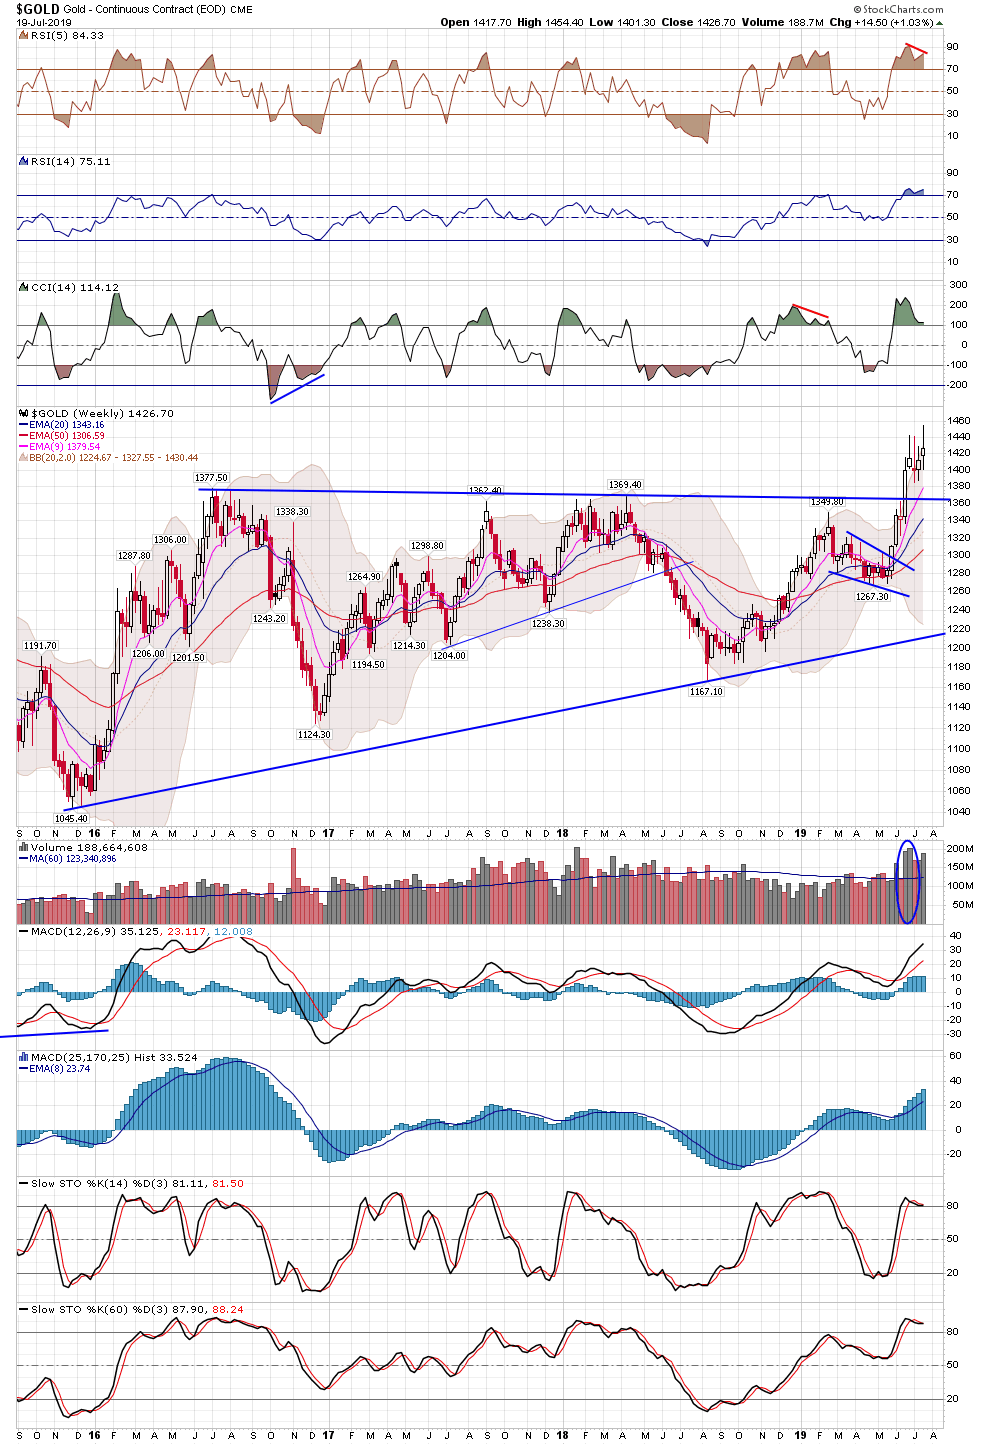
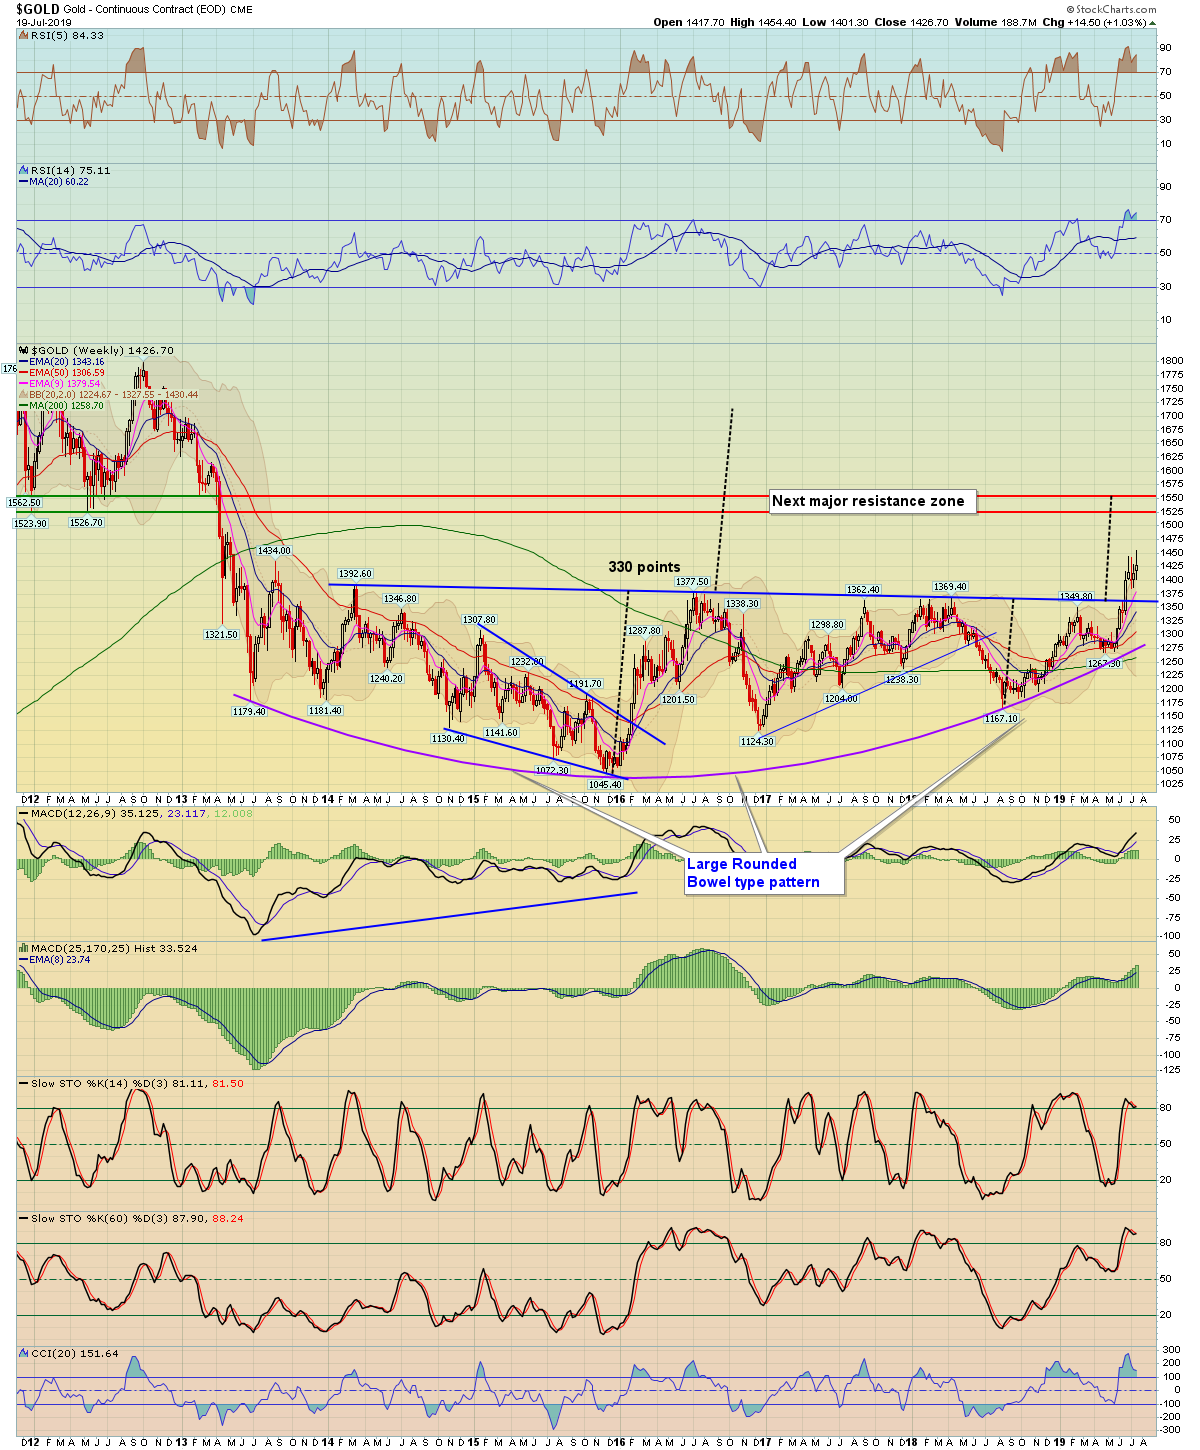
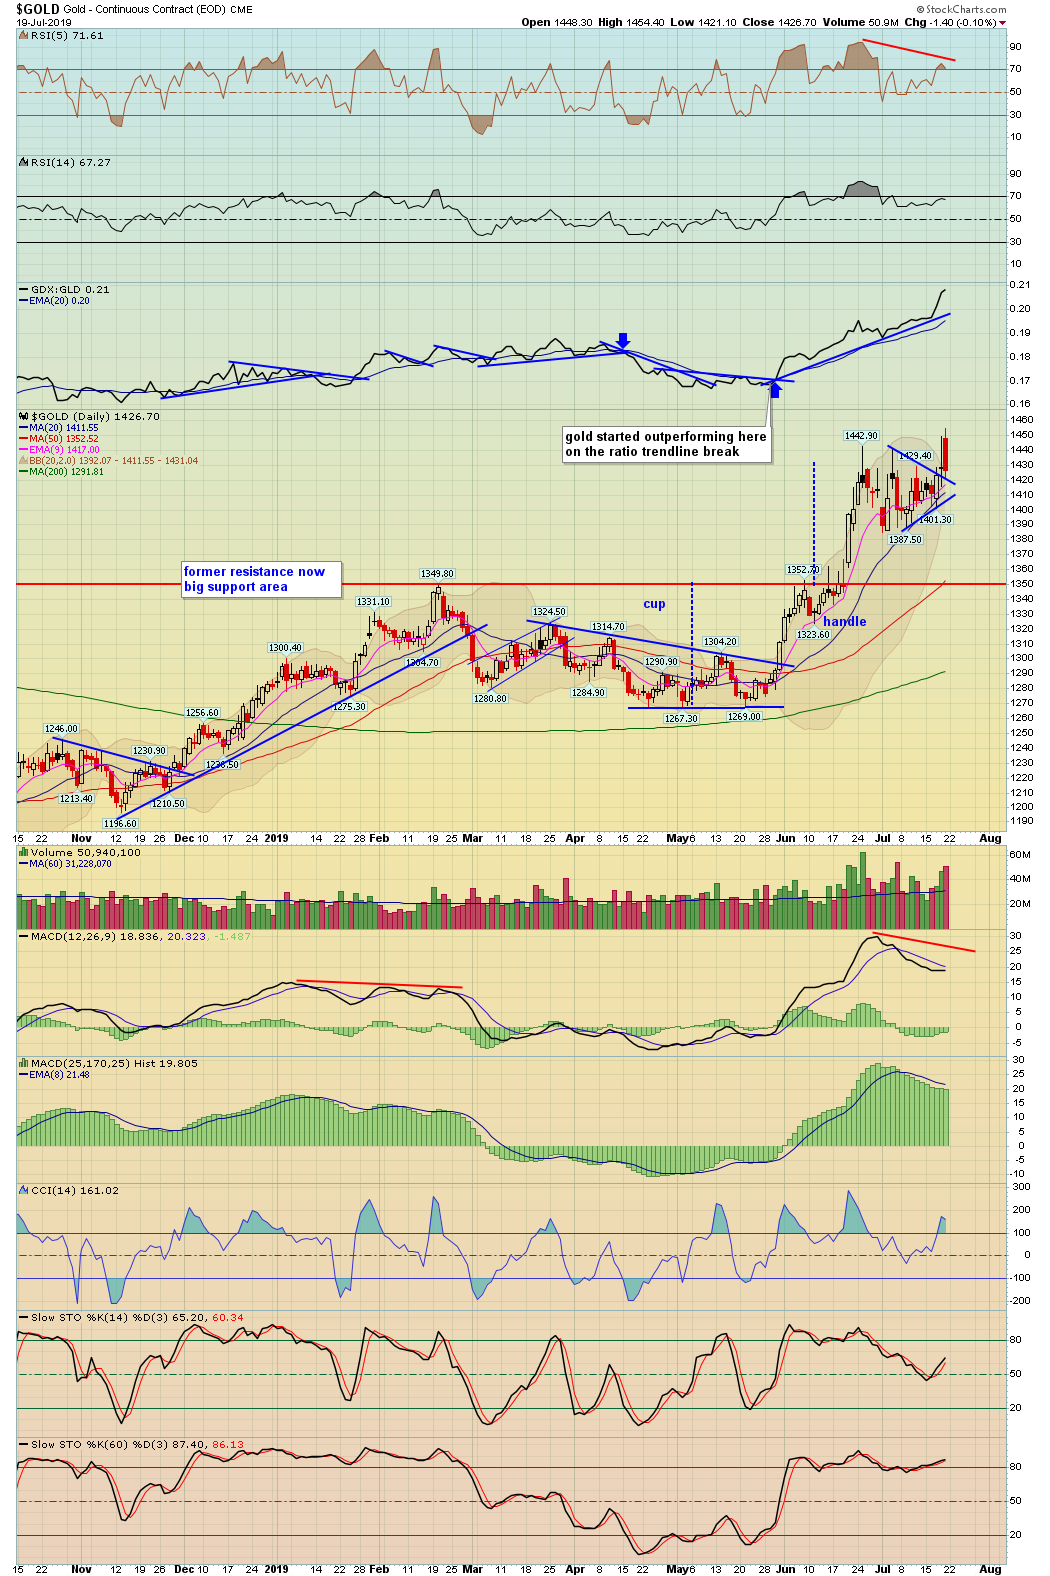
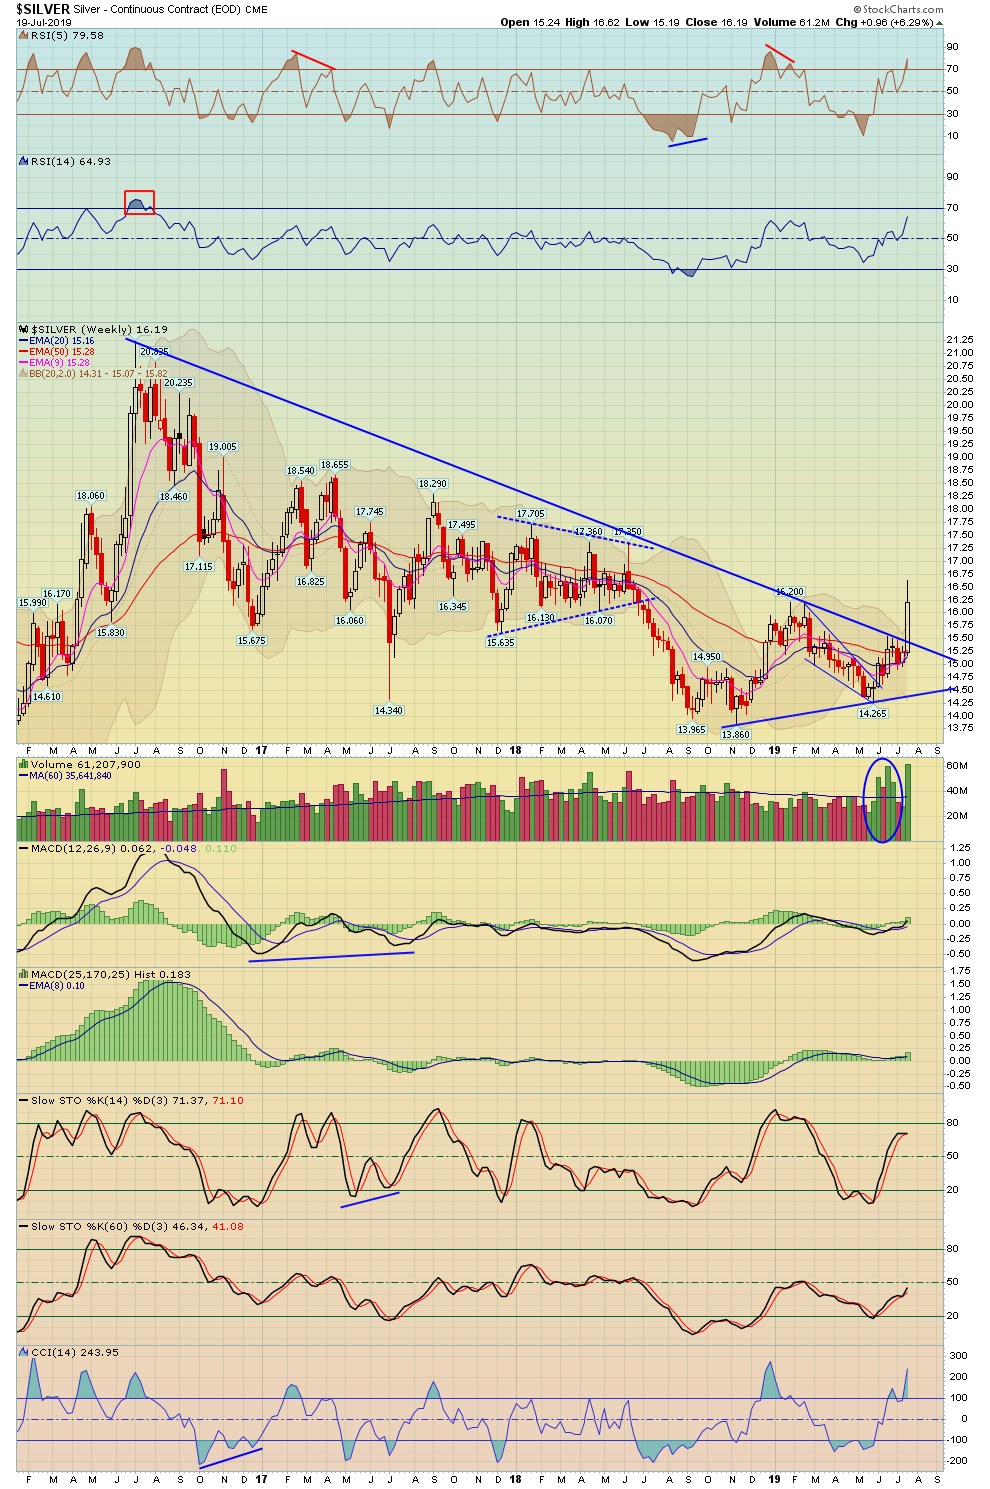
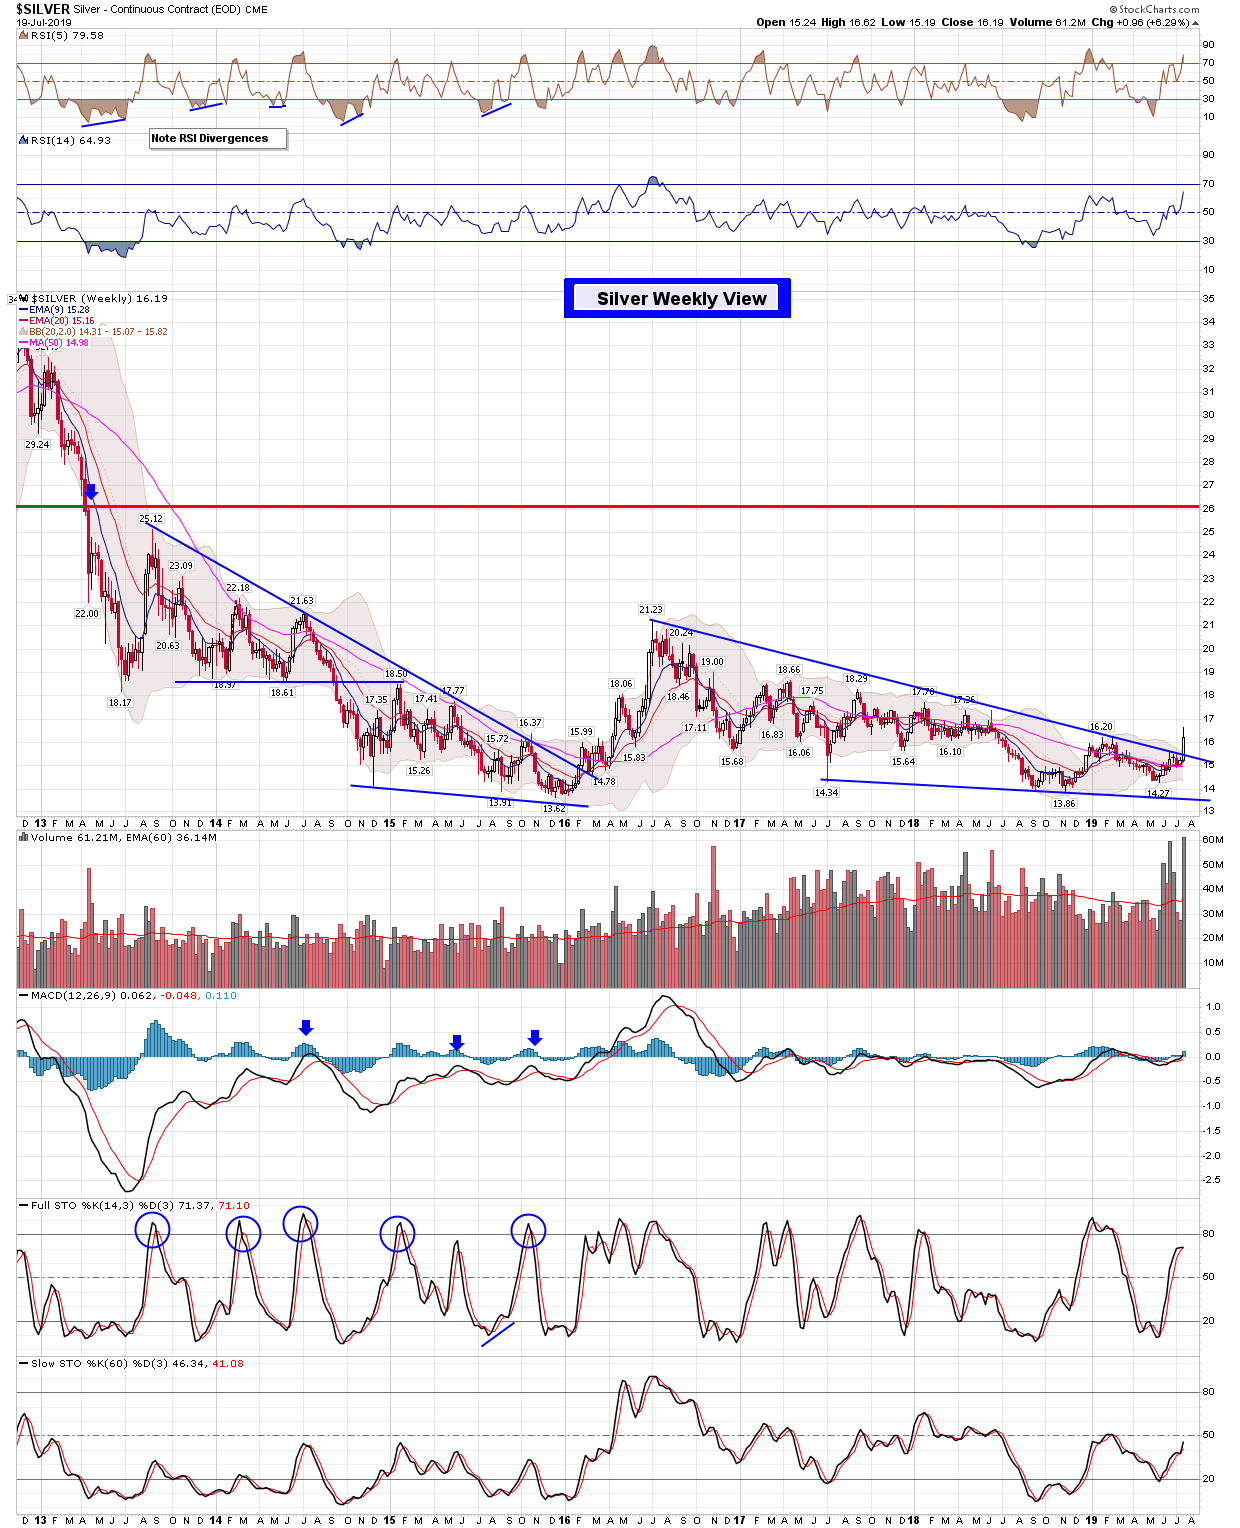
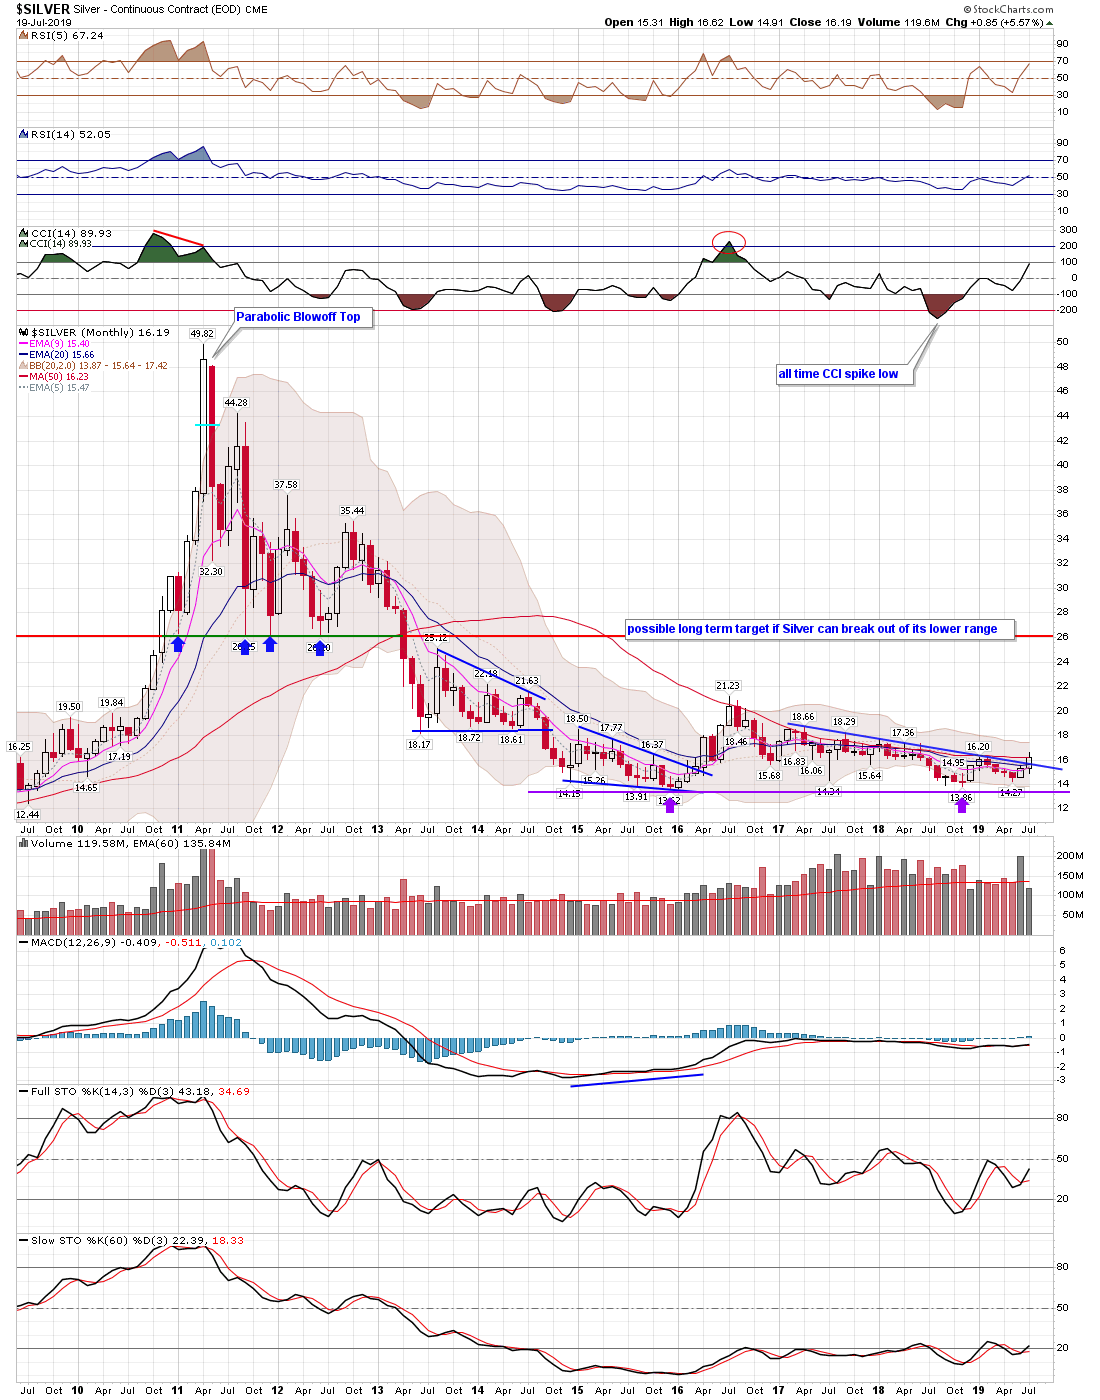
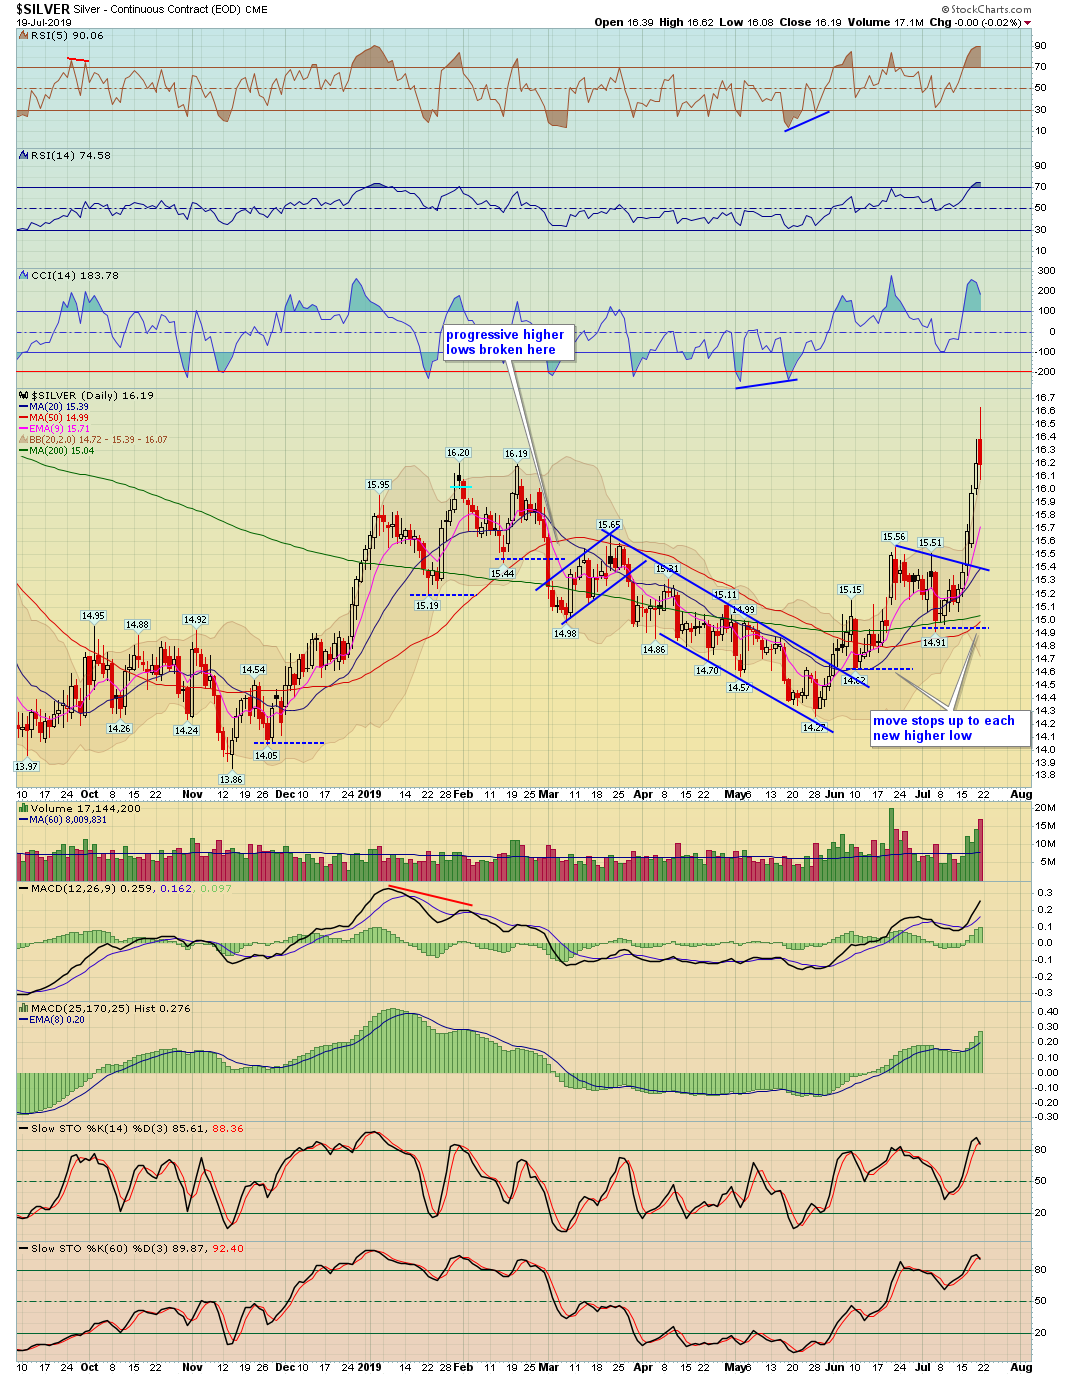
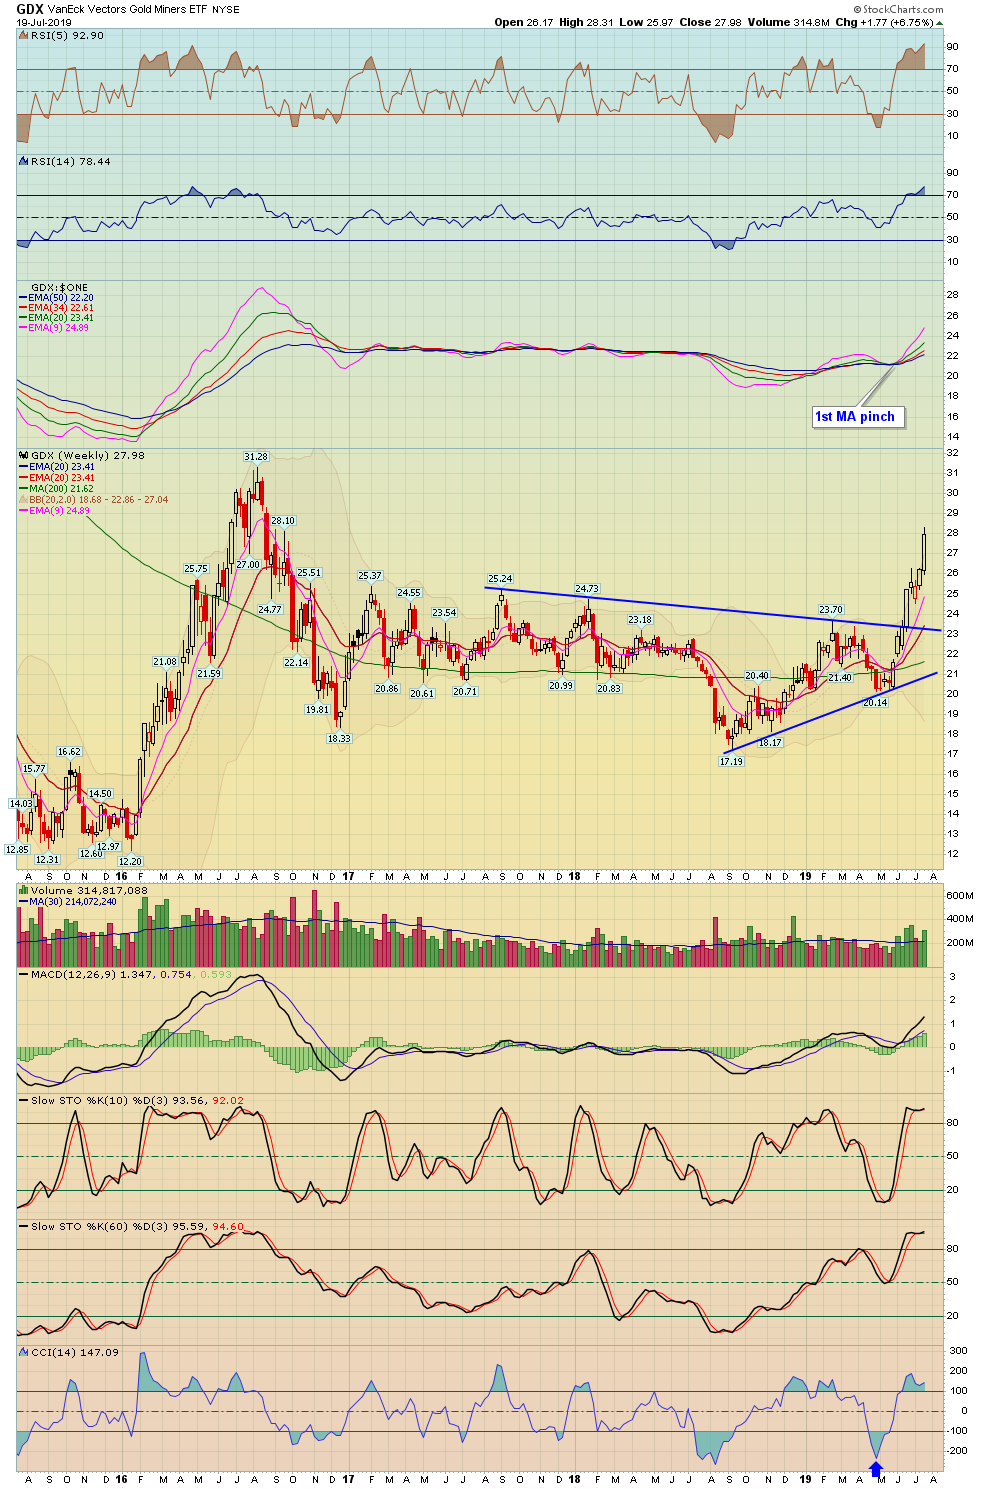
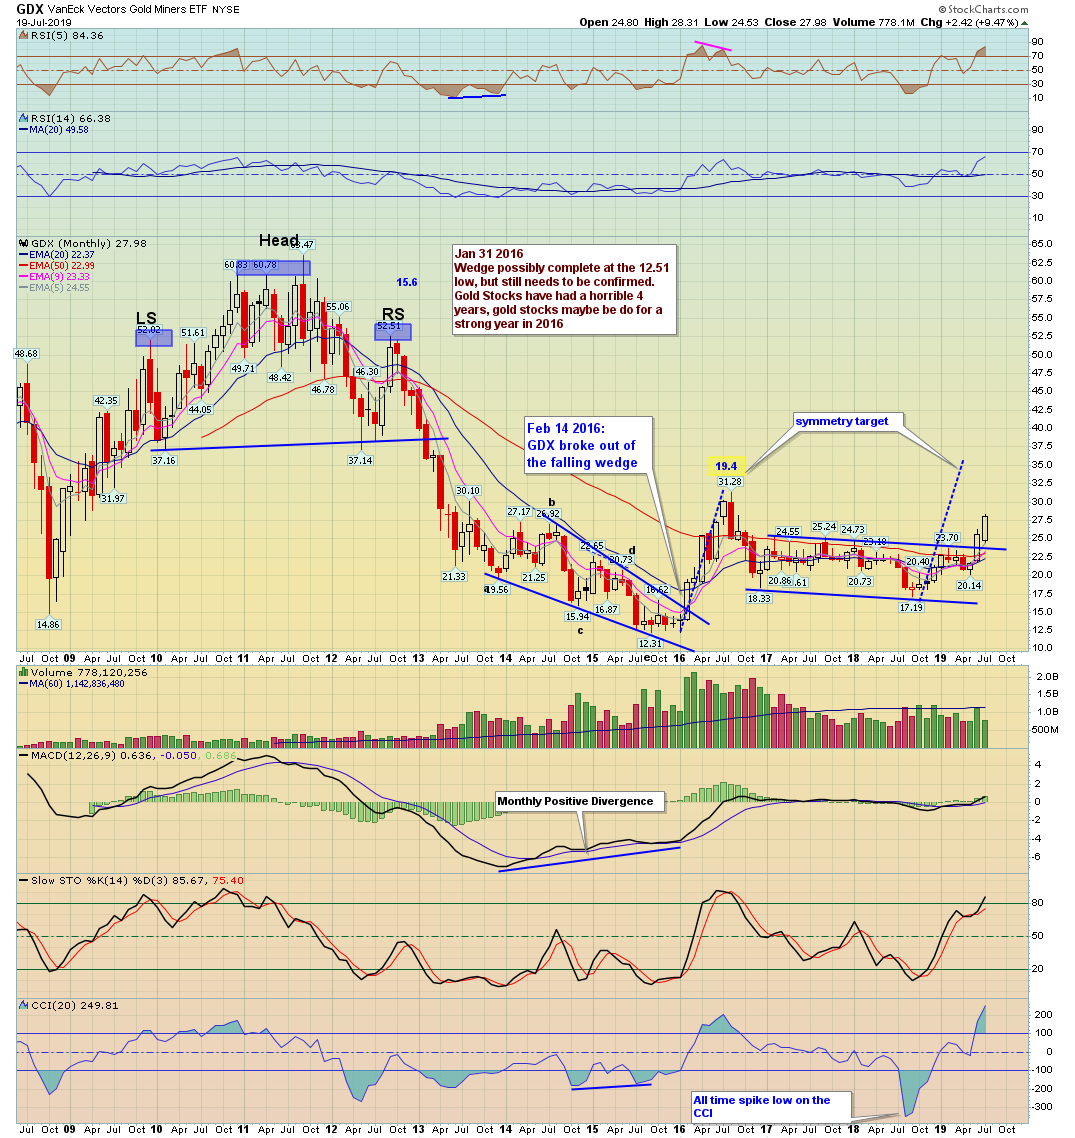
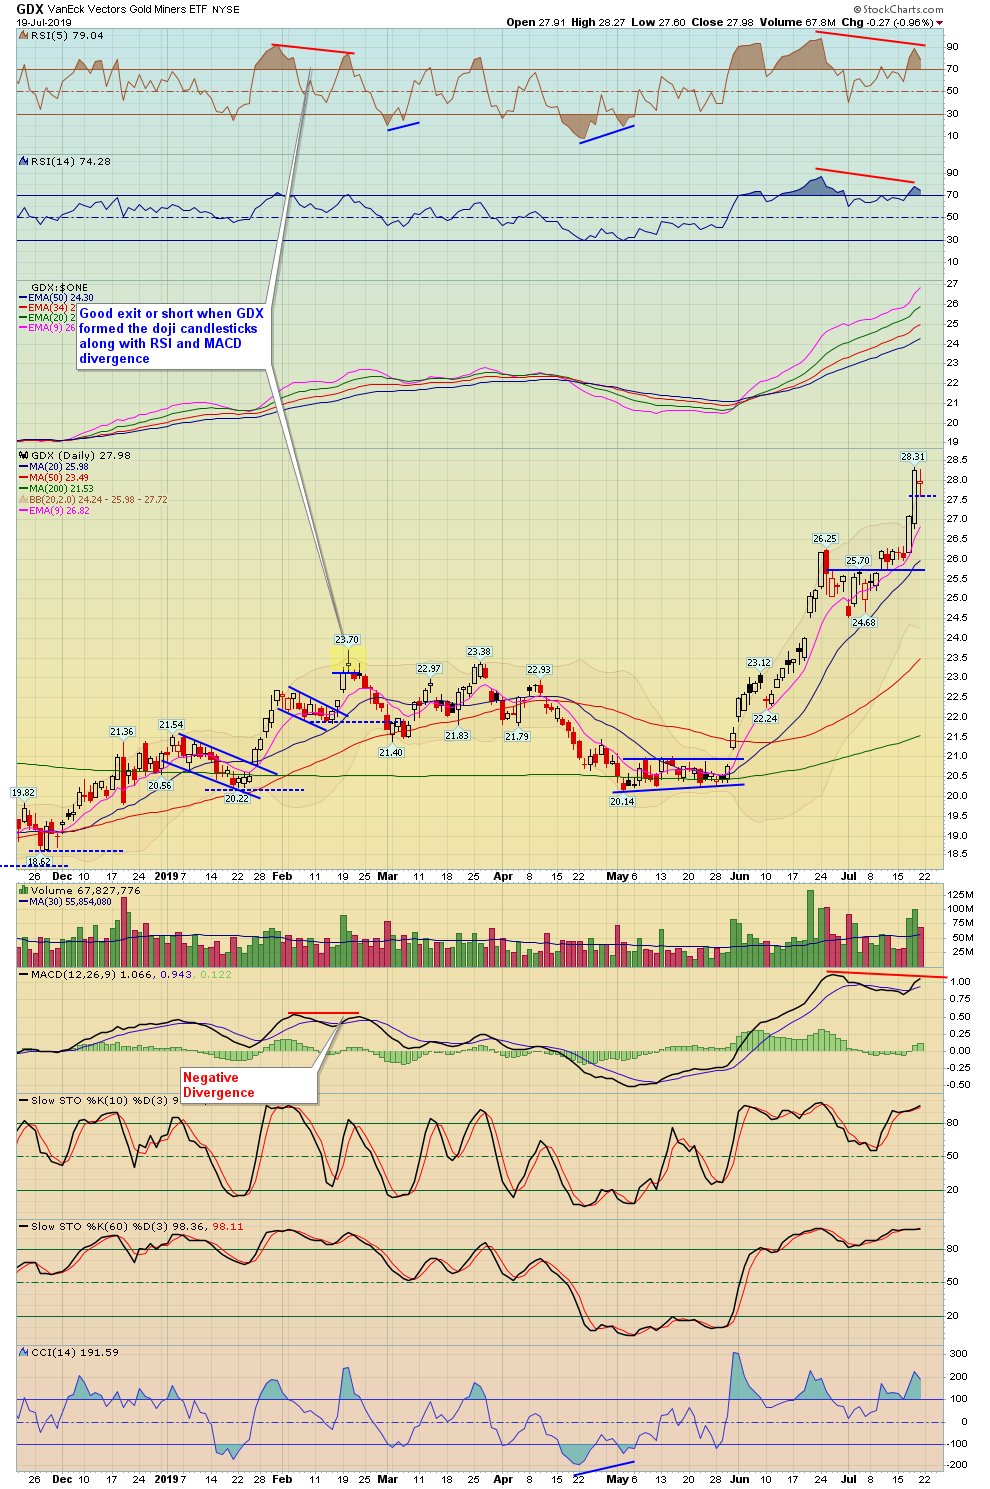
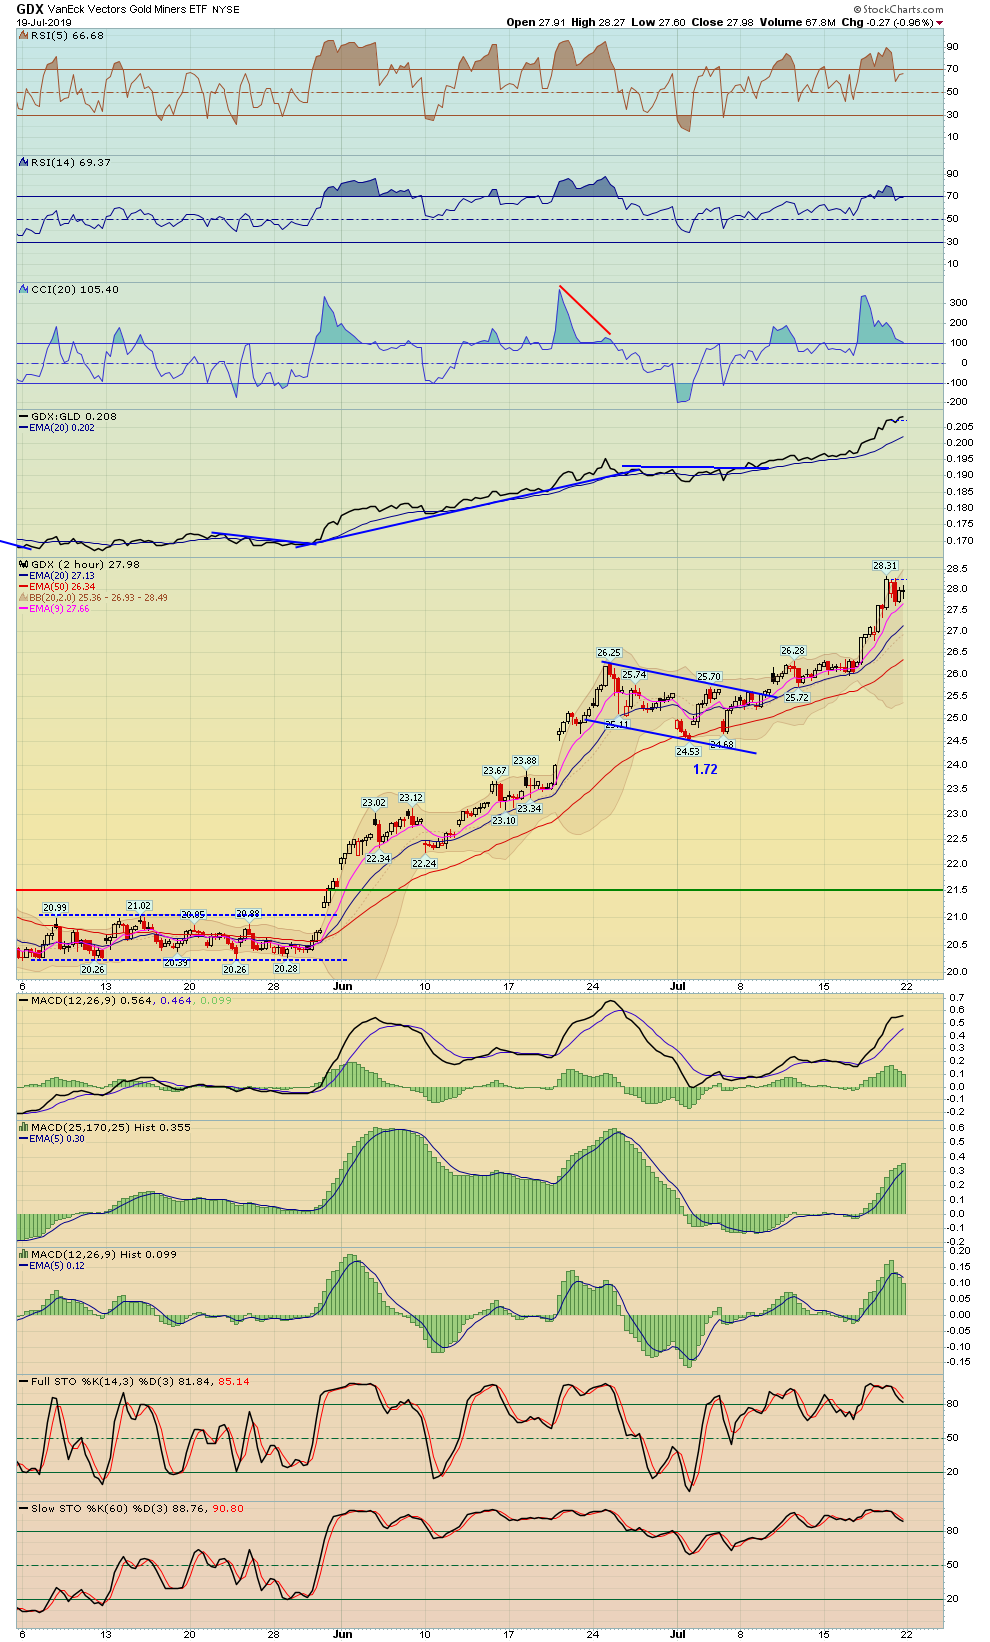
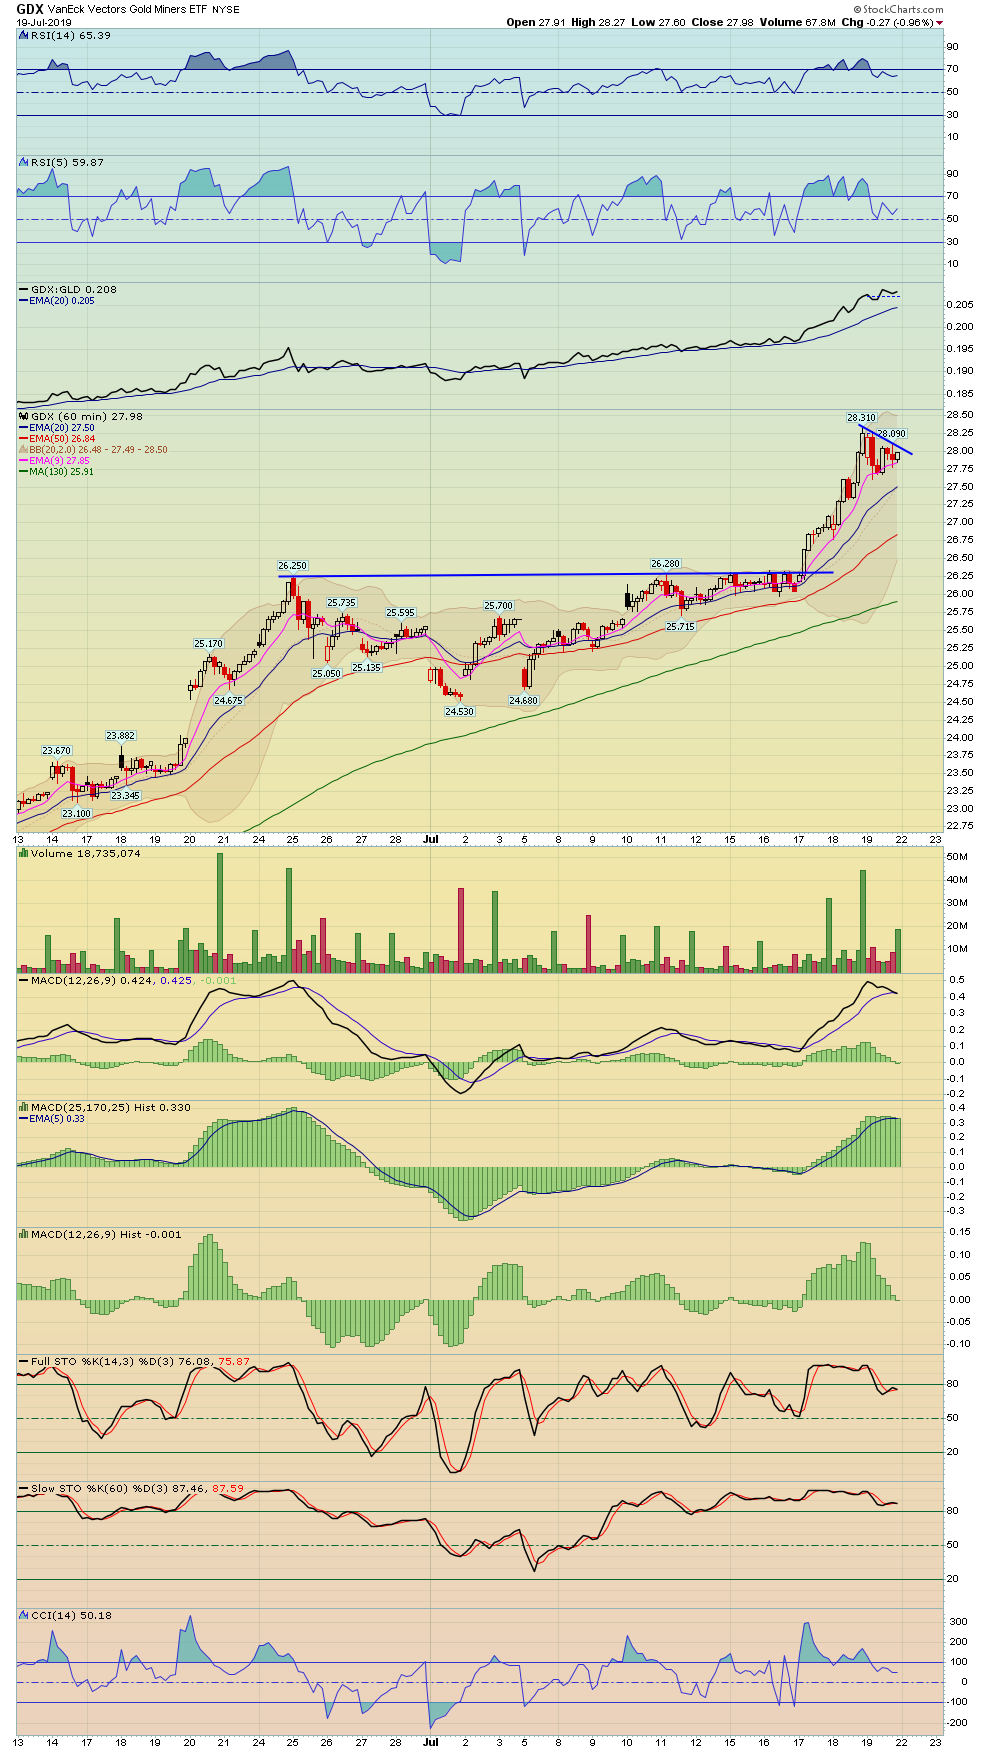
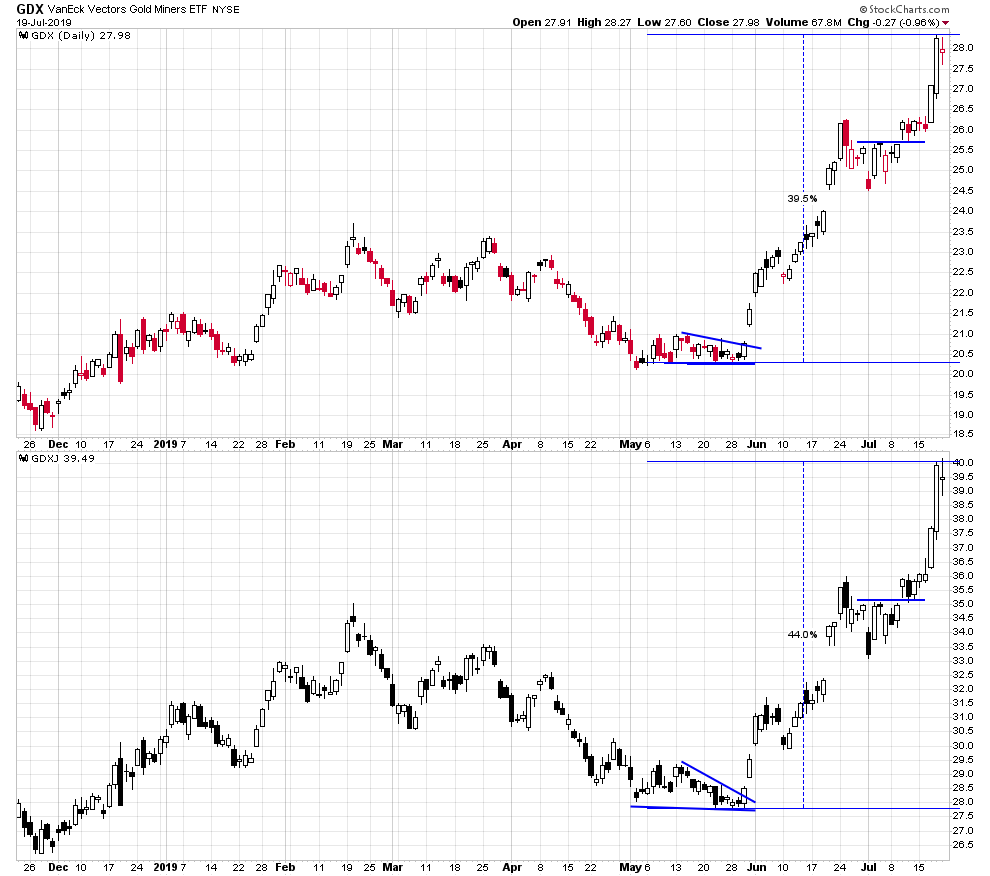
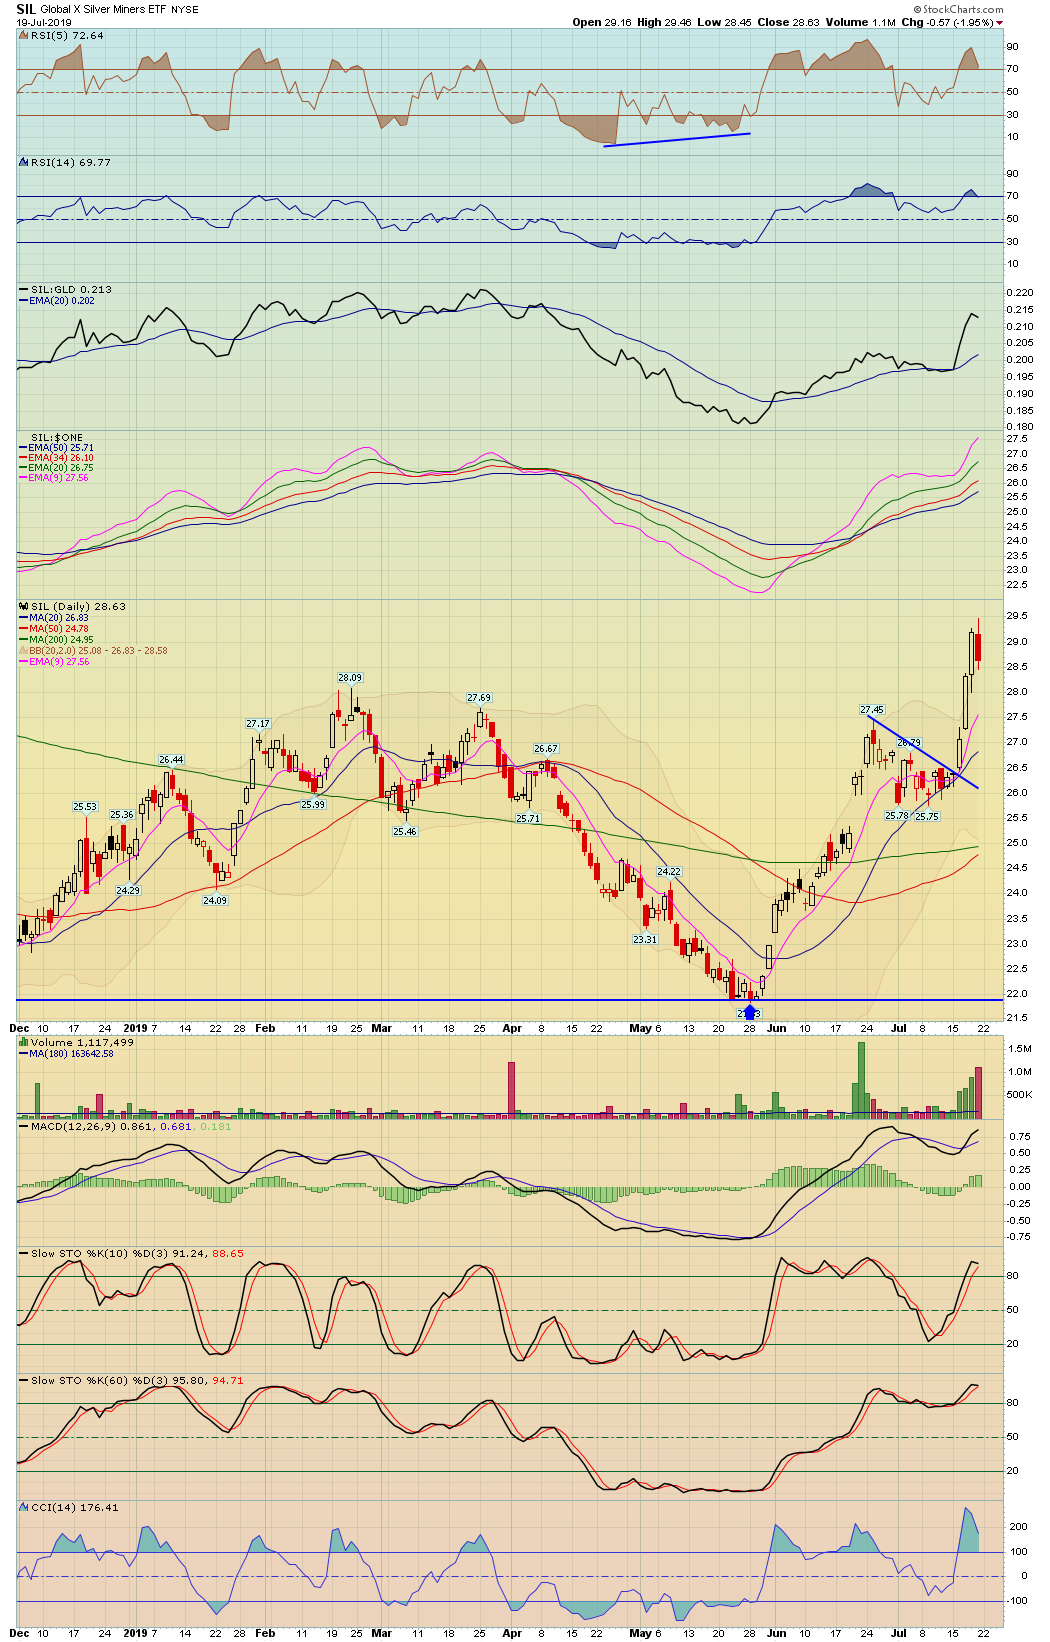
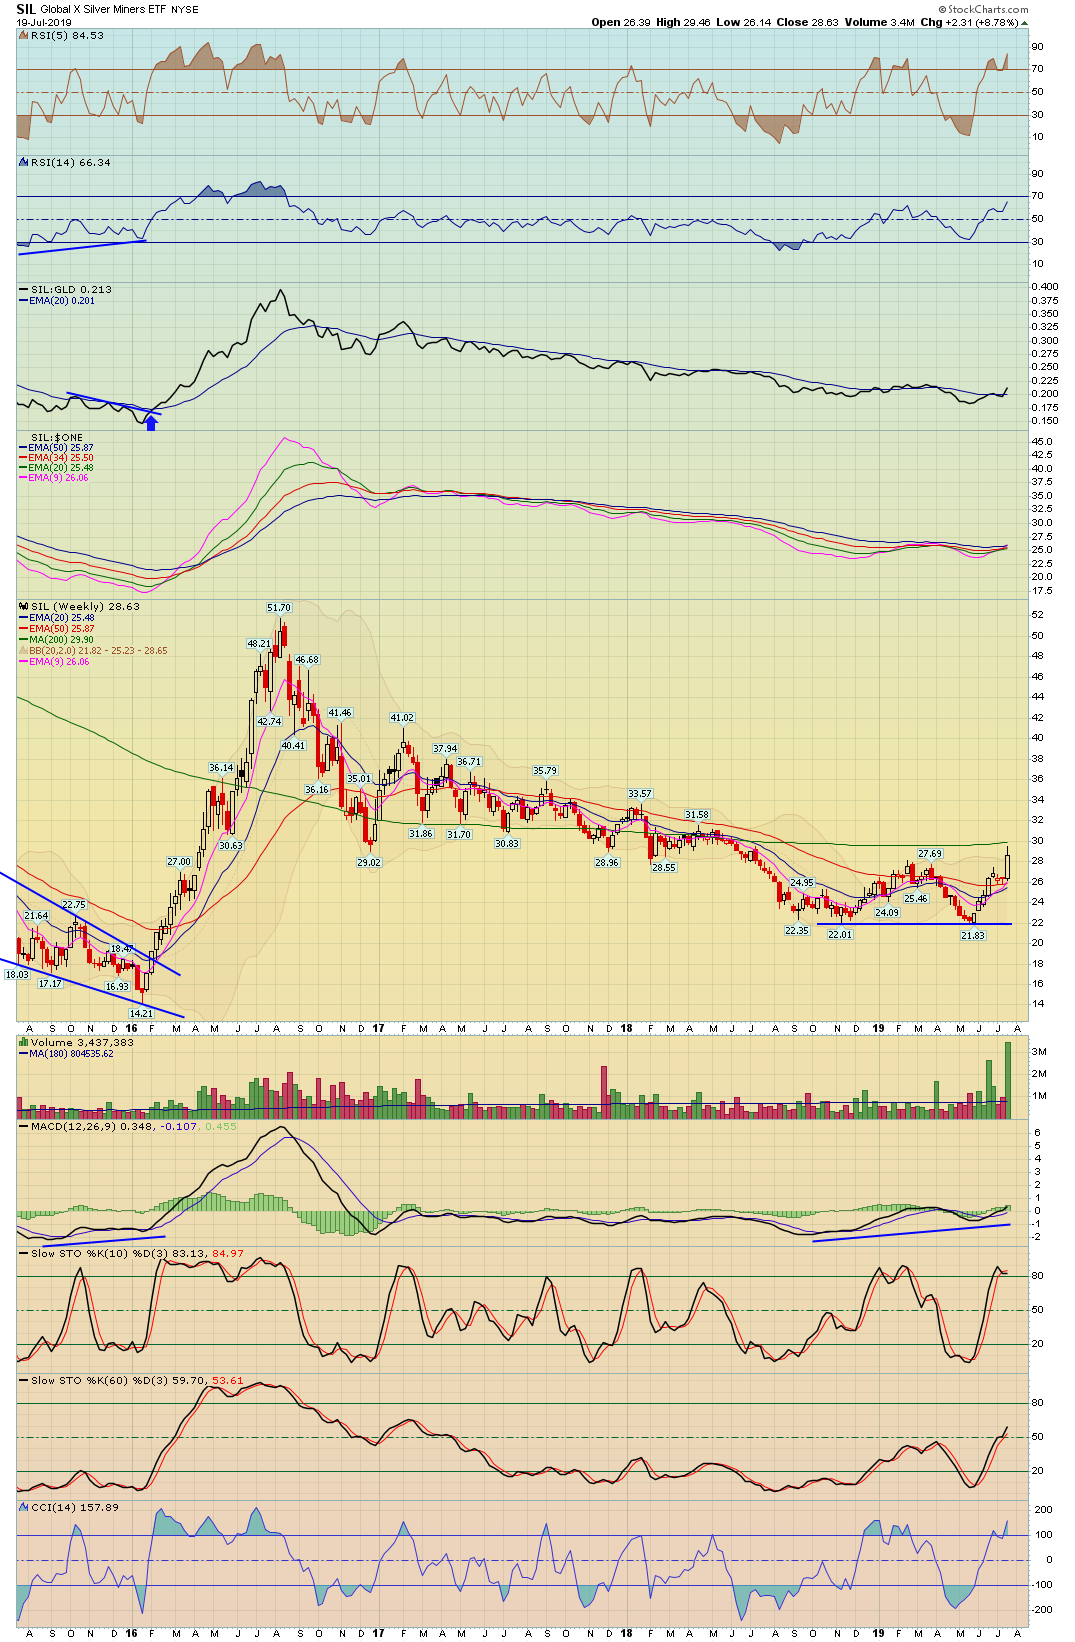
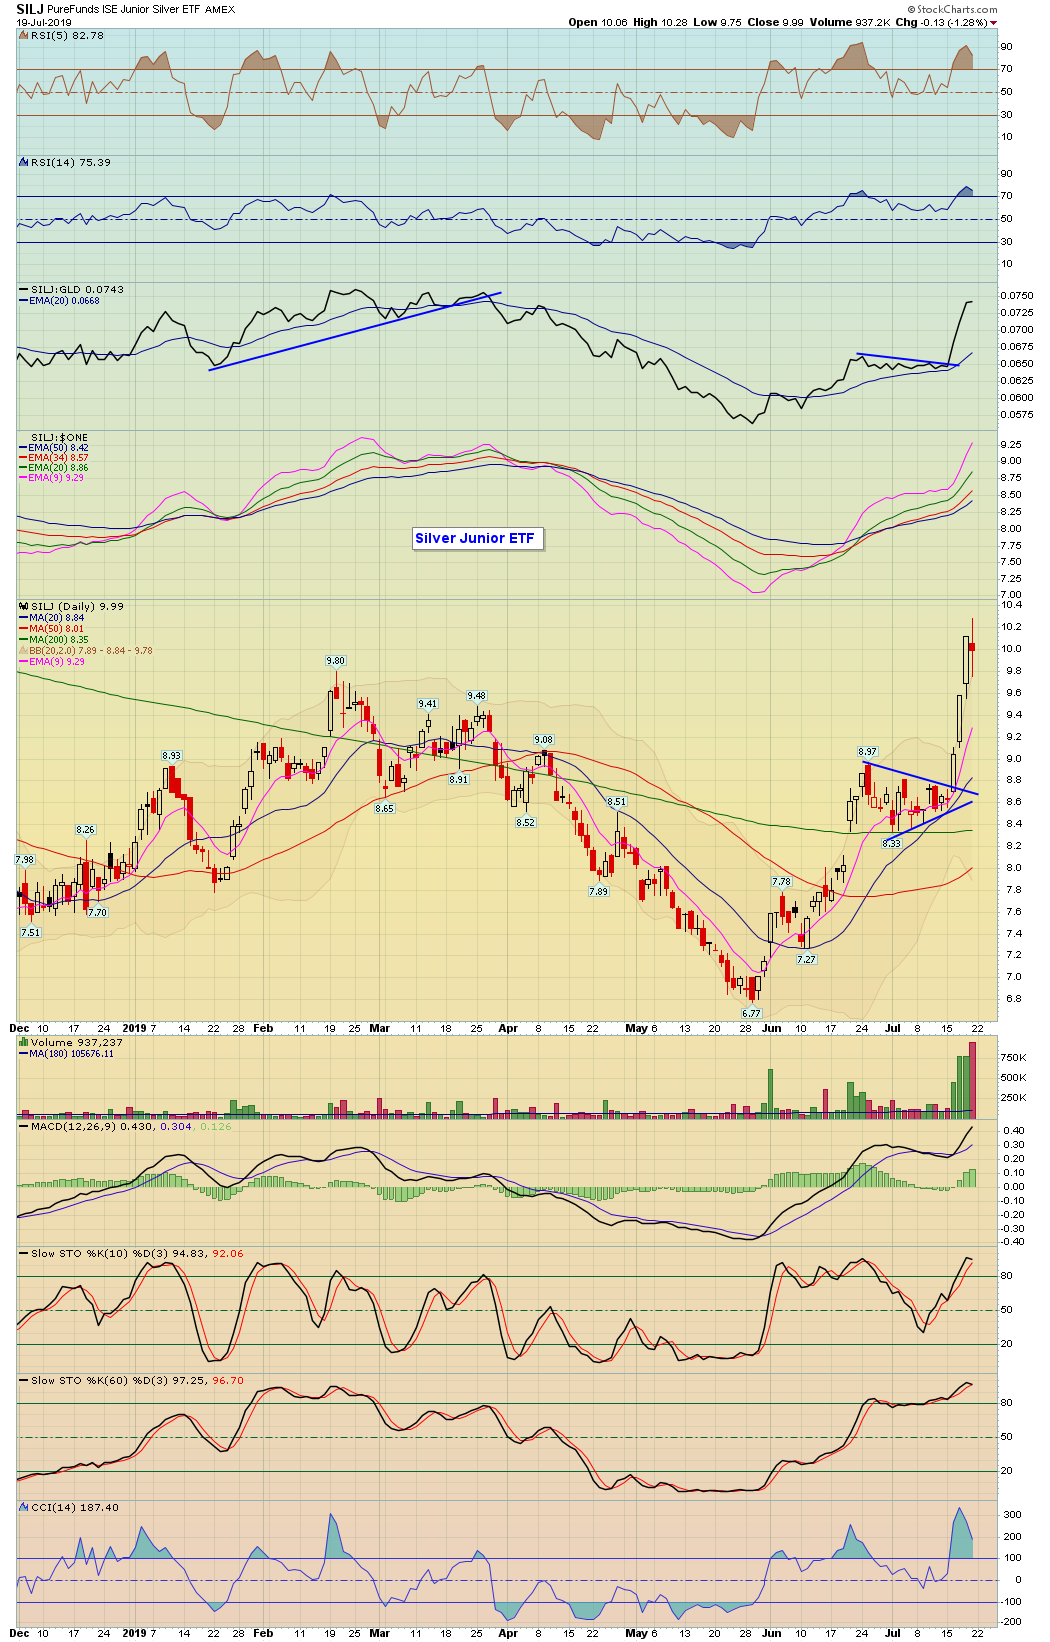
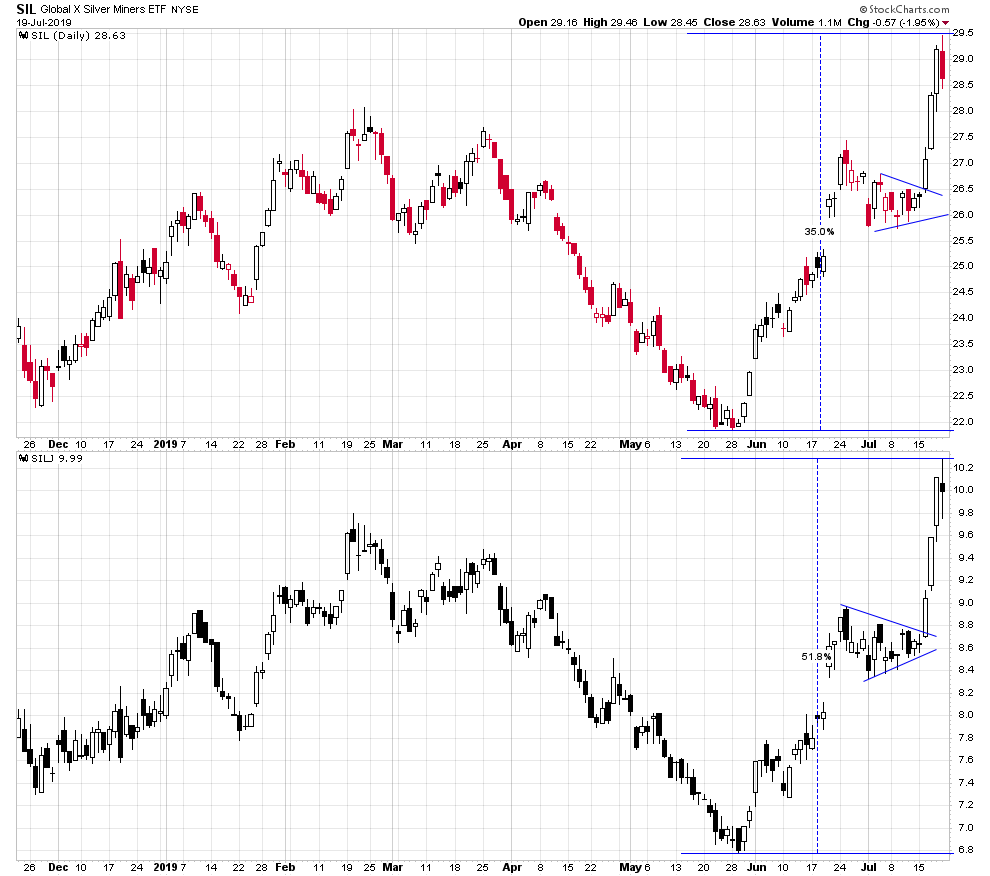
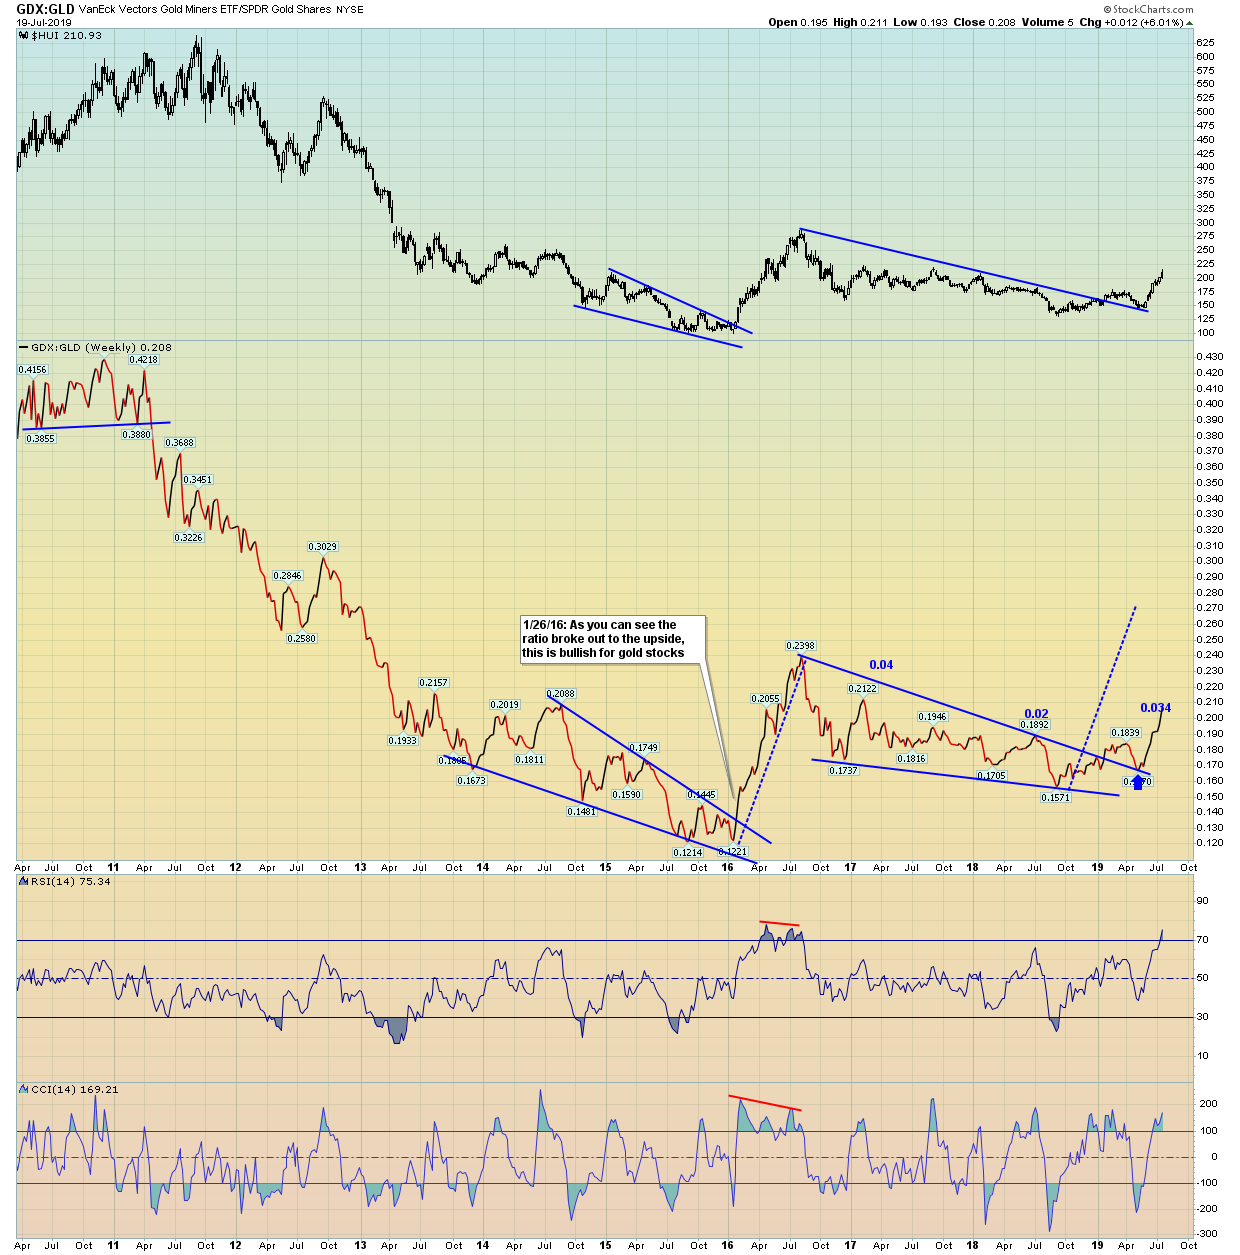
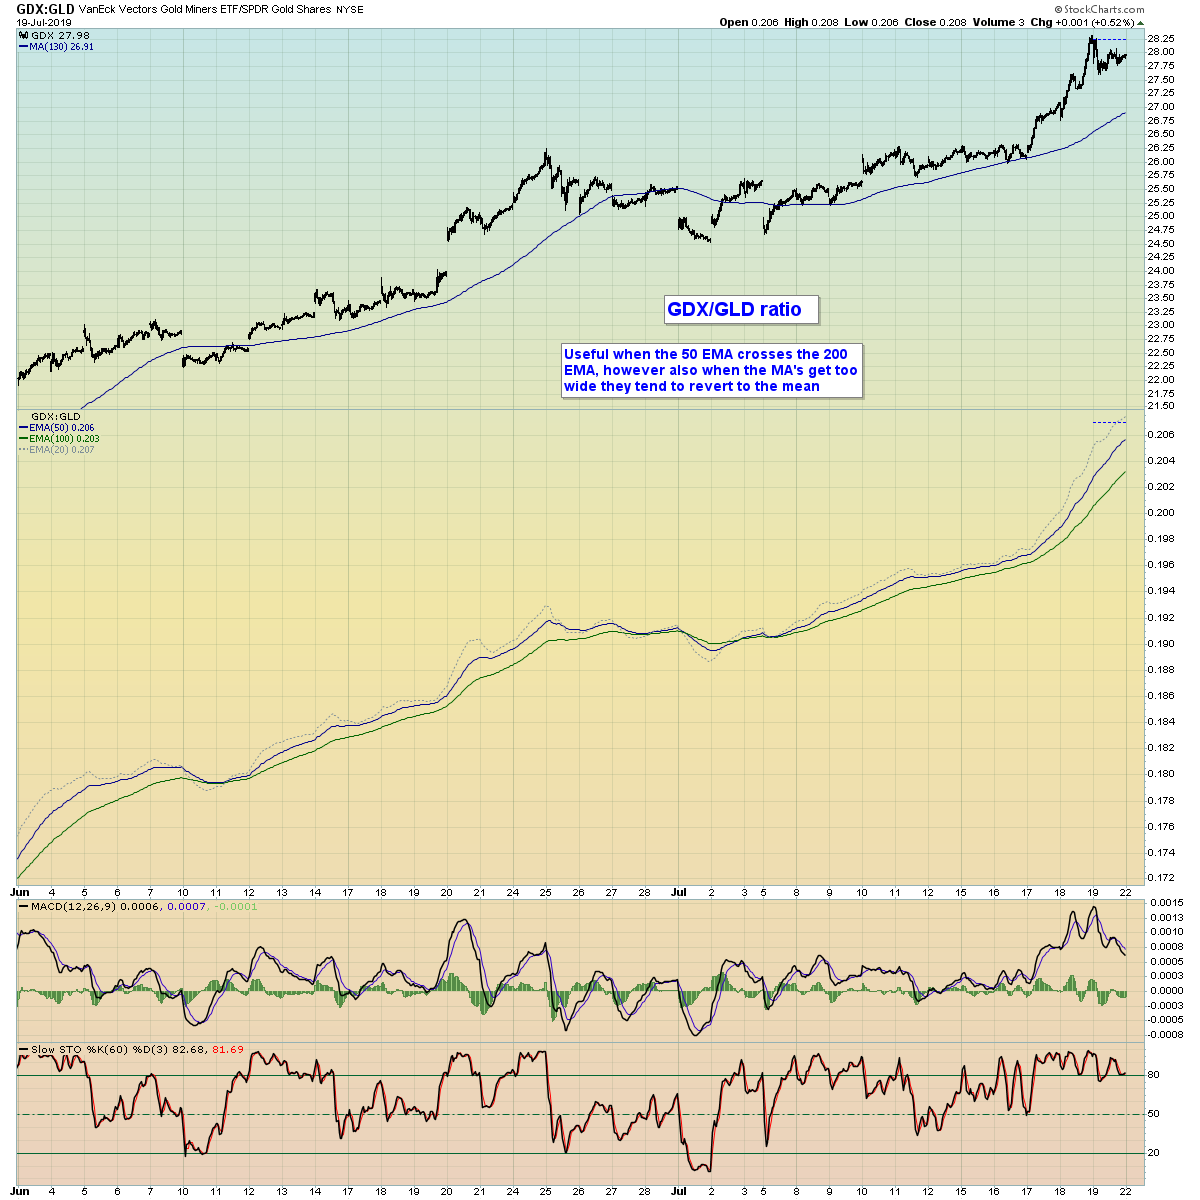
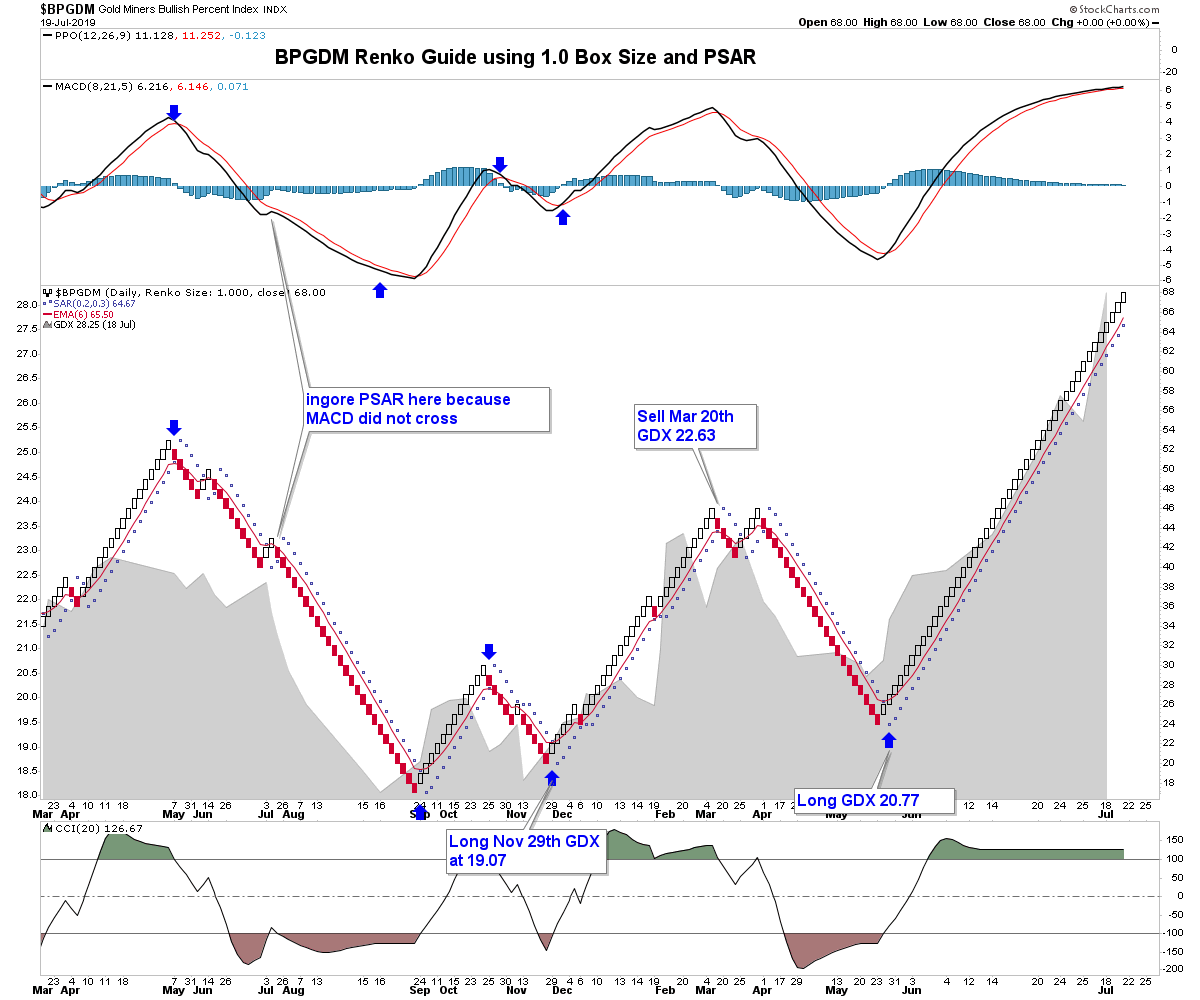
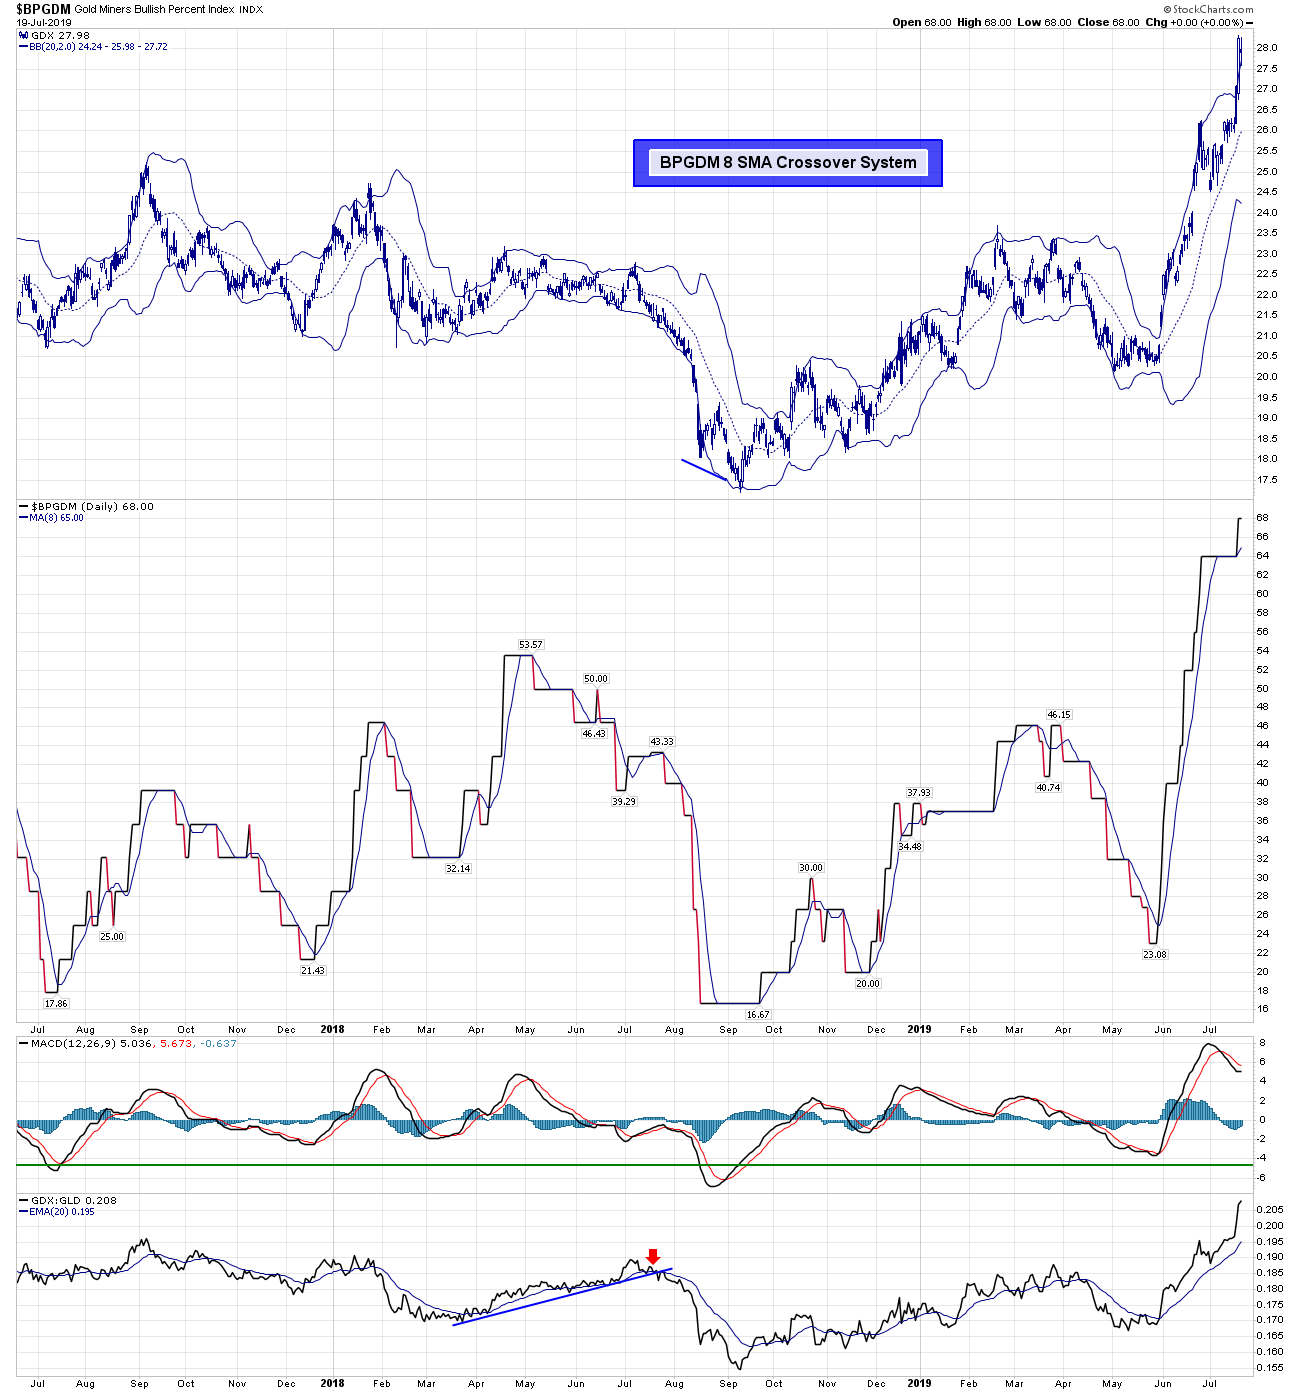
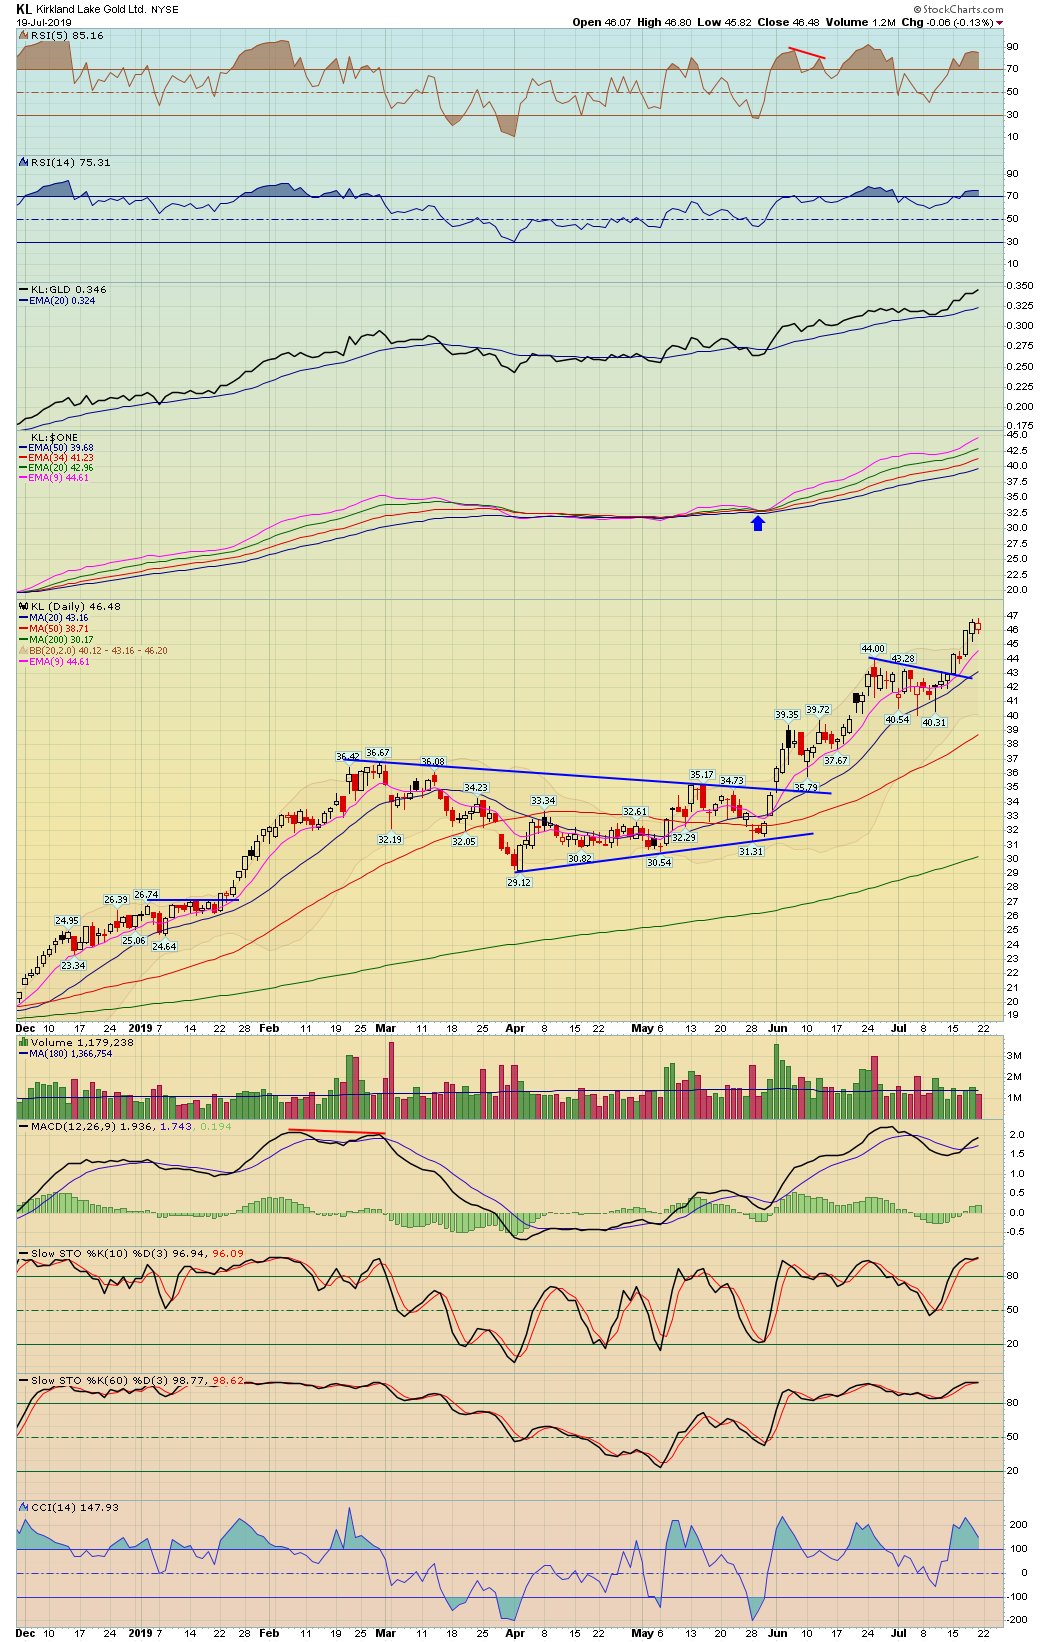
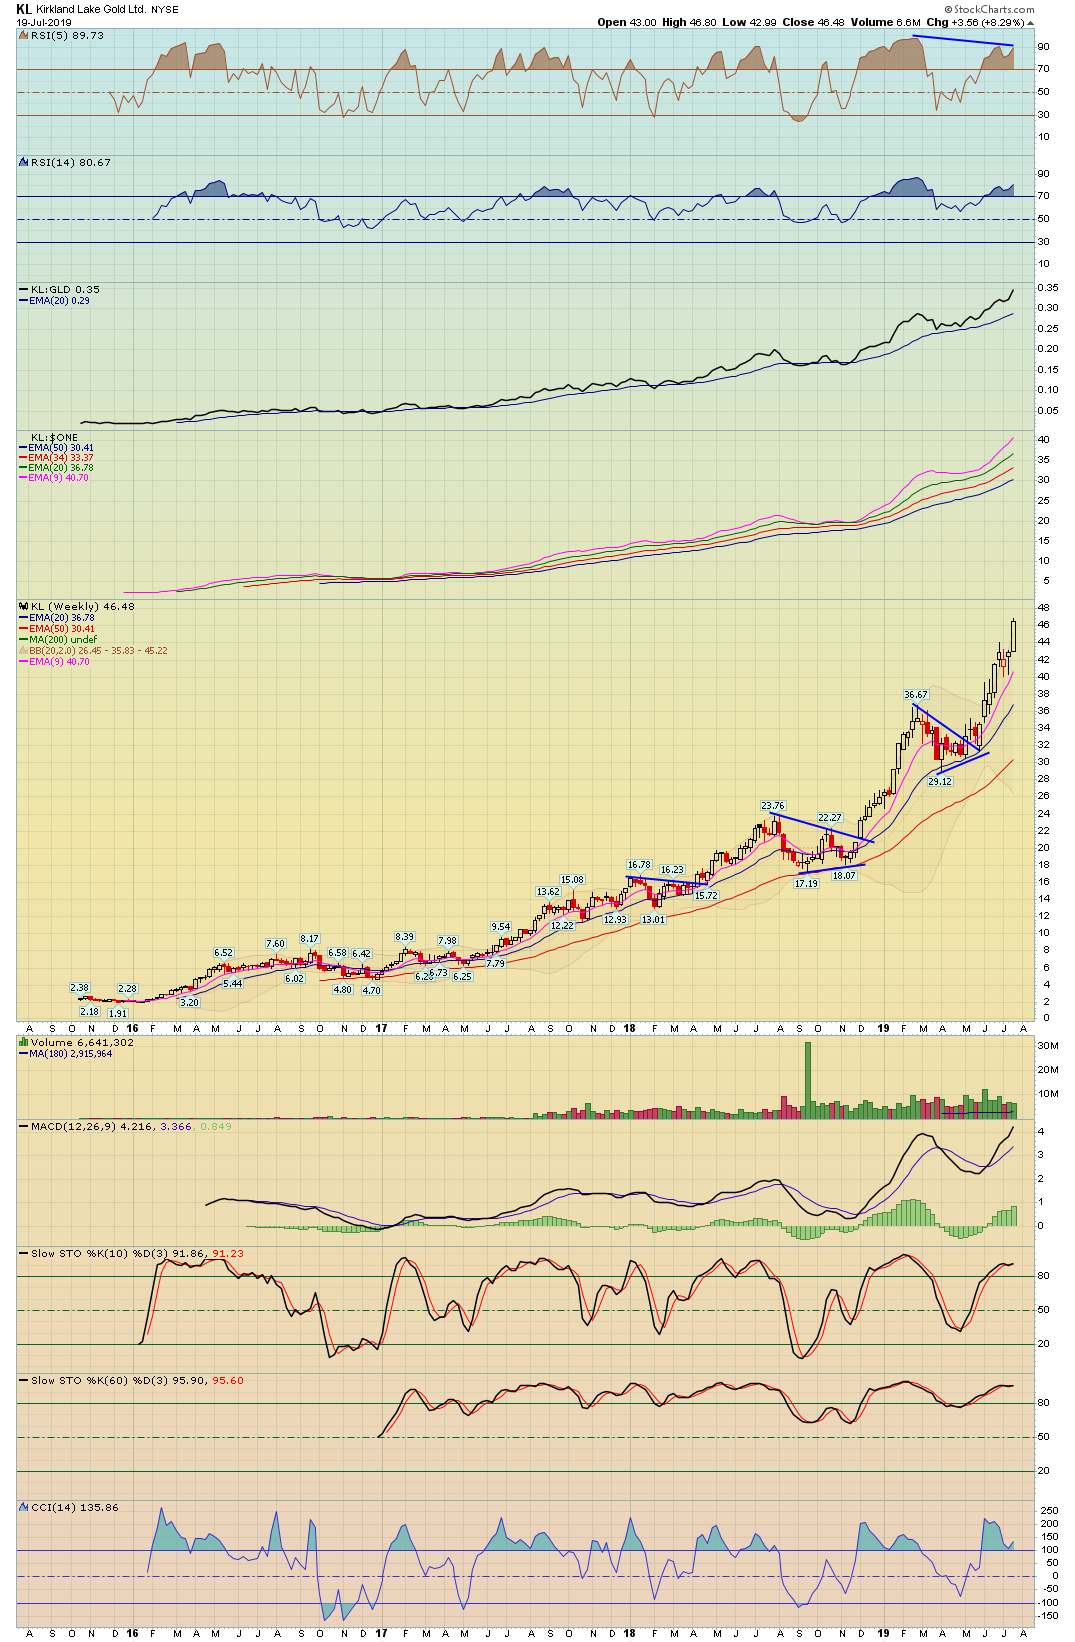
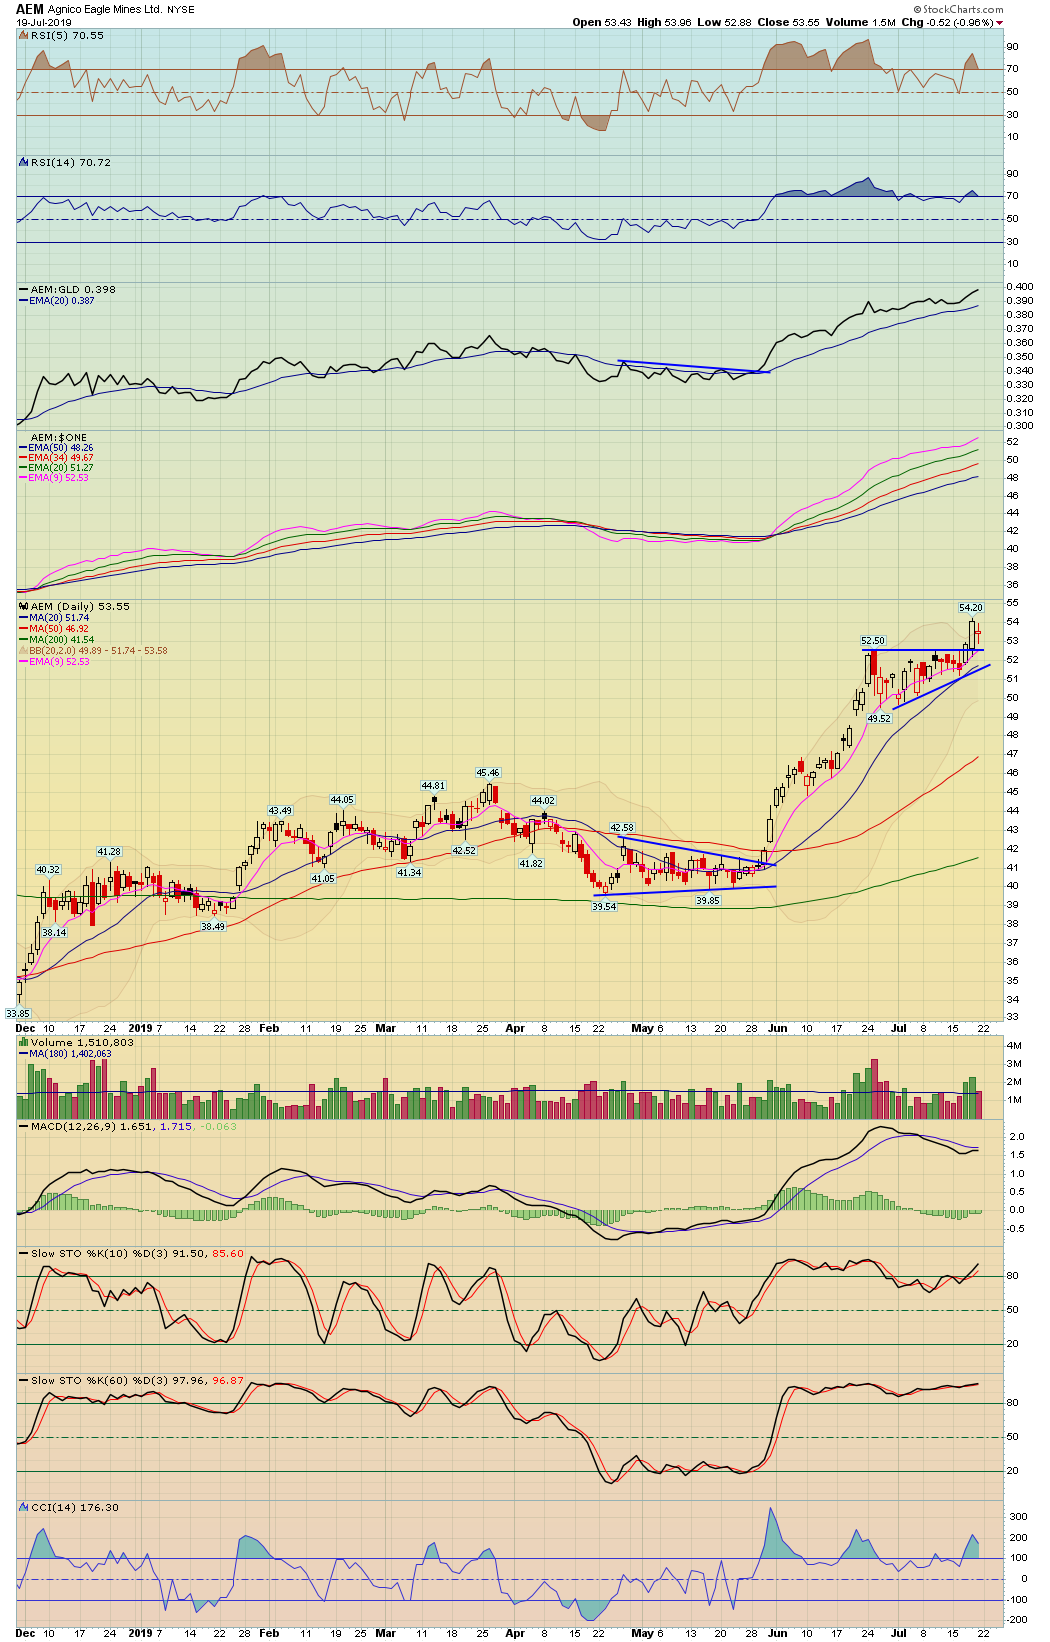
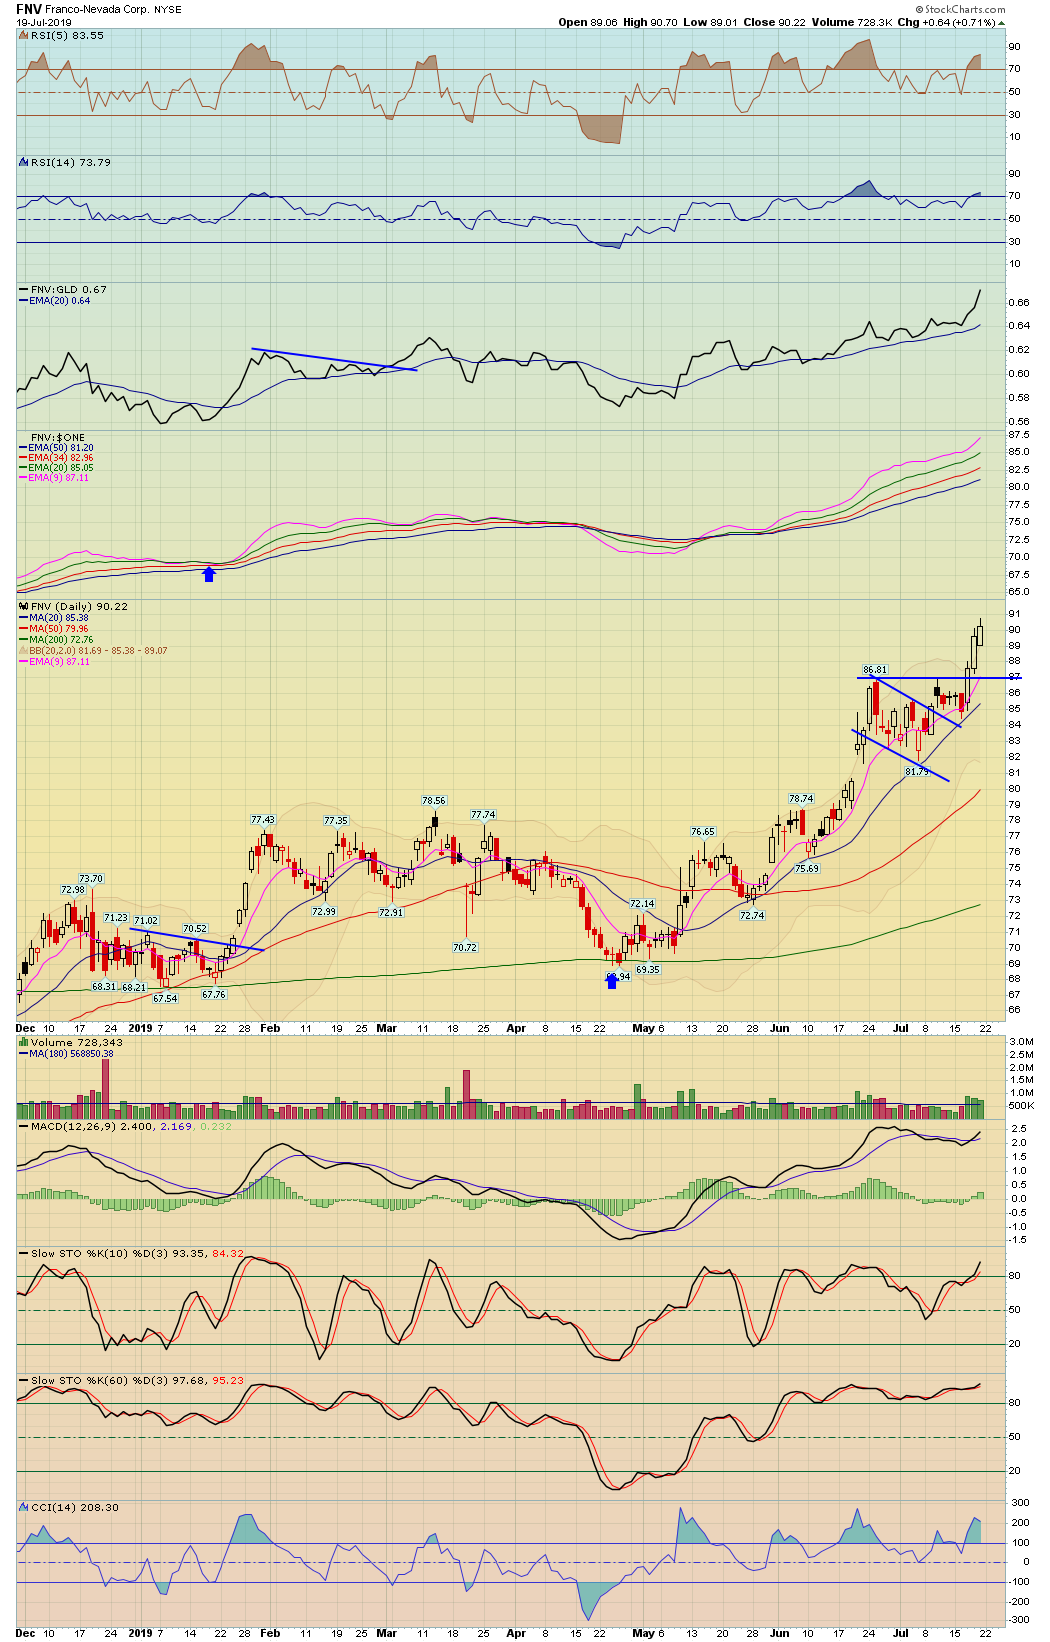
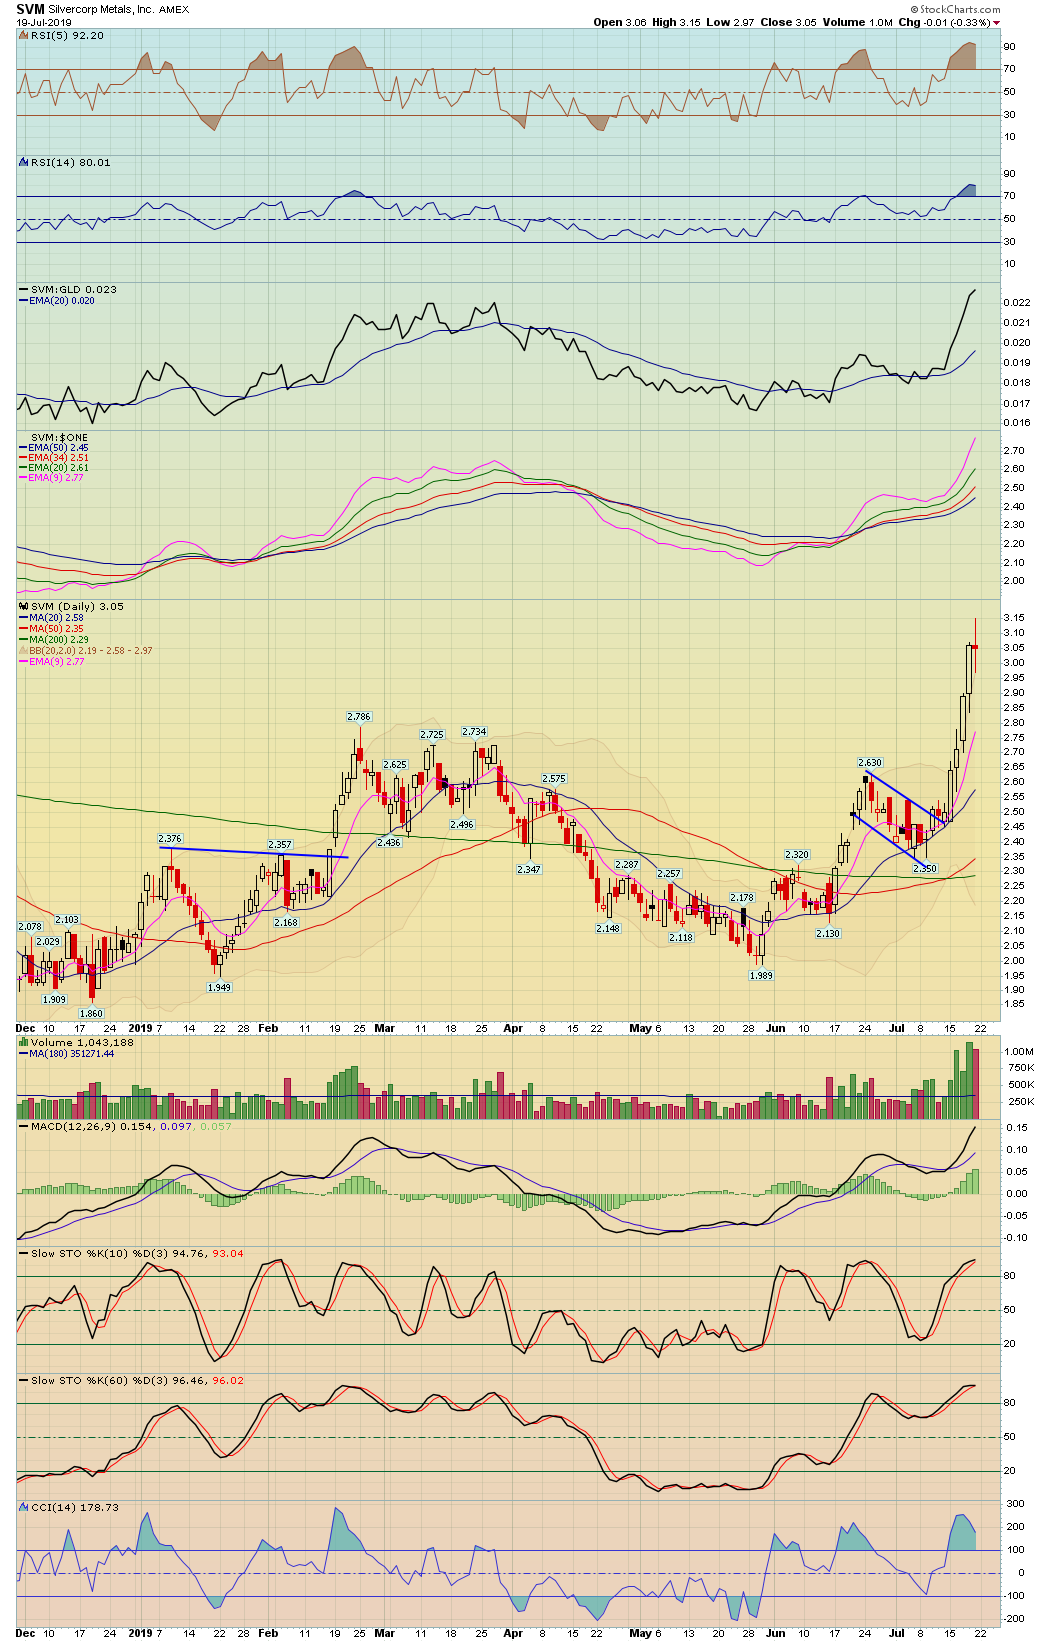
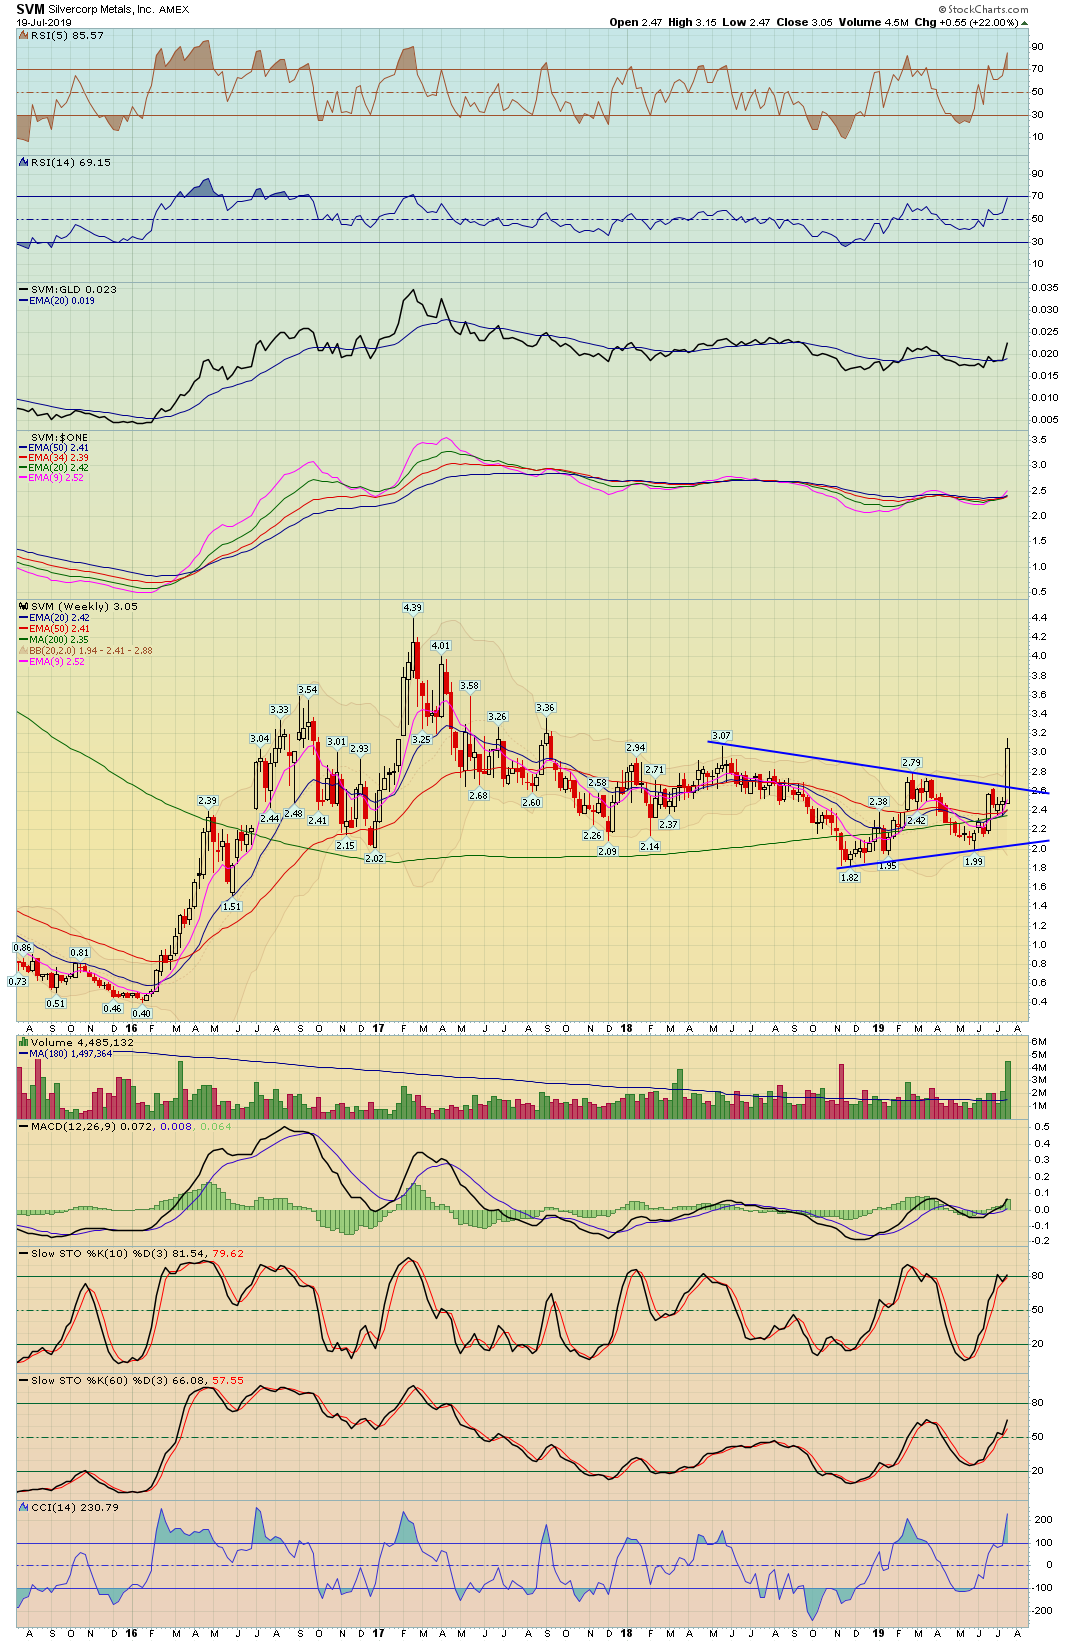
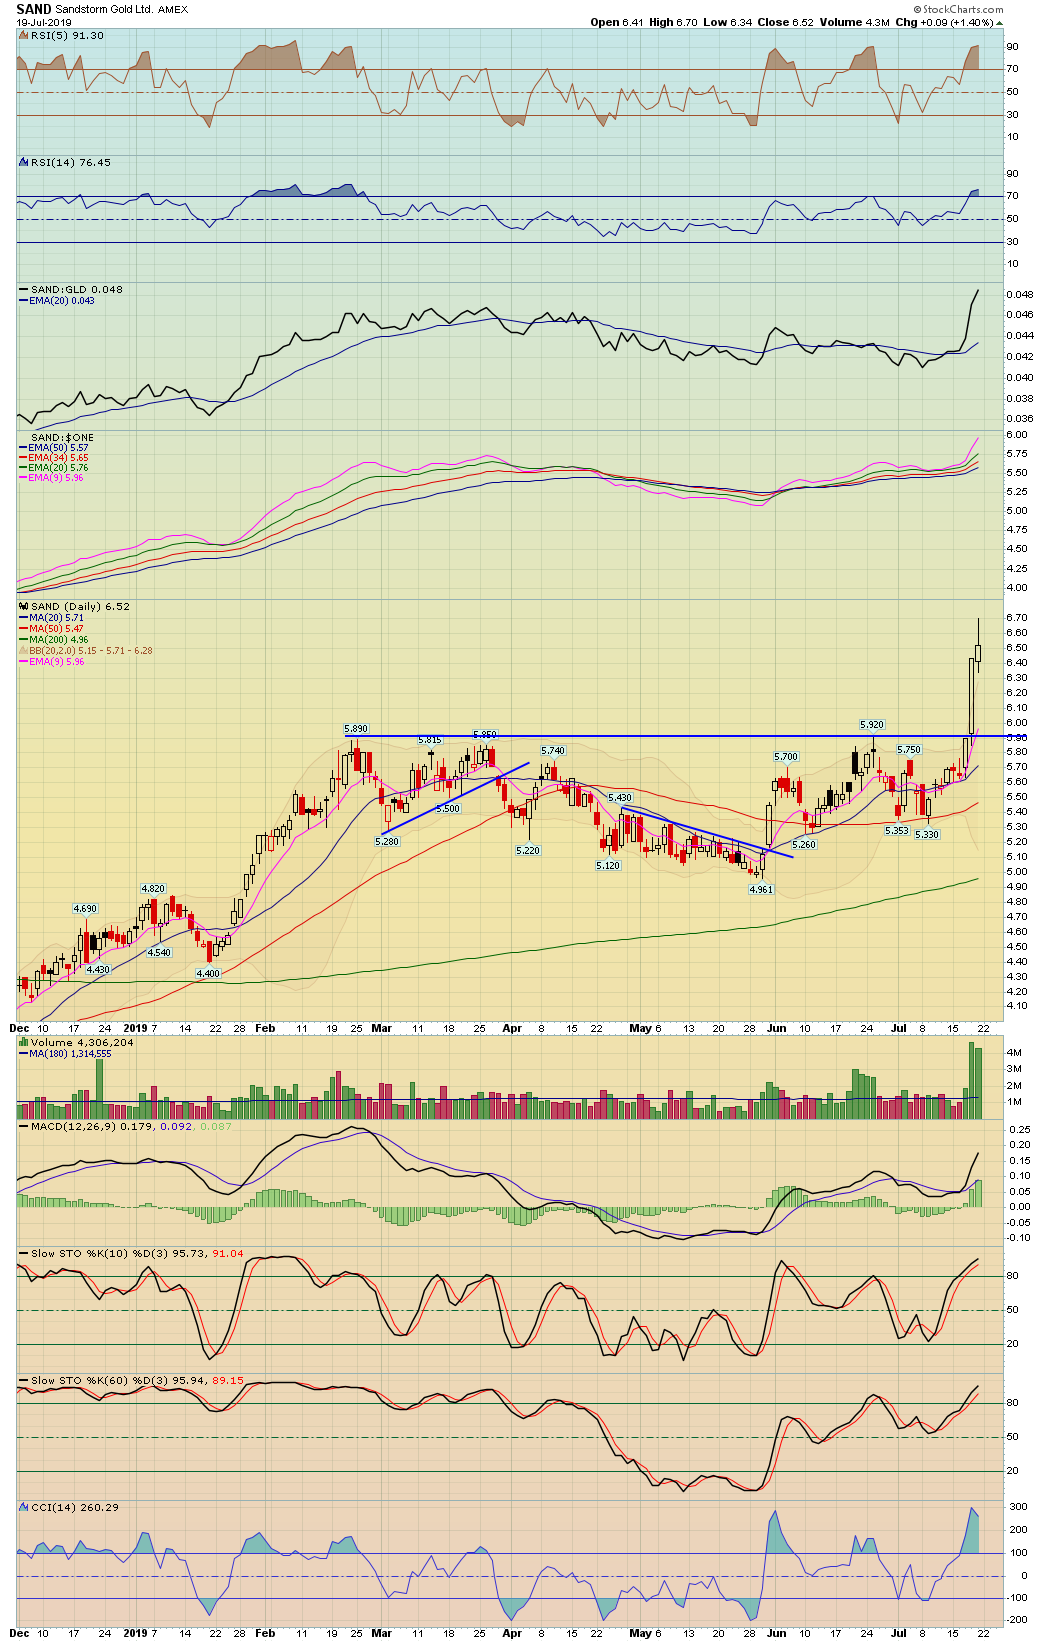
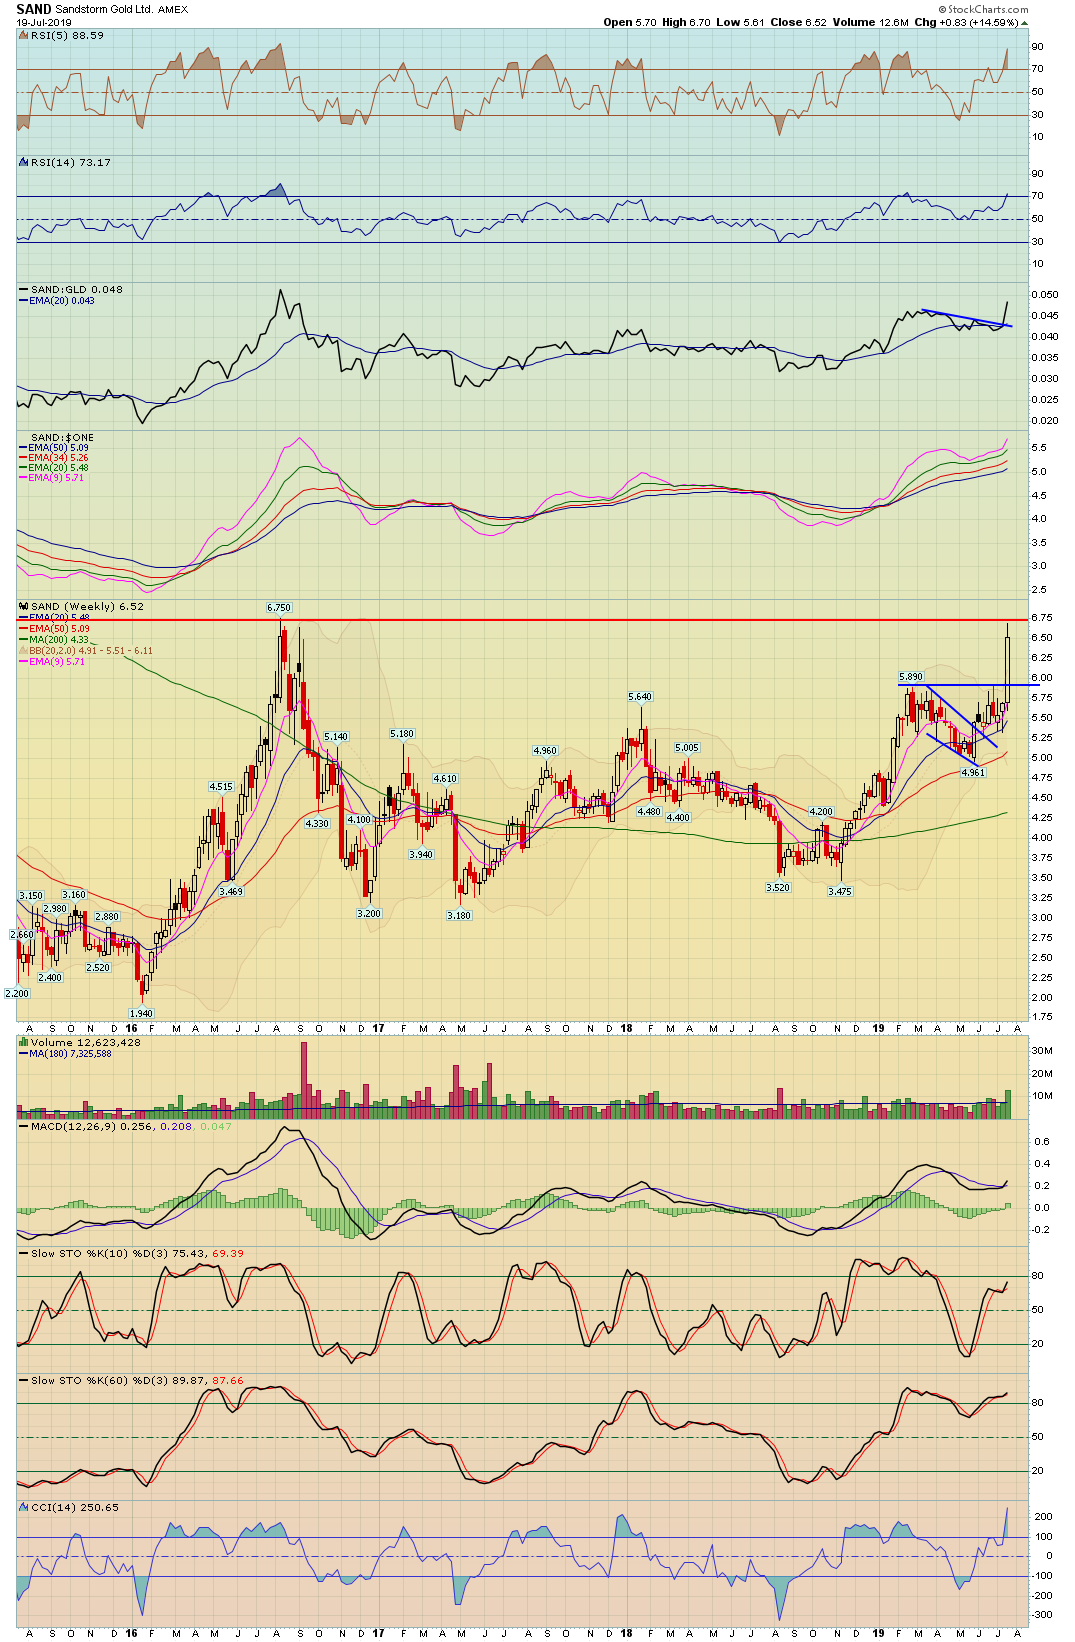
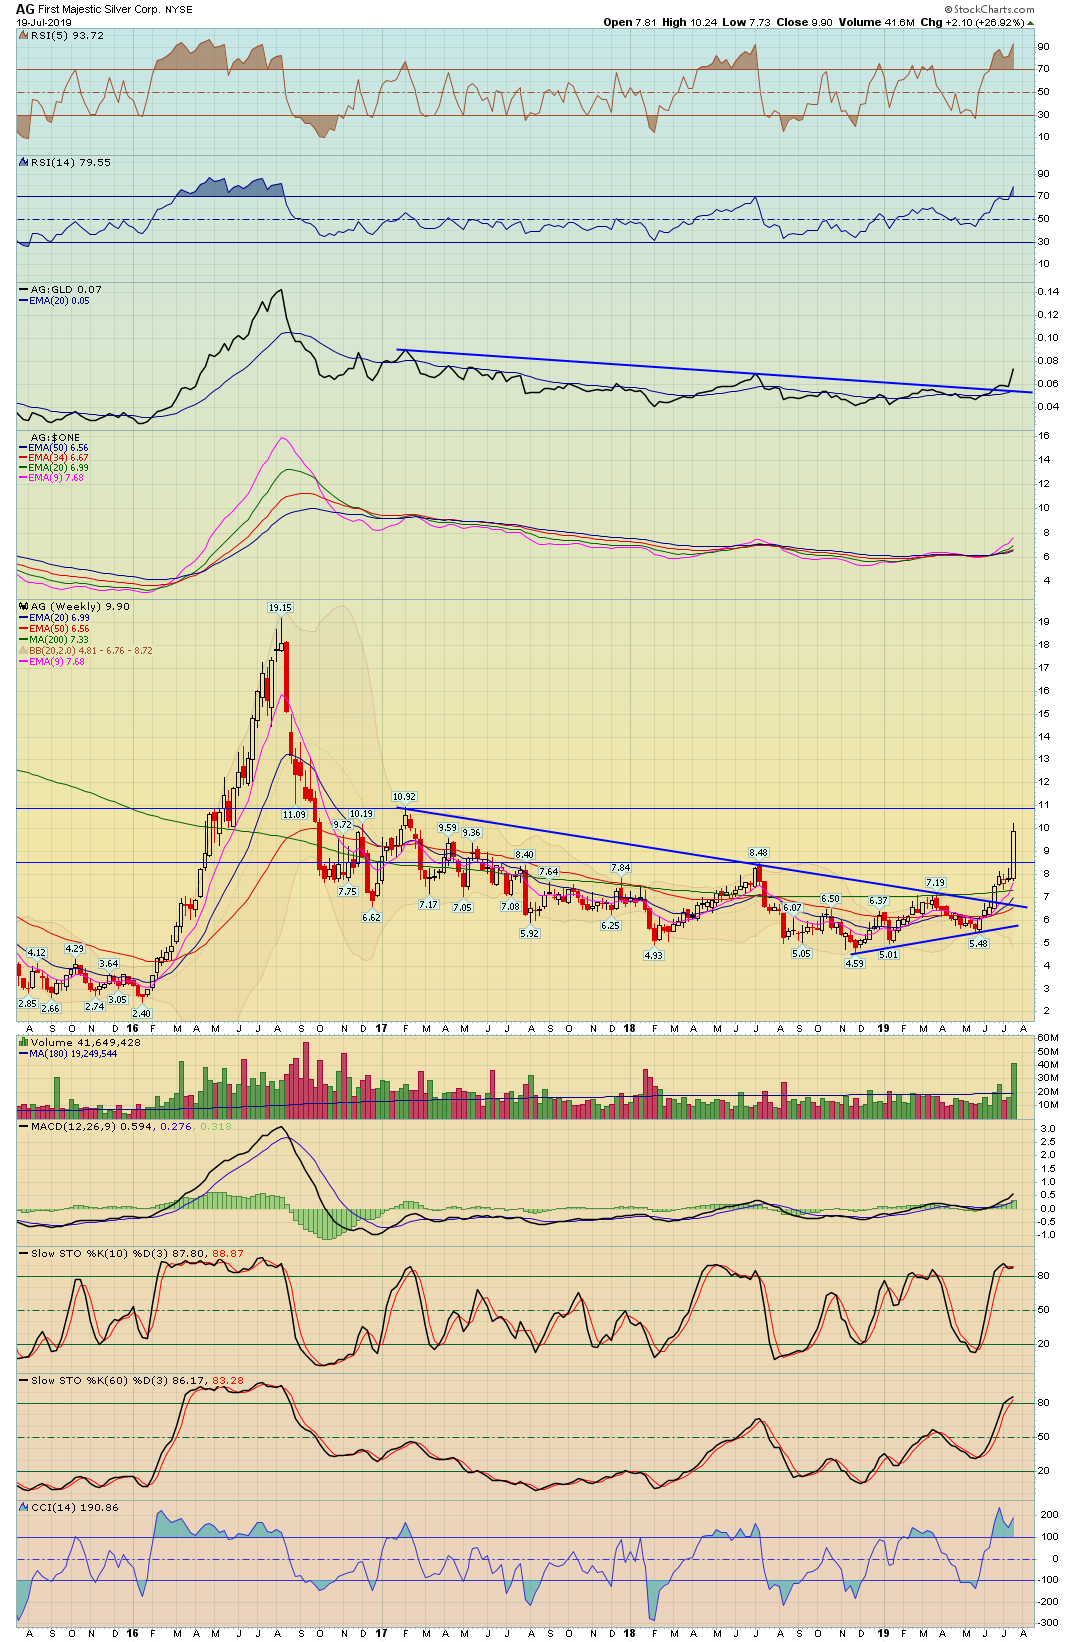
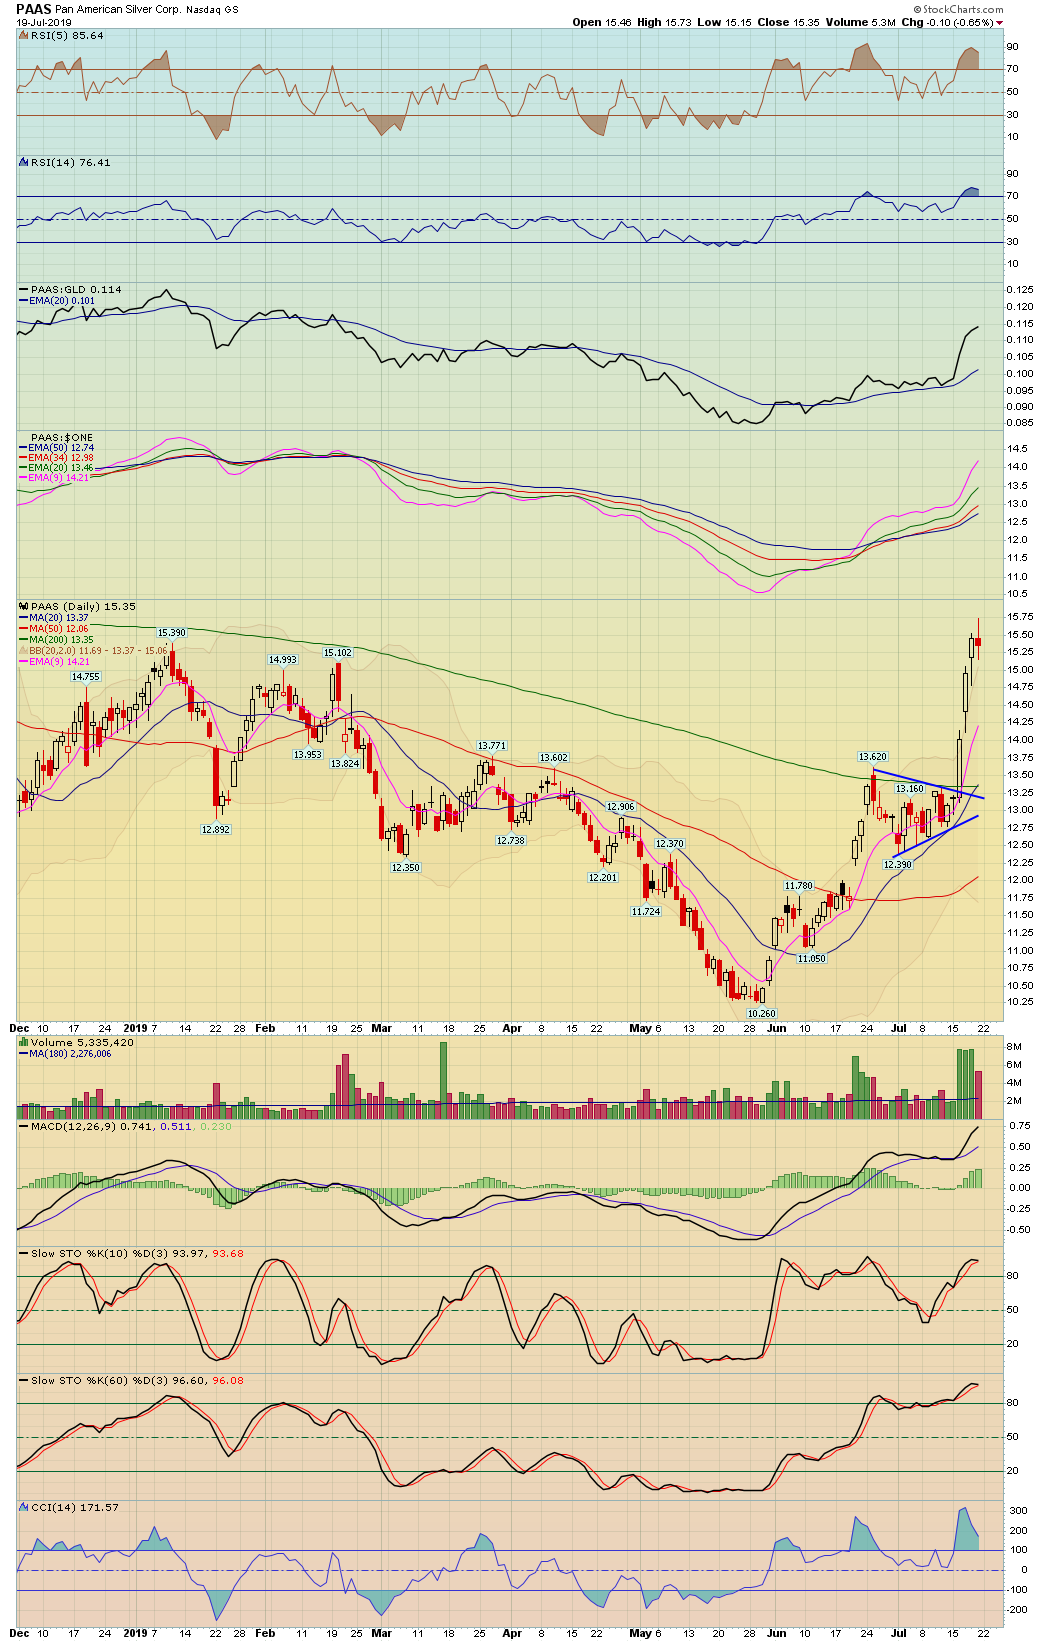
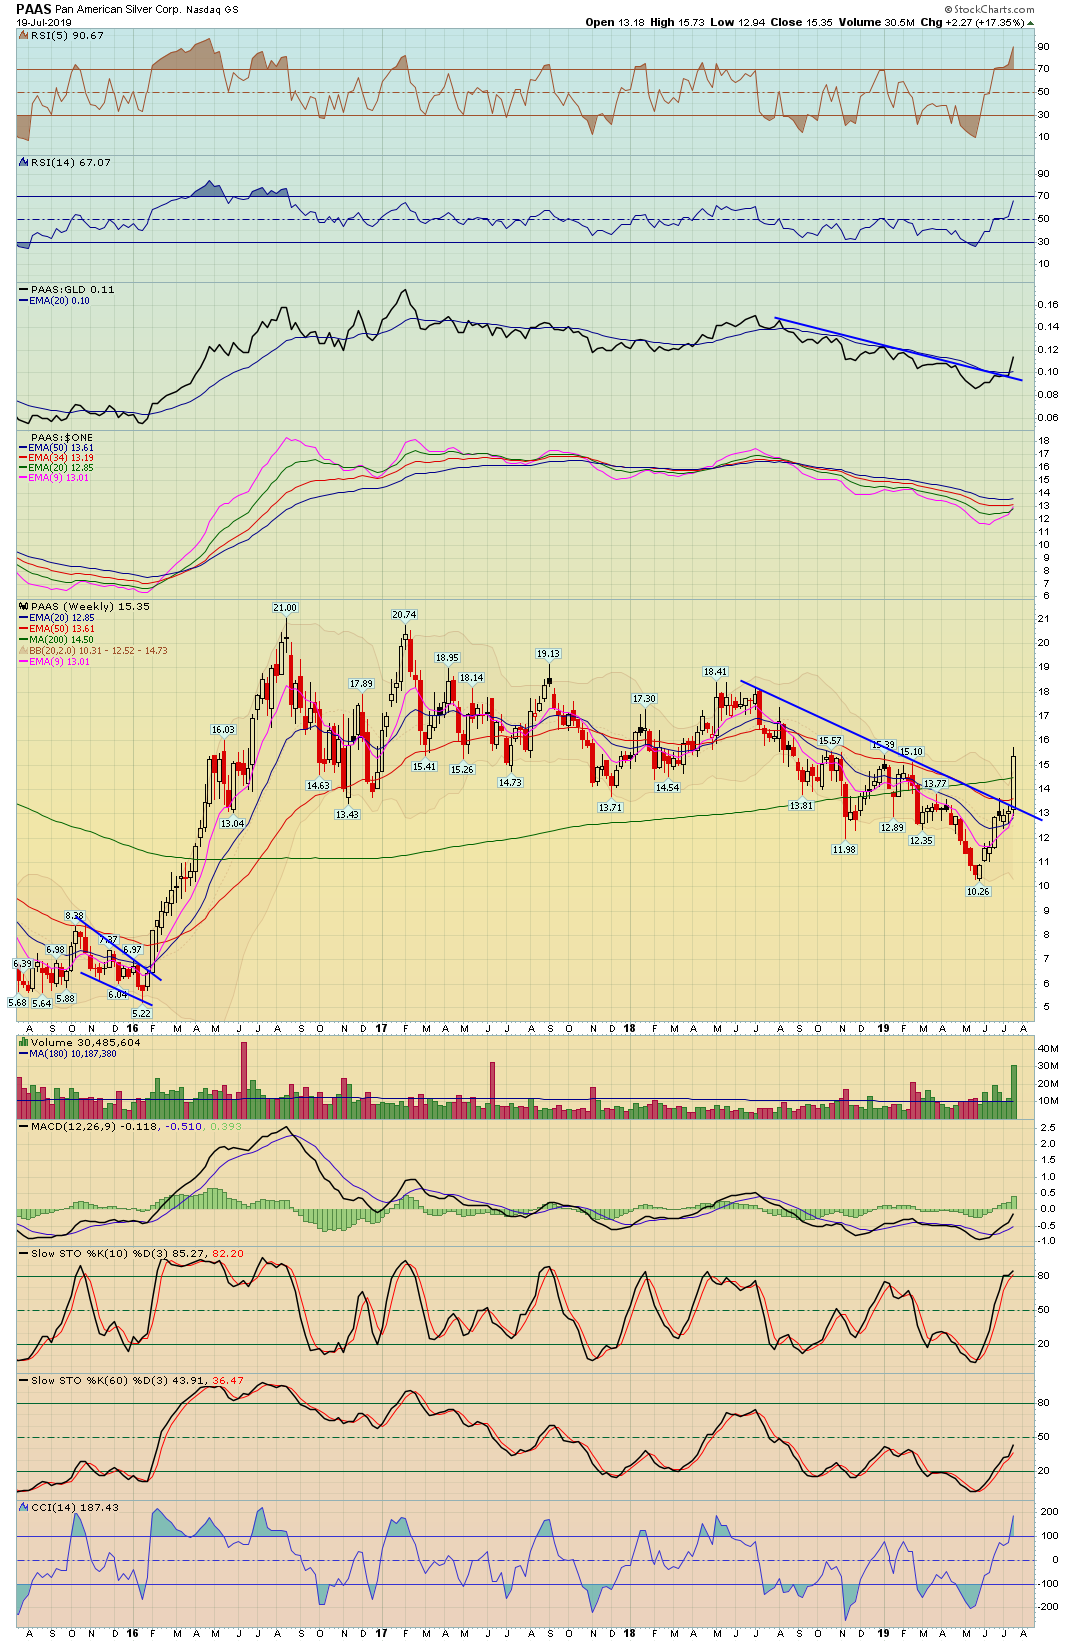
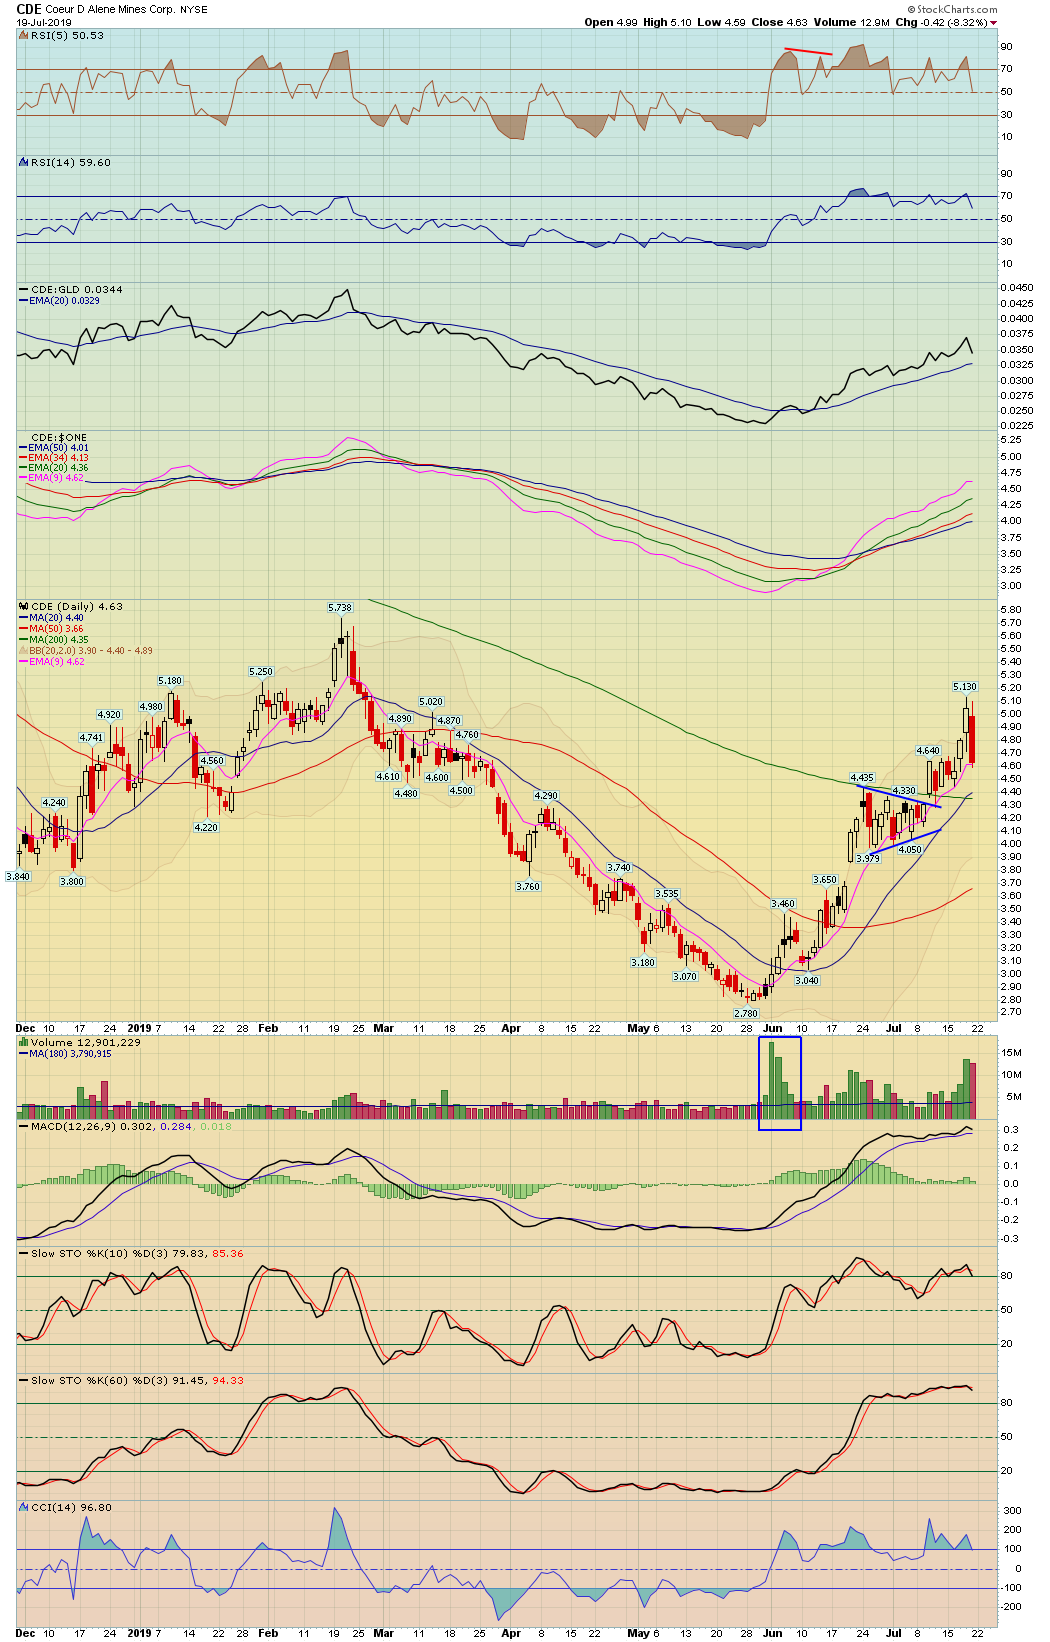
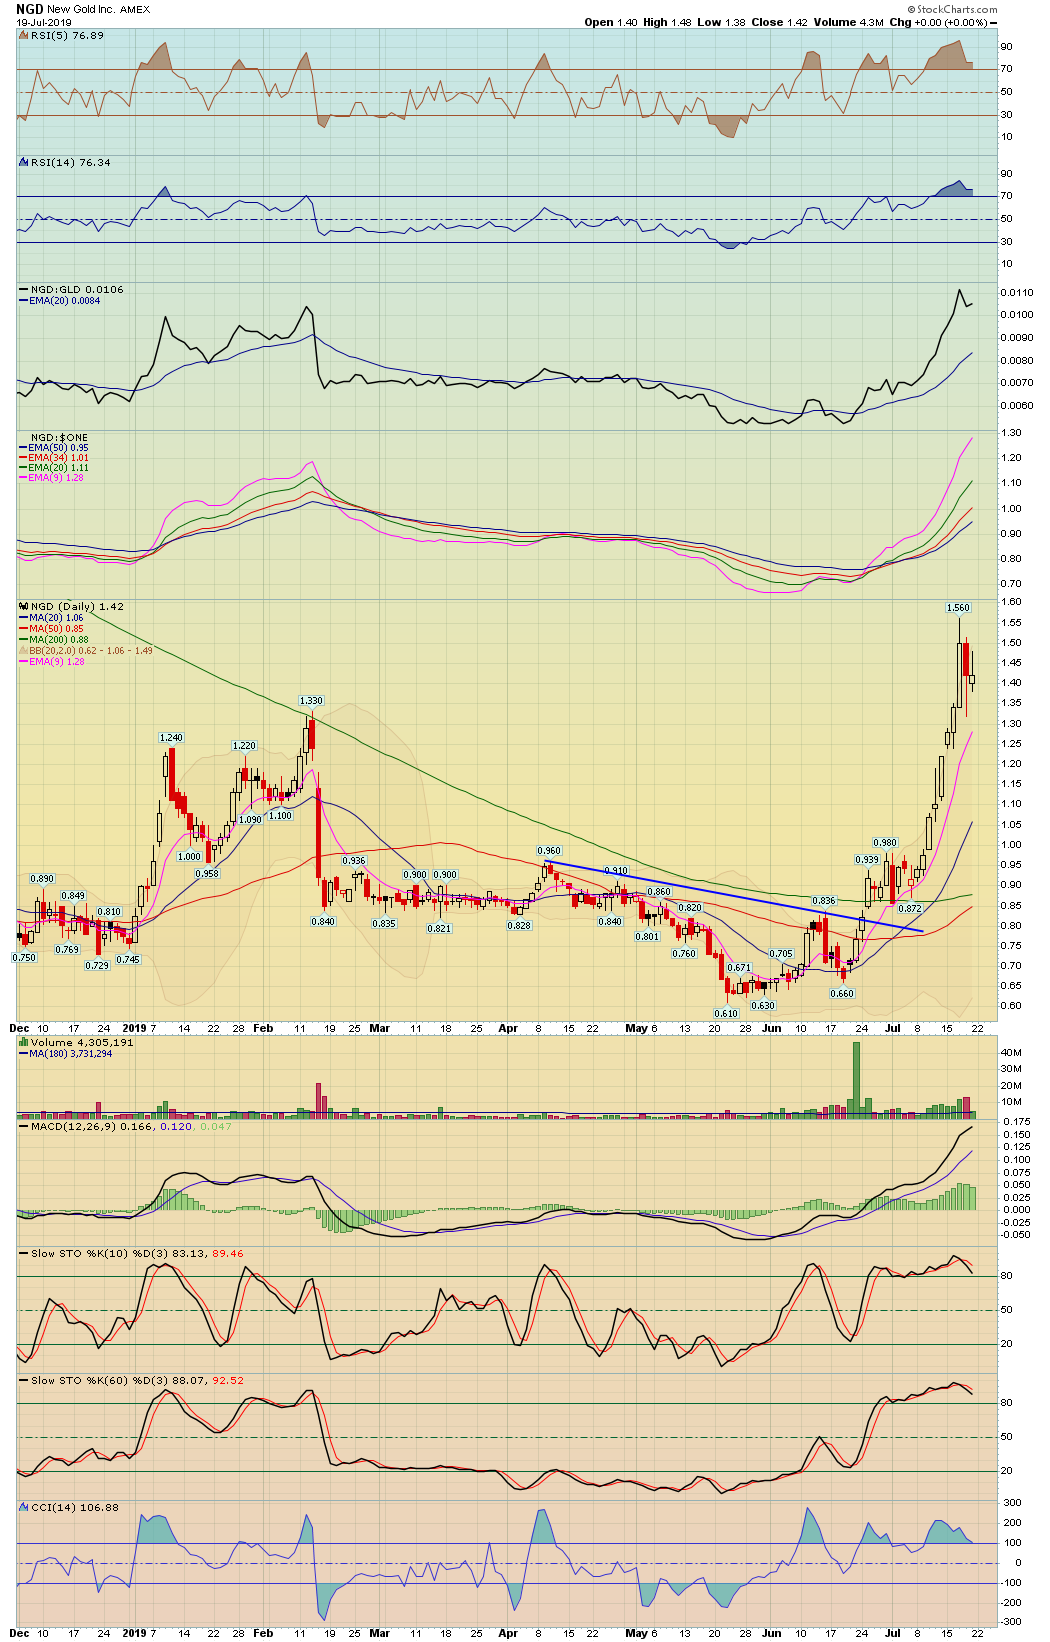
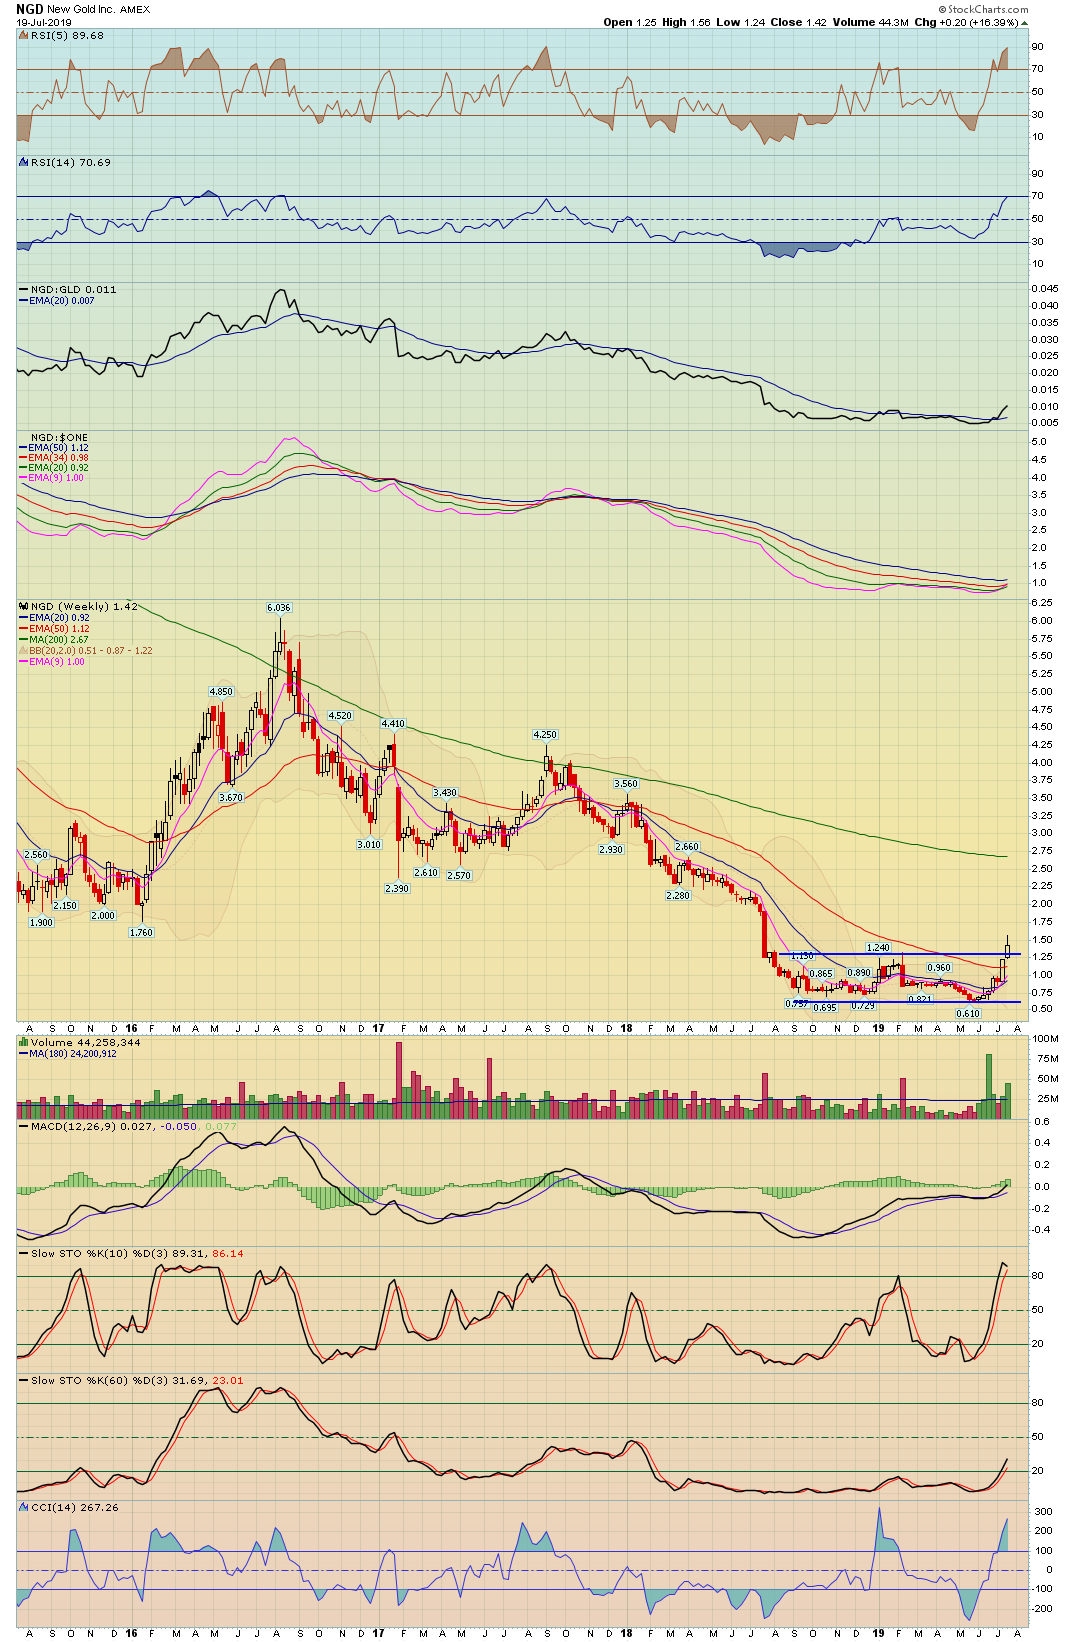
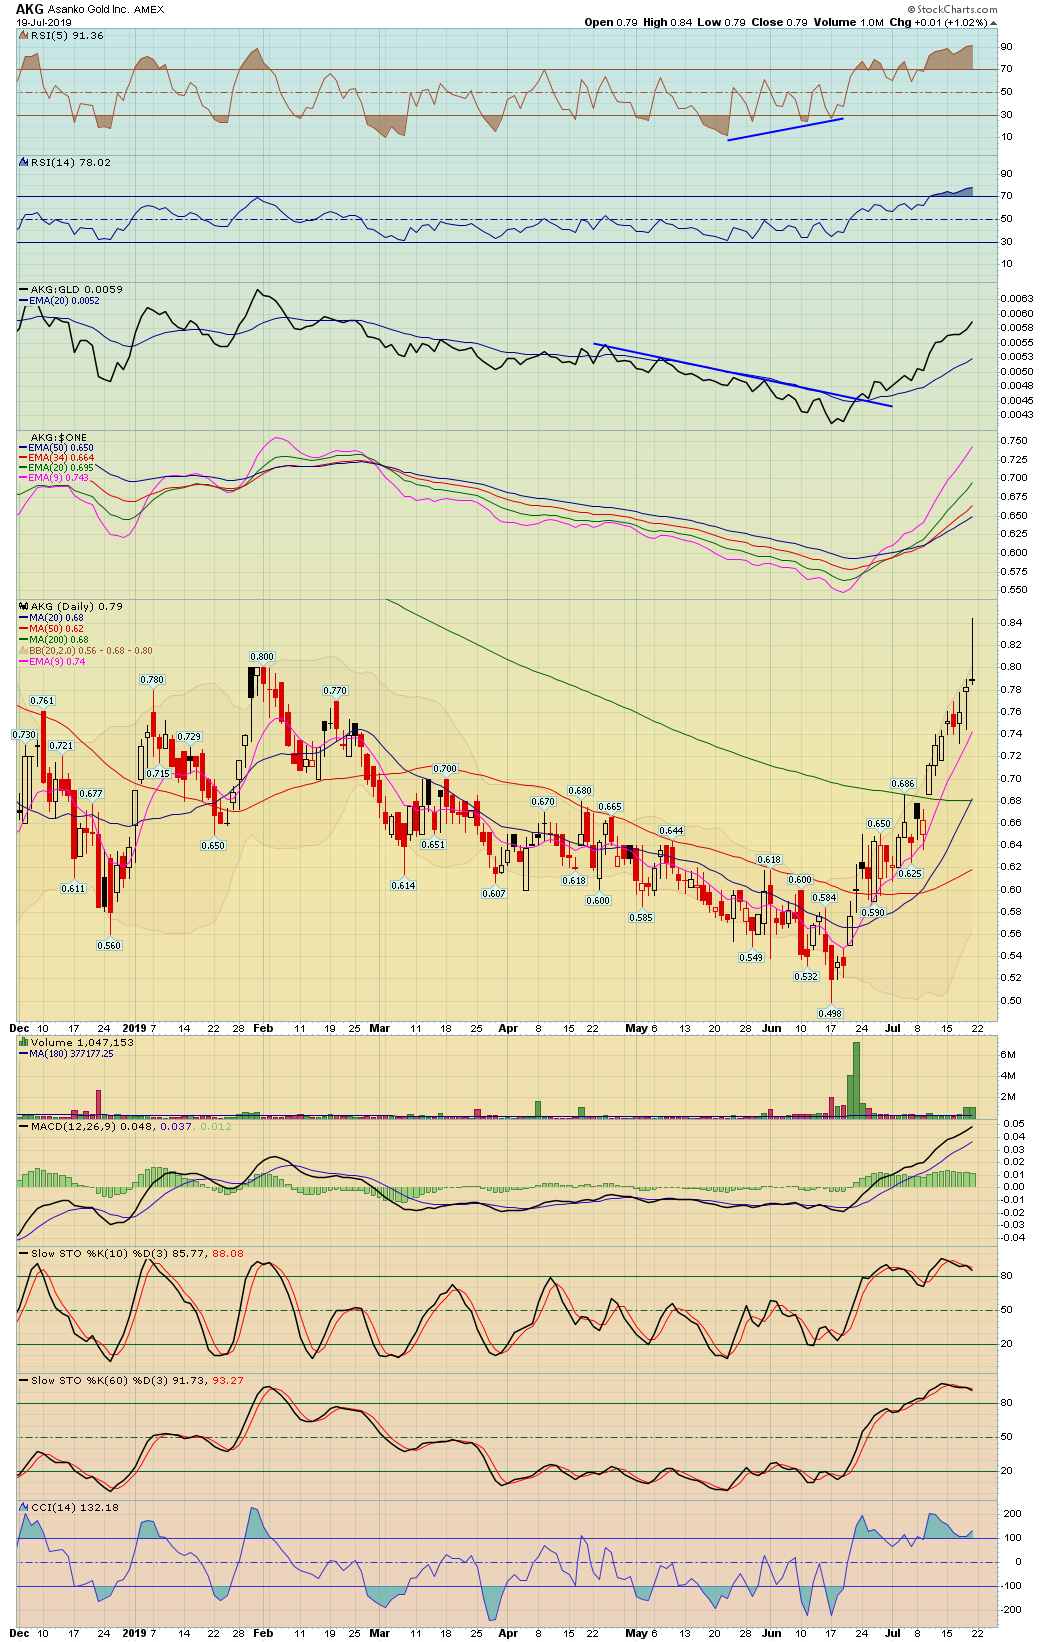
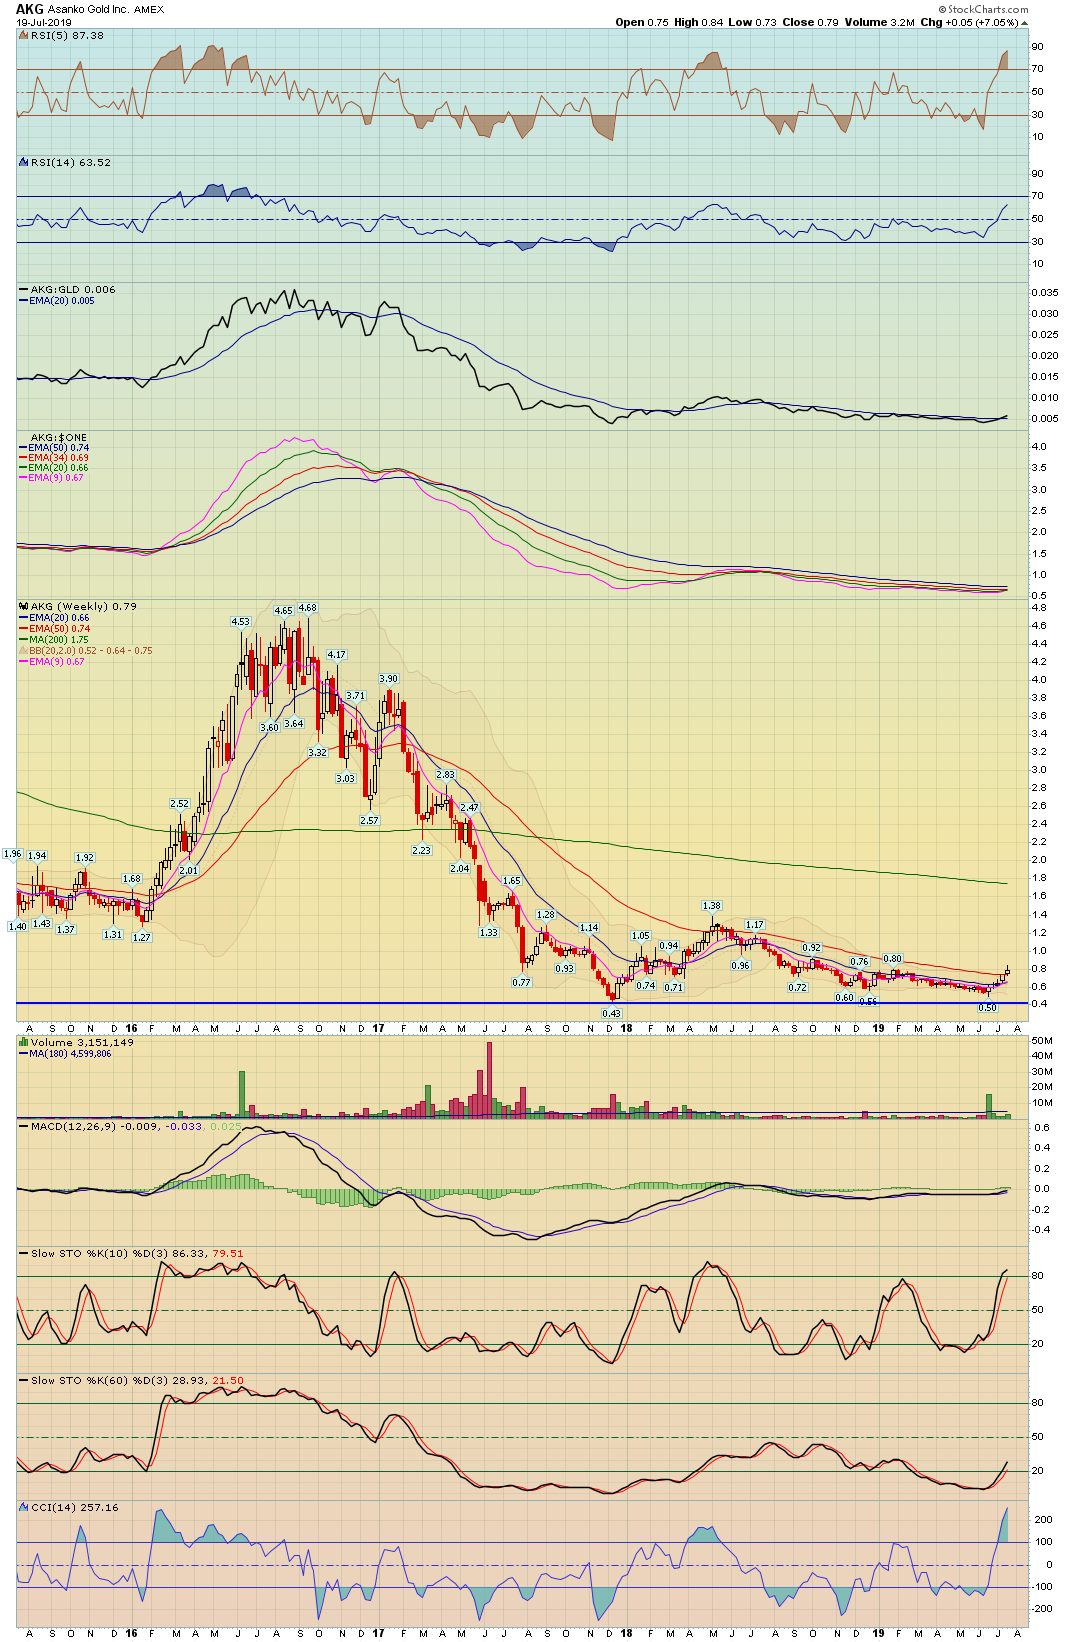
6. US Dollar, Precious Metals, GDX/GDXJ, SIL/SILJ, various indicators and stocks. Weeks ago I said the gold precious area represented a swing trade opportunity and since that time this area has had a significant move higher.
2
3
4
5
6
7
8
| Major Indexes | Index Symbol | ETF Symbol | % G / L Day | % G / L Week | Close |
|---|---|---|---|---|---|
| Dow Jones | INDU - W | DIA - W | -0.25% | -0.65% | 27,154.20 |
| S&P 500 | SPX - W | SPY - W | -0.62% | -1.23% | 2,976.61 |
| Wilshire 5000 | WLSH - W | -0.59% | -1.22% | 30,607.58 | |
| Nasdaq | COMPQ - W | -0.74% | -1.18% | 8,146.49 | |
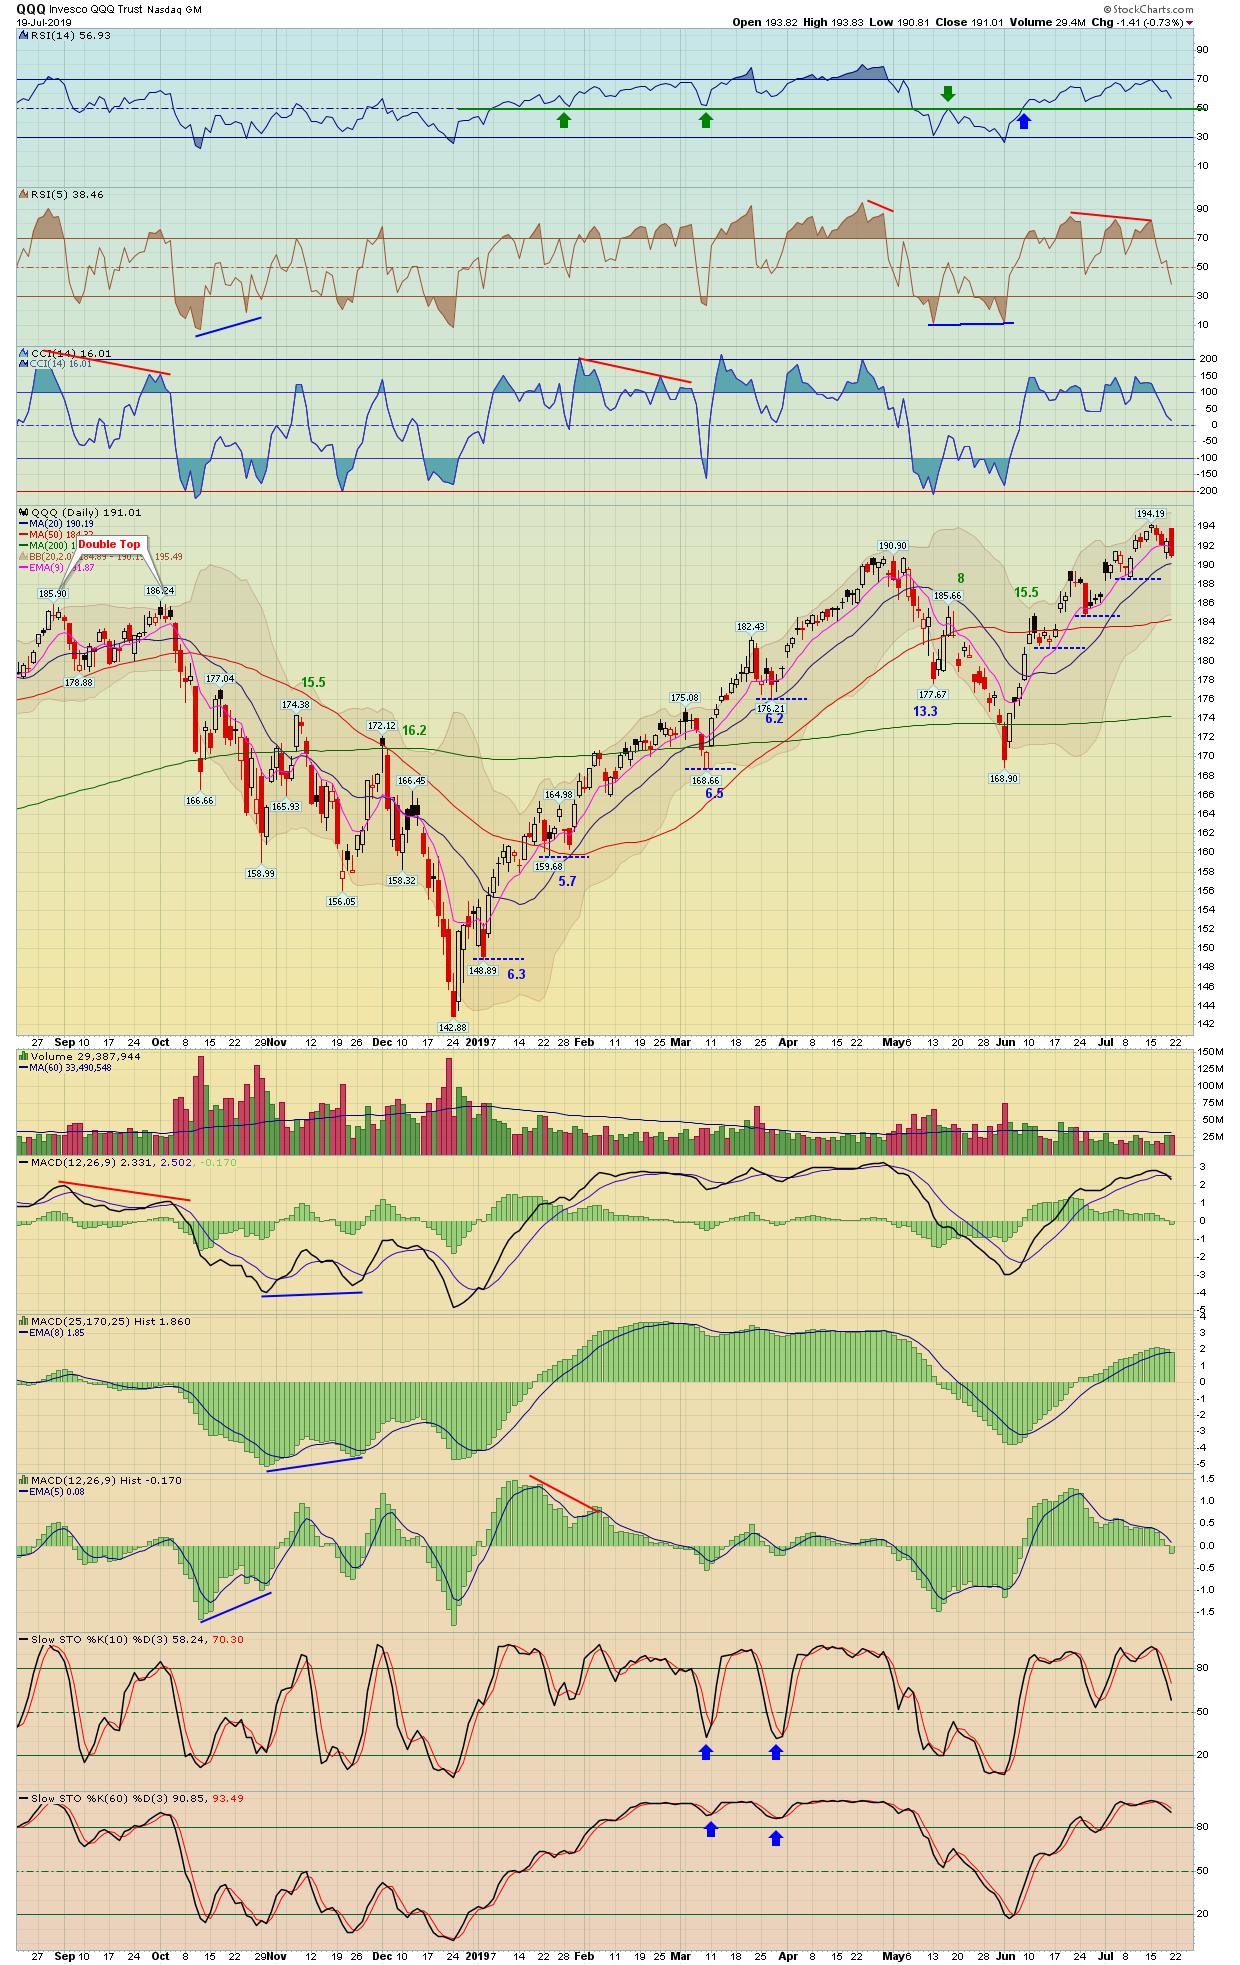
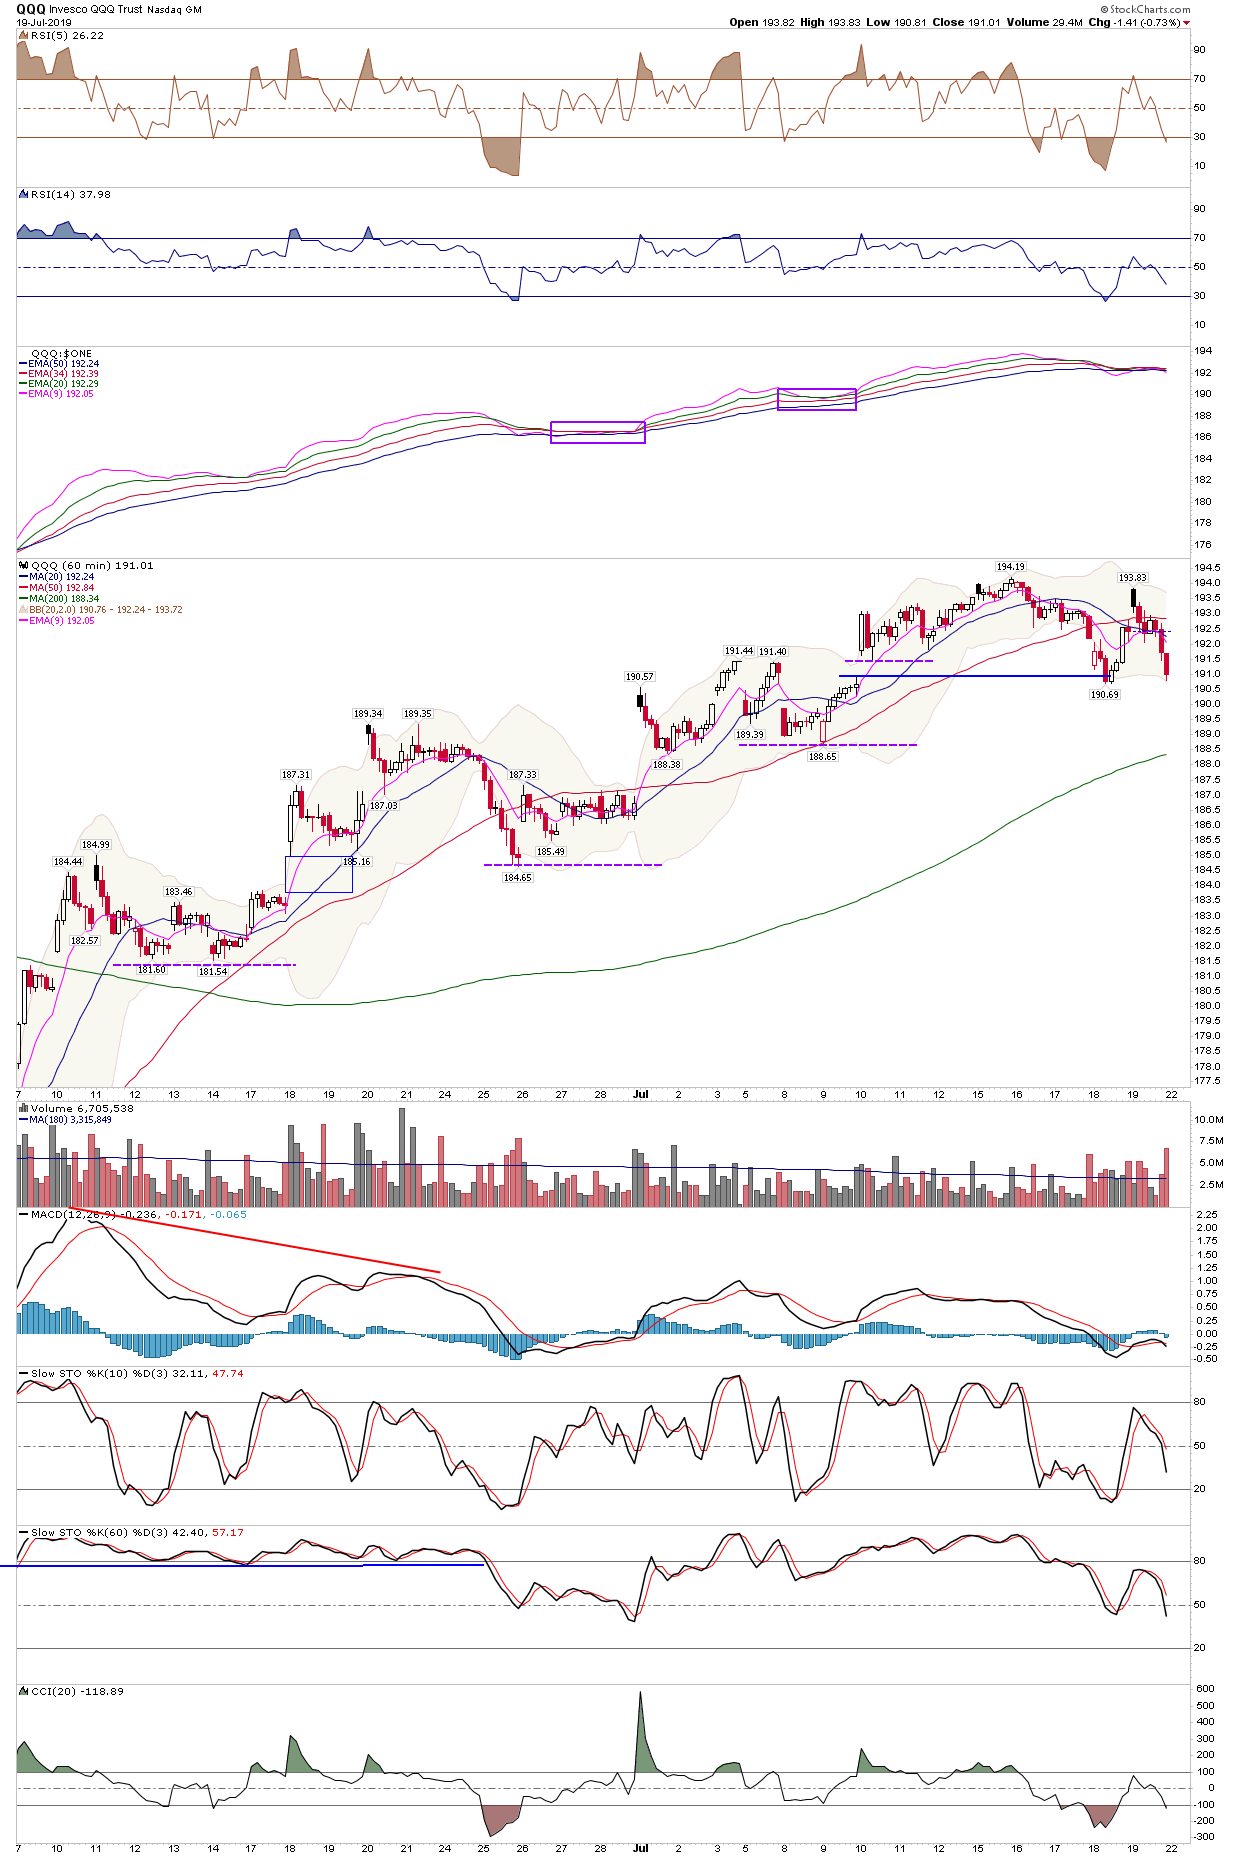
| NDX 100 | NDX - W | QQQ - W | -0.88% | -1.36% | 7,834.90 |
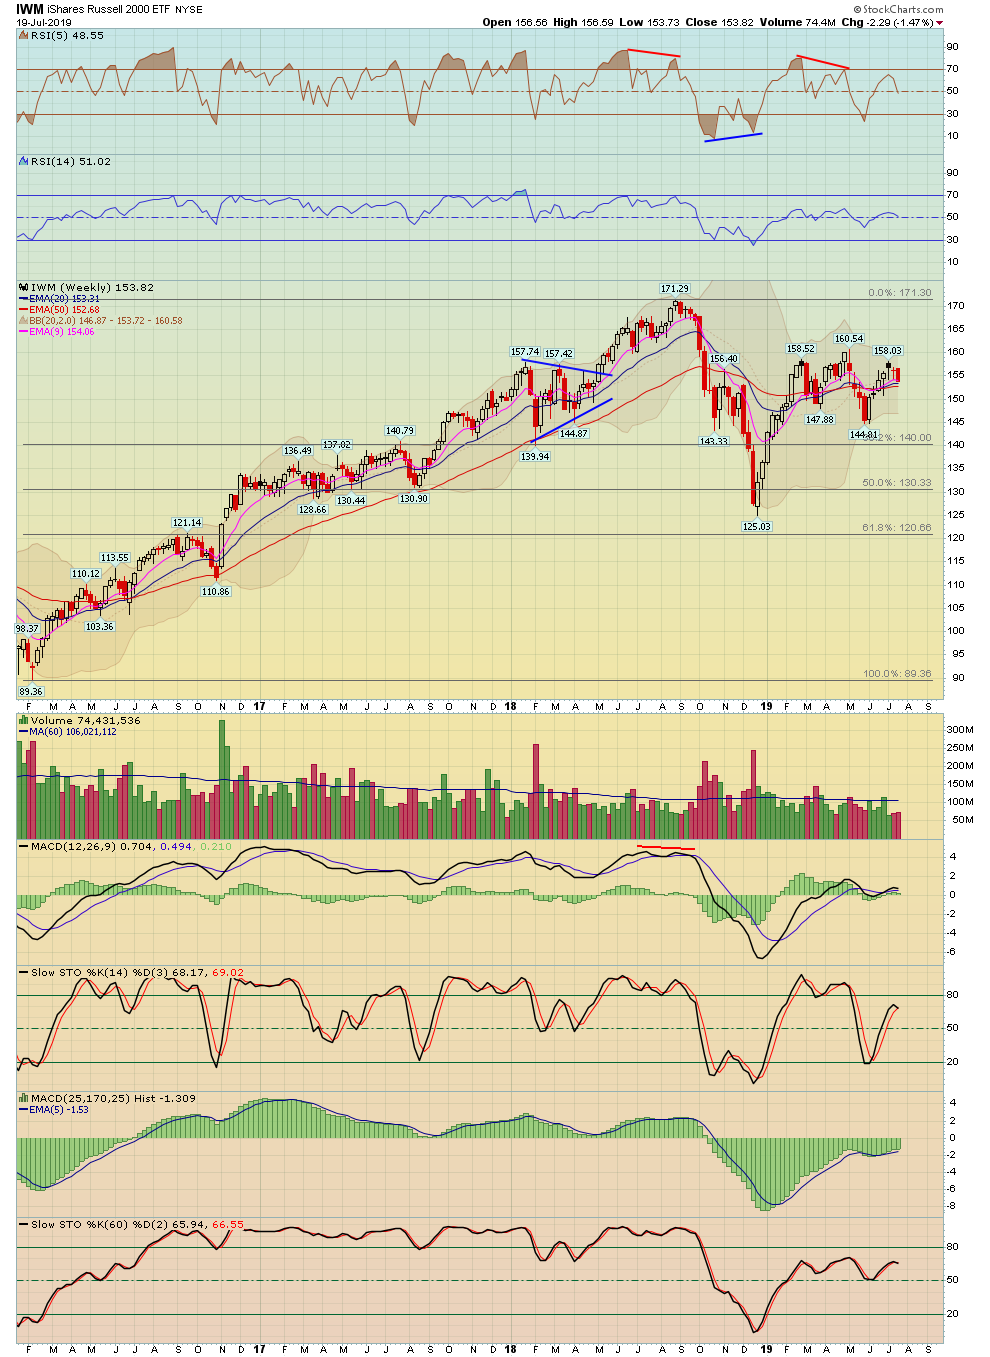
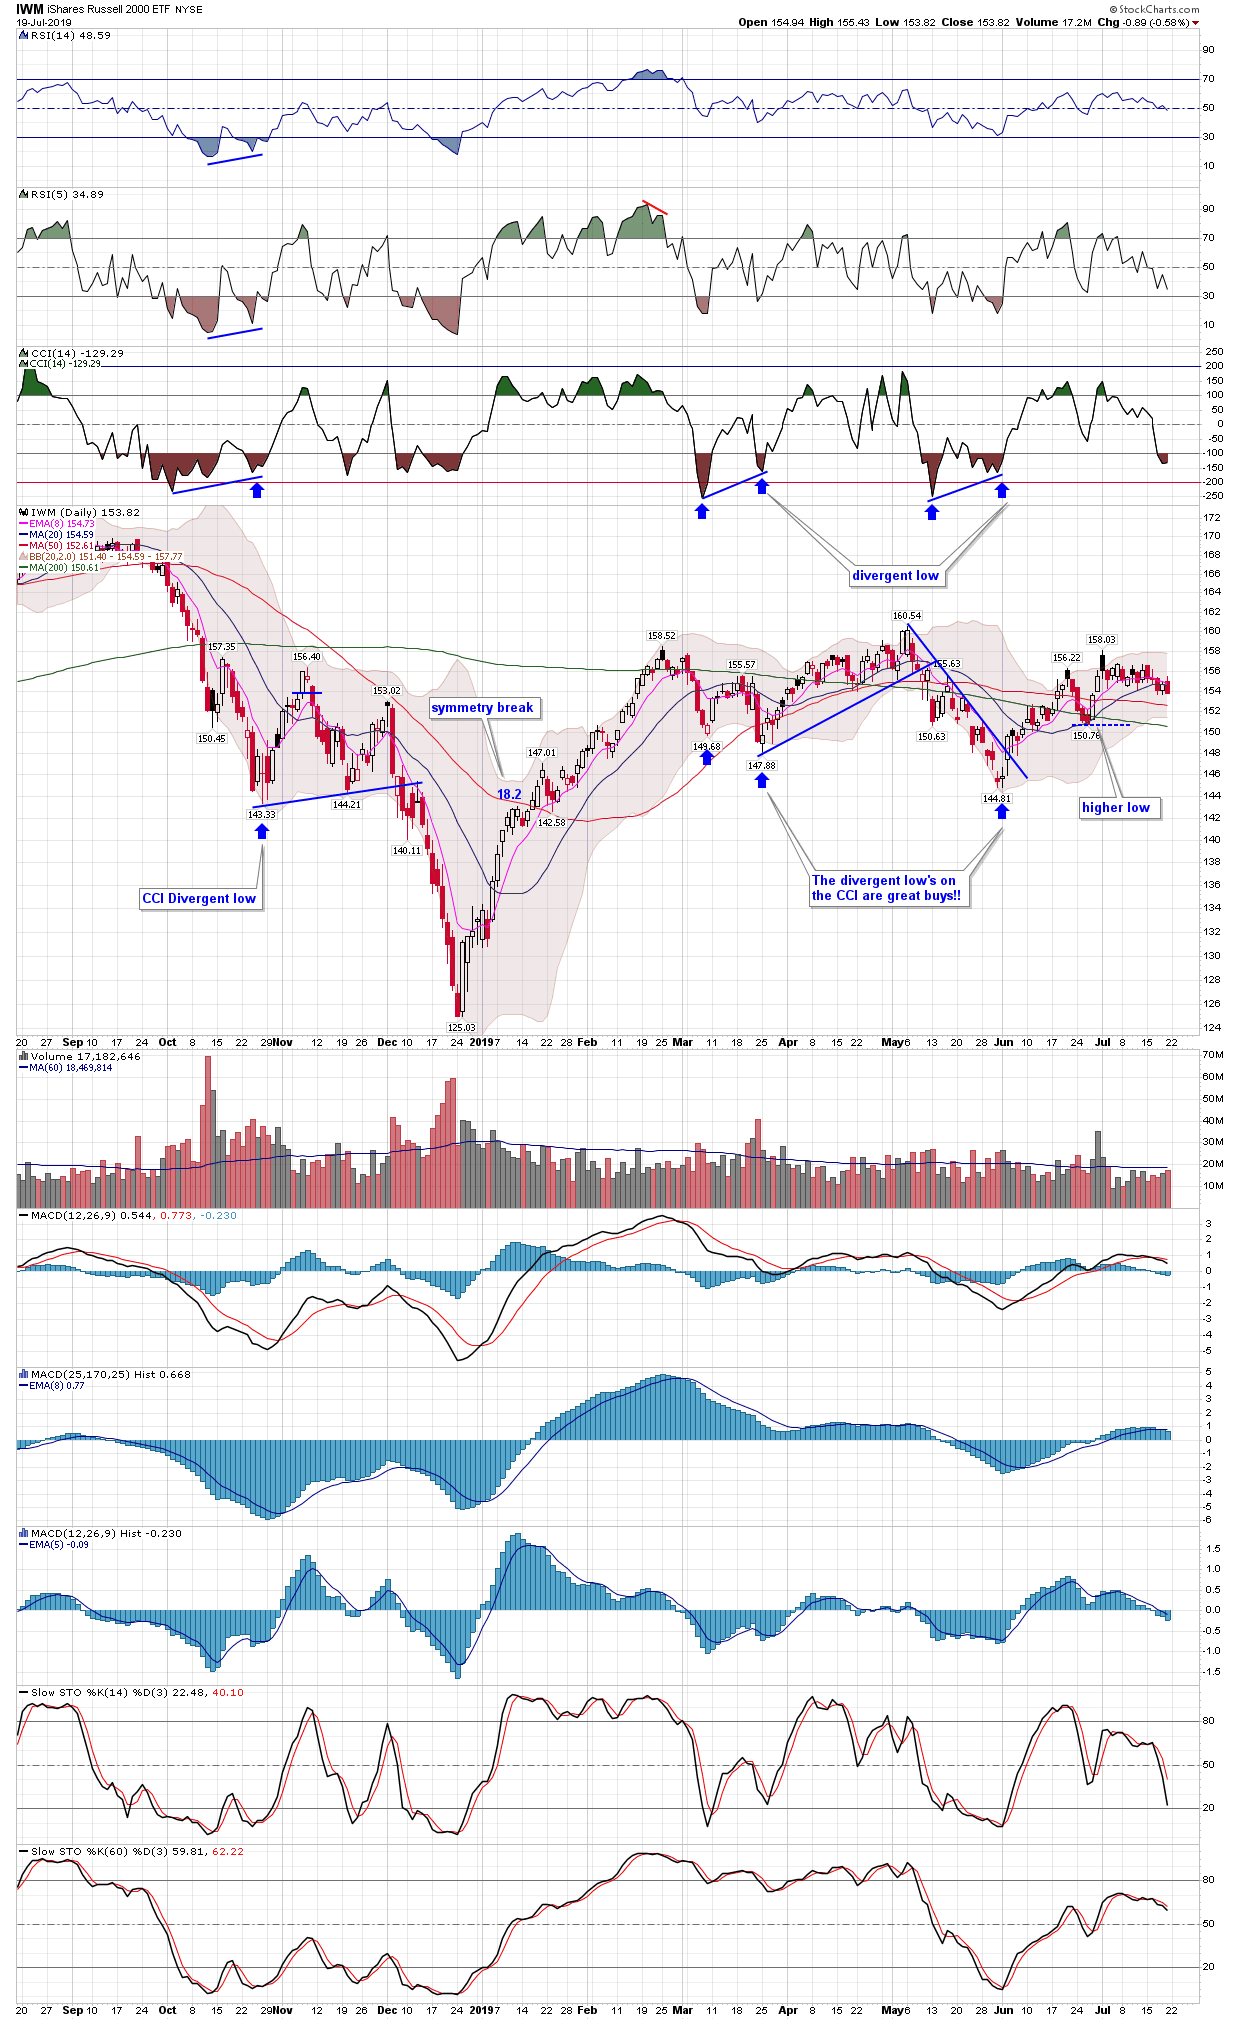
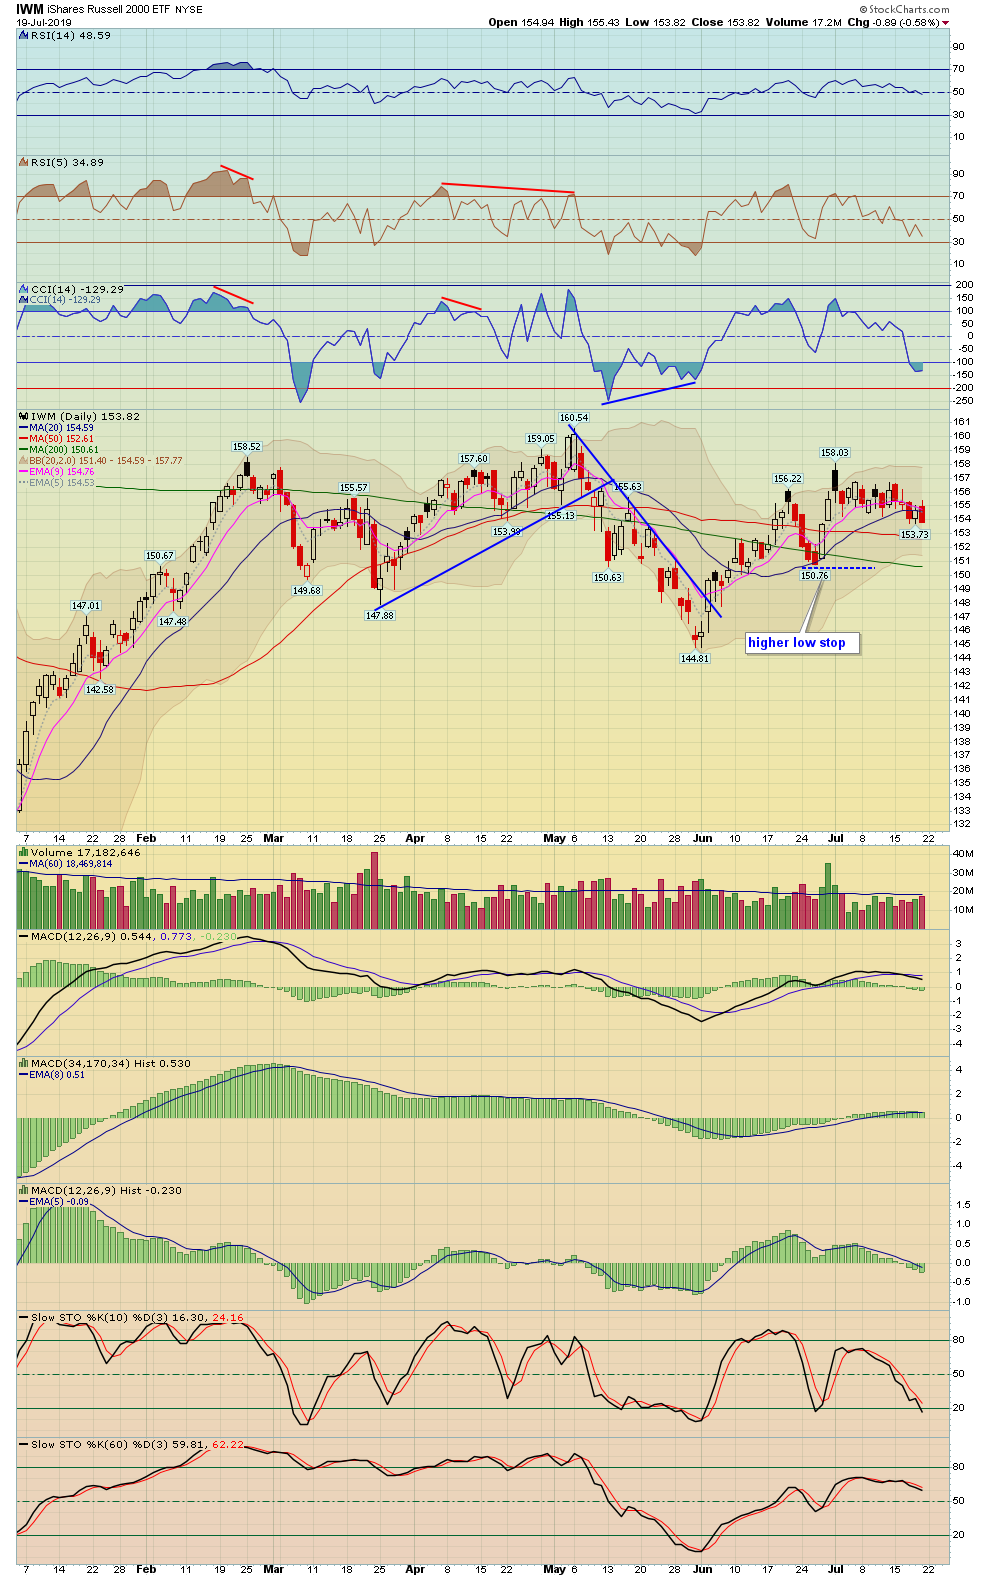
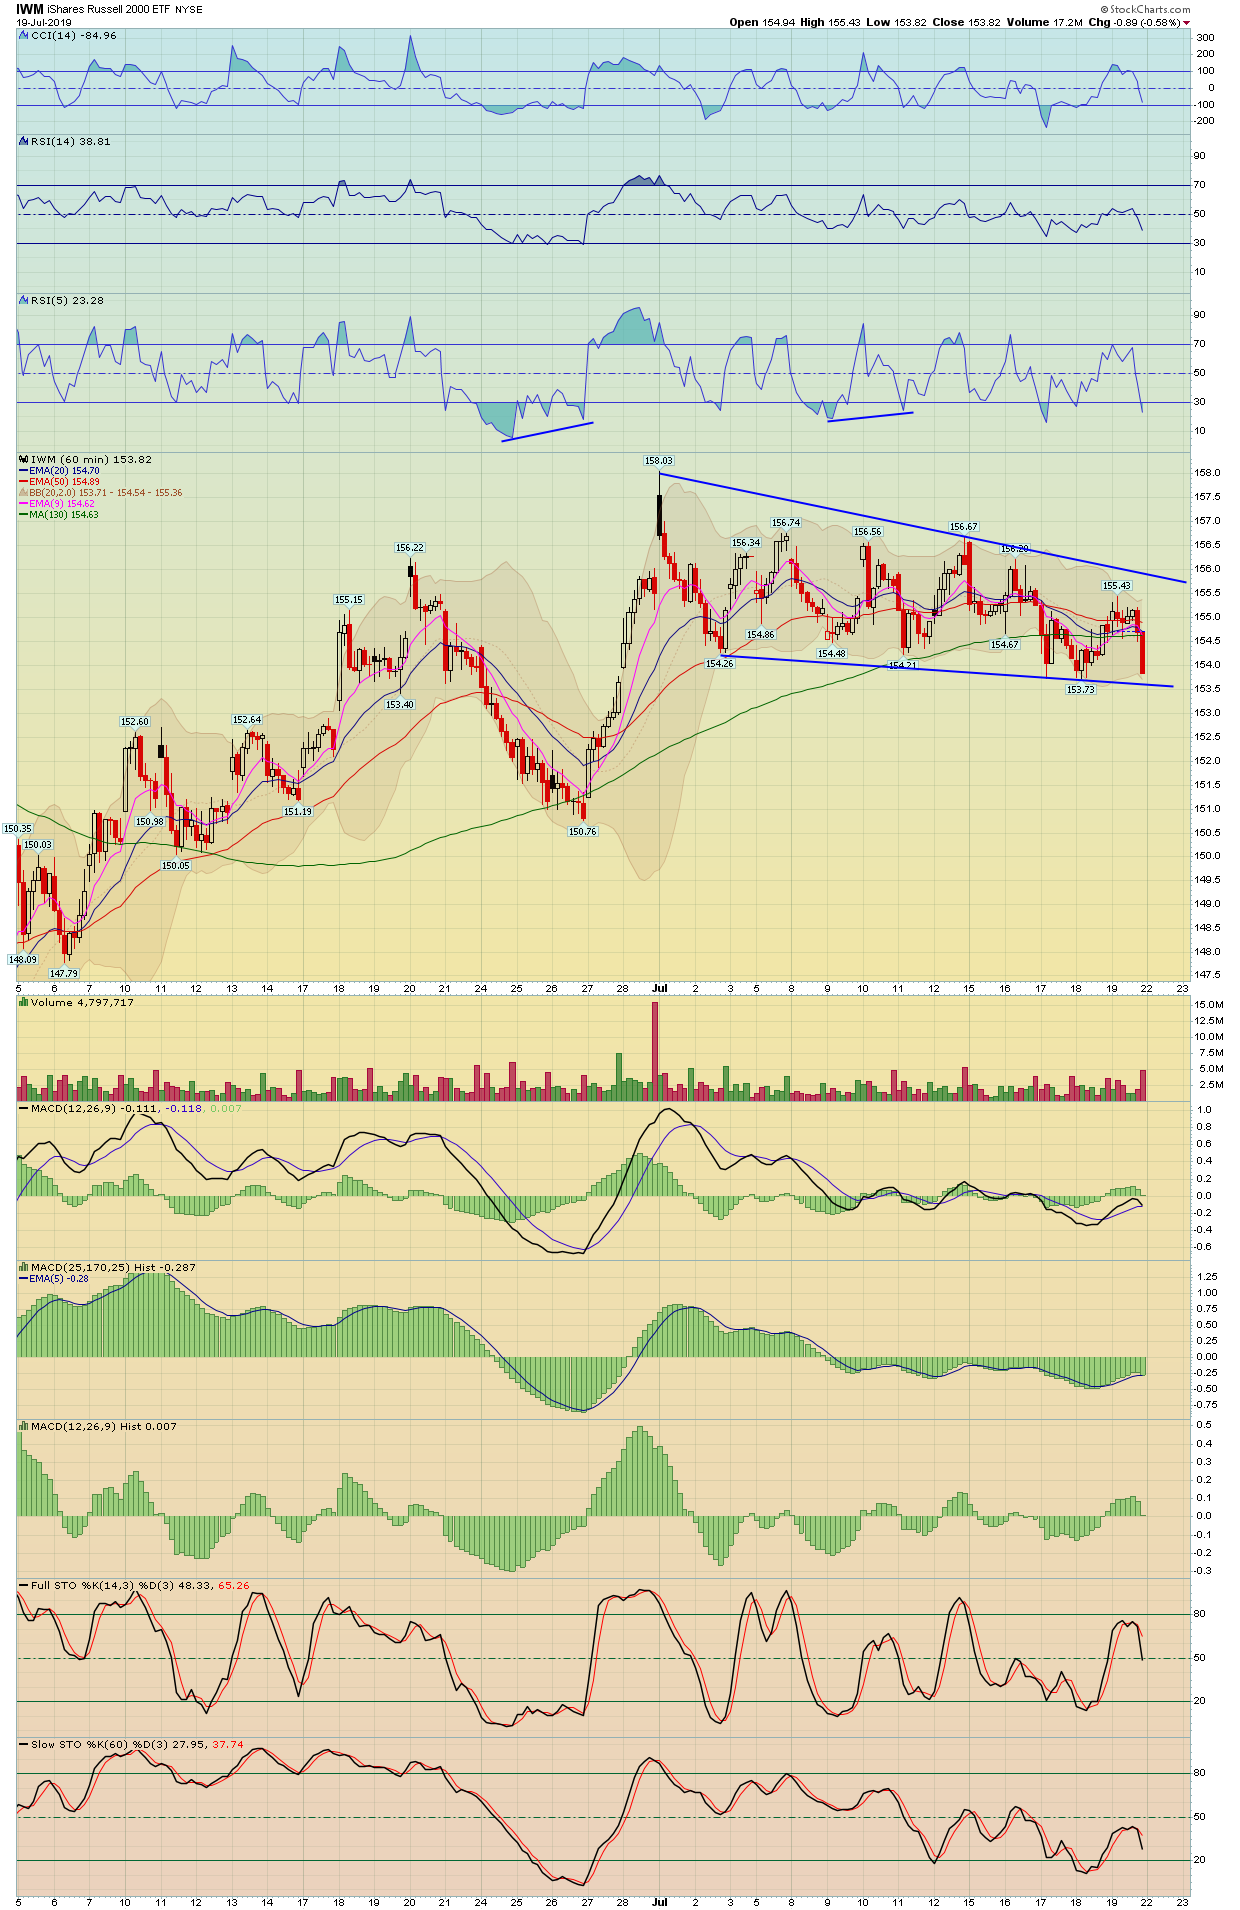
| Russel 2000 (Small Caps) | RUT - W | IWM - W | -0.50% | -1.41% | 1,547.90 |
| Market Sectors | Index Symbol | ETF Symbol | % G / L Day | % G / L Week | Close |
|---|---|---|---|---|---|
| Transports | TRAN - W | IYT - W | 0.63% | -0.31% | 10,604.20 |
| Banks | BKX - W | 0.65% | -0.33% | 99.15 | |
| Financials | XLF - W | -0.43% | -1.34% | 27.94 | |
| Brokers | XBD - W | 0.23% | 0.42% | 272.95 | |
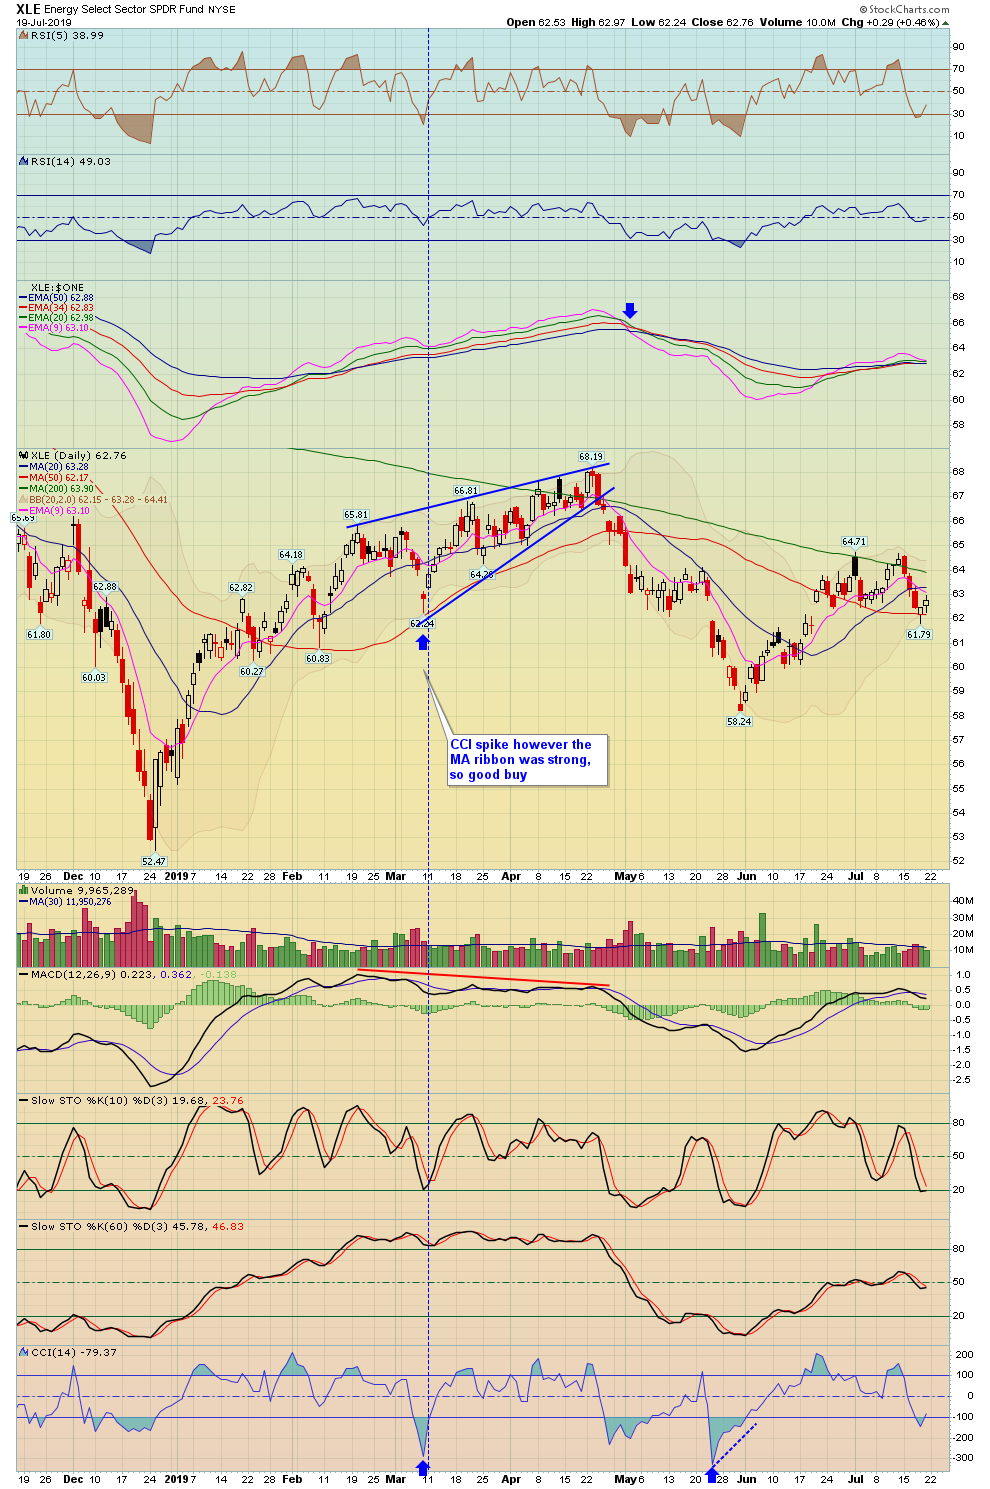
| XLE (Energy Select) | XLE - W | 0.46% | -2.61% | 62.76 | |
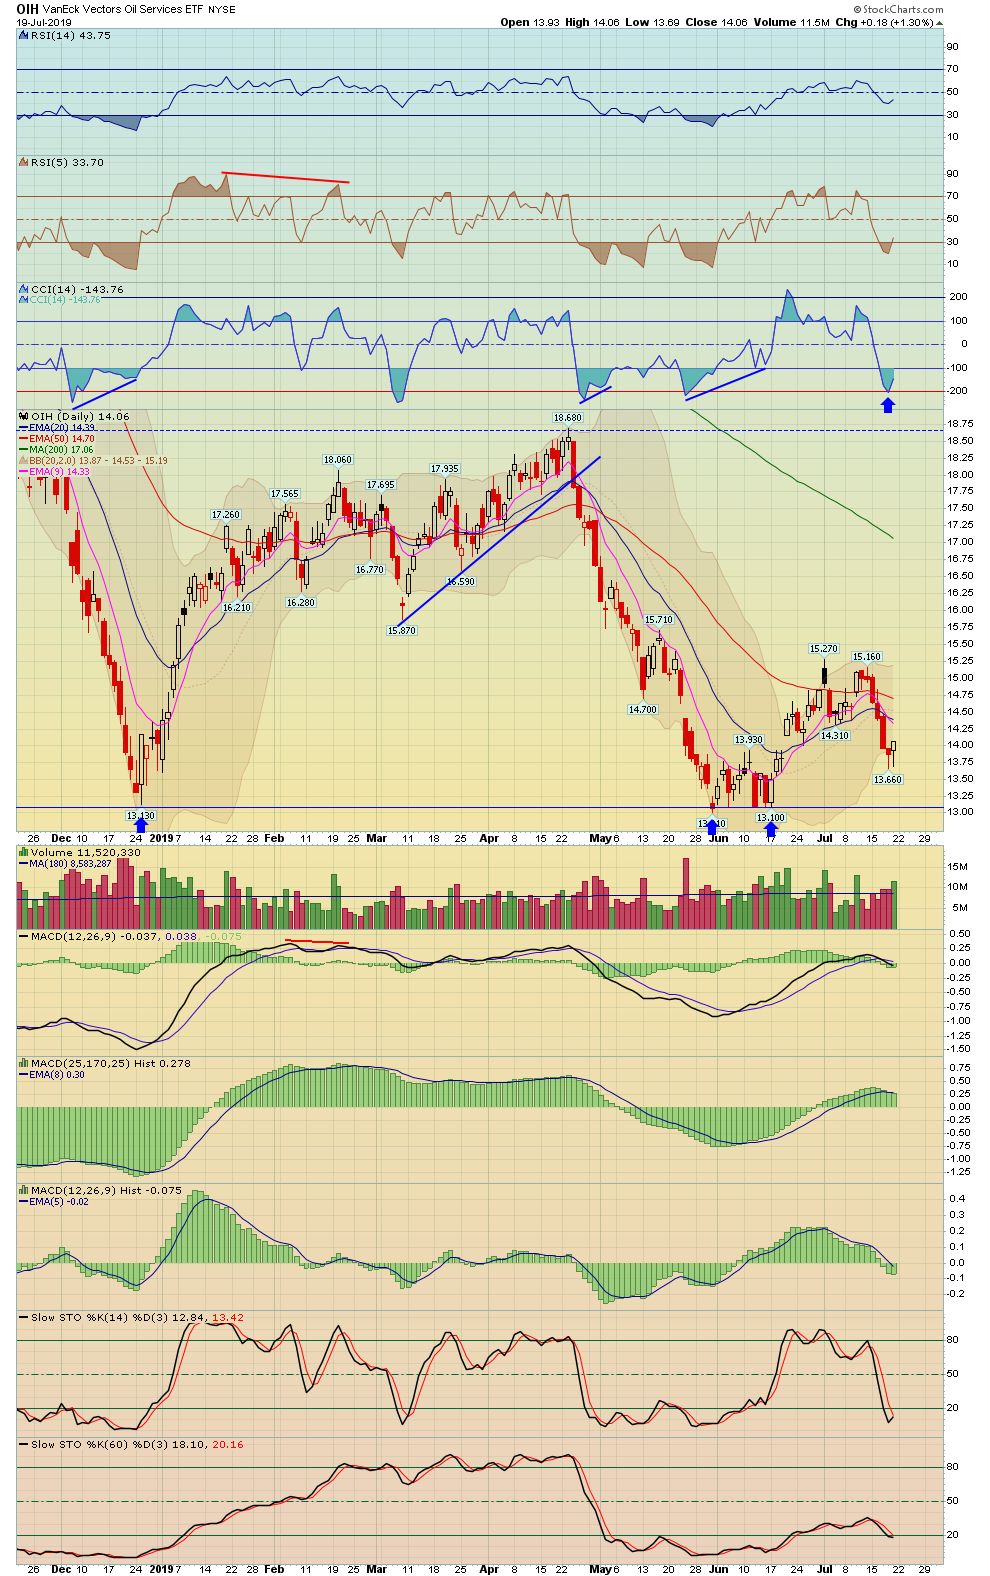
| Oil Service Holders | OIH - W | 1.30% | -6.14% | 14.06 | |
| Technology | XLK - W | -0.43% | -0.55% | 80.69 | |
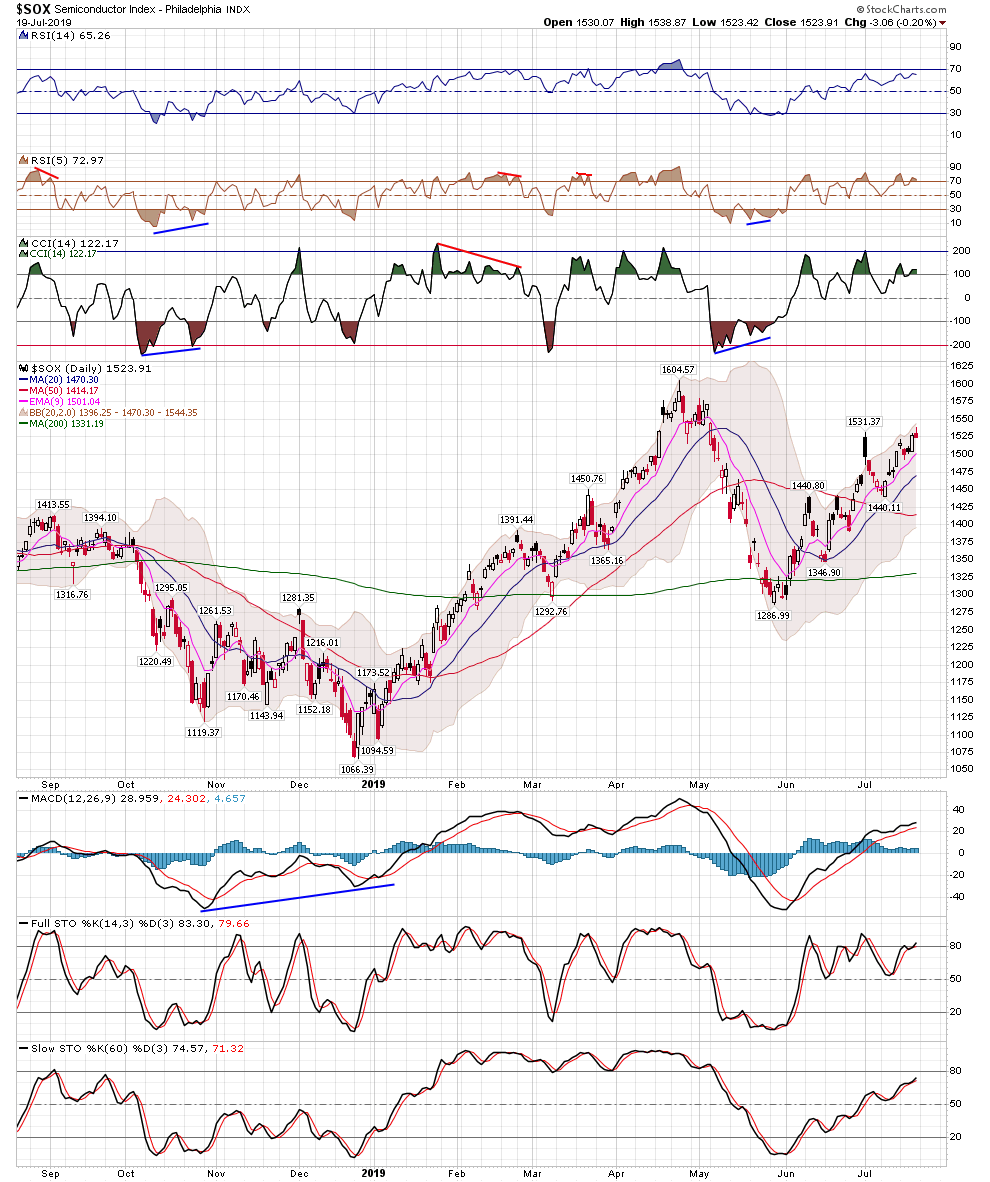
| Semiconductor | SOX - W | SMH - W | -0.20% | 1.30% | 1,523.91 |
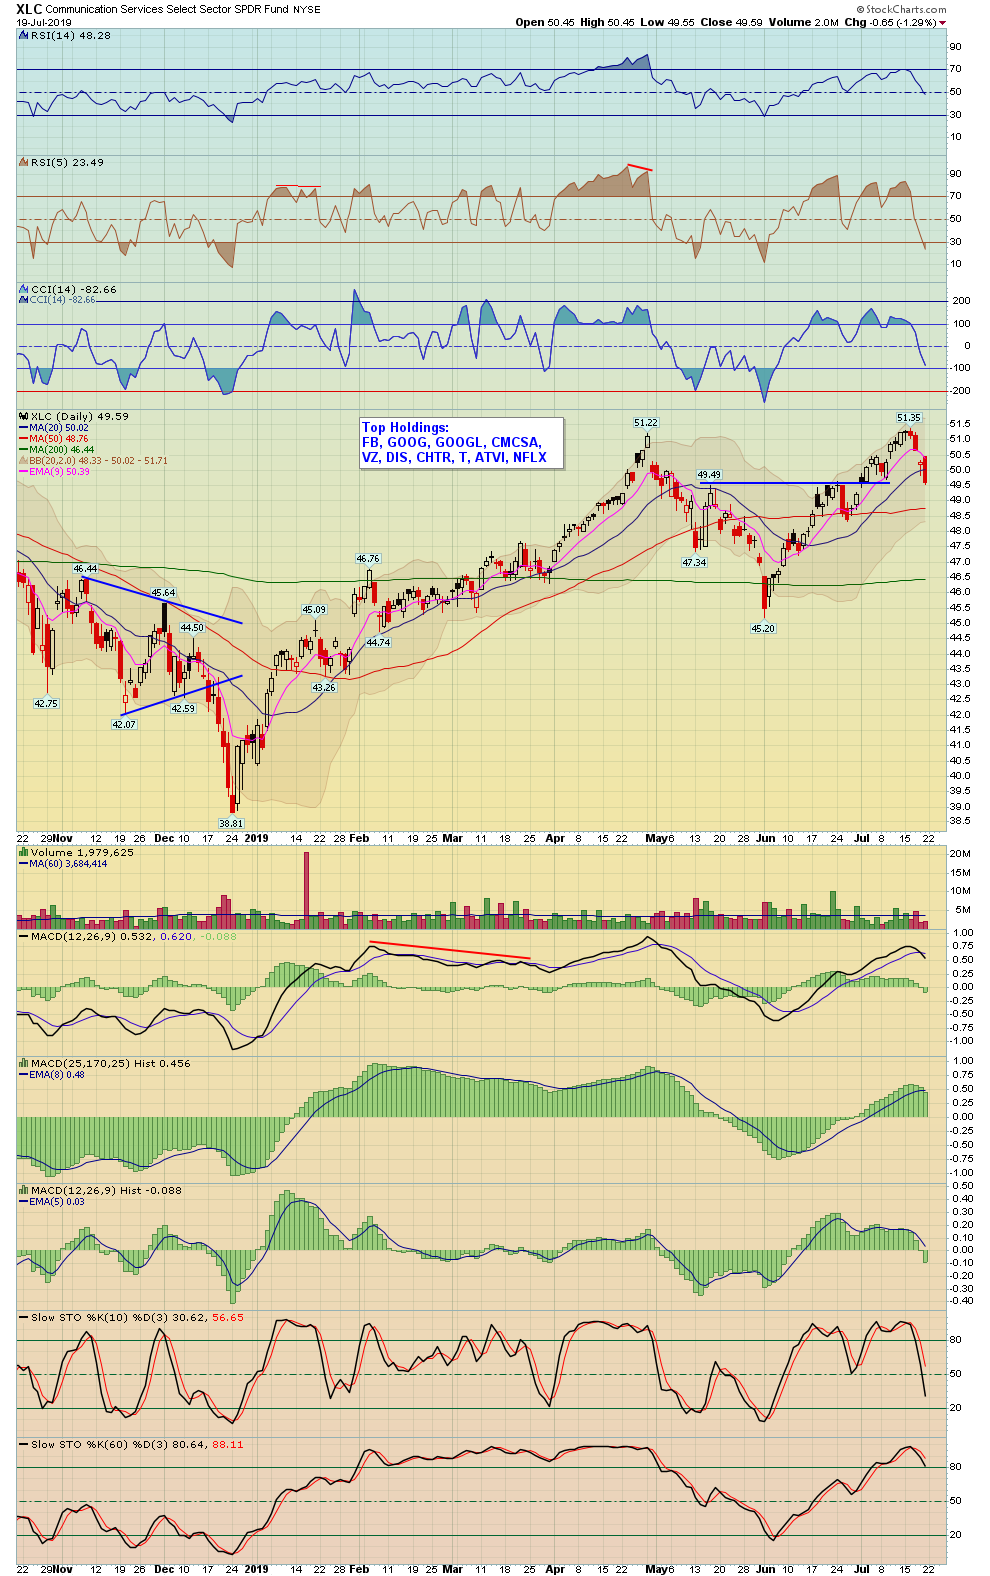
| Communication Services | XLC - W | -1.29% | -3.22% | 49.59 | |
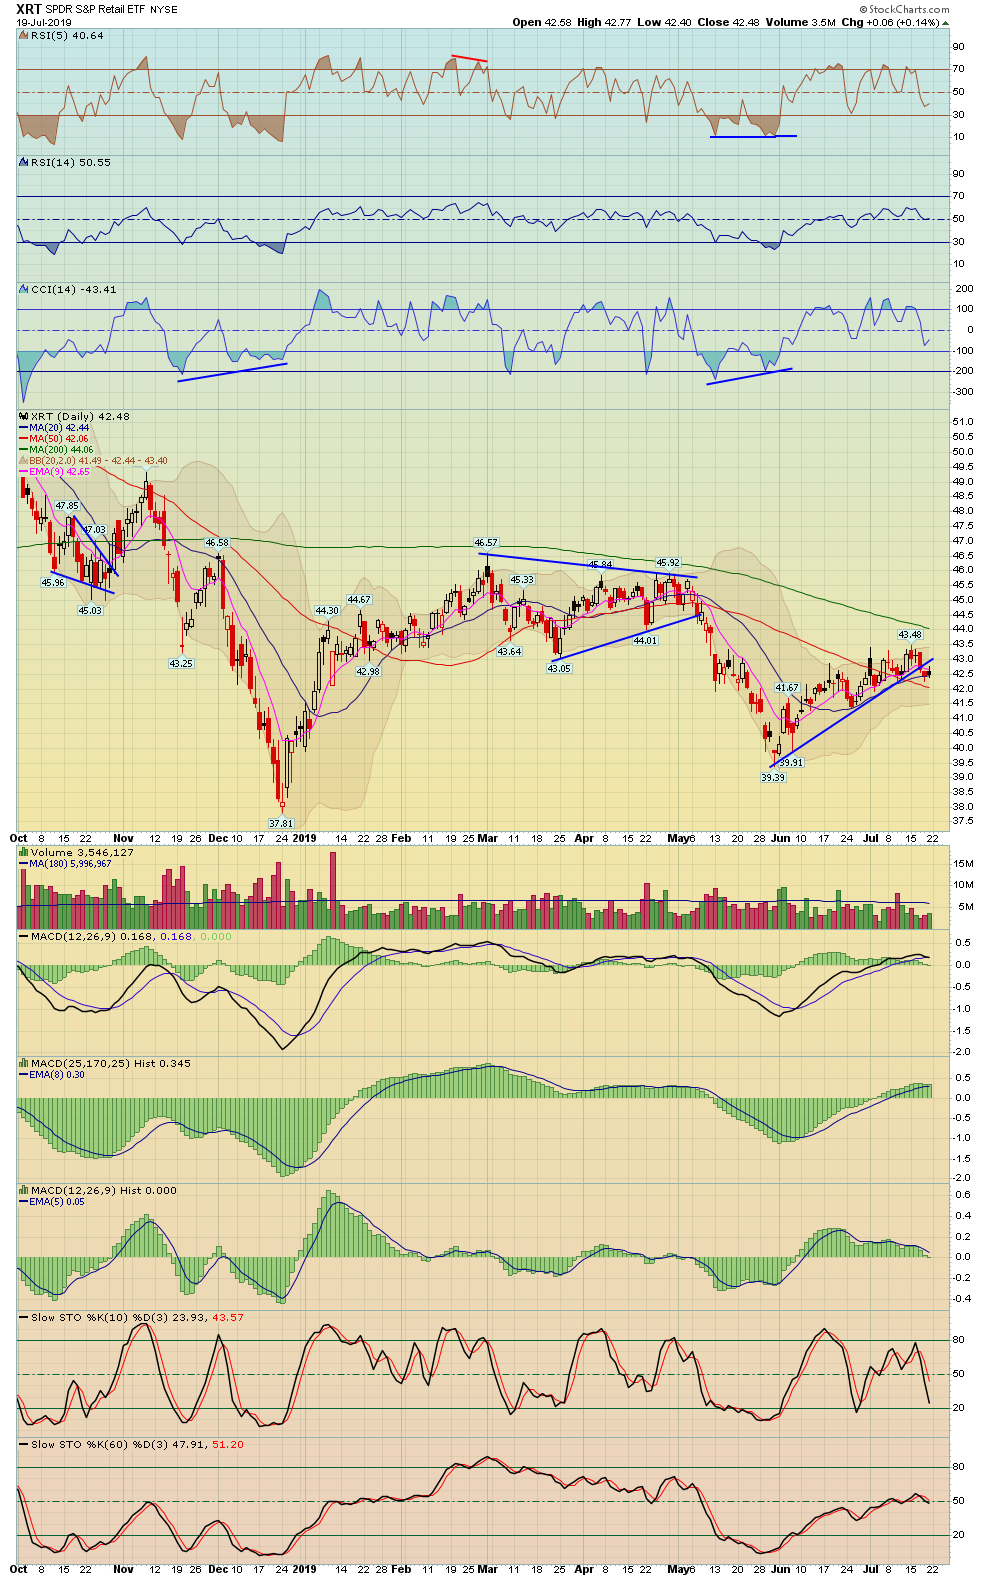
| Retail | XRT - W | 0.14% | -1.58% | 42.48 | |
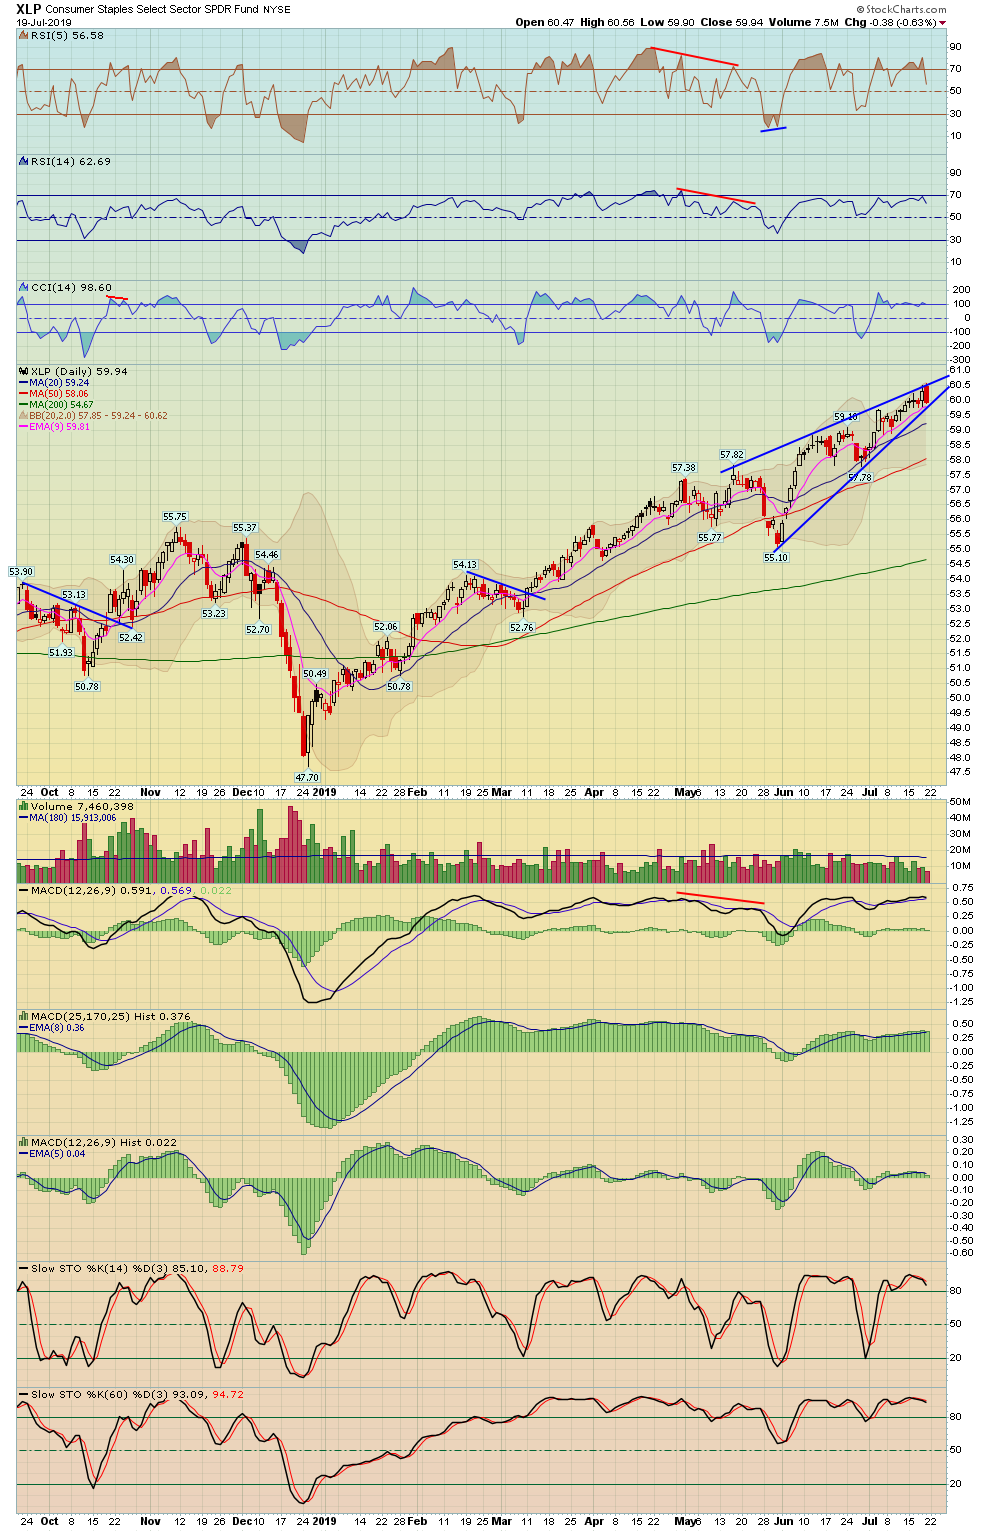
| Consumer Staples | XLP - W | -0.63% | 0.18% | 59.94 | |
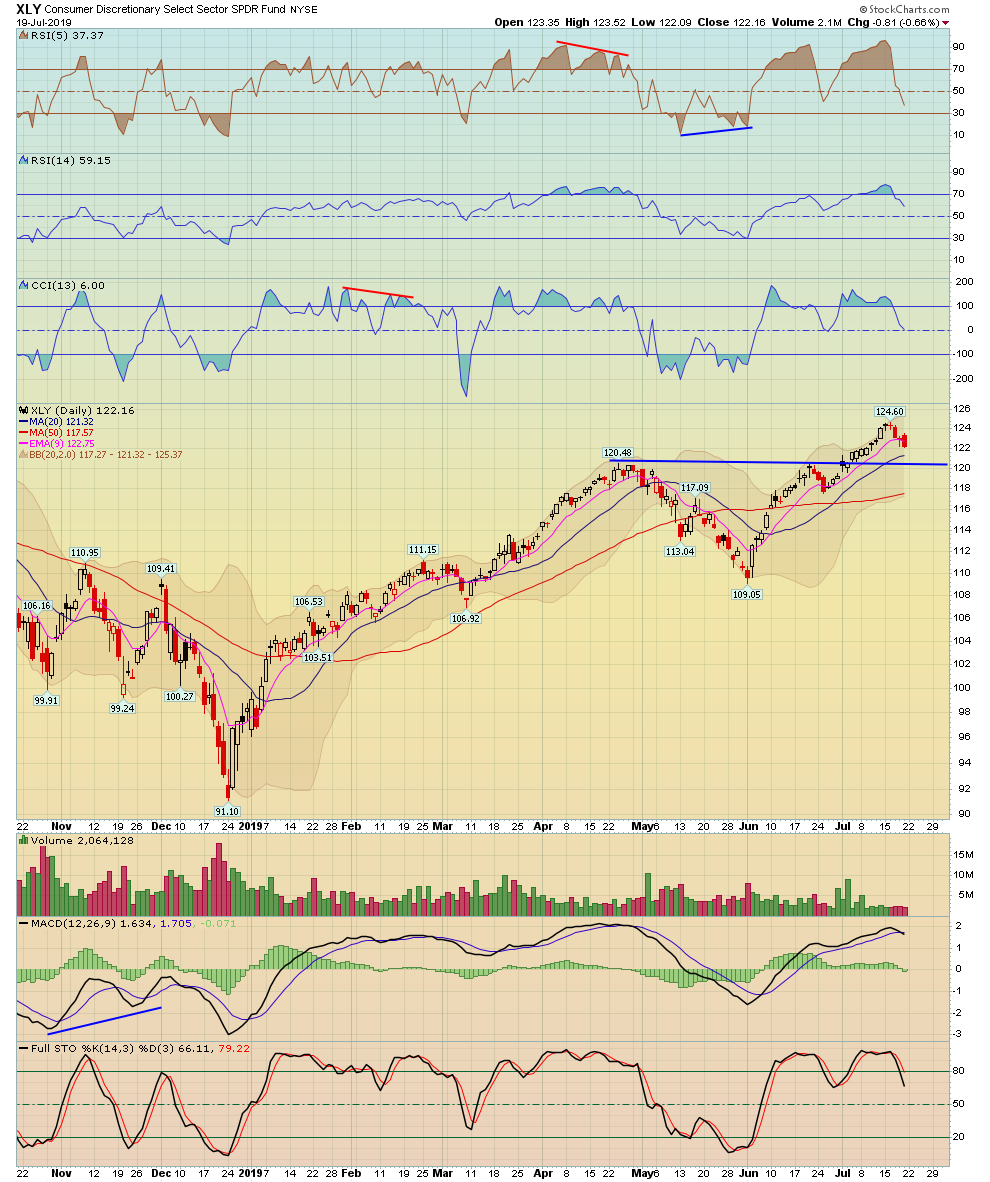
| Consumer Discretionary | XLY - W | -0.66% | -1.55% | 122.16 | |
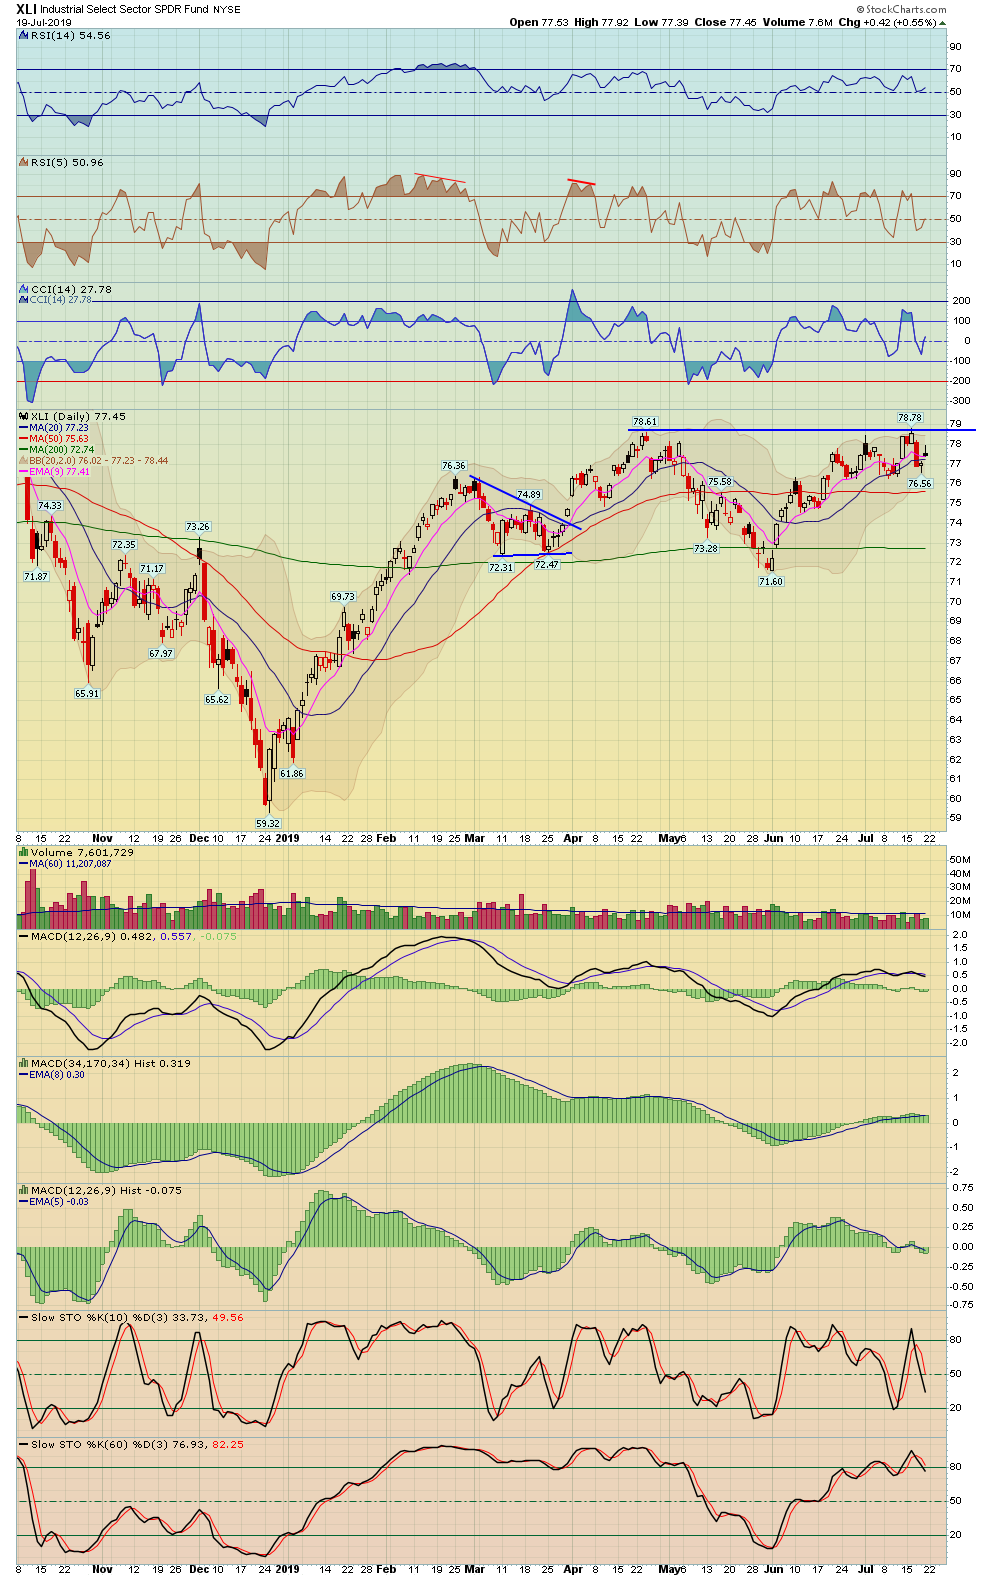
| Industrials | XLI - W | 0.55% | -1.20% | 77.45 | |
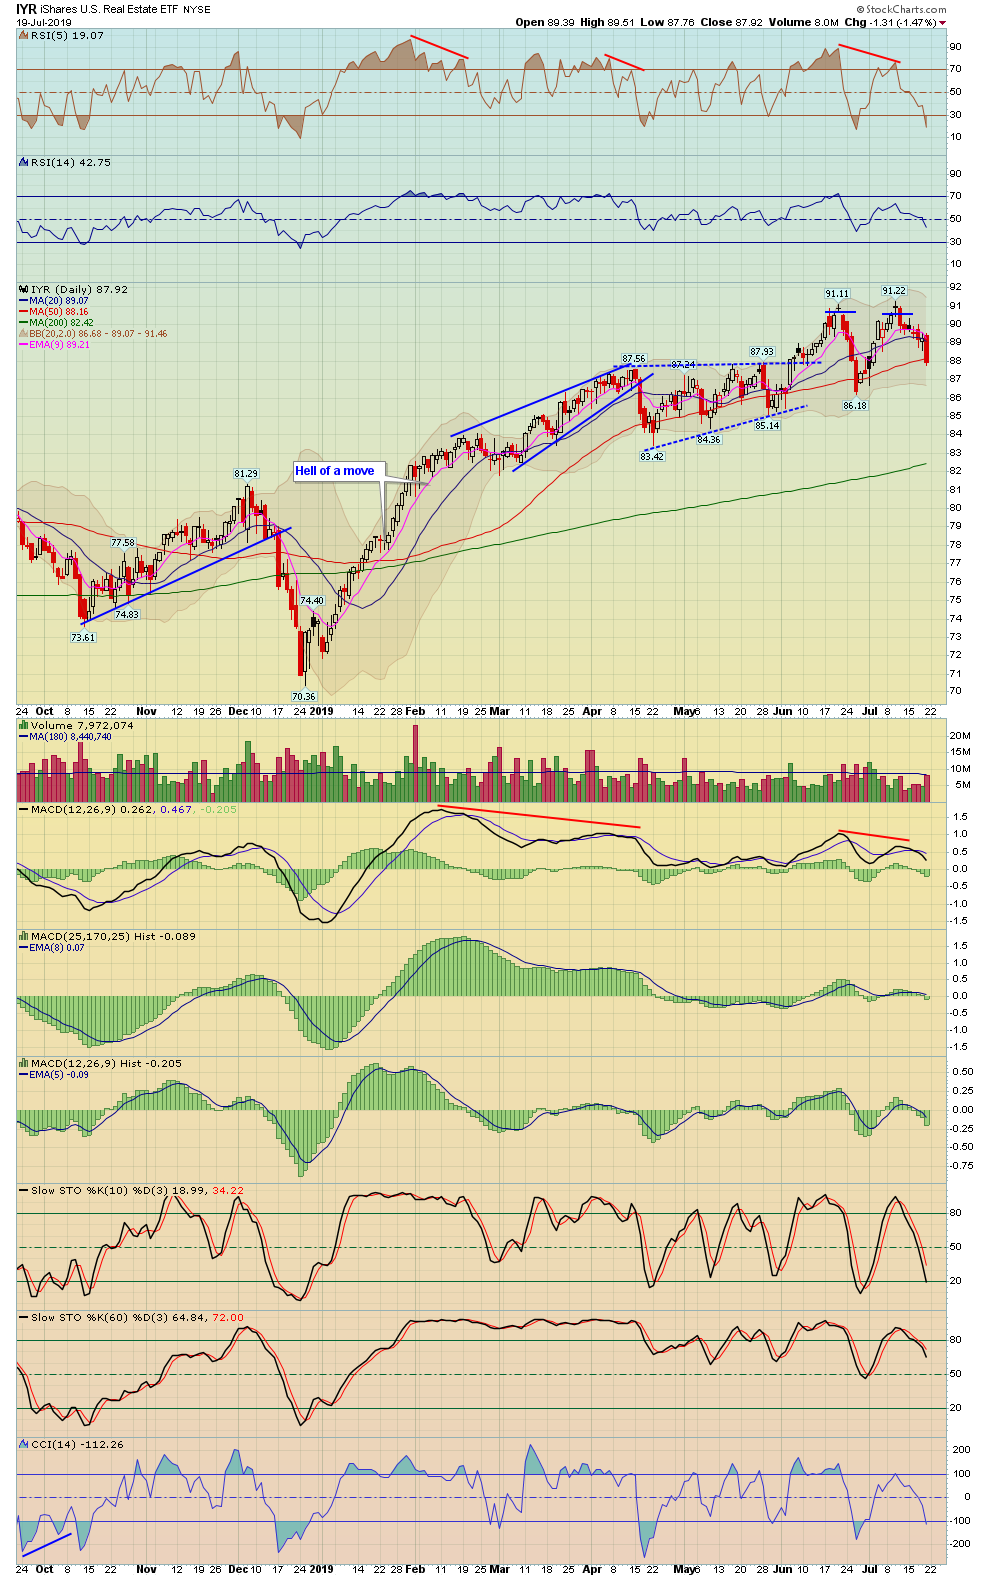
| Real Estate | IYR - W | -1.47% | -2.07% | 87.92 | |
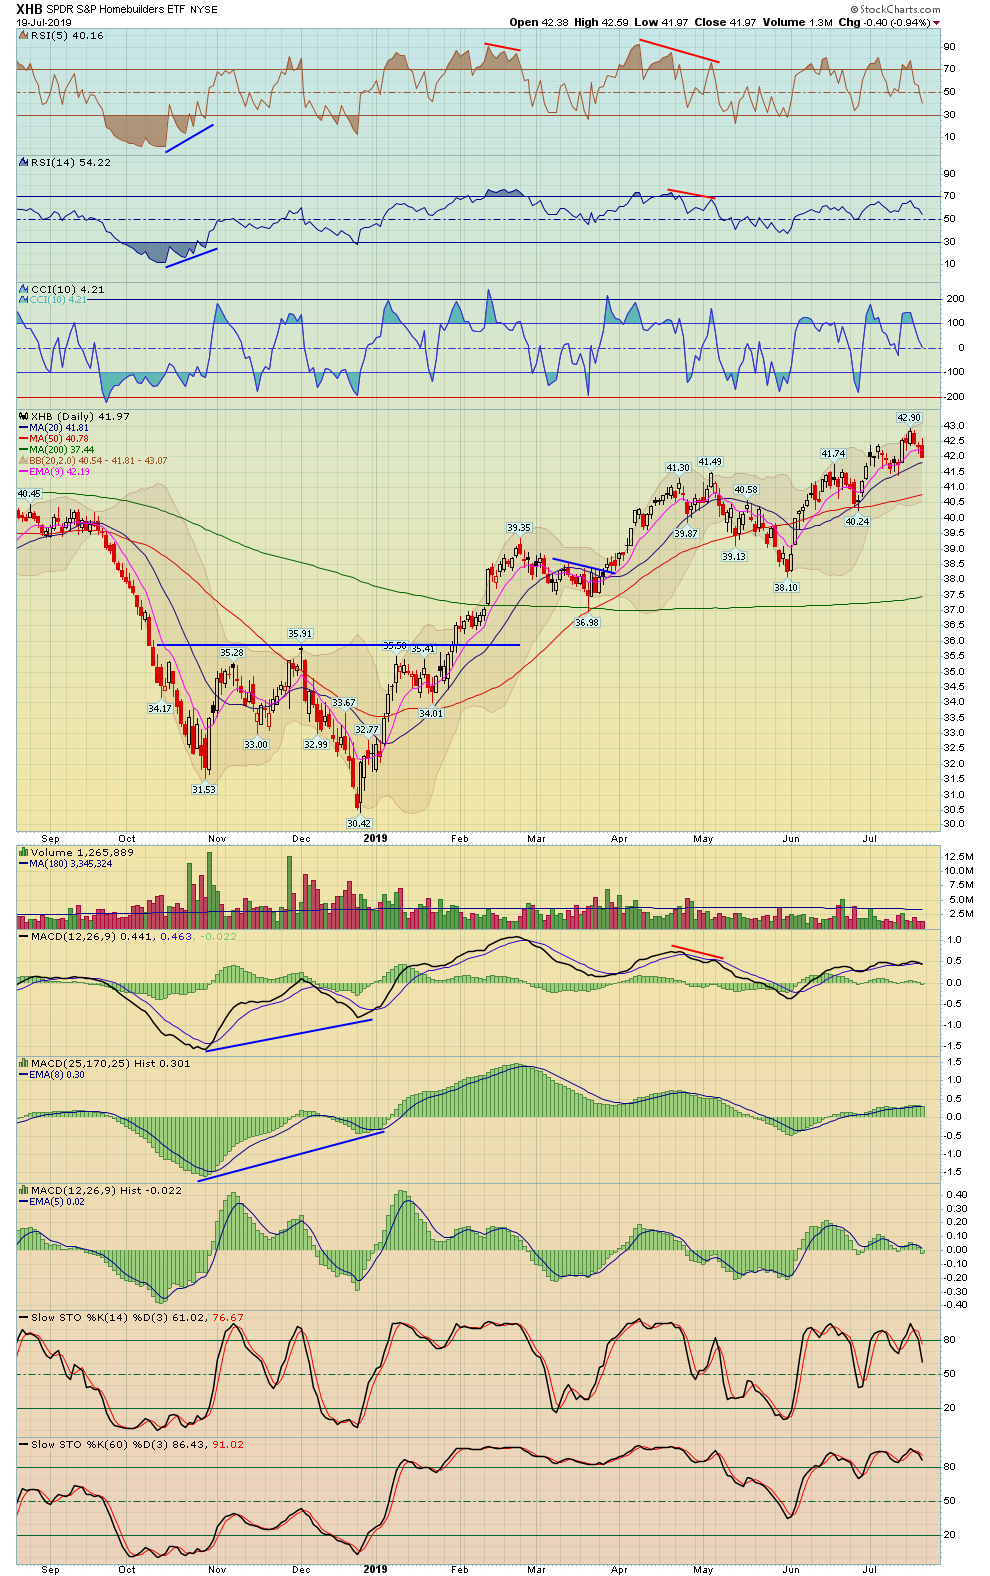
| Homebuilders | HGX - W | XHB - W | -0.56% | -1.46% | 316.77 |
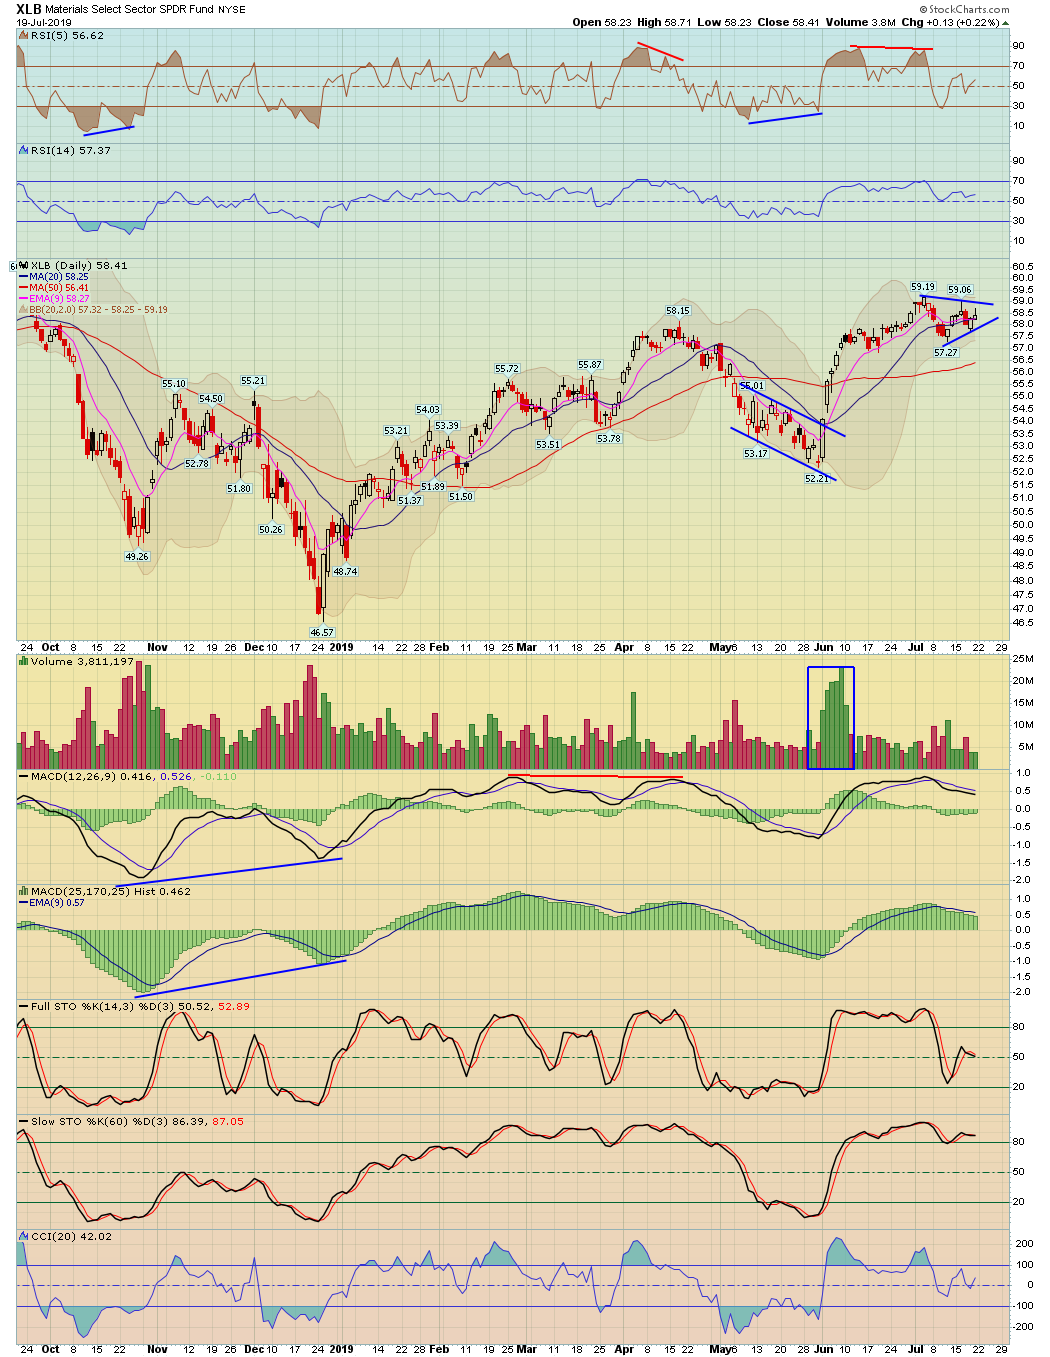
| Materials | XLB - W | 0.22% | 0.07% | 58.41 | |
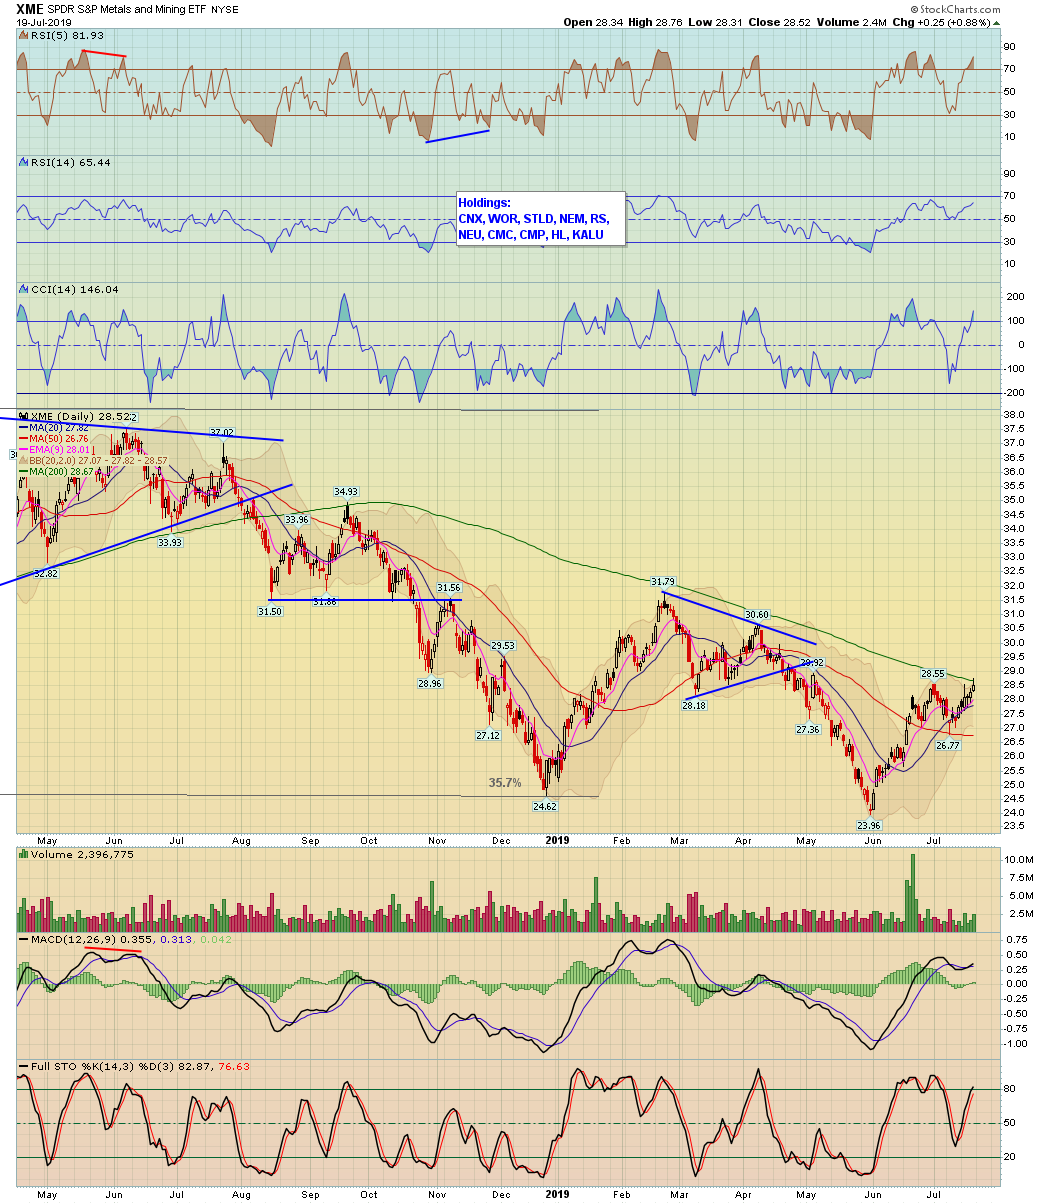
| Metals And Mining | XME - W | 0.88% | 2.85% | 28.52 | |
| GDX Gold Miners ETF | GDX - W | -0.96% | 6.75% | 27.98 | |
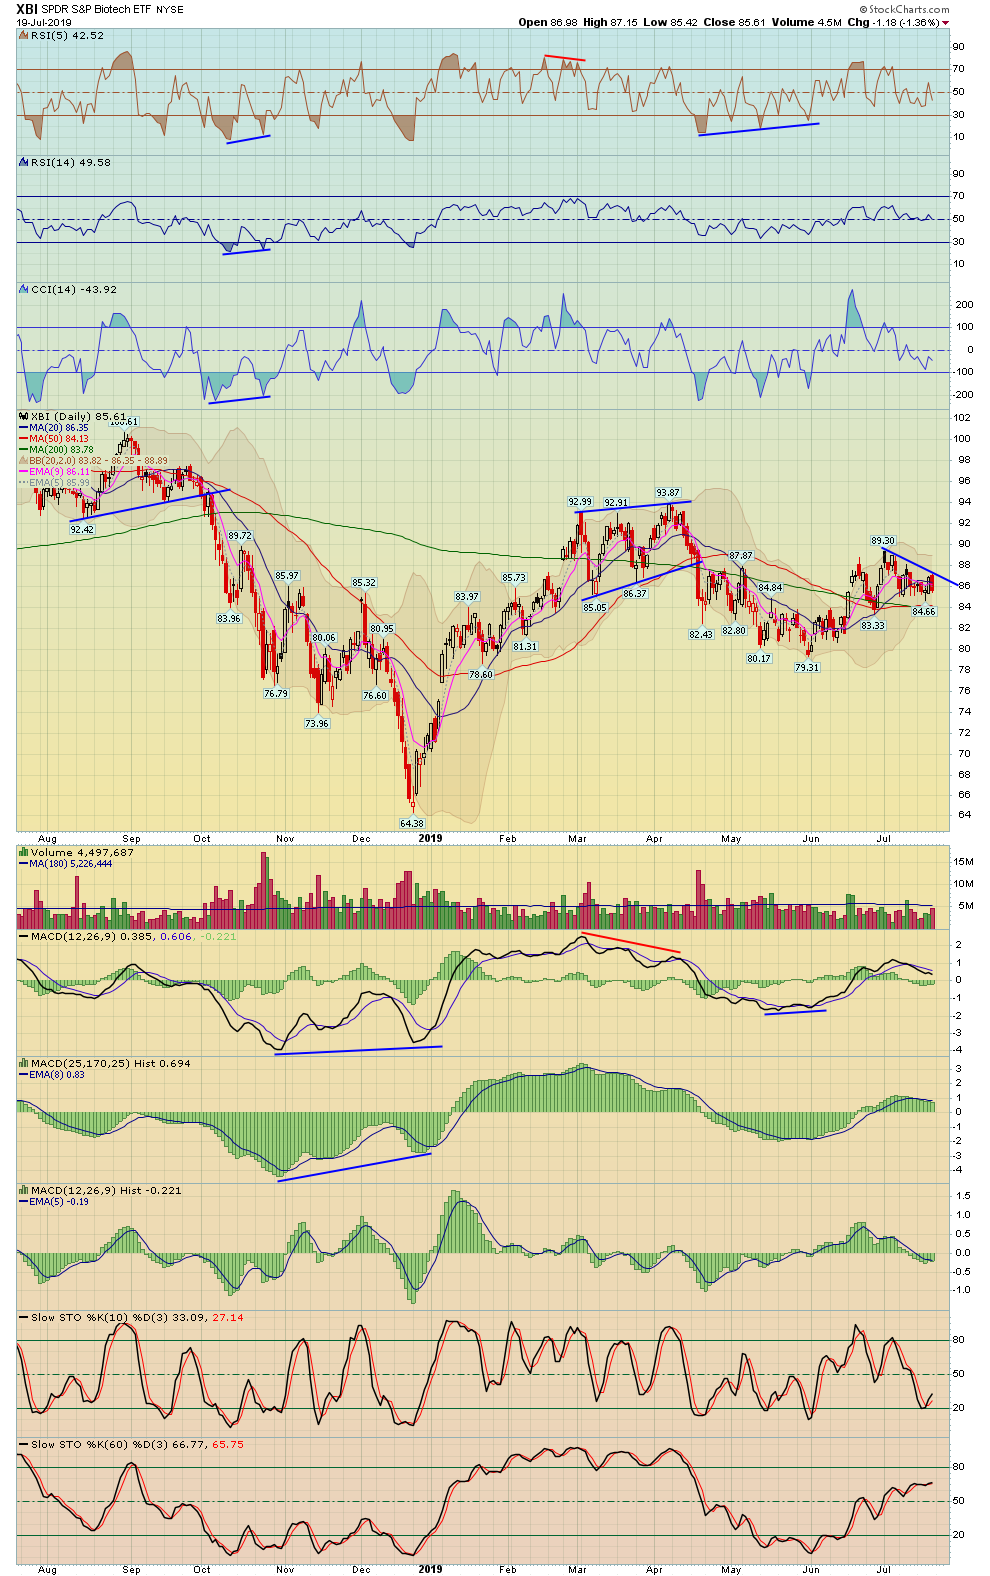
| Biotechnology | BTK - W | XBI - W | -1.89% | 0.71% | 4,666.03 |
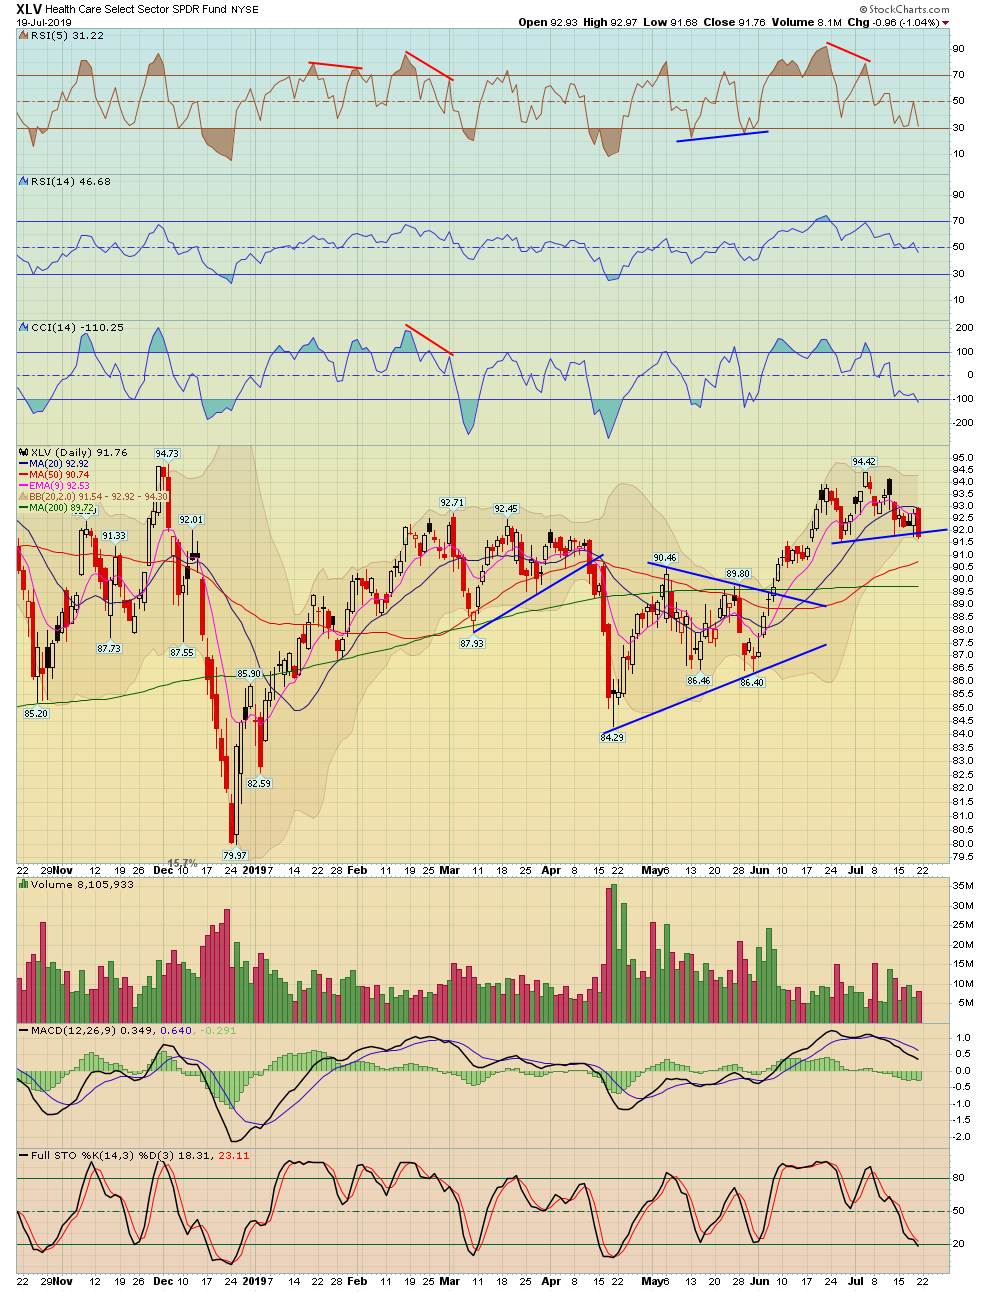
| Healthcare | XLV - W | -1.04% | -0.74% | 91.76 | |
| Drugs | DRG - W | -0.86% | 0.54% | 584.47 | |
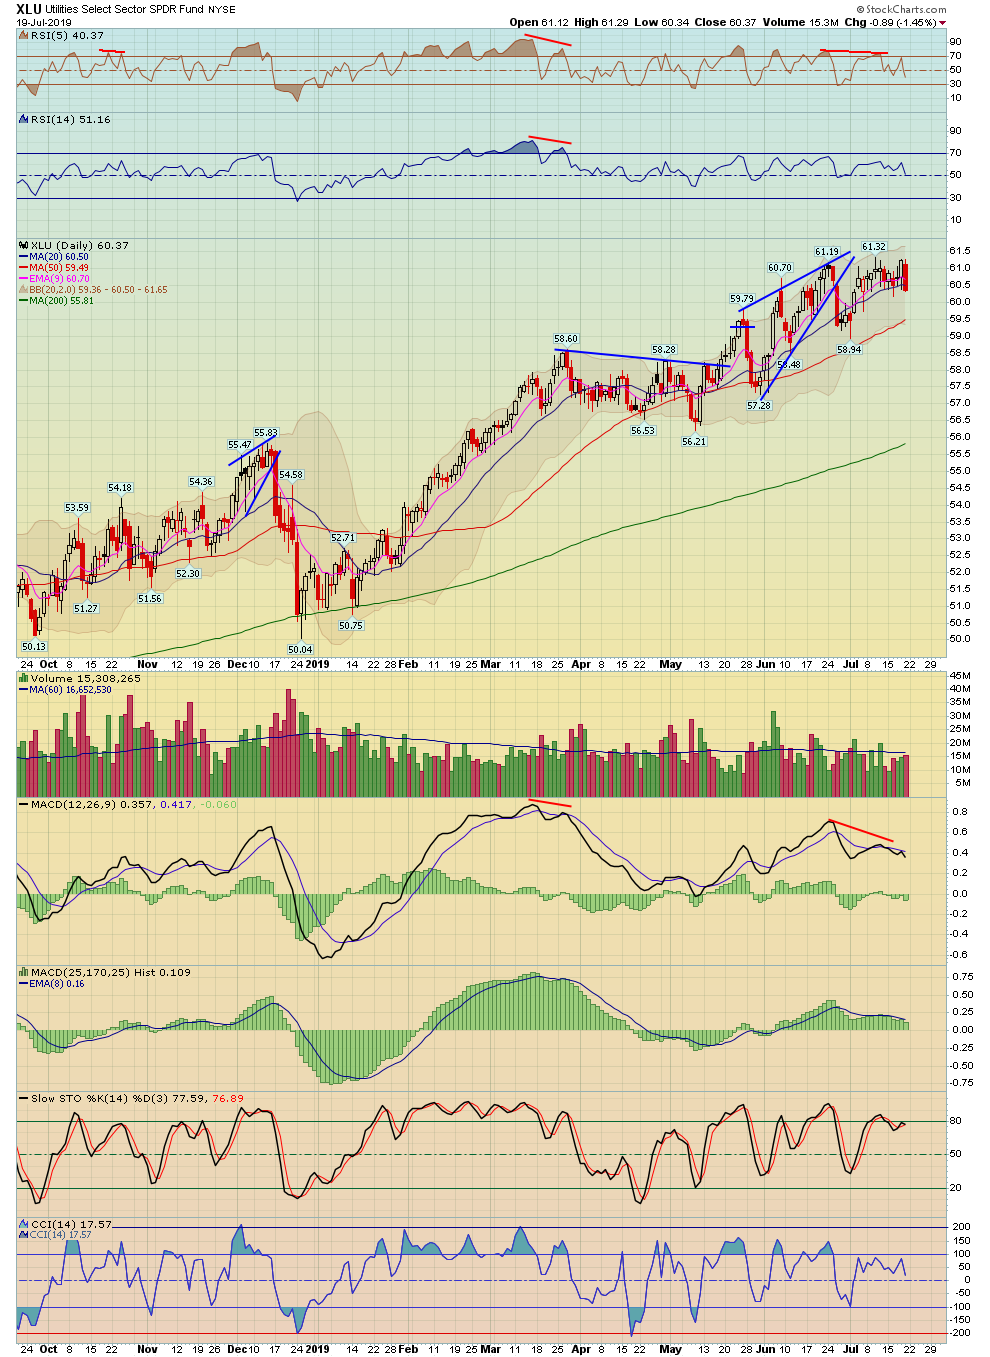
| Utilities | UTIL - W | XLU - W | -1.35% | -0.51% | 820.08 |
| Currencies | Index Symbol | ETF Symbol | % G / L Day | % G / L Week | Close |
|---|---|---|---|---|---|
| US Dollar | UUP - W | 0.50% | 0.38% | 26.29 | |
| Euro | XEU - W | FXE - W | -0.51% | -0.54% | 112.18 |
| Yen | XJY - W | FXY - W | -0.39% | 0.07% | 92.84 |
| Australian | XAD - W | FXA - W | -0.47% | 0.29% | 70.42 |
| British Pound | XBP - W | FXB - W | -0.37% | -0.56% | 125.01 |
| Chinese Yuan | CYB - W | -0.12% | -0.23% | 25.66 | |
| Canadian Dollar | CDW - W | FXC - W | -0.31% | -0.17% | 76.51 |
| Swiss Franc | XSF - W | FXF - W | -0.06% | 0.23% | 101.84 |
| Commodities | Index Symbol | ETF Symbol | % G / L Day | % G / L Week | Close |
|---|---|---|---|---|---|
| Commodities | DBC - W | 0.58% | -3.11% | 15.56 | |
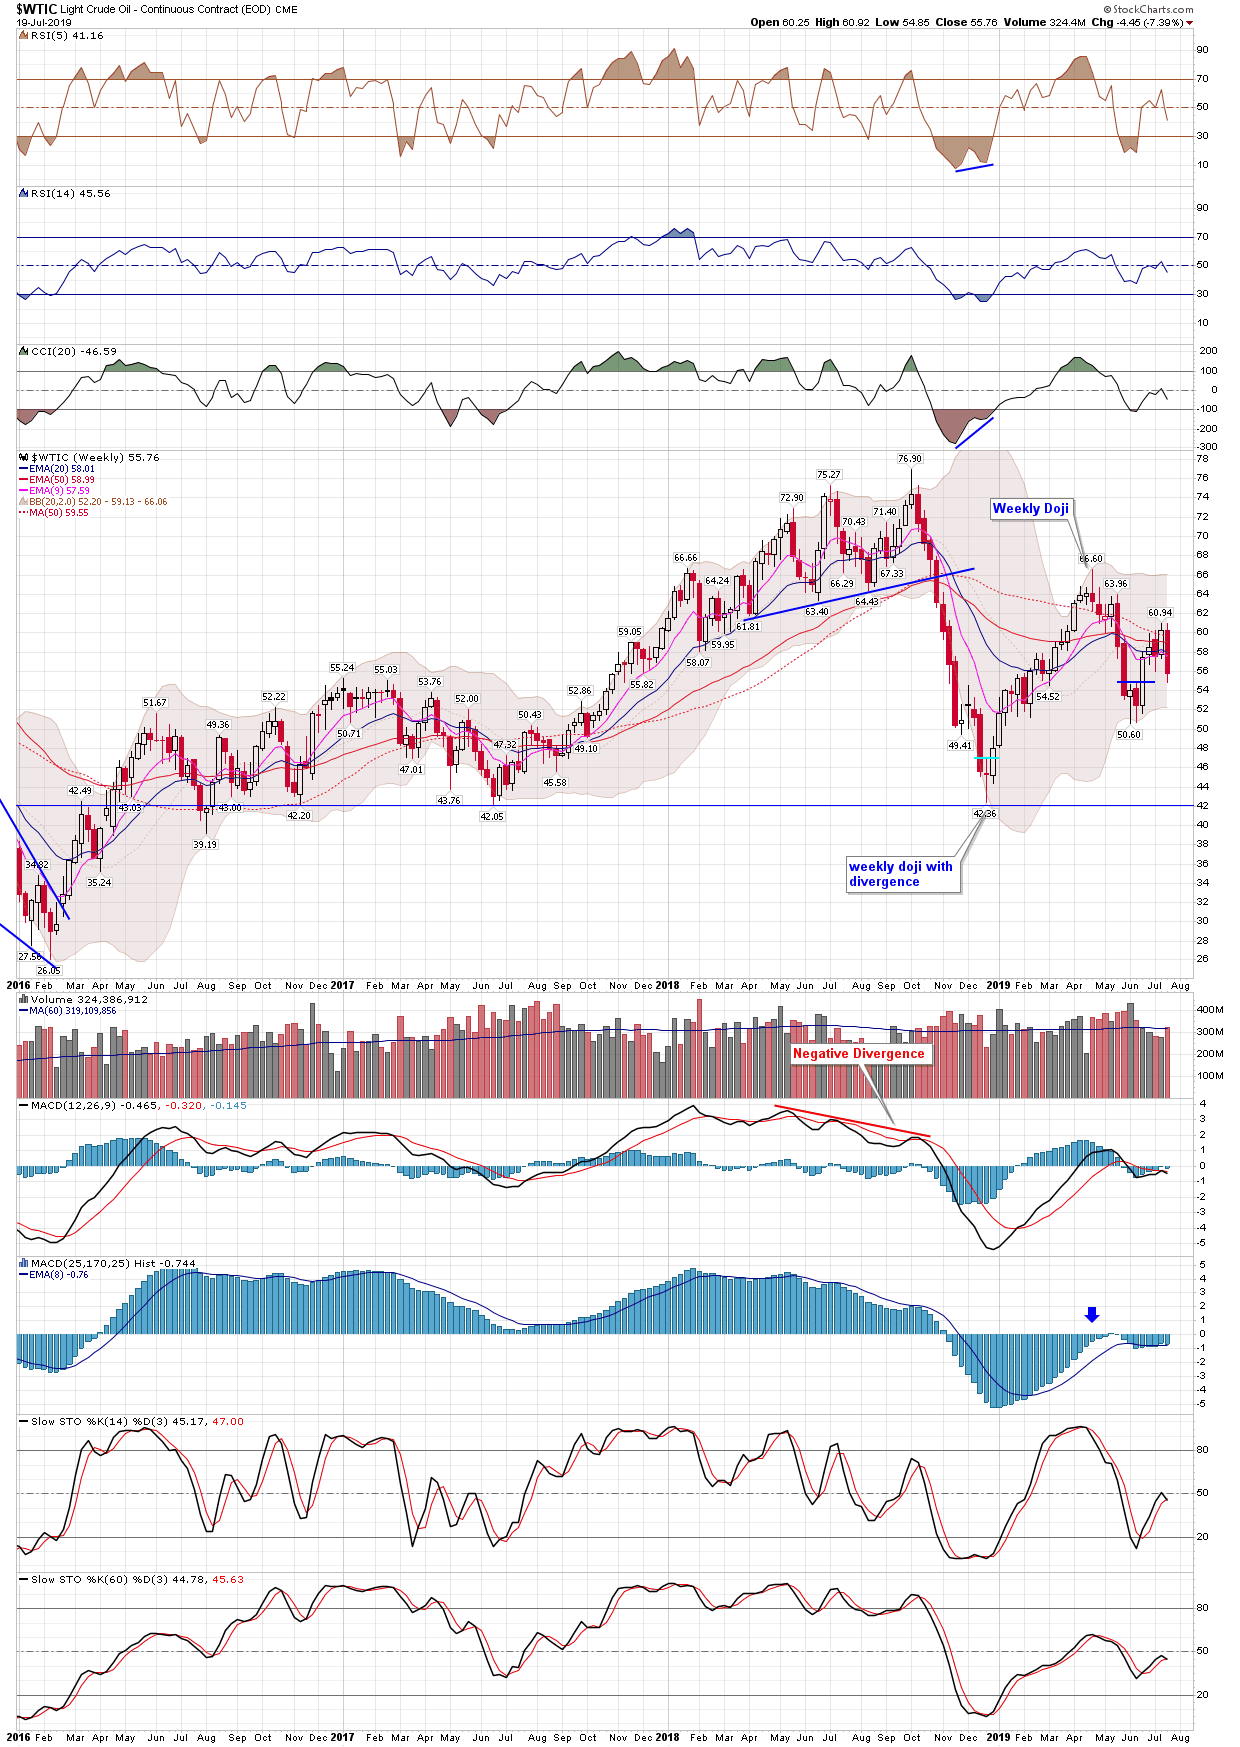
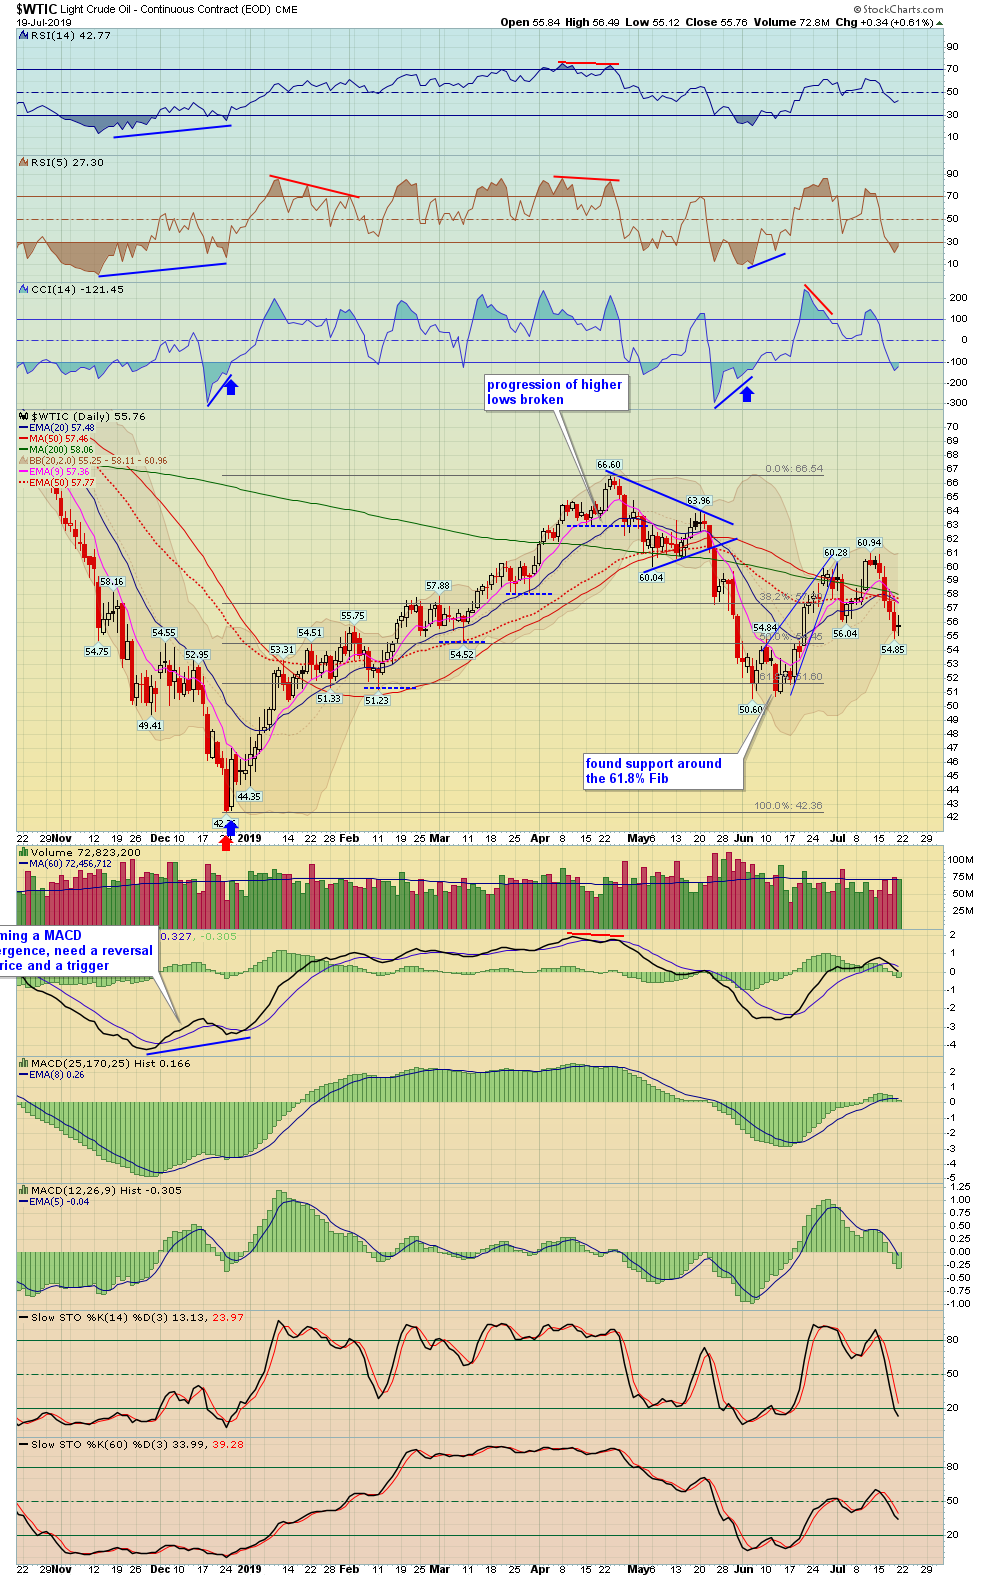
| Crude Oil | WTIC - W | USO - W | 0.61% | -7.39% | 55.76 |
| Gasoline | GASO - W | 0.50% | -6.80% | 1.80 | |
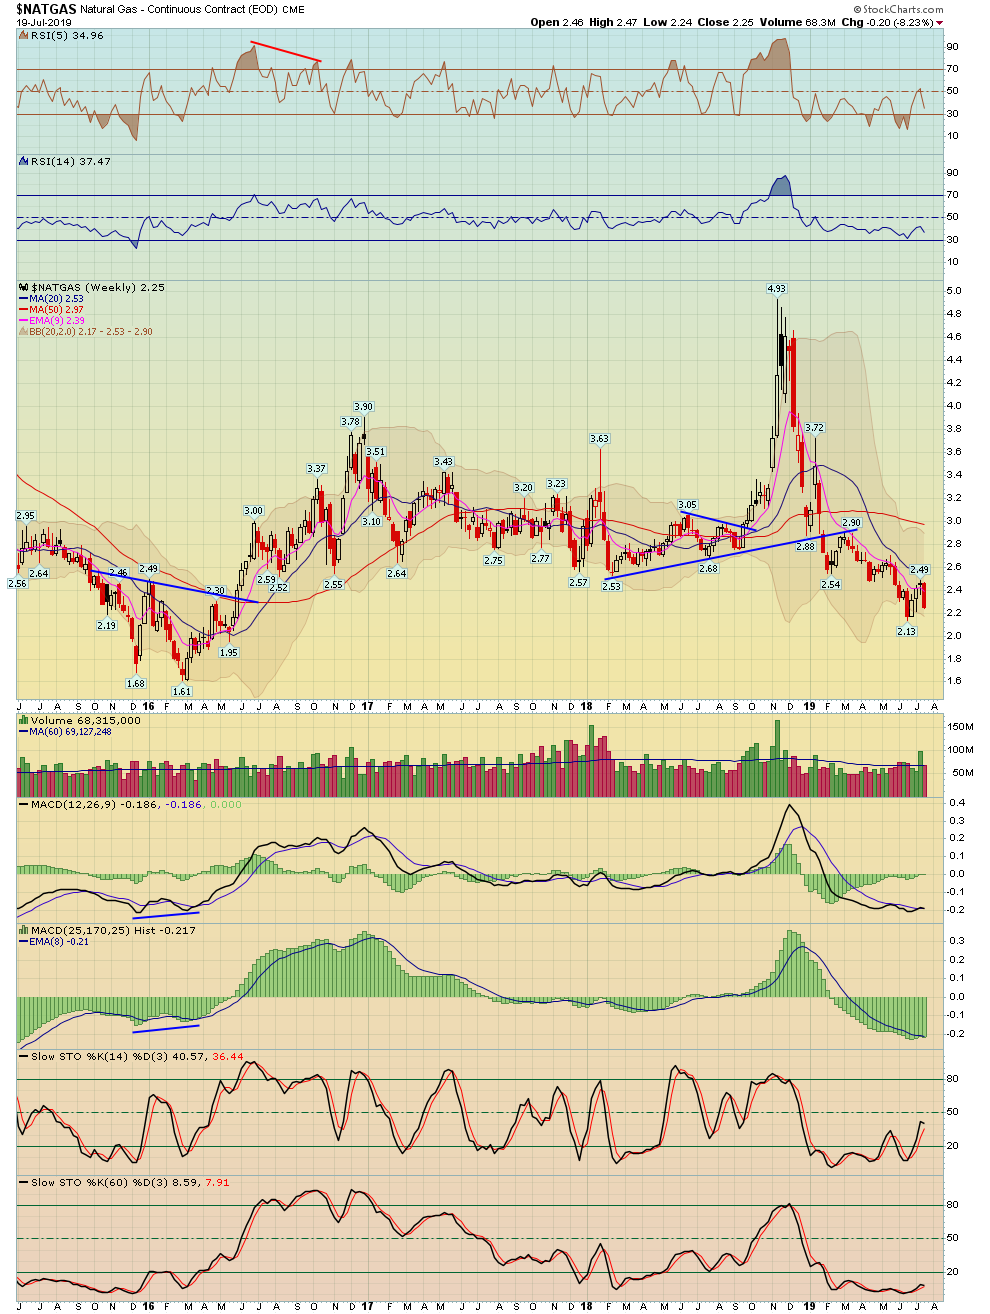
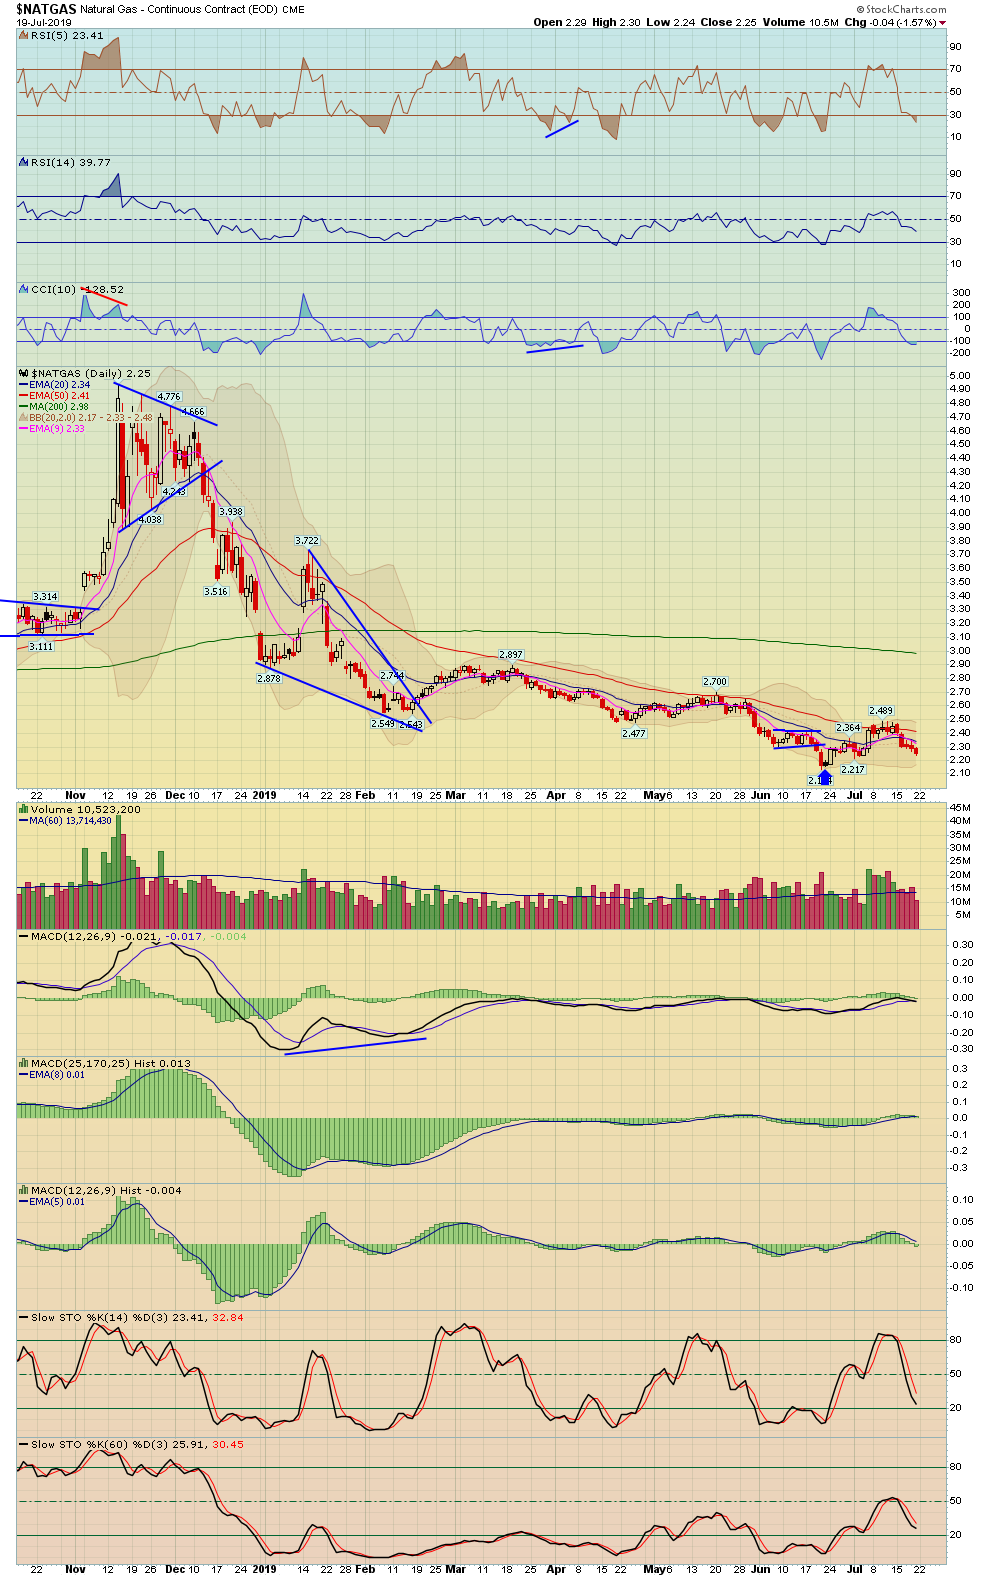
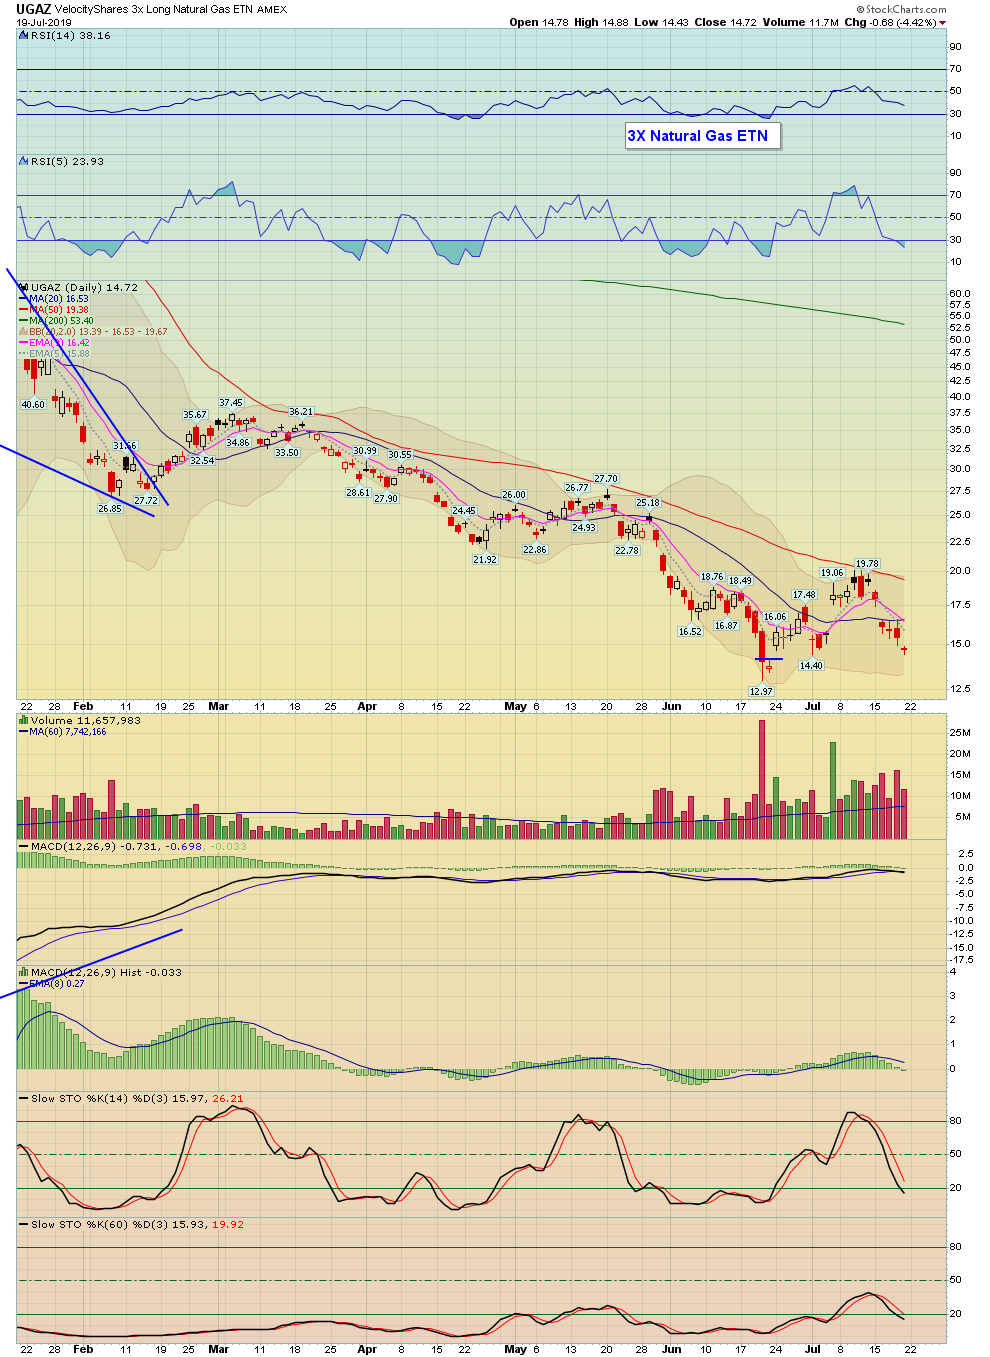
| Natural Gas | NATGAS - W | UNG - W | -1.57% | -8.23% | 2.25 |
| Copper | COPPER - W | JJCB - W | 1.57% | 2.17% | 2.75 |
| Agriculture | DBA - W | 1.16% | -1.72% | 16.60 | |
| Corn | CORN - W | CORN - W | 1.40% | -5.12% | 435.75 |
| Wheat | WHEAT - W | WEAT - W | 1.82% | -3.92% | 502.50 |
| Coffee | JO - W | -0.70% | 0.75% | 36.77 | |
| Sugar | CANE - W | -0.37% | -4.22% | 6.70 |
| Precious Metals | Index Symbol | ETF Symbol | % G / L Day | % G / L Week | Close |
|---|---|---|---|---|---|
| Gold Metal | GLD - W | -1.47% | 0.70% | 134.47 | |
| Silver | SLV - W | -0.78% | 6.38% | 15.17 | |
| Platinum | PPLT - W | -0.71% | 2.01% | 80.02 | |
| Palladium | PALL - W | -1.14% | -2.41% | 142.75 | |
| GDX Gold Miners ETF | GDX - W | -0.96% | 6.75% | 27.98 |
| Bonds | Index Symbol | ETF Symbol | % G / L Day | % G / L Week | Close |
|---|---|---|---|---|---|
| High Yield Corporate Bond | HYG - W | -0.17% | -0.39% | 86.59 | |
| TLT 20 Year Bond ETF | TLT - W | -0.23% | 1.13% | 131.69 | |
| 10 Year Treasury Yield | TNX - W | 0.49% | -2.75% | 20.48 | |
| 30 Year Treasury Yield | TYX - W | 0.39% | -2.09% | 25.78 |
9
| Date | ET | Release | For | Actual | Briefing.com Forecast | Briefing.com Consensus | Prior | Revised From |
|---|---|---|---|---|---|---|---|---|
| Jul 23 | 09:00 | FHFA Housing Price Index | May | NA | NA | +0.4% | ||
| Jul 23 | 10:00 | Existing Home Sales | Jun | 5.35M | 5.30M | 5.34M | ||
| Jul 24 | 07:00 | MBA Mortgage Applications Index | 07/20 | NA | NA | -1.1% | ||
| Jul 24 | 10:00 | New Home Sales | Jun | 670K | 660K | 626K | ||
| Jul 24 | 10:30 | EIA Crude Oil Inventories | 07/20 | NA | NA | -3.1M | ||
| Jul 25 | 08:30 | Adv. Intl. Trade in Goods | Jun | NA | NA | -$74.5B | ||
| Jul 25 | 08:30 | Adv. Retail Inventories | Jun | NA | NA | 0.5% | ||
| Jul 25 | 08:30 | Adv. Wholesale Inventories | Jun | NA | NA | 0.4% | ||
| Jul 25 | 08:30 | Durable Orders | Jun | 0.8% | 1.0% | -1.3% | ||
| Jul 25 | 08:30 | Durable Goods –ex transportation | Jun | 0.4% | 0.3% | 0.3% | ||
| Jul 25 | 08:30 | Initial Claims | 07/20 | 214K | 215K | 216K | ||
| Jul 25 | 08:30 | Continuing Claims | 07/13 | NA | NA | 1686K | ||
| Jul 25 | 10:30 | EIA Natural Gas Inventories | 07/20 | NA | NA | +62 bcf | ||
| Jul 26 | 08:30 | GDP - Adv. | Q2 | 1.8% | 1.8% | 3.1% | ||
| Jul 26 | 08:30 | GDP Deflator - Adv. | Q2 | 1.8% | 1.8% | 0.6% |

Stock Earnings Calender:
Click here for a list of Stocks that are reporting Earnings
**Generally we never hold a position into earnings since the risk/reward is too great
10 - View Live Chart
11
12 - View Live Chart
13 - View Live Chart
14 - View Live Chart
15 - View Live Chart
16 - View Live Chart
17 - View Live Chart
18 - View Live Chart
19 - View Live Chart
20 - View Live Chart
21
22 - View Live Chart
23 - View Live Chart
24 - View Live Chart
25 - View Live Chart
26 - View Live Chart
27 - View Live Chart
28 - View Live Chart
29 - View Live Chart
30 - View Live Chart
31 - View Live Chart
32 - View Live Chart
33 - View Live Chart
34 - View Live Chart
35 - View Live Chart
36 - View Live Chart
37 - View Live Chart
38 - View Live Chart
39 - View Live Chart
40 - View Live Chart
41 - View Live Chart
42 - View Live Chart
43 - View Live Chart
44 - View Live Chart
45 - View Live Chart
46 - View Live Chart
47 - View Live Chart
48 - View Live Chart
49 - View Live Chart
50 - View Live Chart
51 - View Live Chart
52 - View Live Chart
53 - View Live Chart
54 - View Live Chart
55 - View Live Chart
56 - View Live Chart
57 - View Live Chart
58 - View Live Chart
59 - View Live Chart
60 - View Live Chart
61 - View Live Chart
62 - View Live Chart
63 - View Live Chart
64 - View Live Chart
65 - View Live Chart
66 - View Live Chart
67 - View Live Chart
68 - View Live Chart
69 - View Live Chart
70 - View Live Chart
71 - View Live Chart
72 - View Live Chart
73 - View Live Chart
74 - View Live Chart
75 - View Live Chart
76 - View Live Chart
77 - View Live Chart
78 - View Live Chart
79 - View Live Chart
80 - View Live Chart
81 - View Live Chart
82 - View Live Chart
83 - View Live Chart
84 - View Live Chart
85 - View Live Chart
86 - View Live Chart
87 - View Live Chart
88 - View Live Chart
89 - View Live Chart
90 - View Live Chart
91 - View Live Chart
92 - View Live Chart
93 - View Live Chart
94 - View Live Chart
95 - View Live Chart
96 - View Live Chart
97 - View Live Chart
98 - View Live Chart
99 - View Live Chart
100 - View Live Chart
101 - View Live Chart
102 - View Live Chart
103 - View Live Chart
104 - View Live Chart
105 - View Live Chart
106 - View Live Chart
107 - View Live Chart
108 - View Live Chart
109 - View Live Chart
110 - View Live Chart
111 - View Live Chart
112 - View Live Chart
113 - View Live Chart
114 - View Live Chart
115 - View Live Chart
116 - View Live Chart
117 - View Live Chart
118 - View Live Chart
119 - View Live Chart

120 - View Live Chart
121 - View Live Chart
122 - View Live Chart
123 - View Live Chart
124 - View Live Chart
125 - View Live Chart
126 - View Live Chart
127 - View Live Chart
- Hide Player Link to Newsletter Audio
- Hide Player Link to Newsletter Audio