Wednesday March 20th, 2019 Newsletter - free
Disclaimer: Intraday Chart Links will show up as daily charts unless you have an active stockcharts.com membership and are signed in, you can sign up here.
1
Table of Contents:
1. General Market Analysis: SPX and Other Major Indices
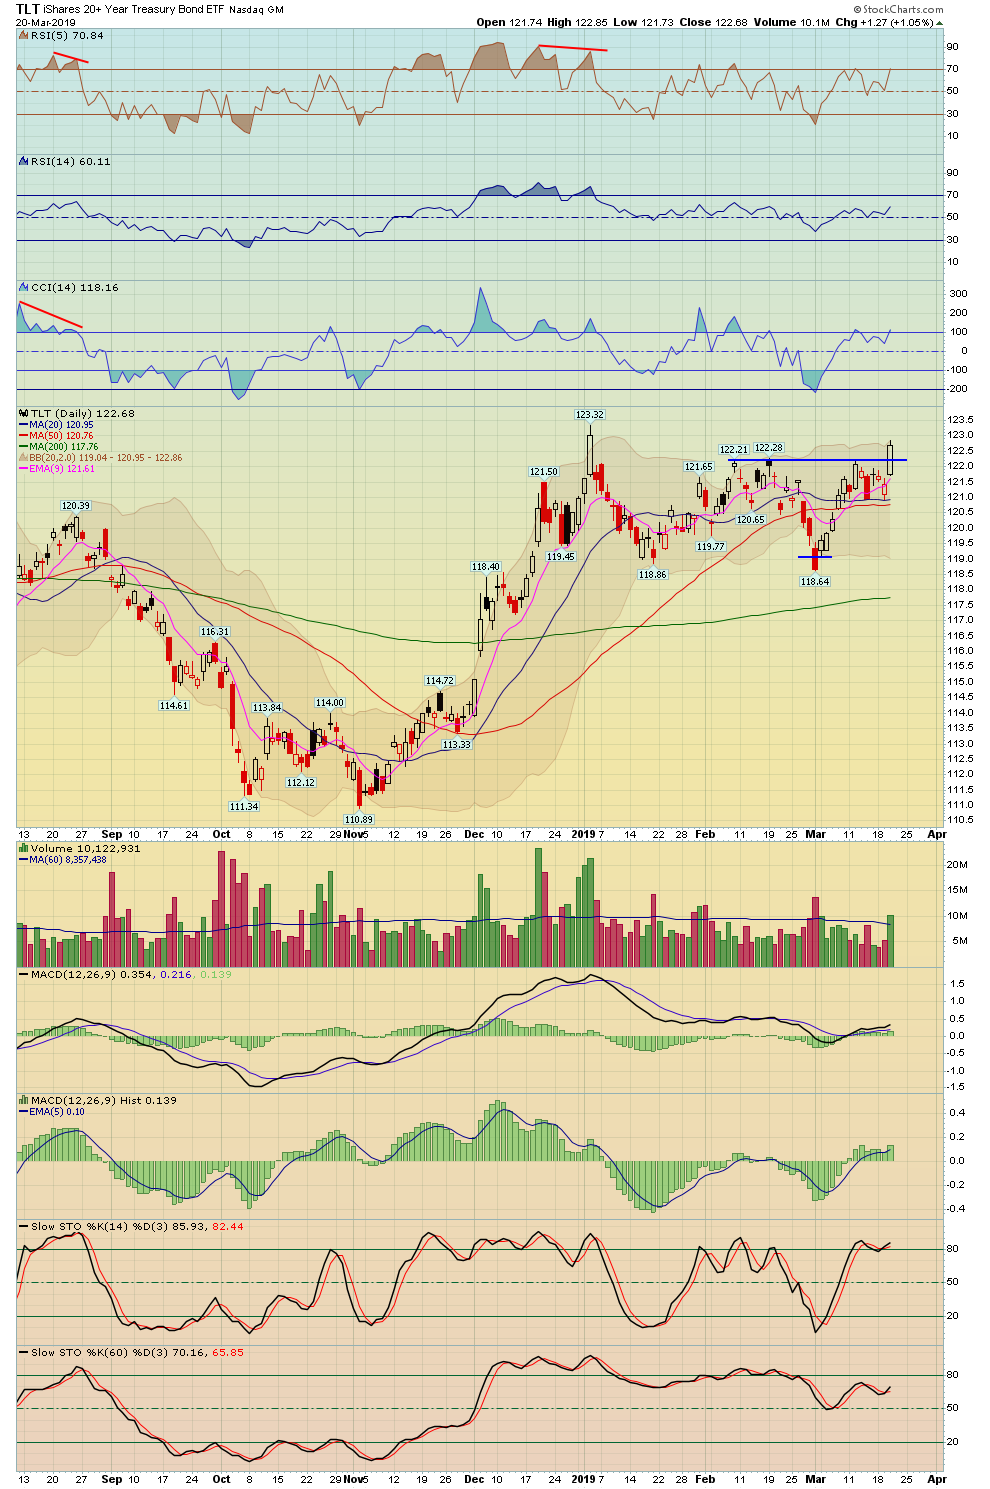
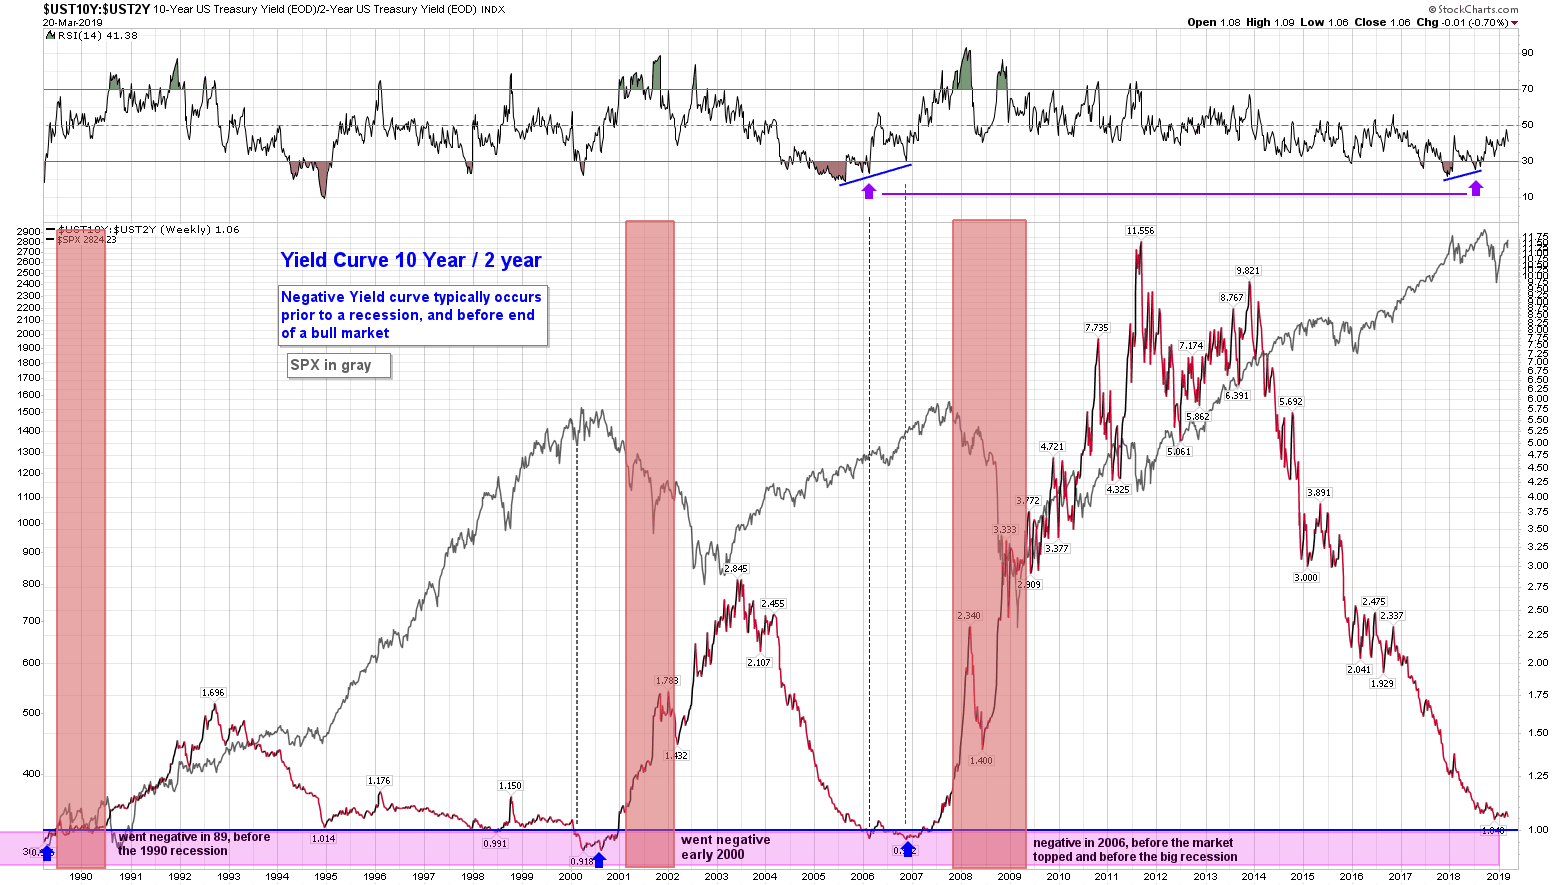
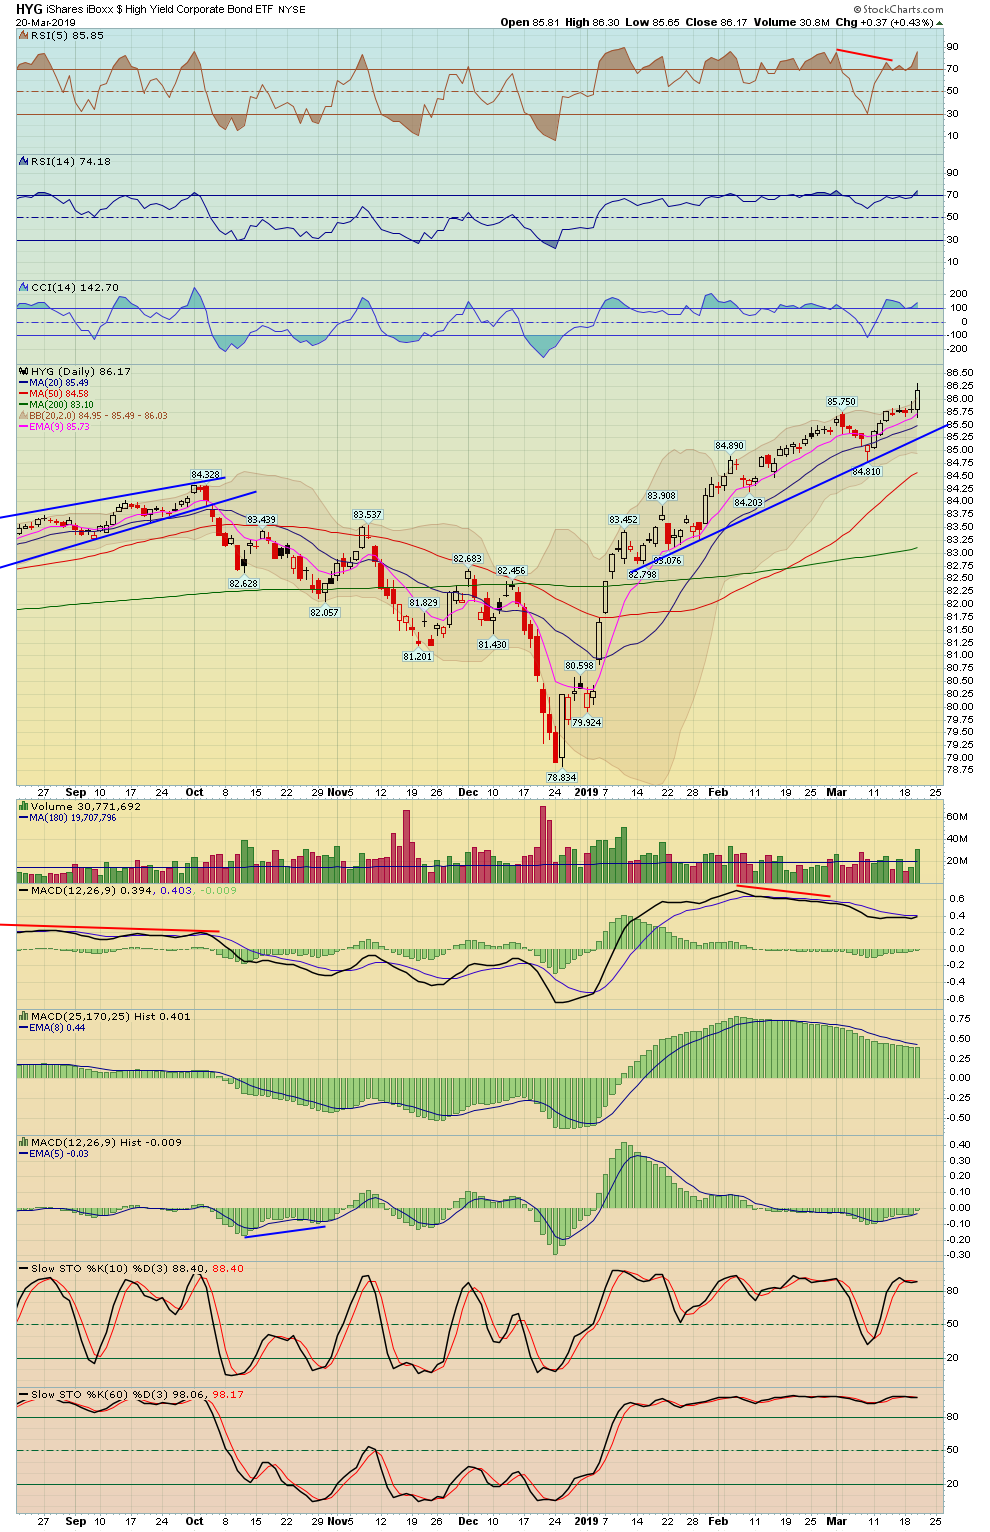
2. Indicators and Bonds (TLT/HYG)
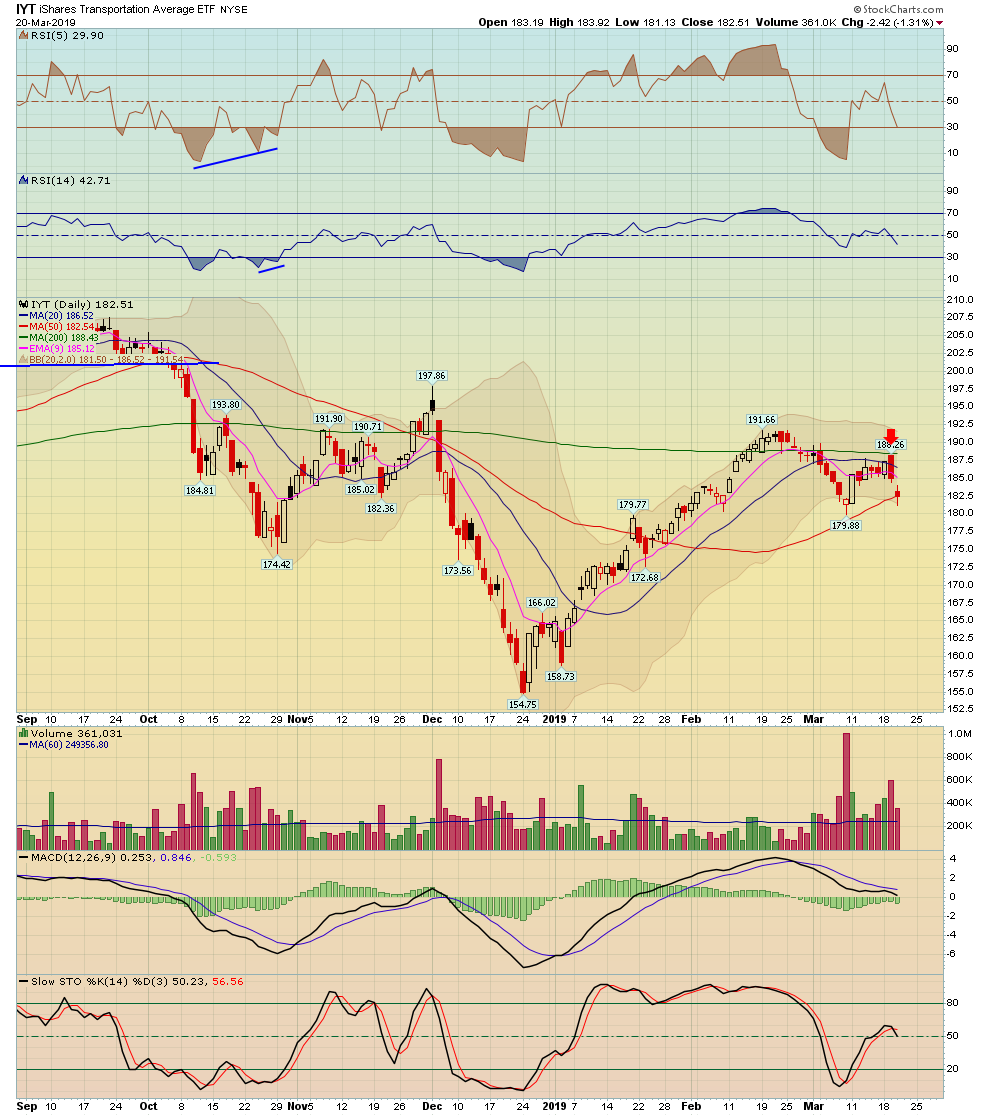
3. Major Sectors
4. US Dollar, Commodities, Precious Metals and GDX
5. Trade Ideas - remain nimble and respect your triggers and then employ proper stops
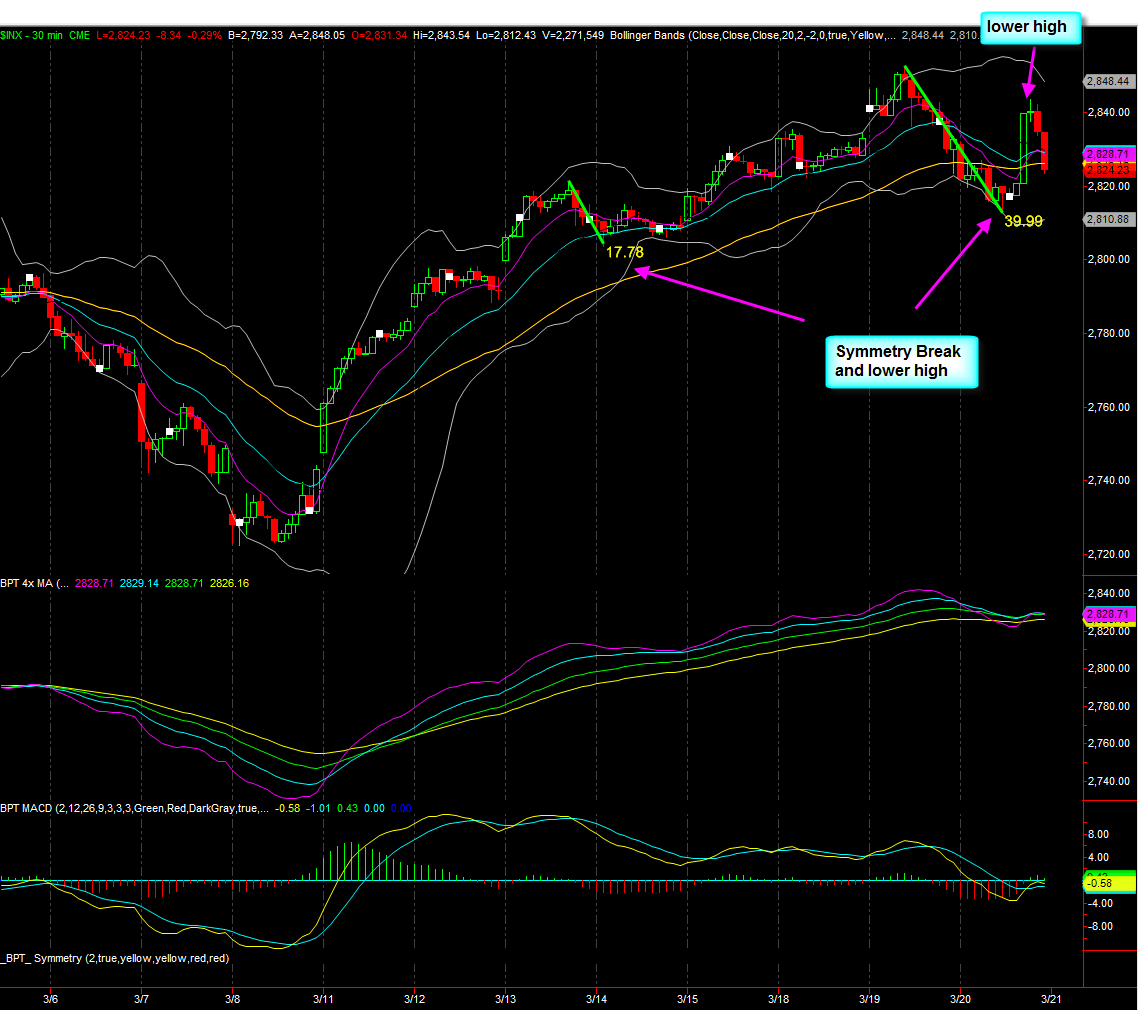
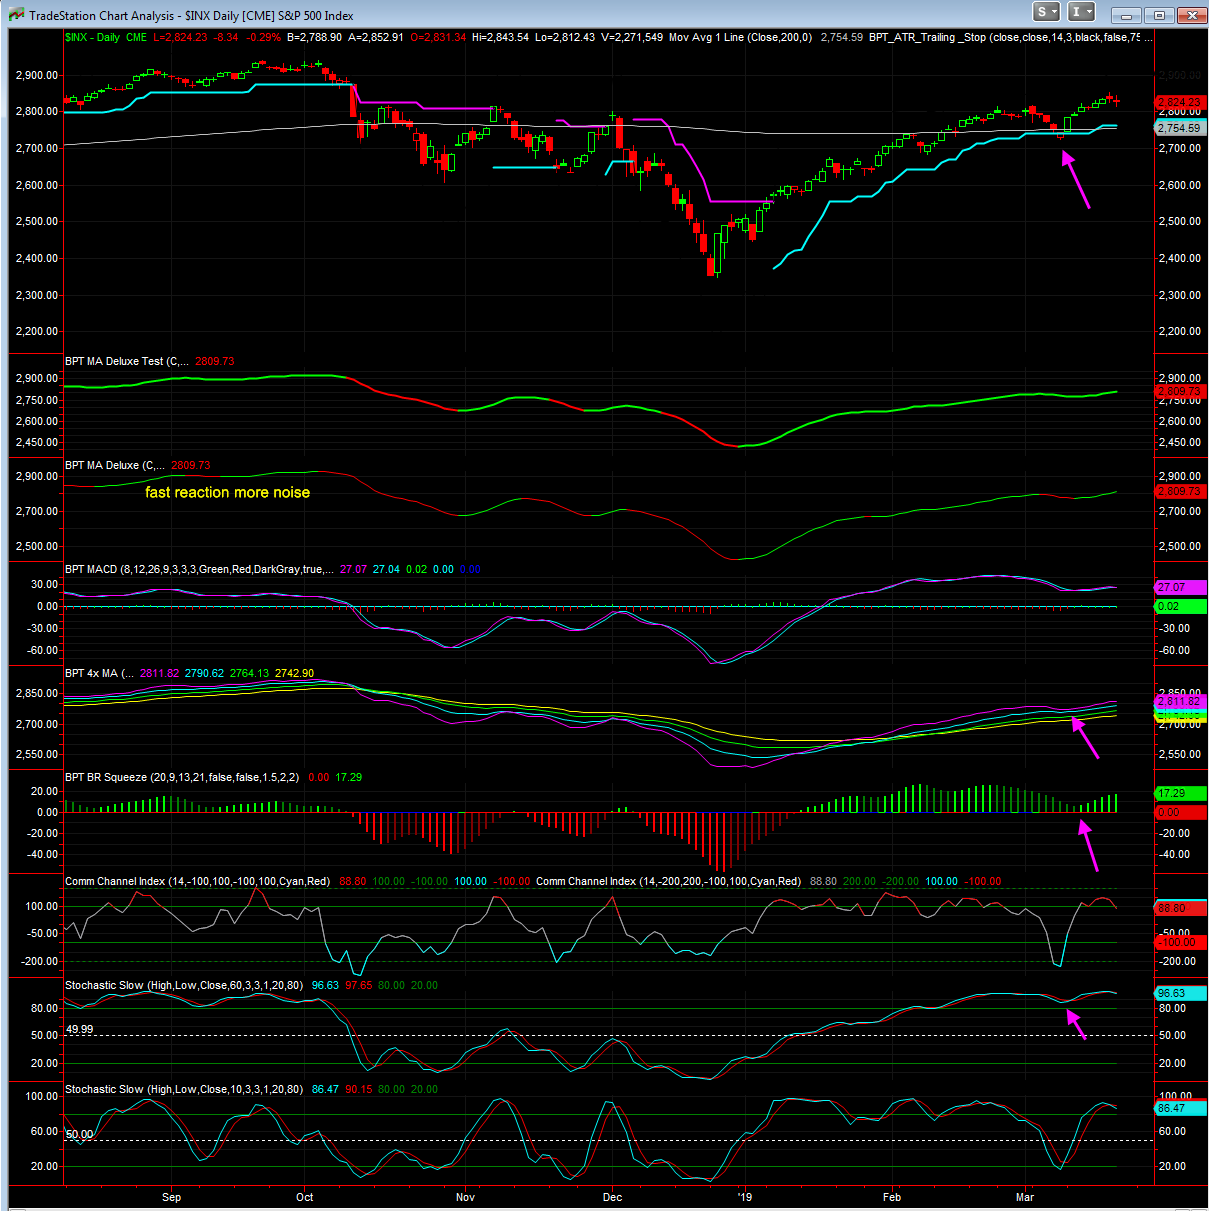
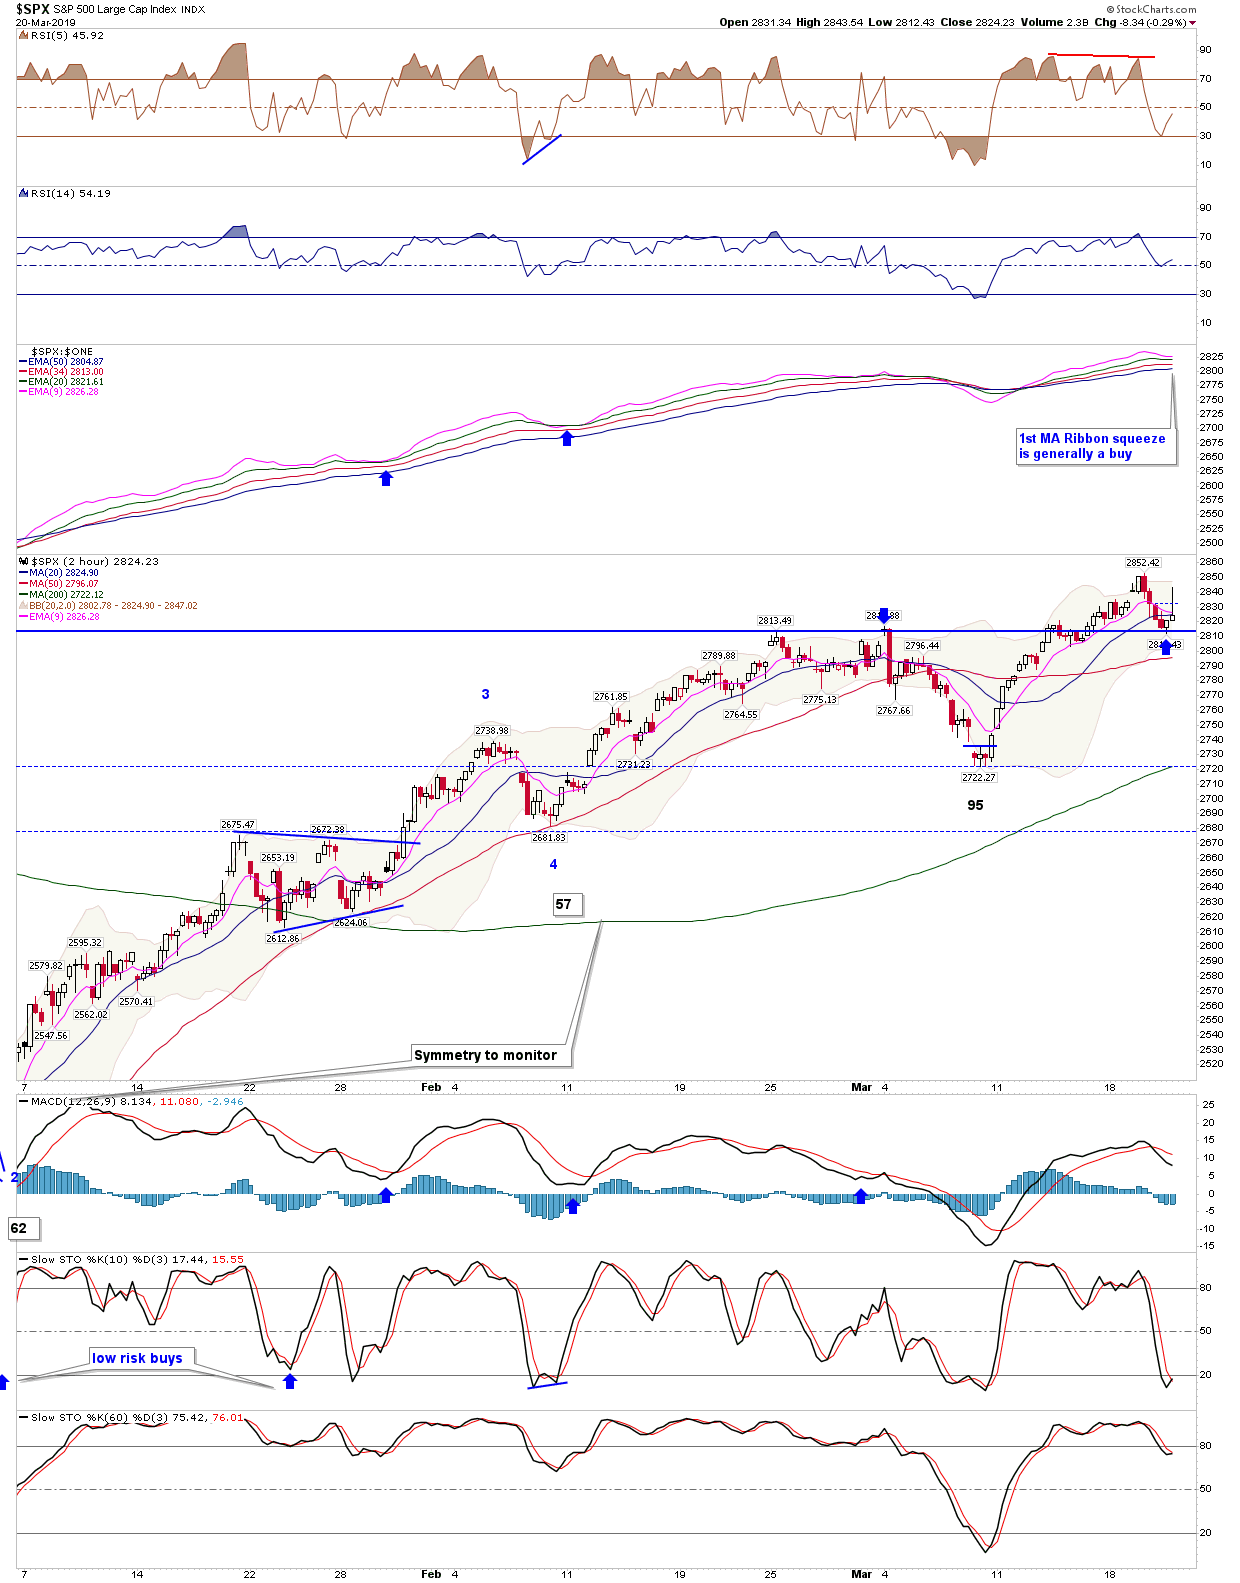
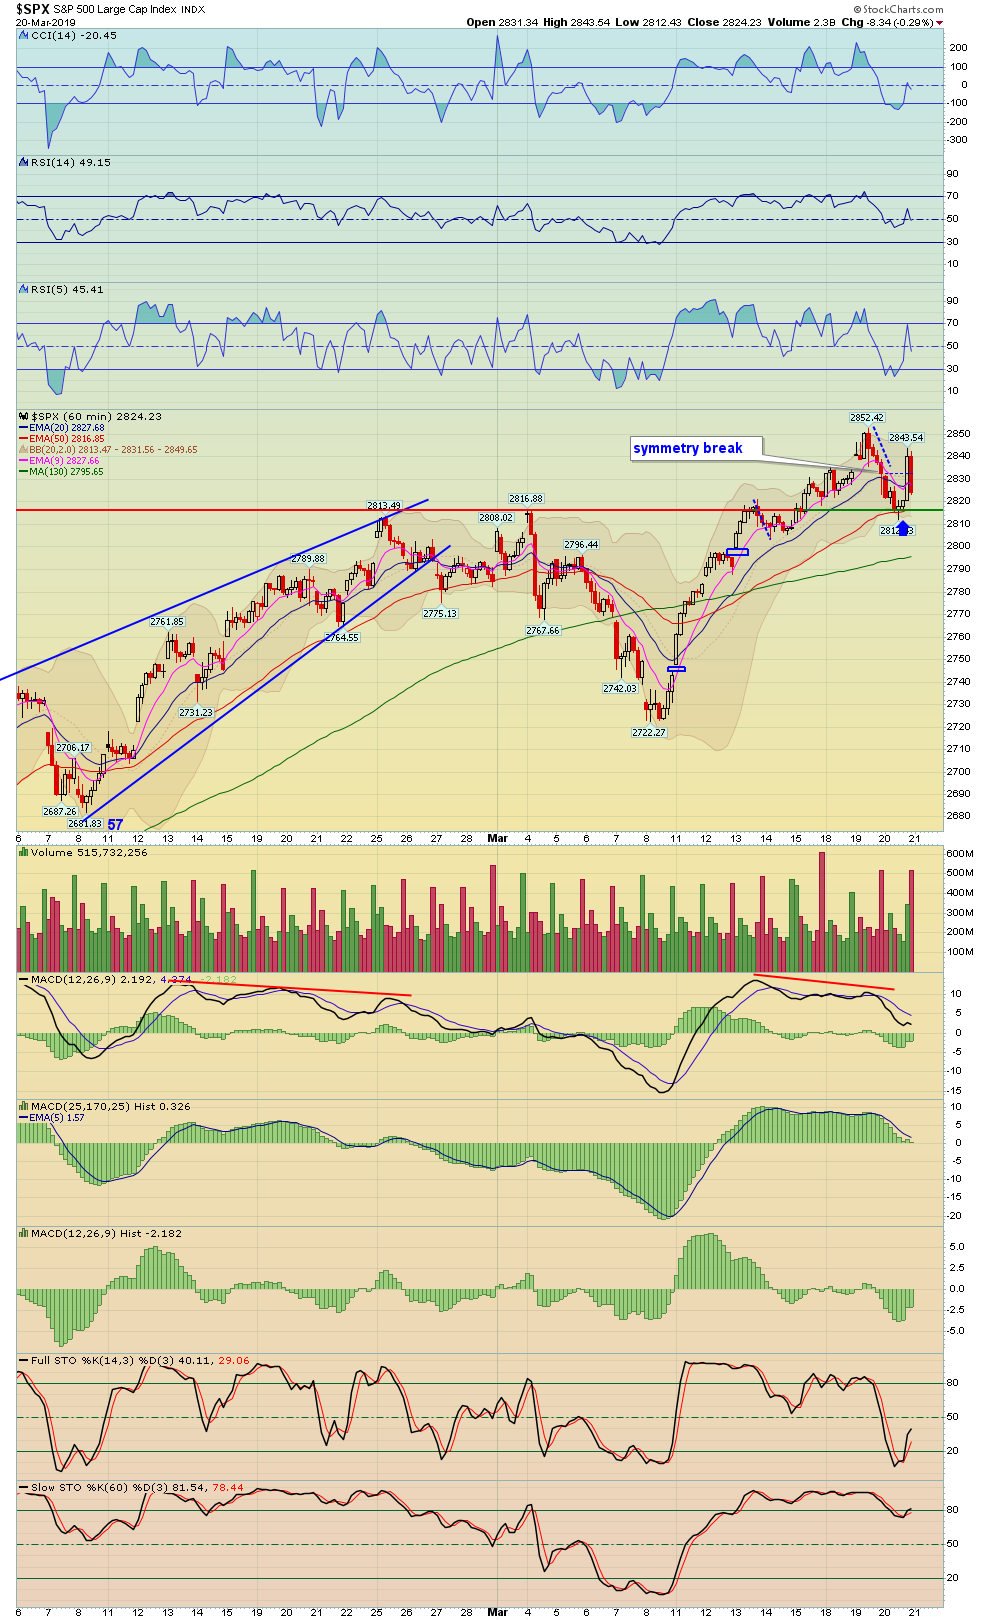
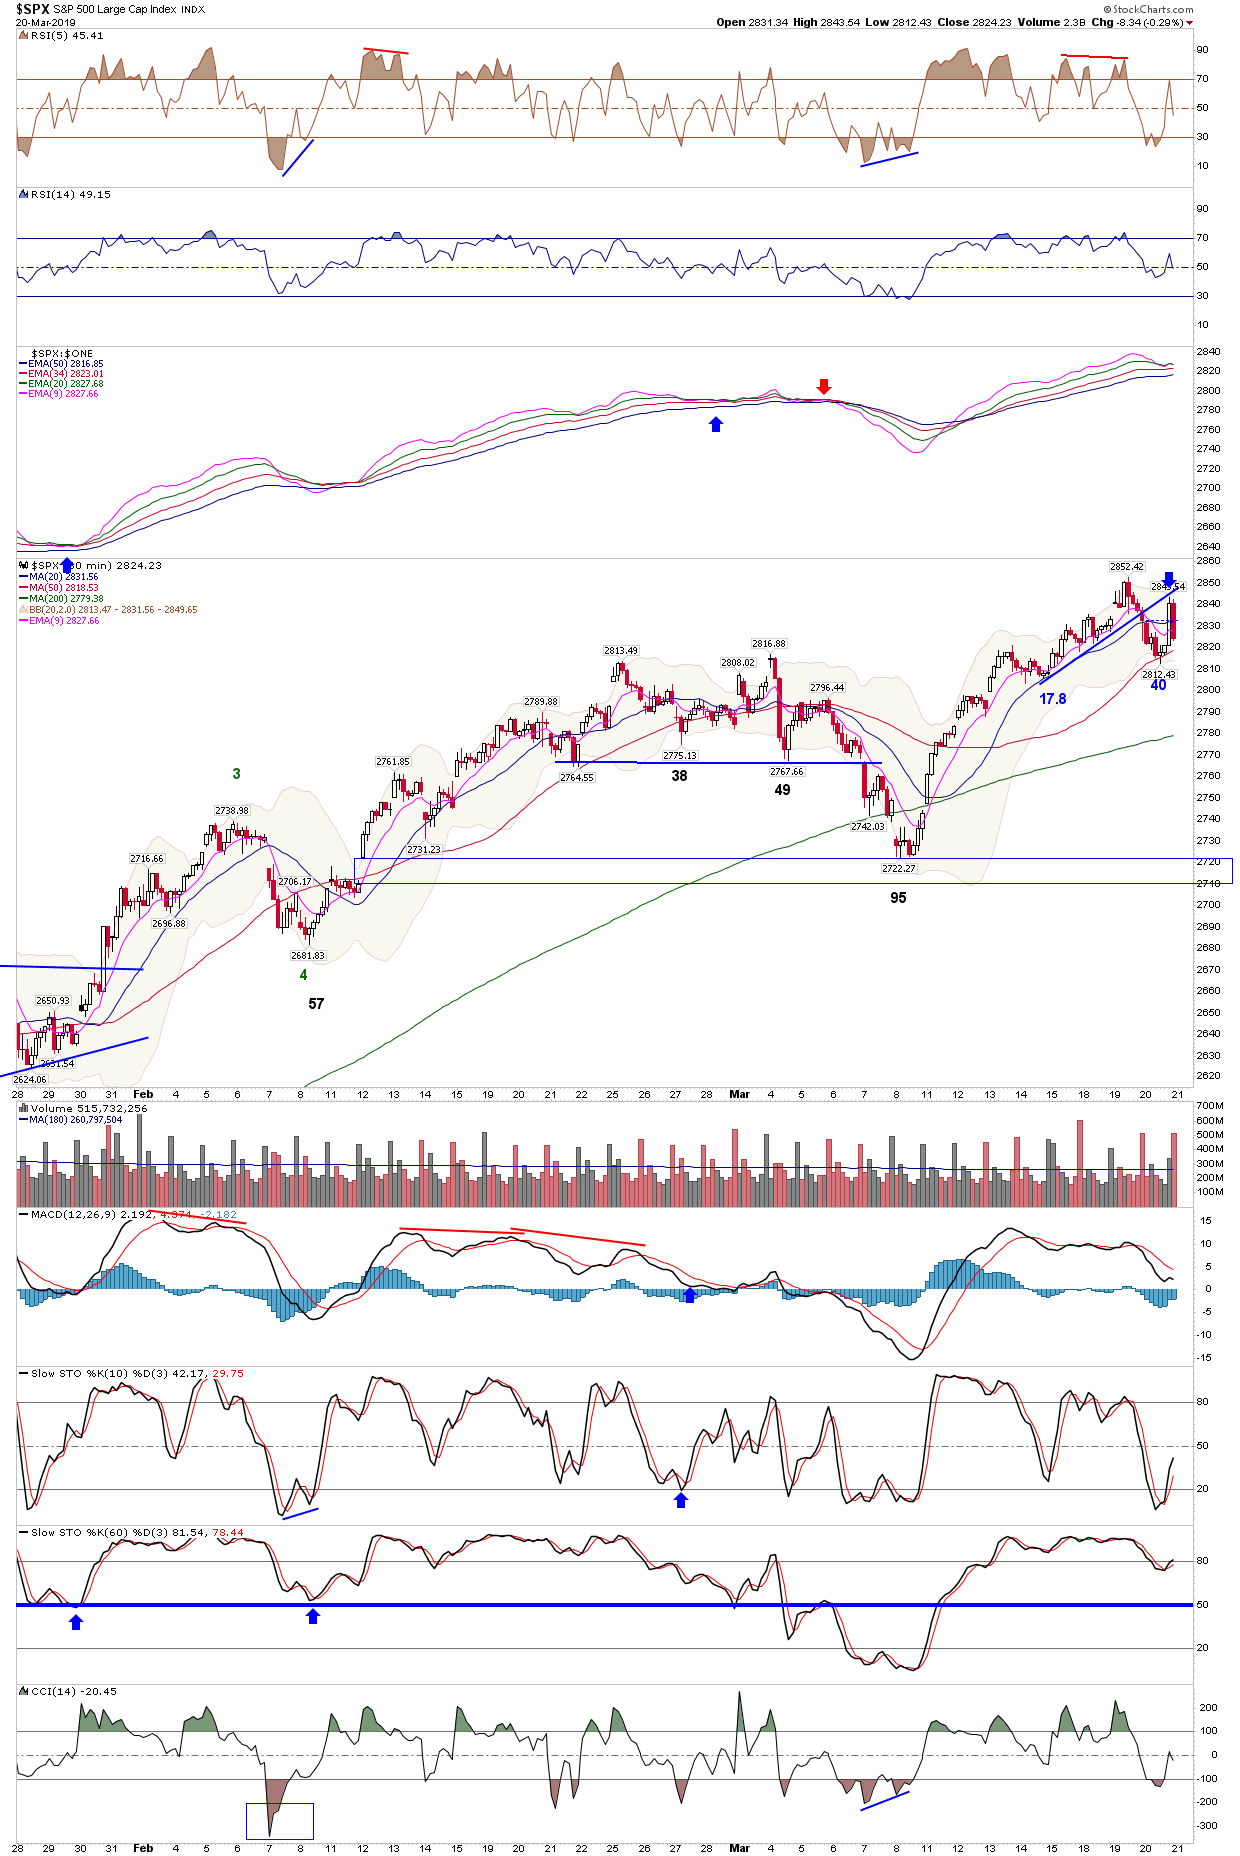
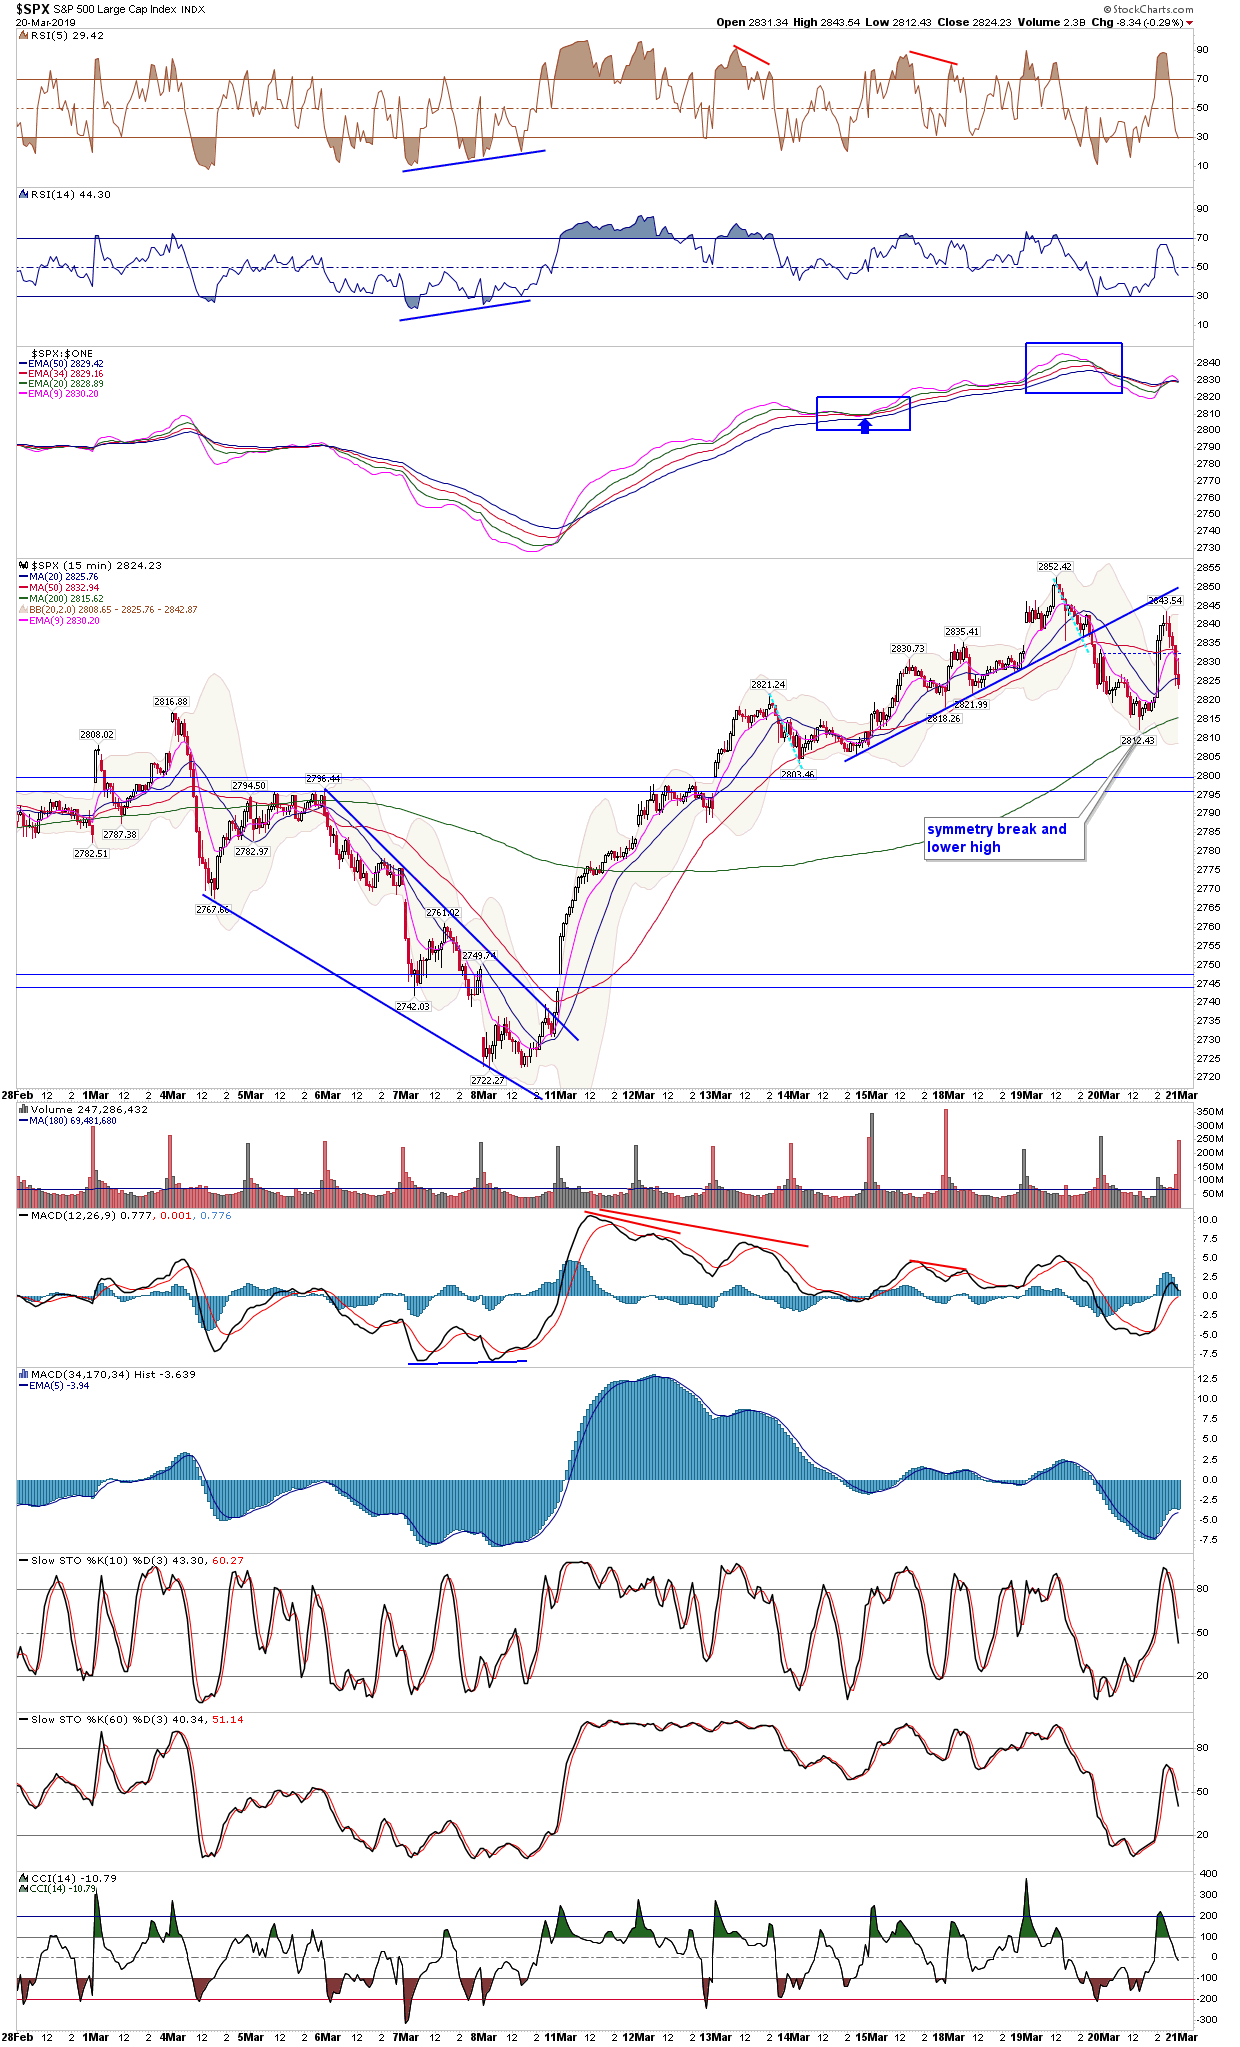
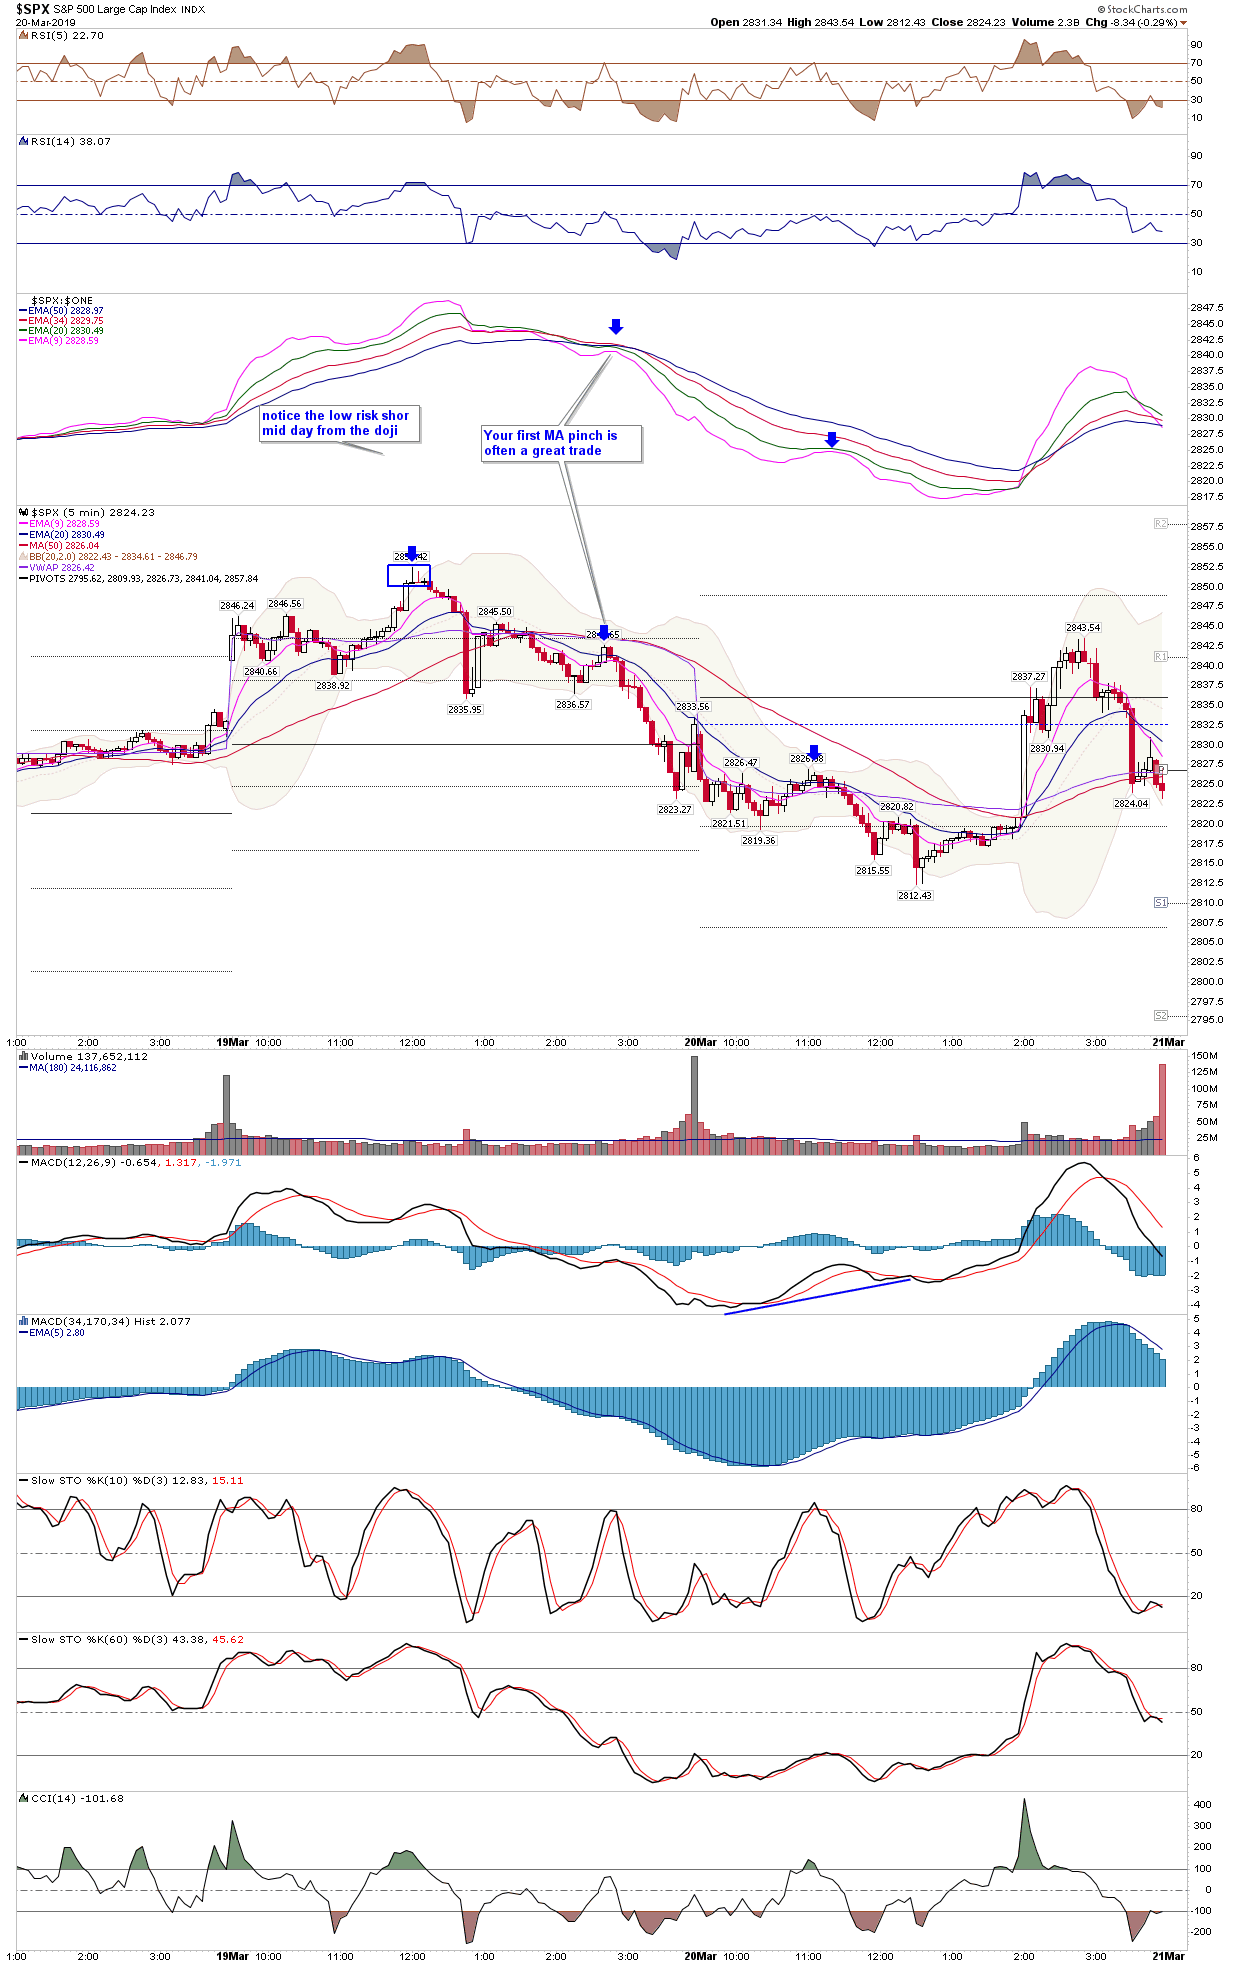
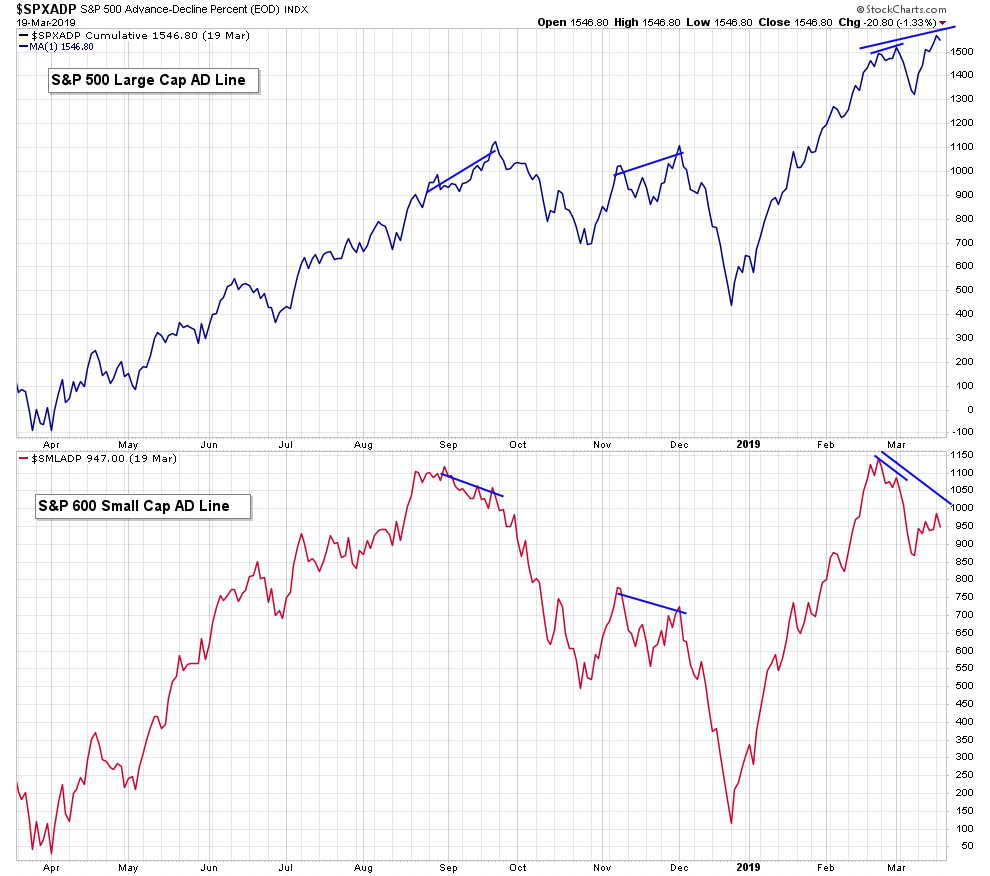
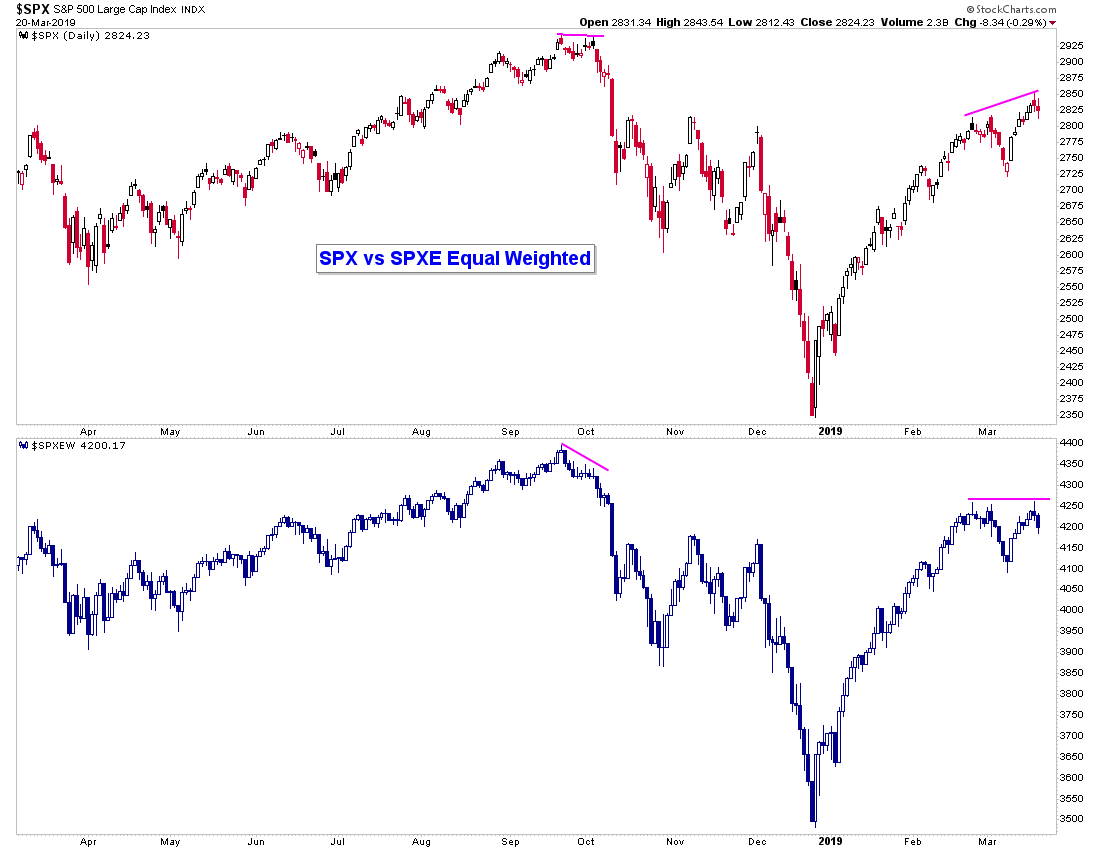
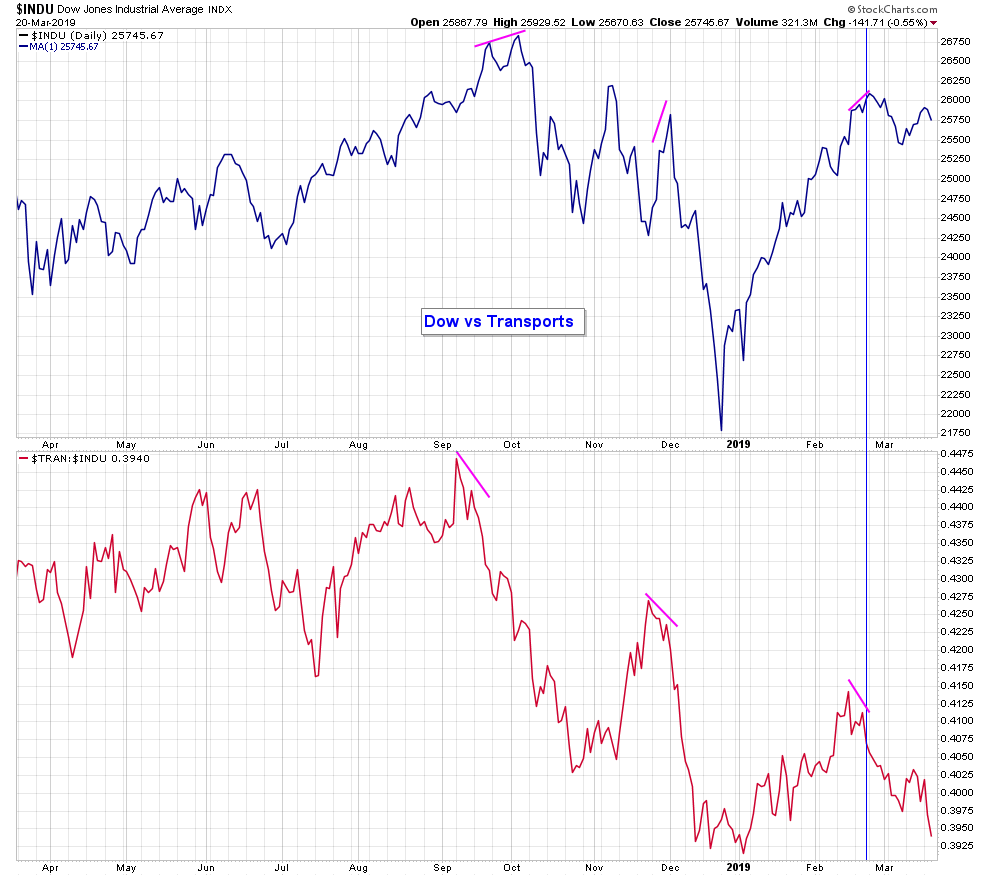
Despite the wild market gyrations following the FOMC, the market indexes still formed lower highs (remember the symmetry break we discussed yesterday)
FED Statement: Dovish
Information received since the Federal Open Market Committee met in January indicates that the labor market remains strong but that growth of economic activity has slowed from its solid rate in the fourth quarter. Payroll employment was little changed in February, but job gains have been solid, on average, in recent months, and the unemployment rate has remained low. Recent indicators point to slower growth of household spending and business fixed investment in the first quarter. On a 12-month basis, overall inflation has declined, largely as a result of lower energy prices; inflation for items other than food and energy remains near 2 percent. On balance, market-based measures of inflation compensation have remained low in recent months, and survey-based measures of longer-term inflation expectations are little changed.
Consistent with its statutory mandate, the Committee seeks to foster maximum employment and price stability. In support of these goals, the Committee decided to maintain the target range for the federal funds rate at 2-1/4 to 2-1/2 percent. The Committee continues to view sustained expansion of economic activity, strong labor market conditions, and inflation near the Committee's symmetric 2 percent objective as the most likely outcomes. In light of global economic and financial developments and muted inflation pressures, the Committee will be patient as it determines what future adjustments to the target range for the federal funds rate may be appropriate to support these outcomes.
In determining the timing and size of future adjustments to the target range for the federal funds rate, the Committee will assess realized and expected economic conditions relative to its maximum employment objective and its symmetric 2 percent inflation objective. This assessment will take into account a wide range of information, including measures of labor market conditions, indicators of inflation pressures and inflation expectations, and readings on financial and international developments.
2
| Major Indexes | Index Symbol | ETF Symbol | % G / L Day | % G / L Week | Close |
|---|---|---|---|---|---|
| Dow Jones | INDU - W | DIA - W | -0.55% | -0.40% | 25,745.67 |
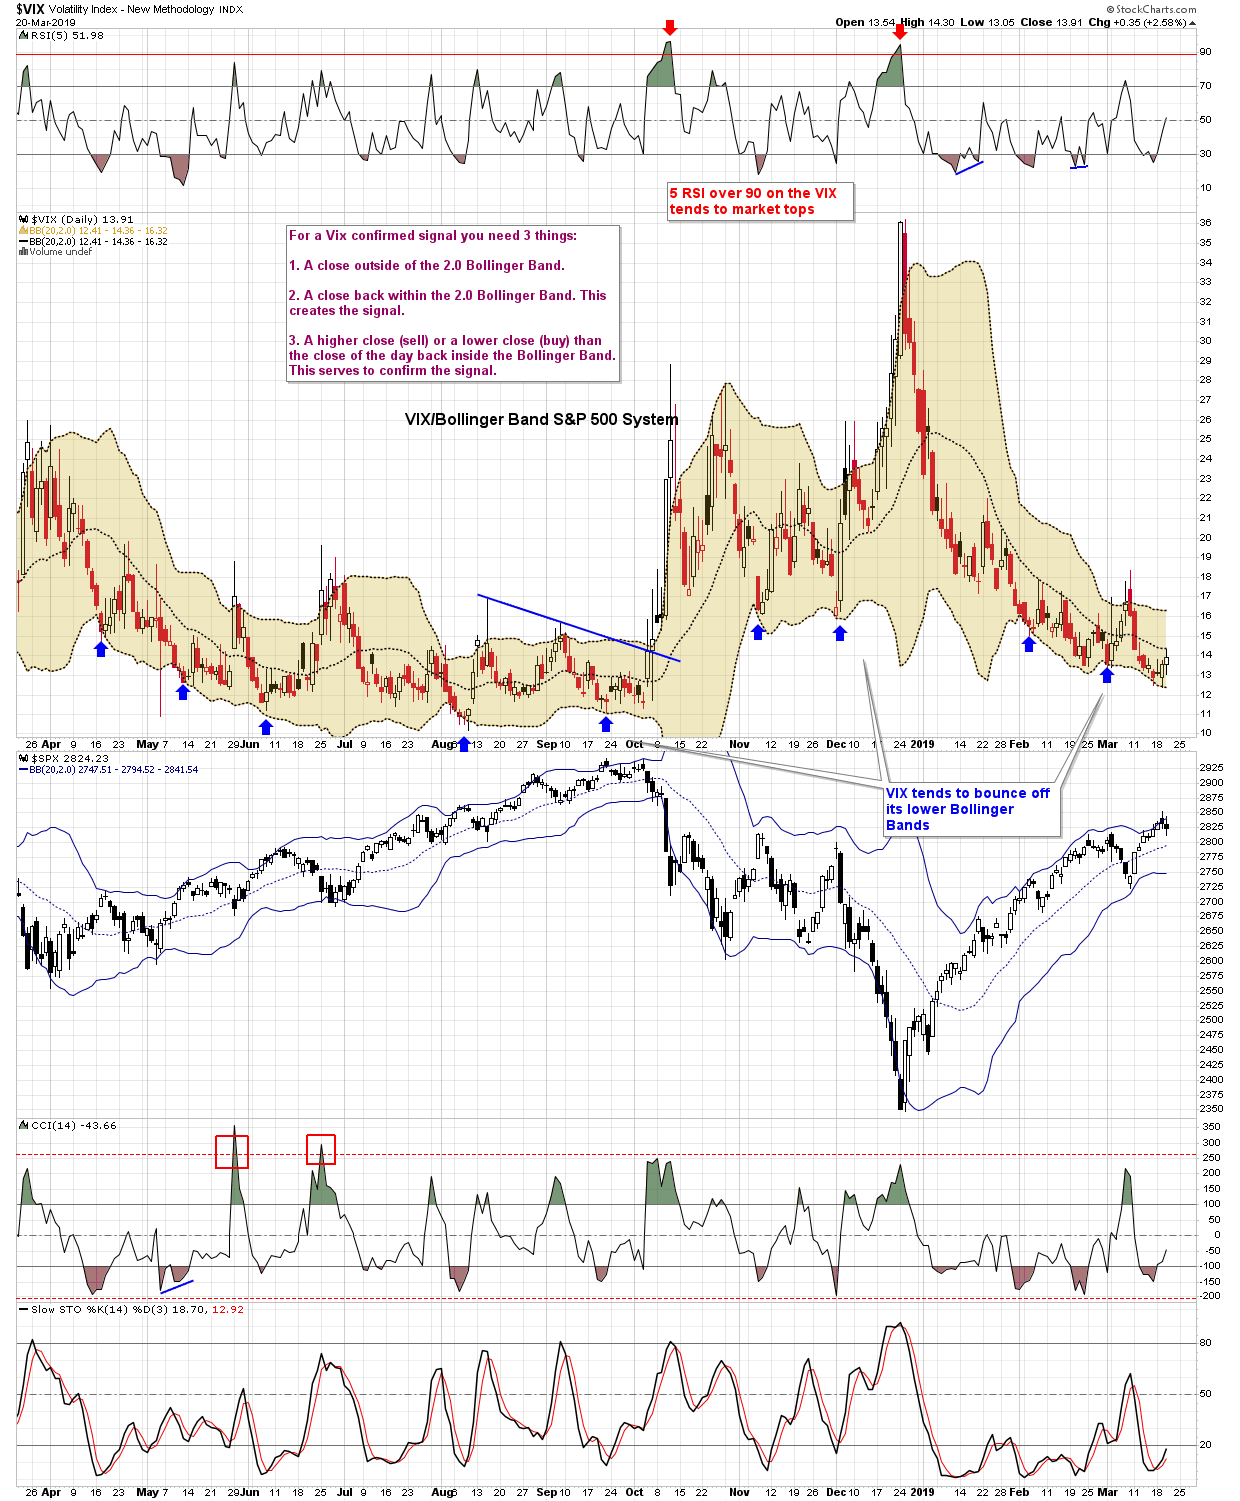
| S&P 500 | SPX - W | SPY - W | -0.29% | 0.06% | 2,824.23 |
| Wilshire 5000 | WLSH - W | -0.33% | 0.02% | 29,200.55 | |
| Nasdaq | COMPQ - W | 0.06% | 0.53% | 7,728.97 | |
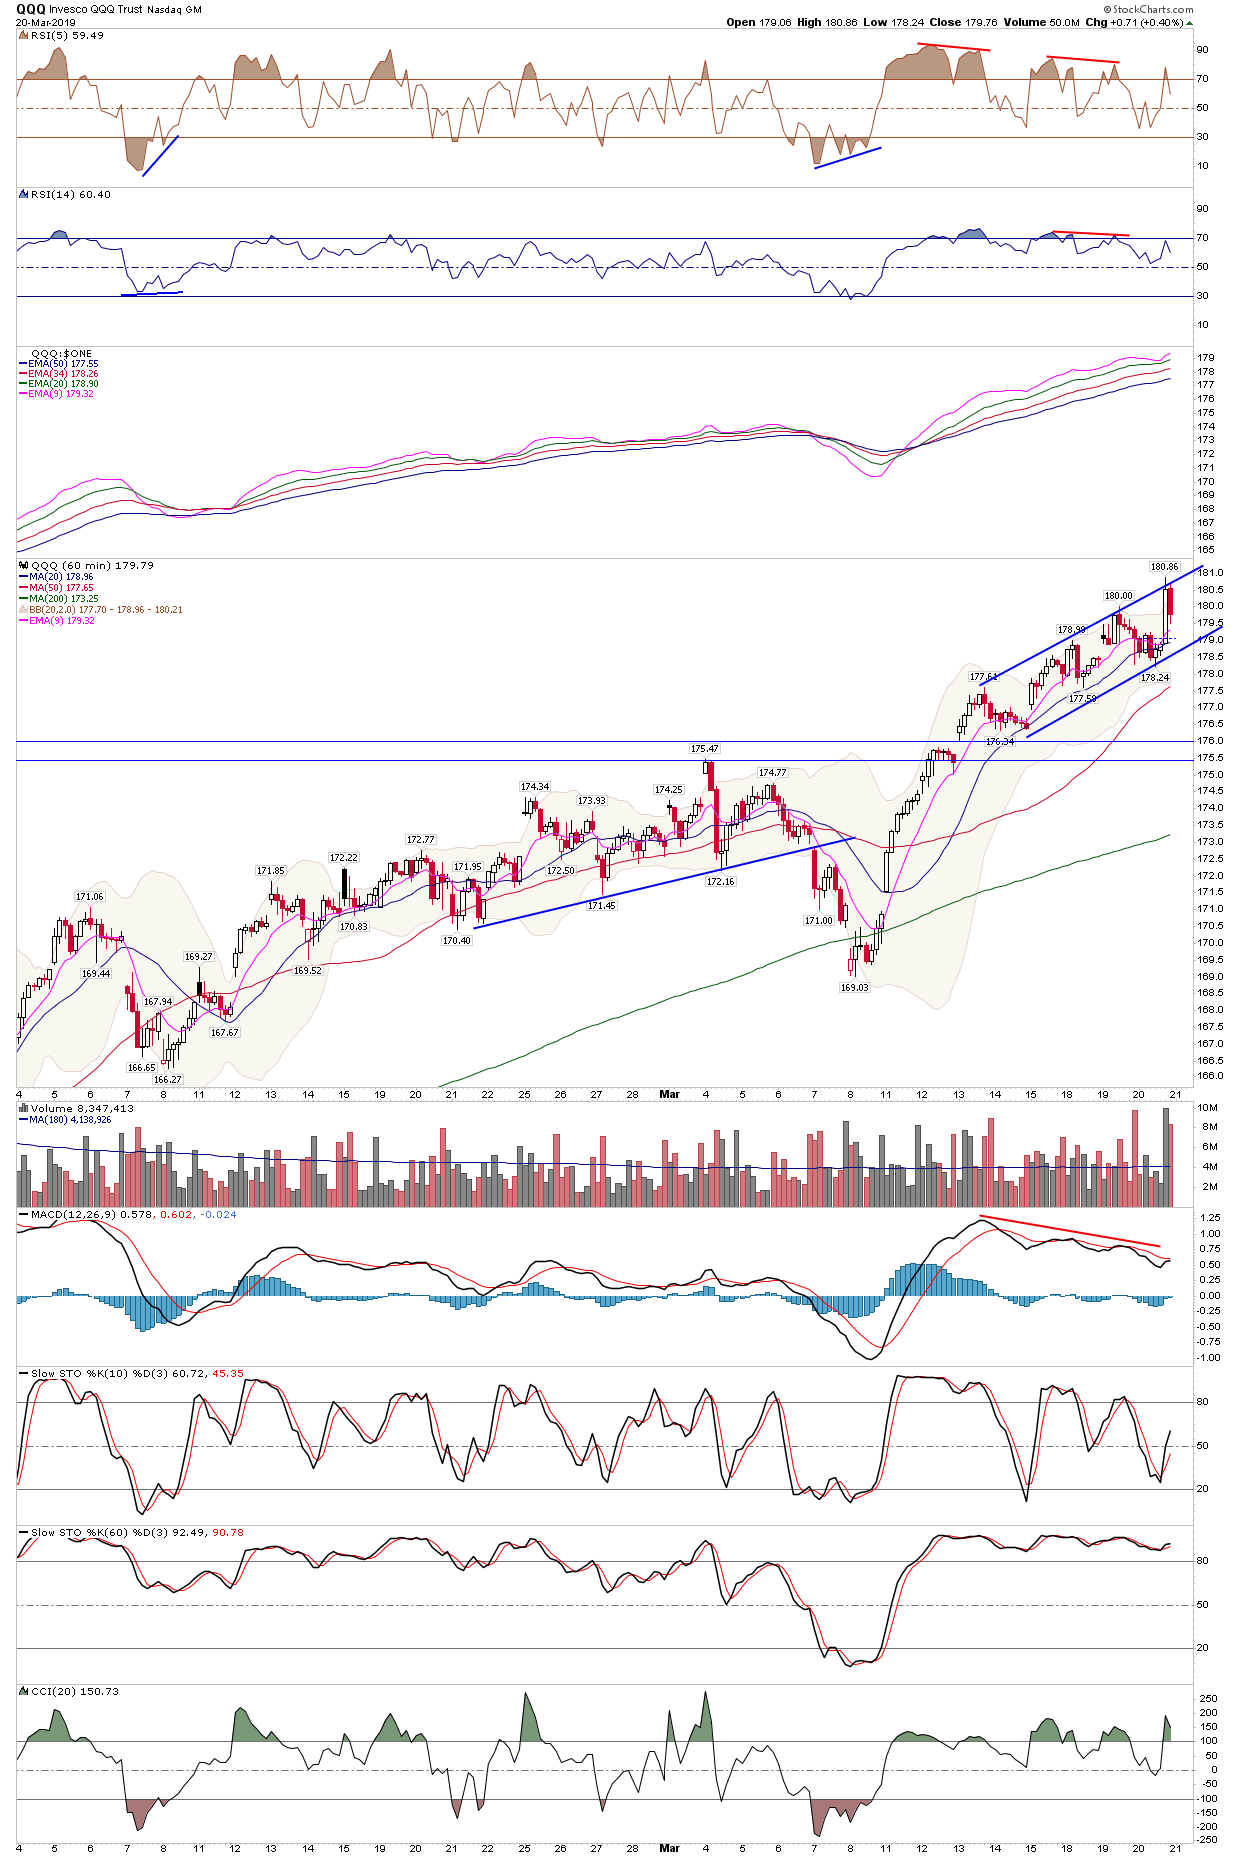
| NDX 100 | NDX - W | QQQ - W | 0.43% | 1.01% | 7,380.75 |
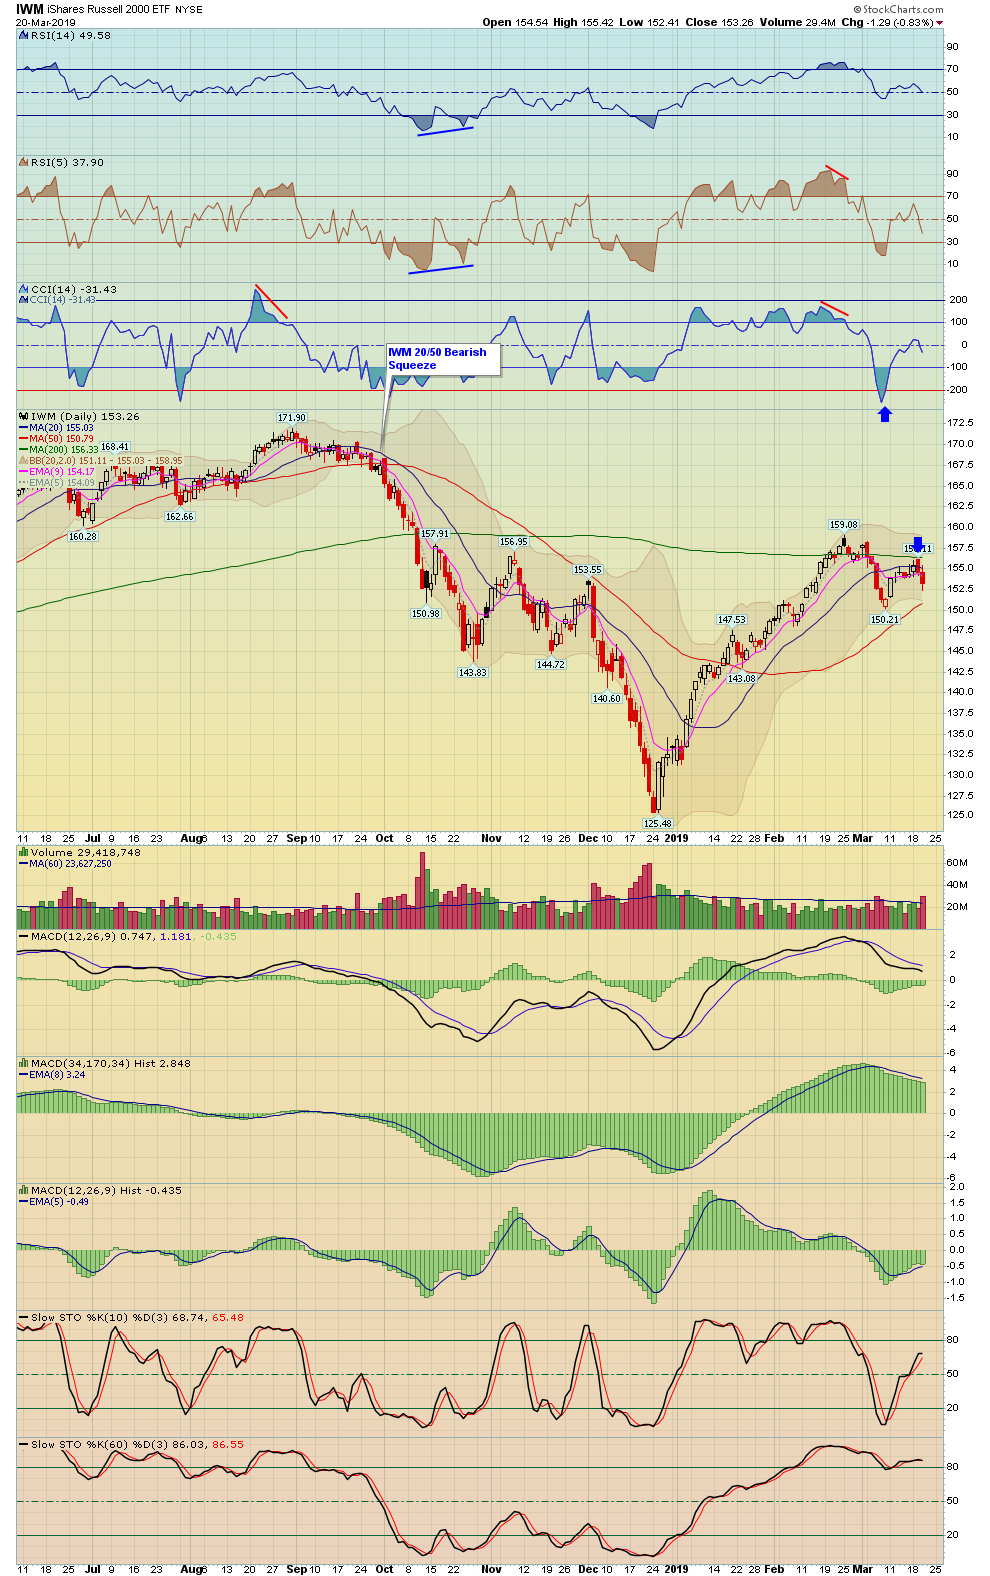
| Russel 2000 (Small Caps) | RUT - W | IWM - W | -0.76% | -0.67% | 1,543.16 |
| Market Sectors | Index Symbol | ETF Symbol | % G / L Day | % G / L Week | Close |
|---|---|---|---|---|---|
| Transports | TRAN - W | IYT - W | -1.30% | -1.62% | 10,143.26 |
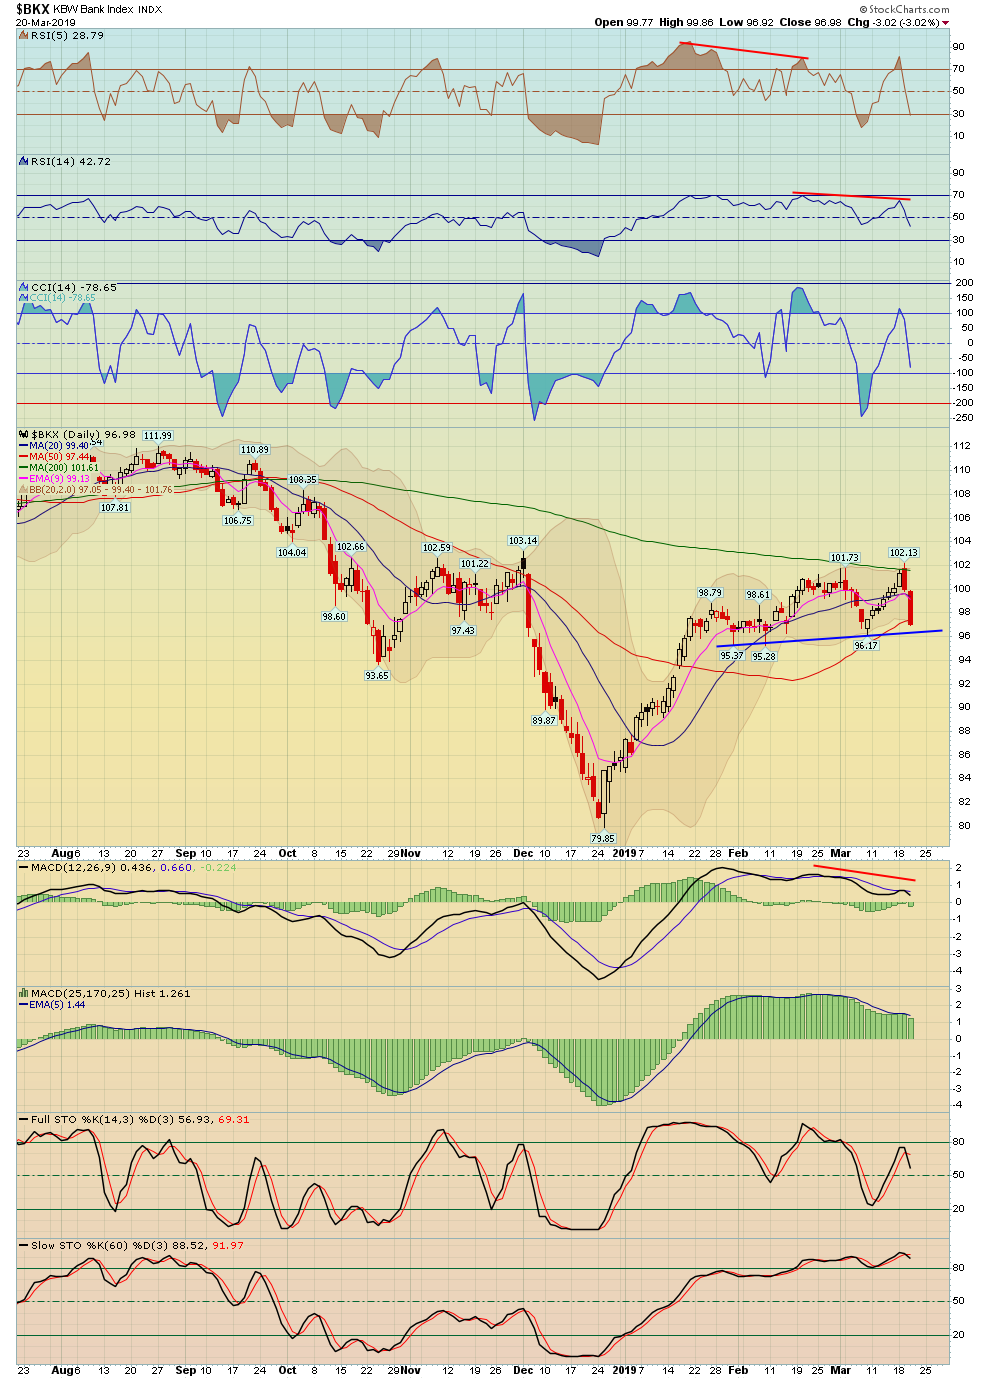
| Banks | BKX - W | -3.02% | -3.04% | 96.98 | |
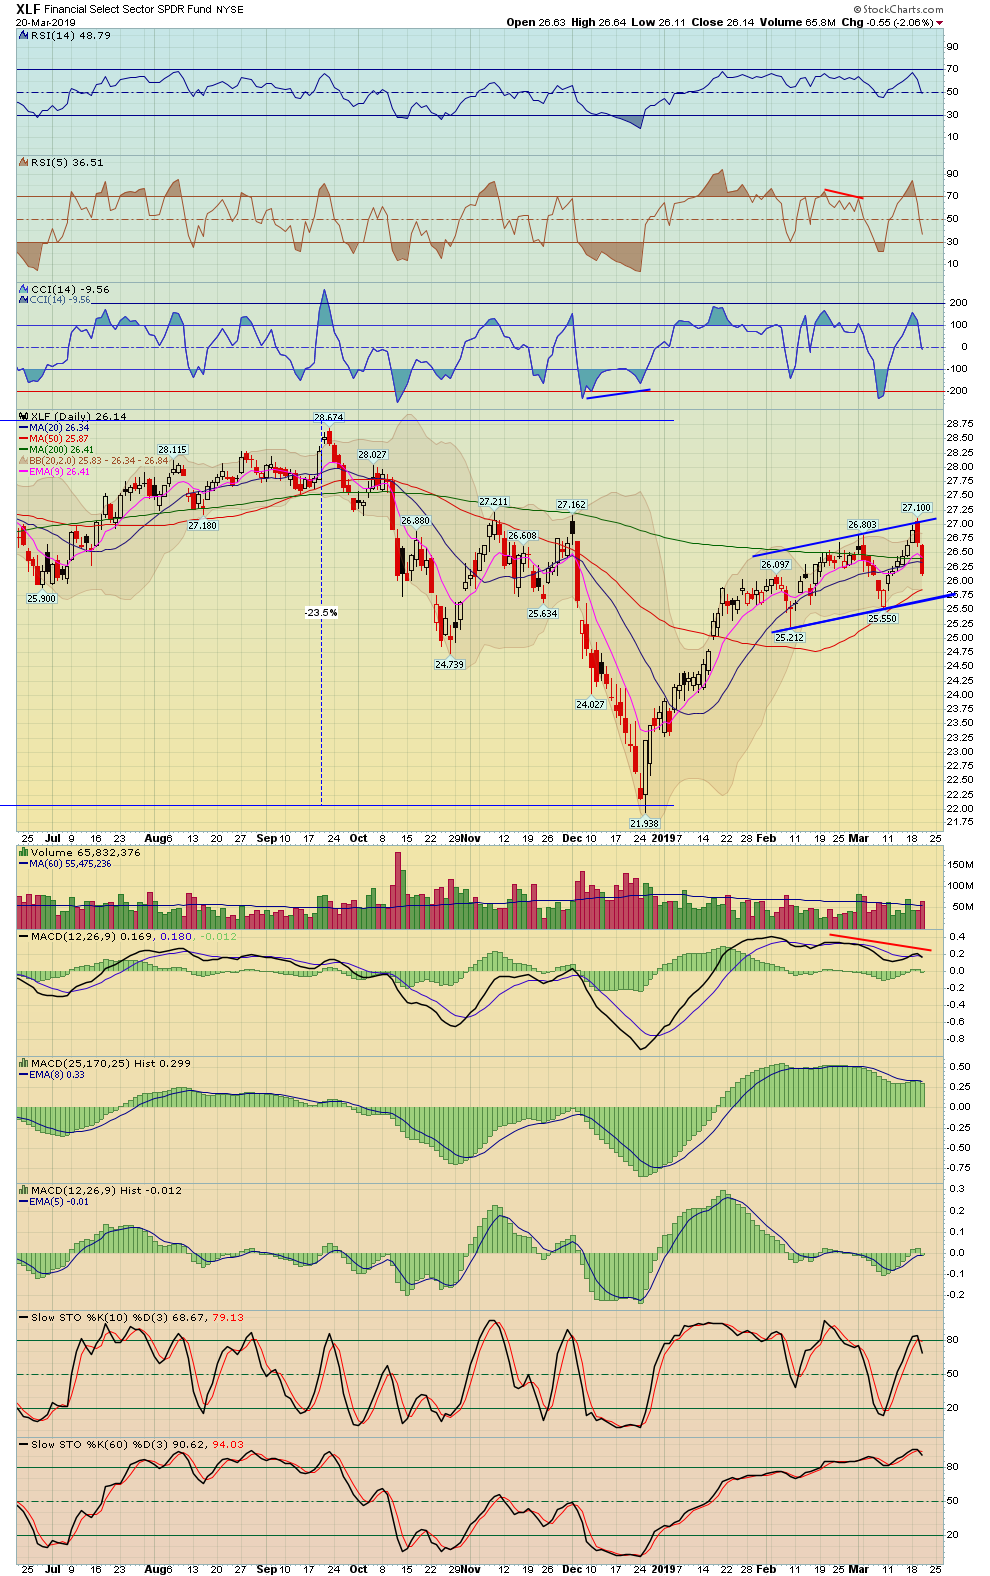
| Financials | XLF - W | -2.06% | -1.84% | 26.14 | |
| Brokers | XBD - W | -1.96% | -1.61% | 258.59 | |
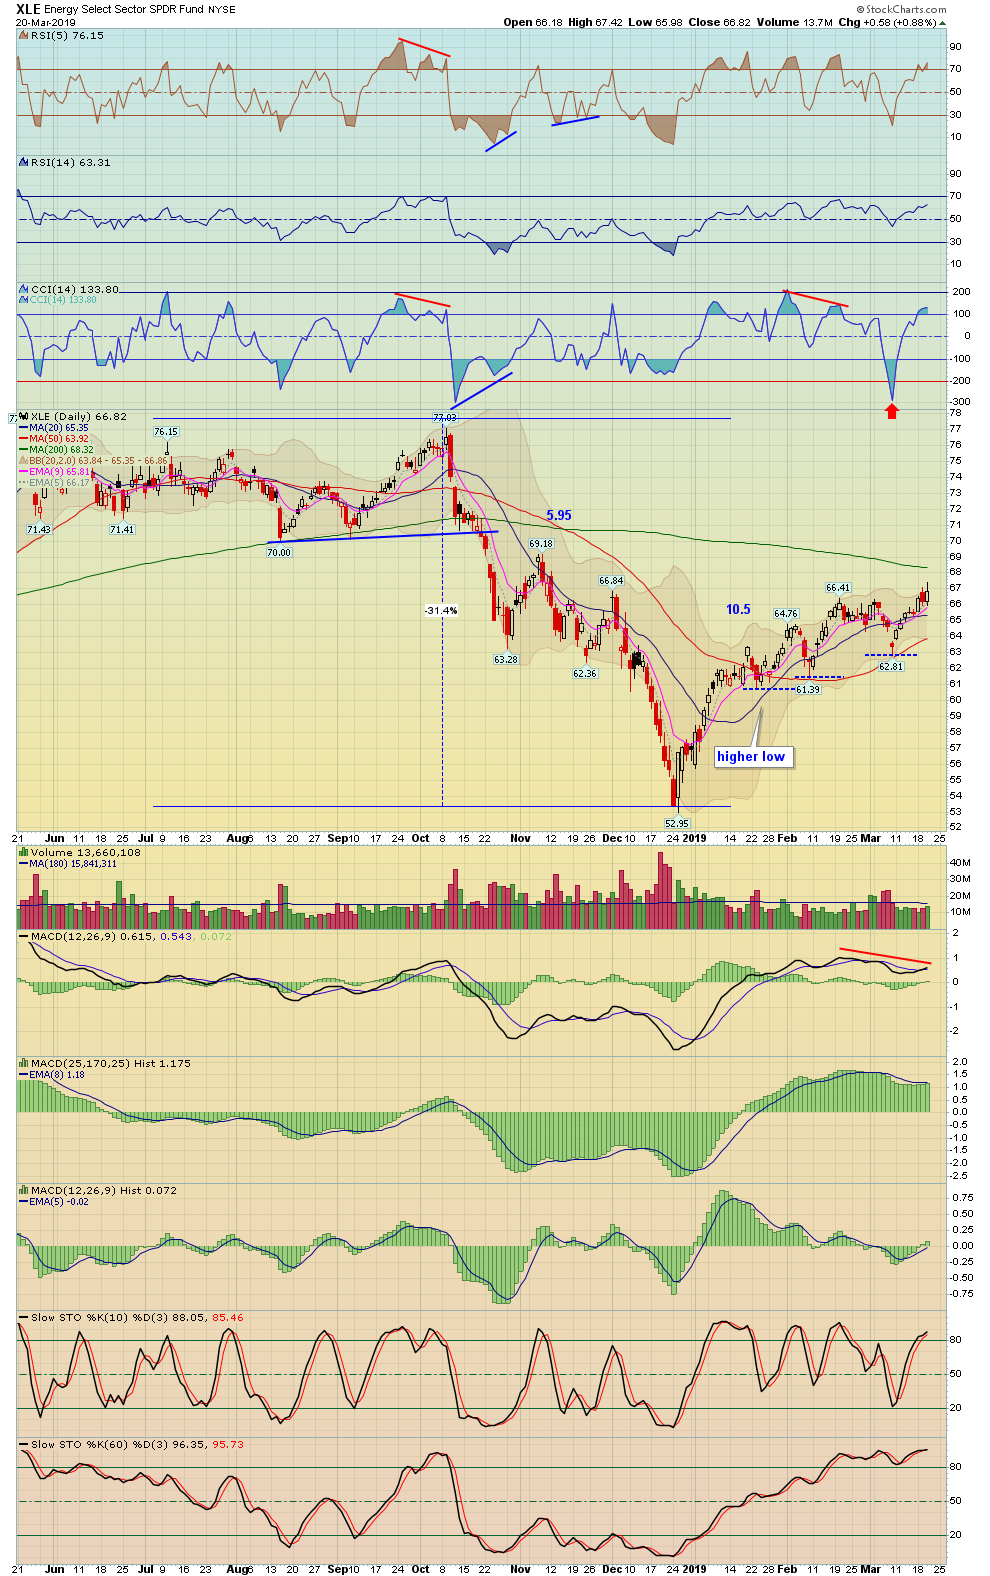
| XLE (Energy Select) | XLE - W | 0.88% | 2.00% | 66.82 | |
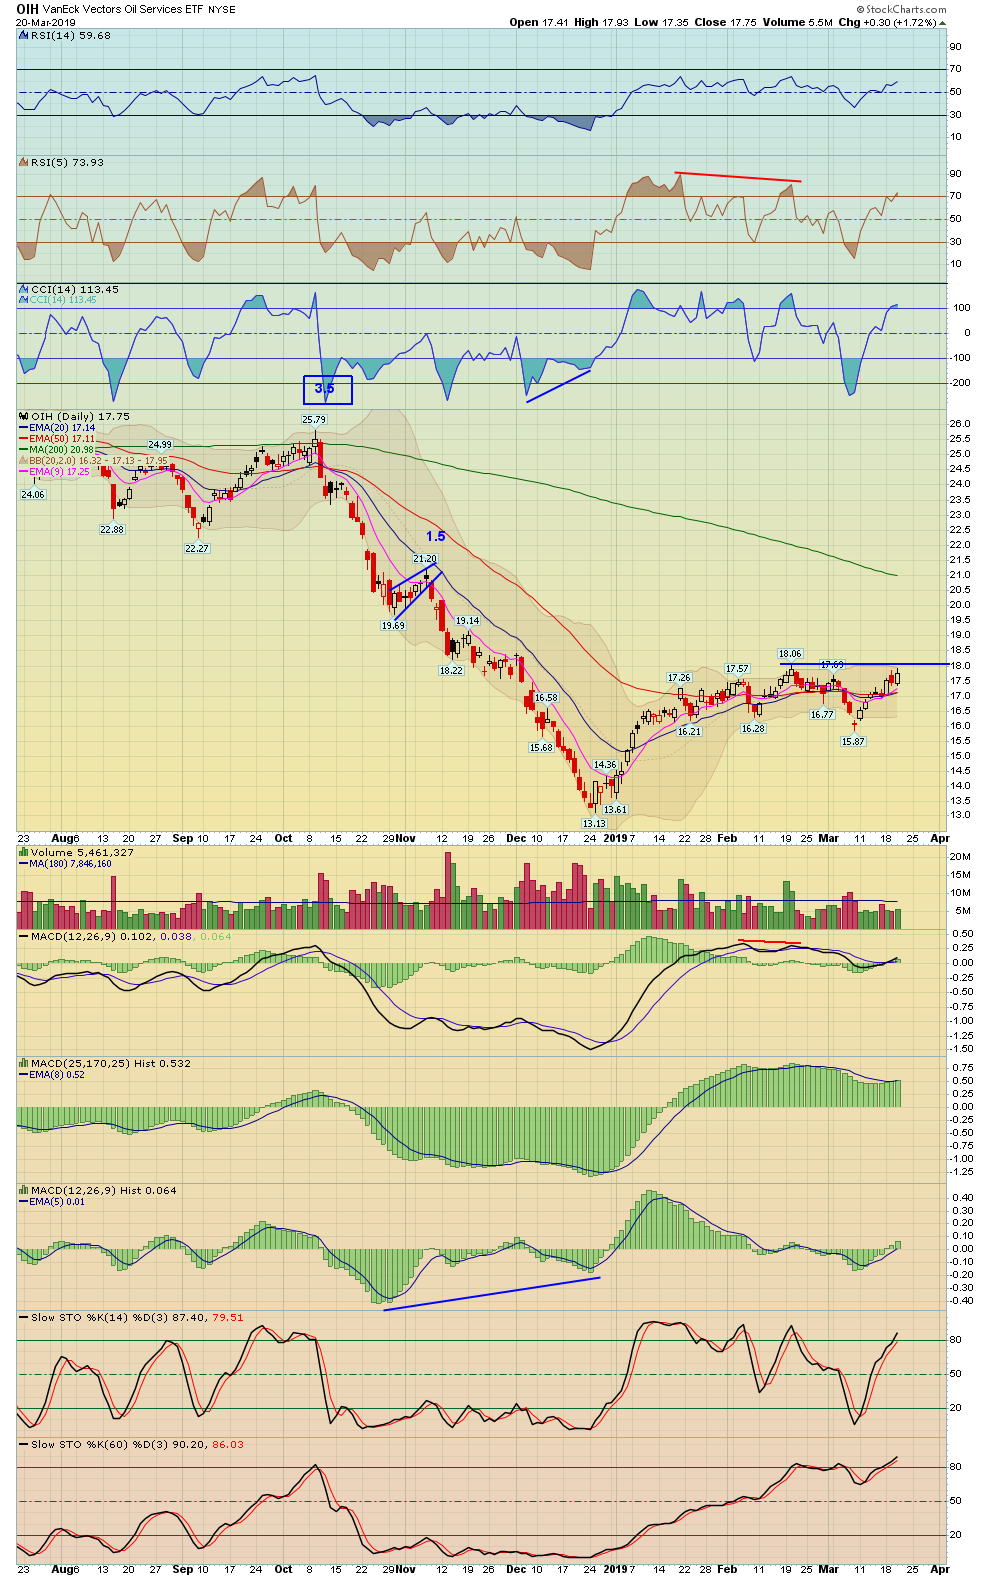
| Oil Service Holders | OIH - W | 1.72% | 4.47% | 17.75 | |
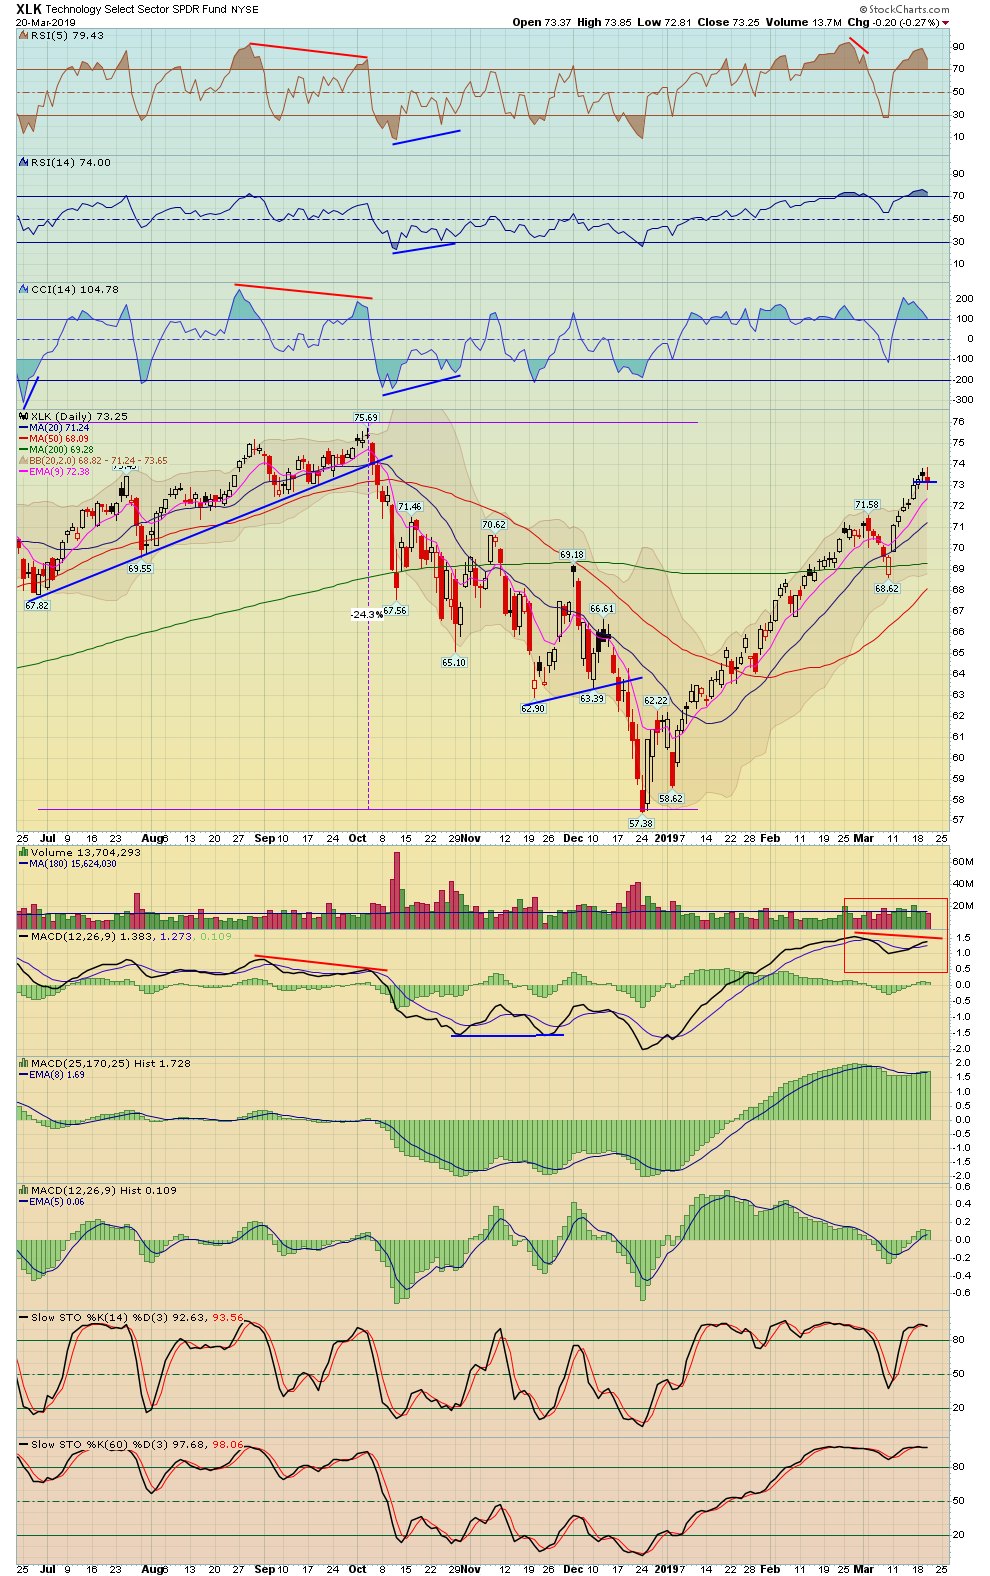
| Technology | XLK - W | -0.27% | 0.36% | 73.25 | |
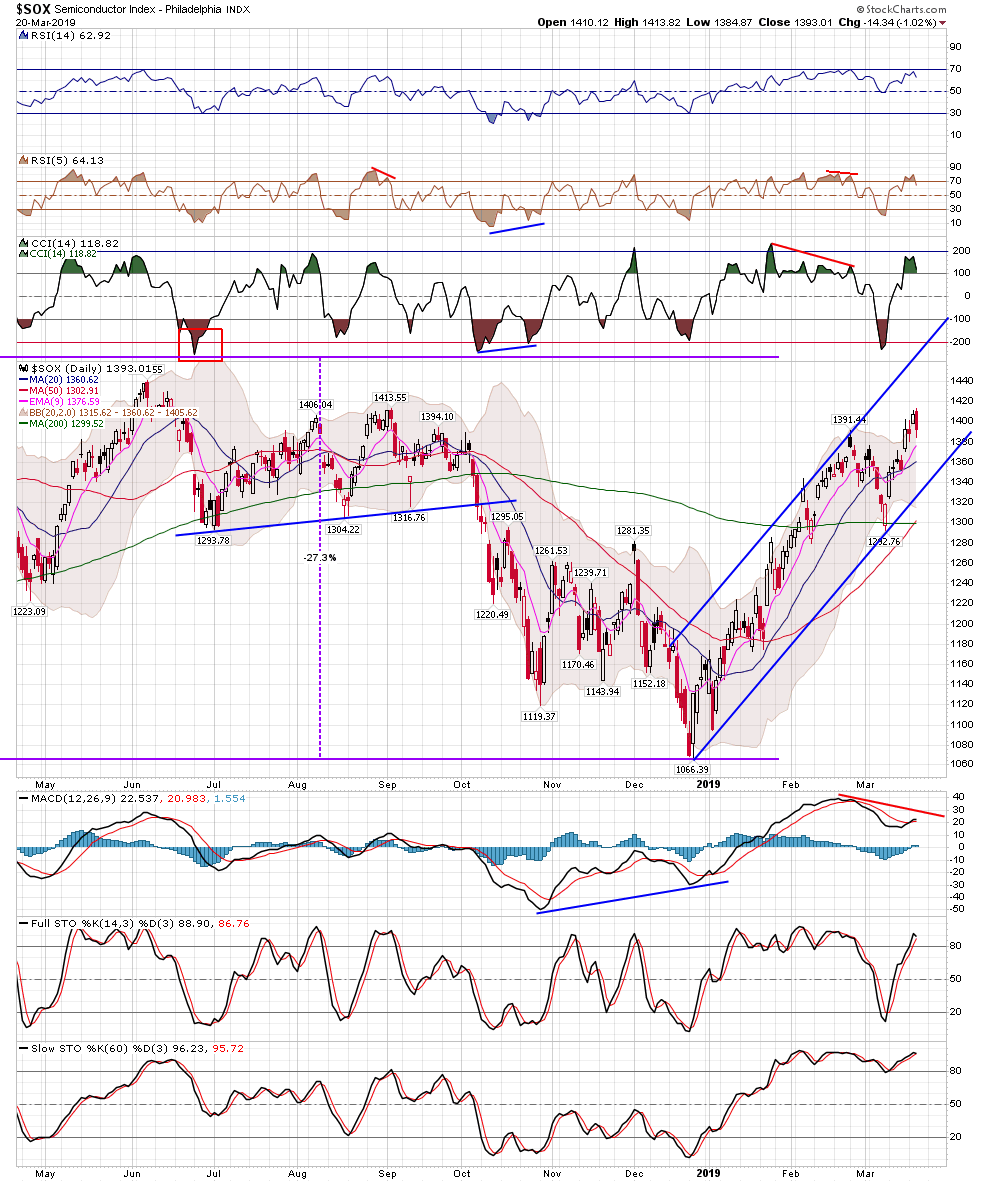
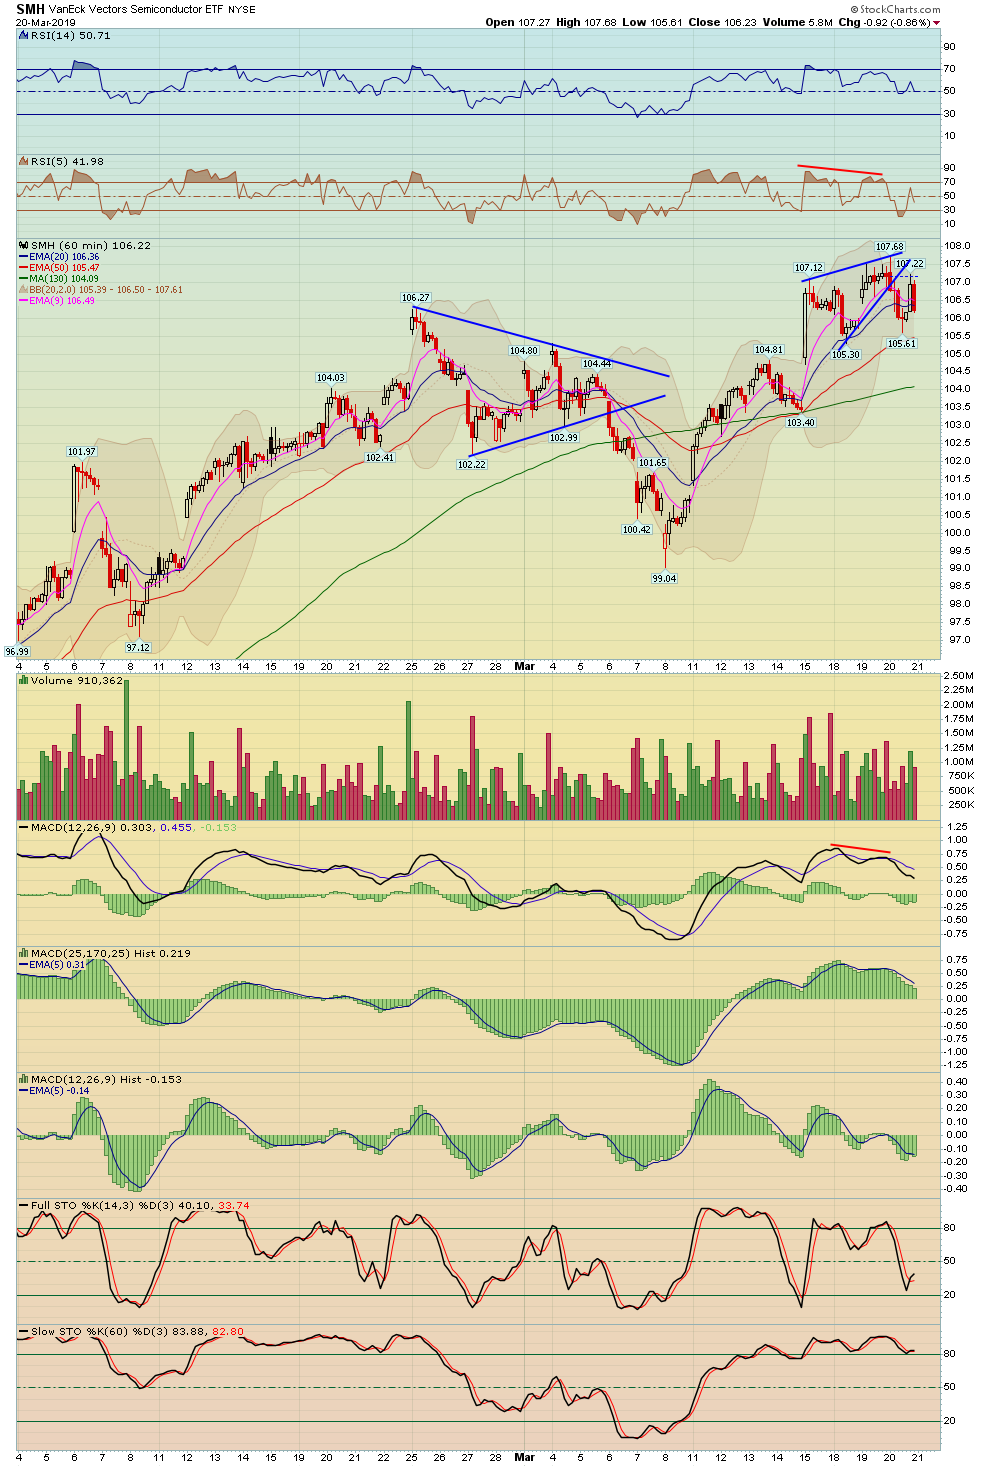
| Semiconductor | SOX - W | SMH - W | -1.02% | 0.05% | 1,393.01 |
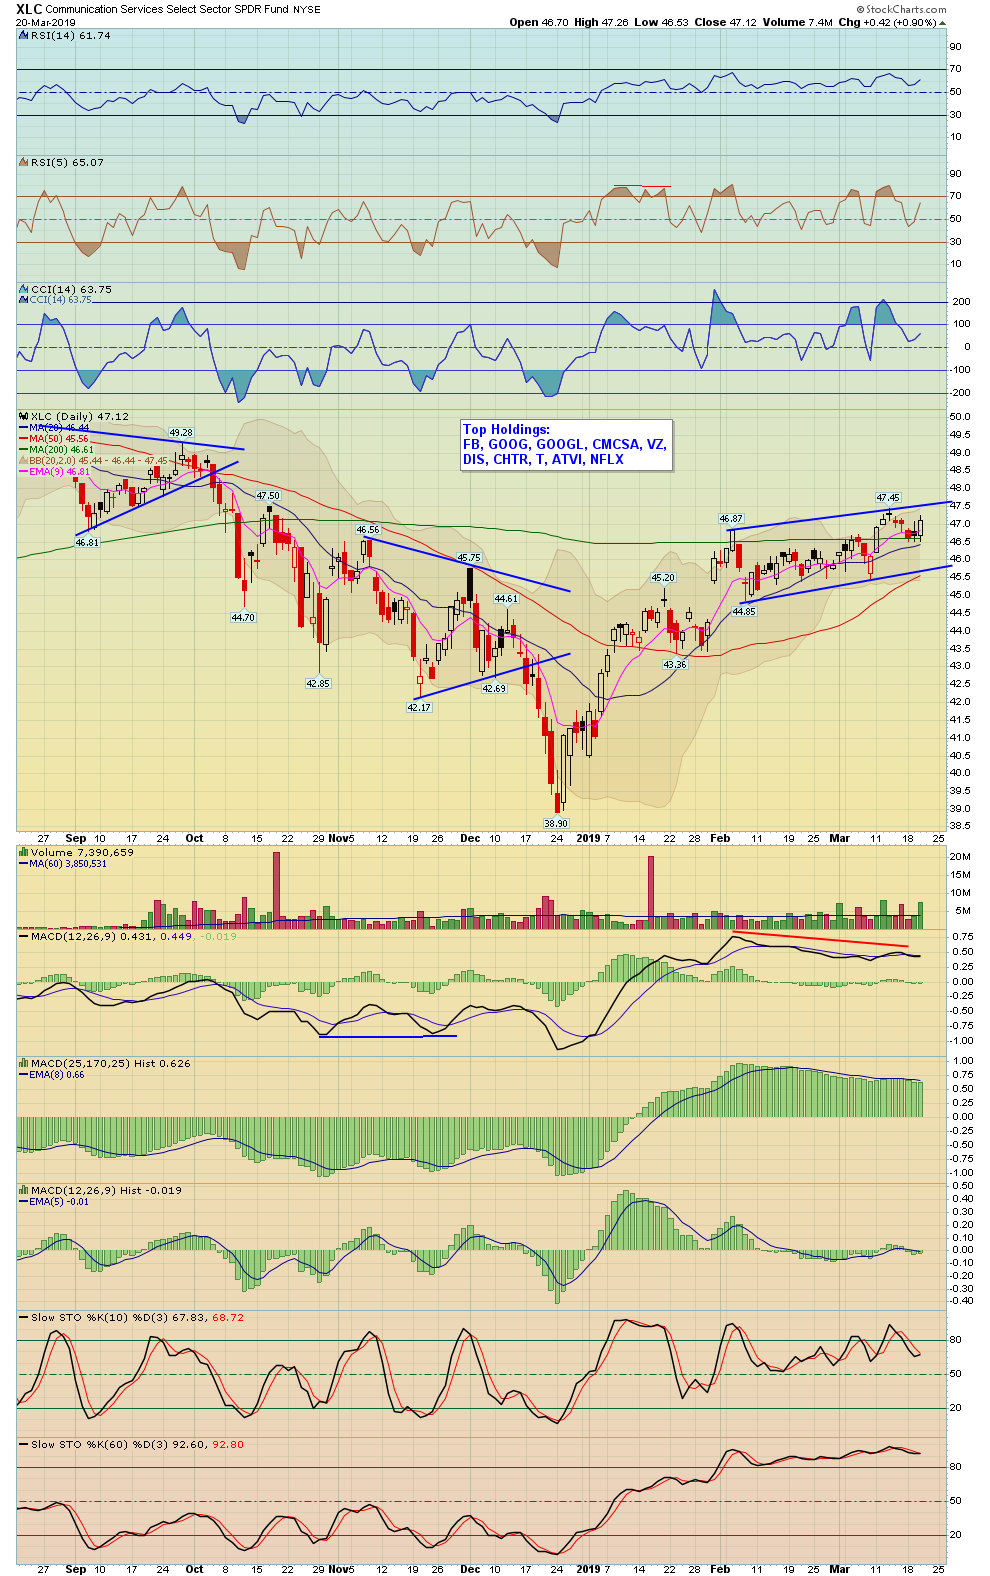
| Communication Services | XLC - W | 0.90% | 0.21% | 47.12 | |
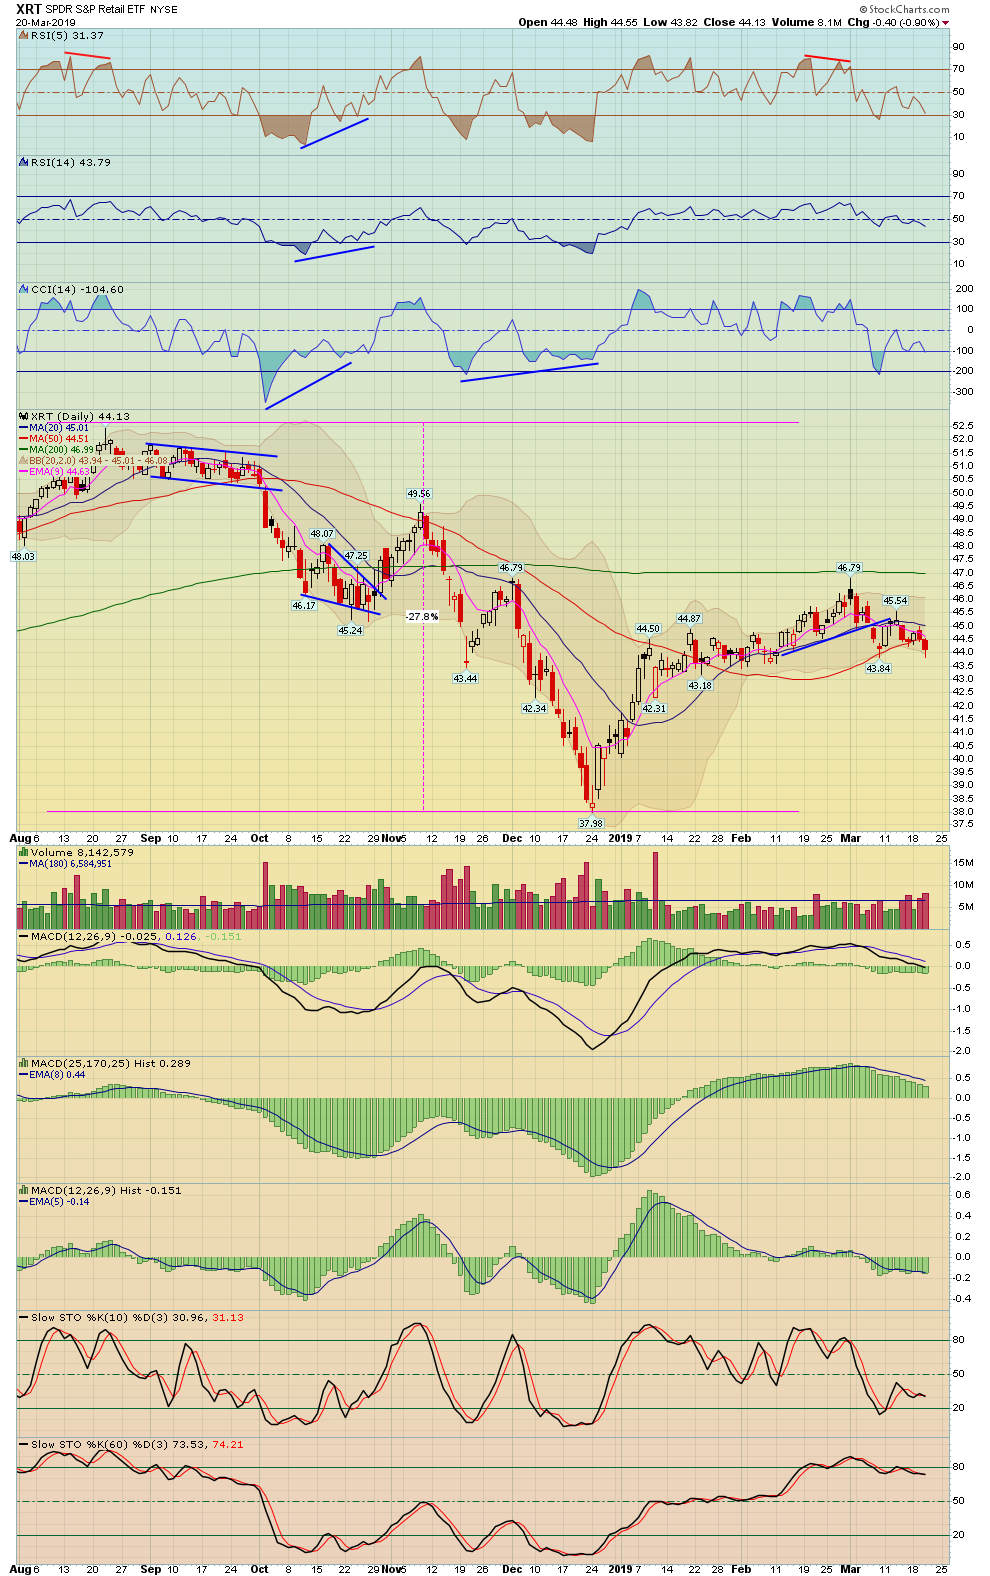
| Retail | XRT - W | -0.90% | -0.63% | 44.13 | |
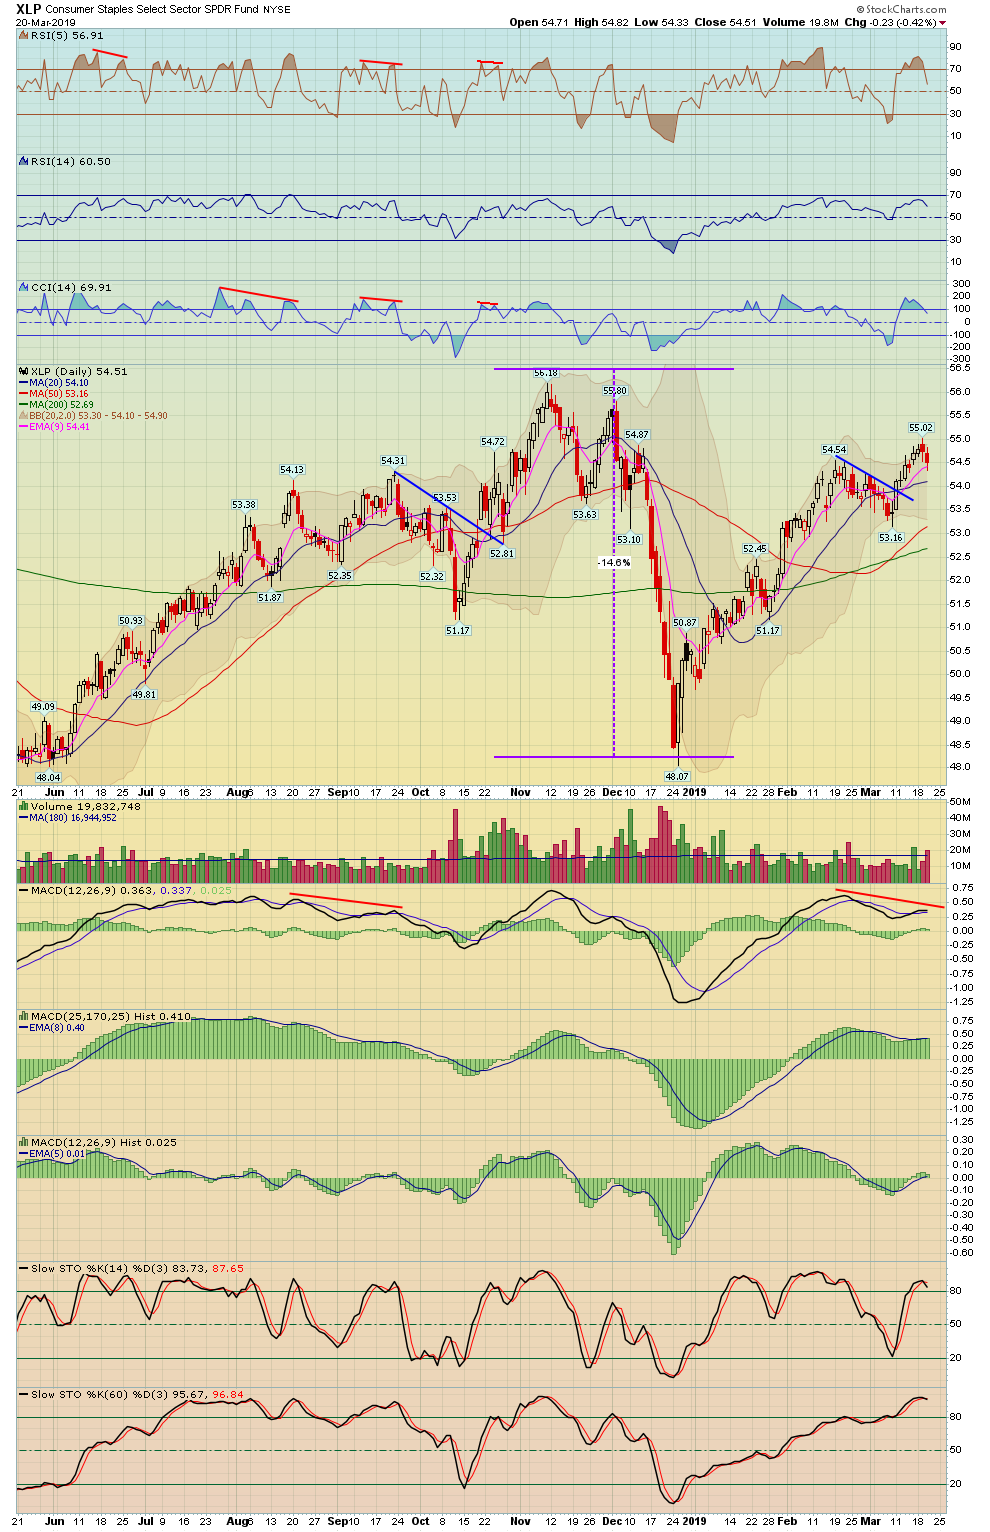
| Consumer Staples | XLP - W | -0.42% | -0.35% | 54.51 | |
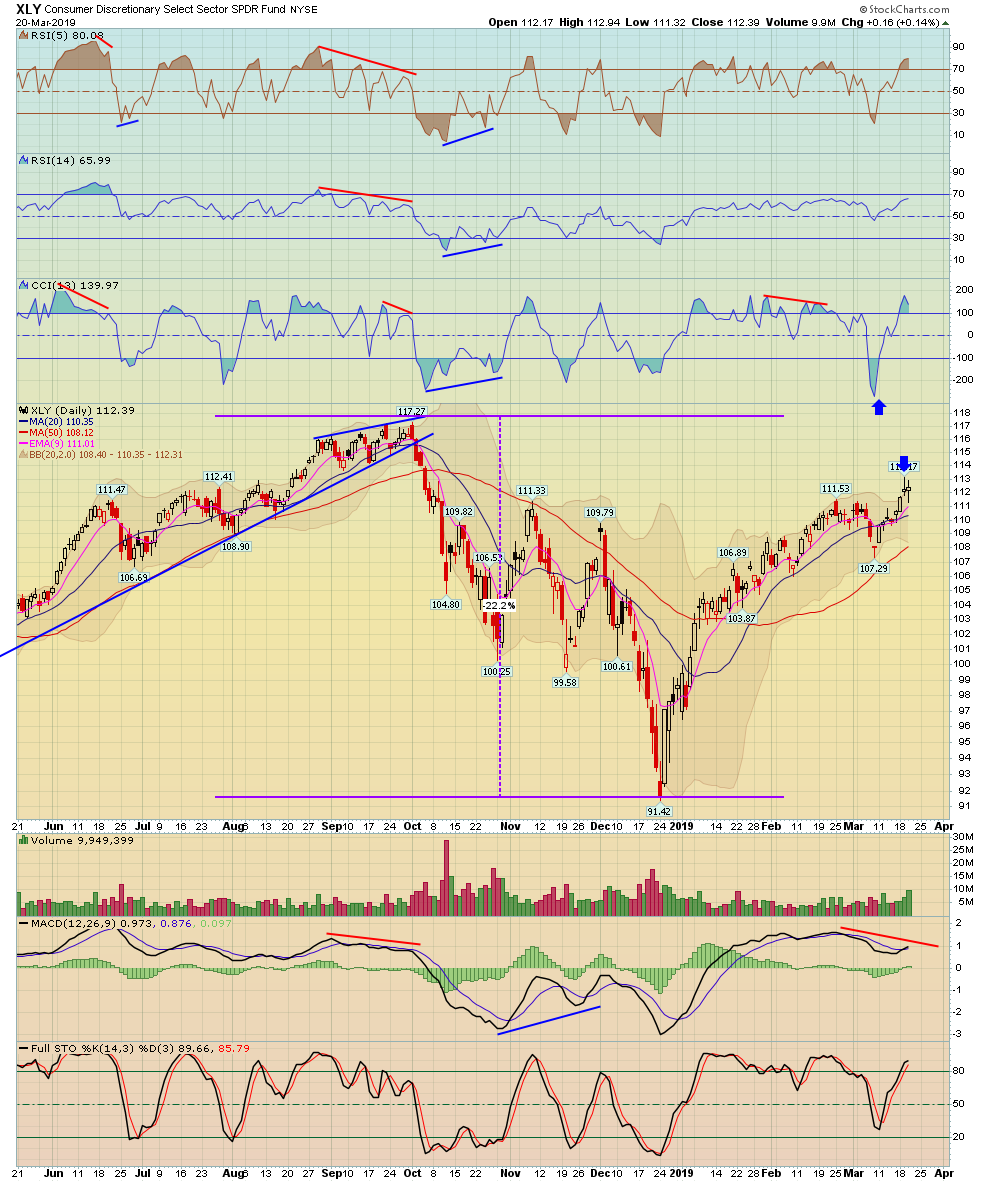
| Consumer Discretionary | XLY - W | 0.14% | 1.62% | 112.39 | |
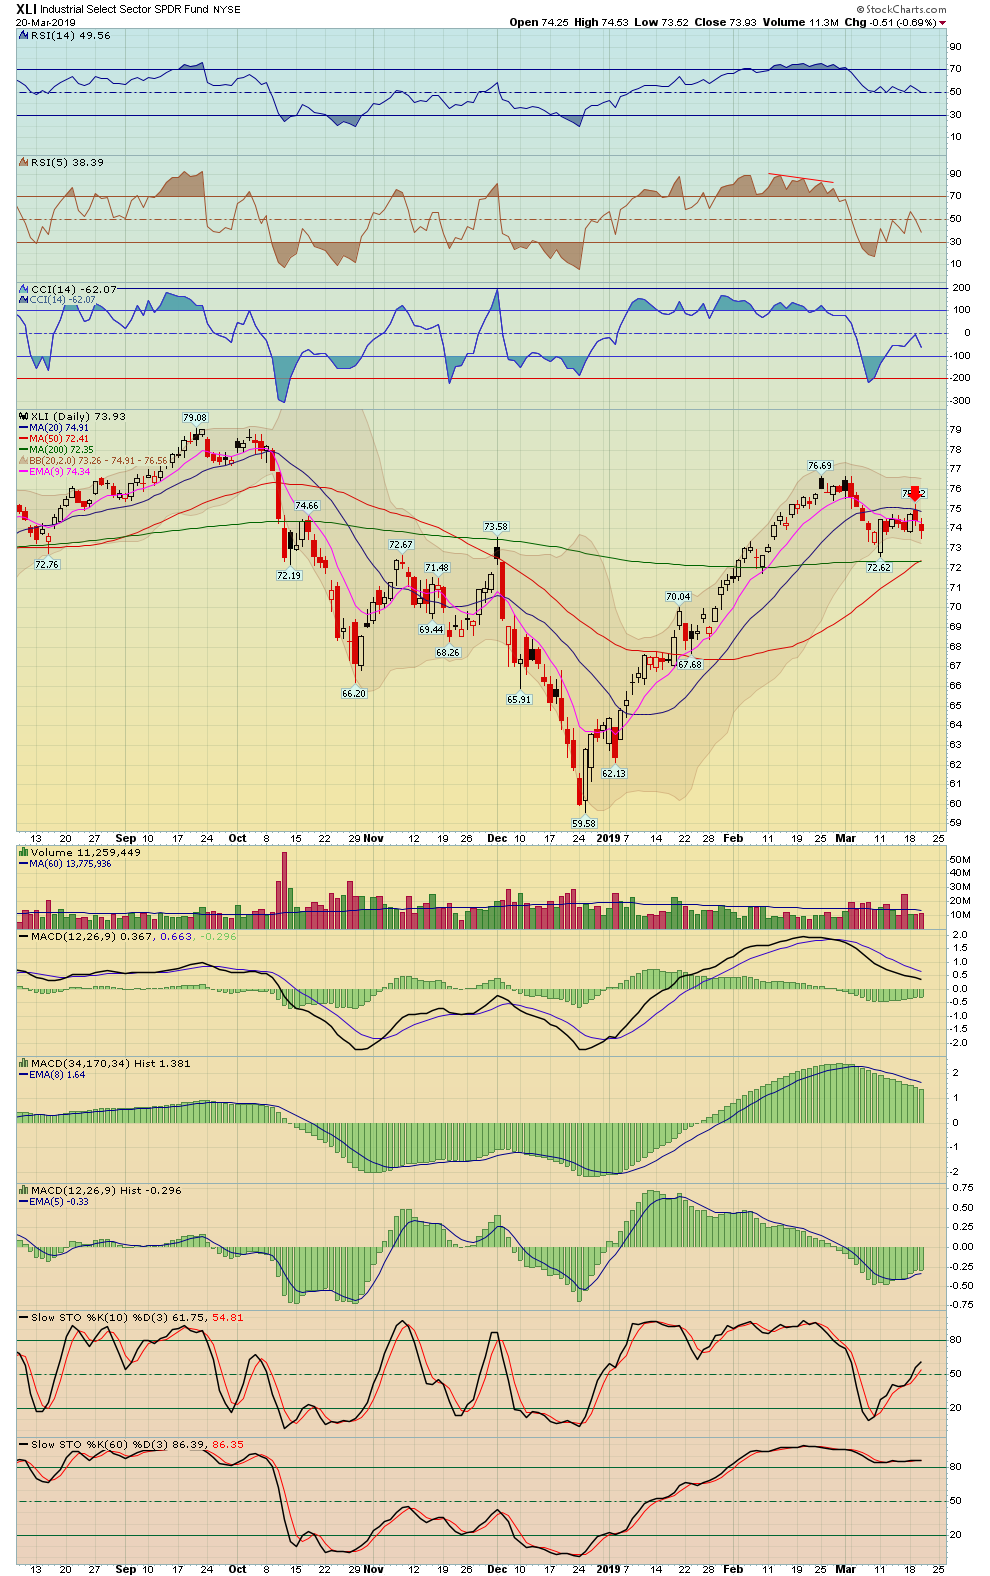
| Industrials | XLI - W | -0.69% | -0.08% | 73.93 | |
| Real Estate | IYR - W | 0.33% | -0.52% | 84.96 | |
| Homebuilders | HGX - W | XHB - W | -0.56% | -1.14% | 282.33 |
| Materials | XLB - W | -0.09% | 0.02% | 55.41 | |
| Metals And Mining | XME - W | -0.07% | 0.57% | 29.75 | |
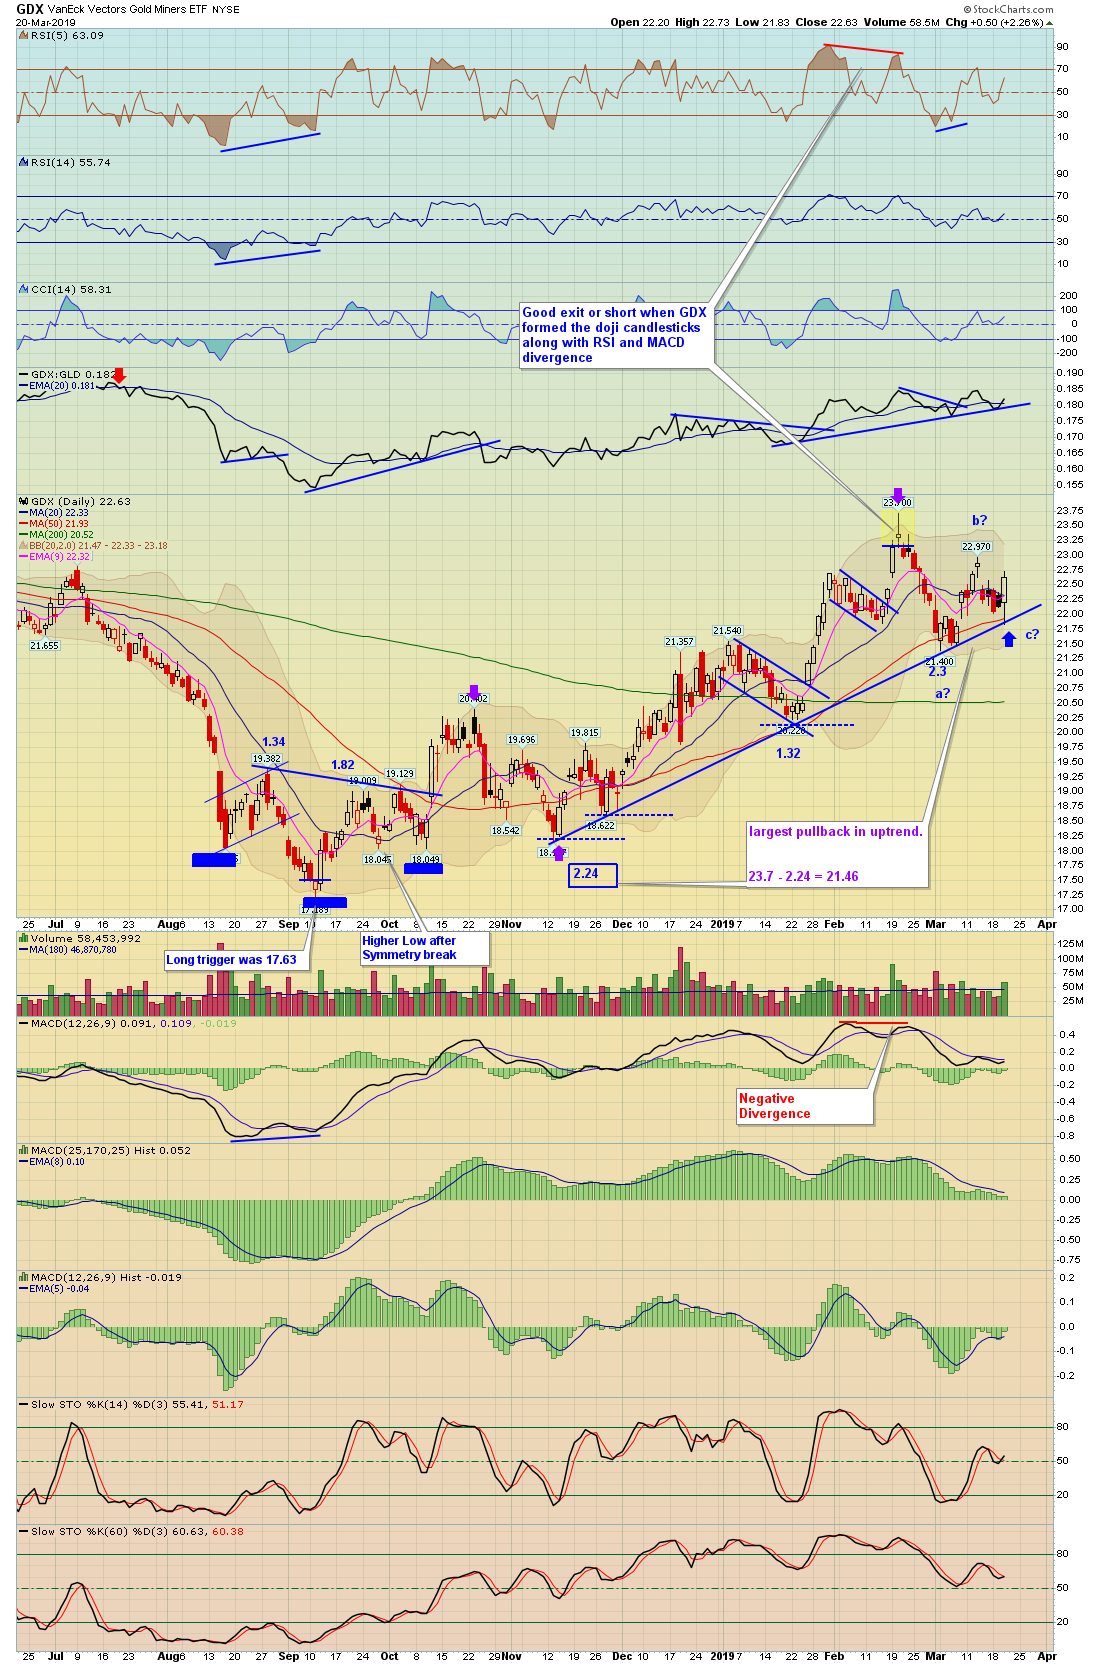
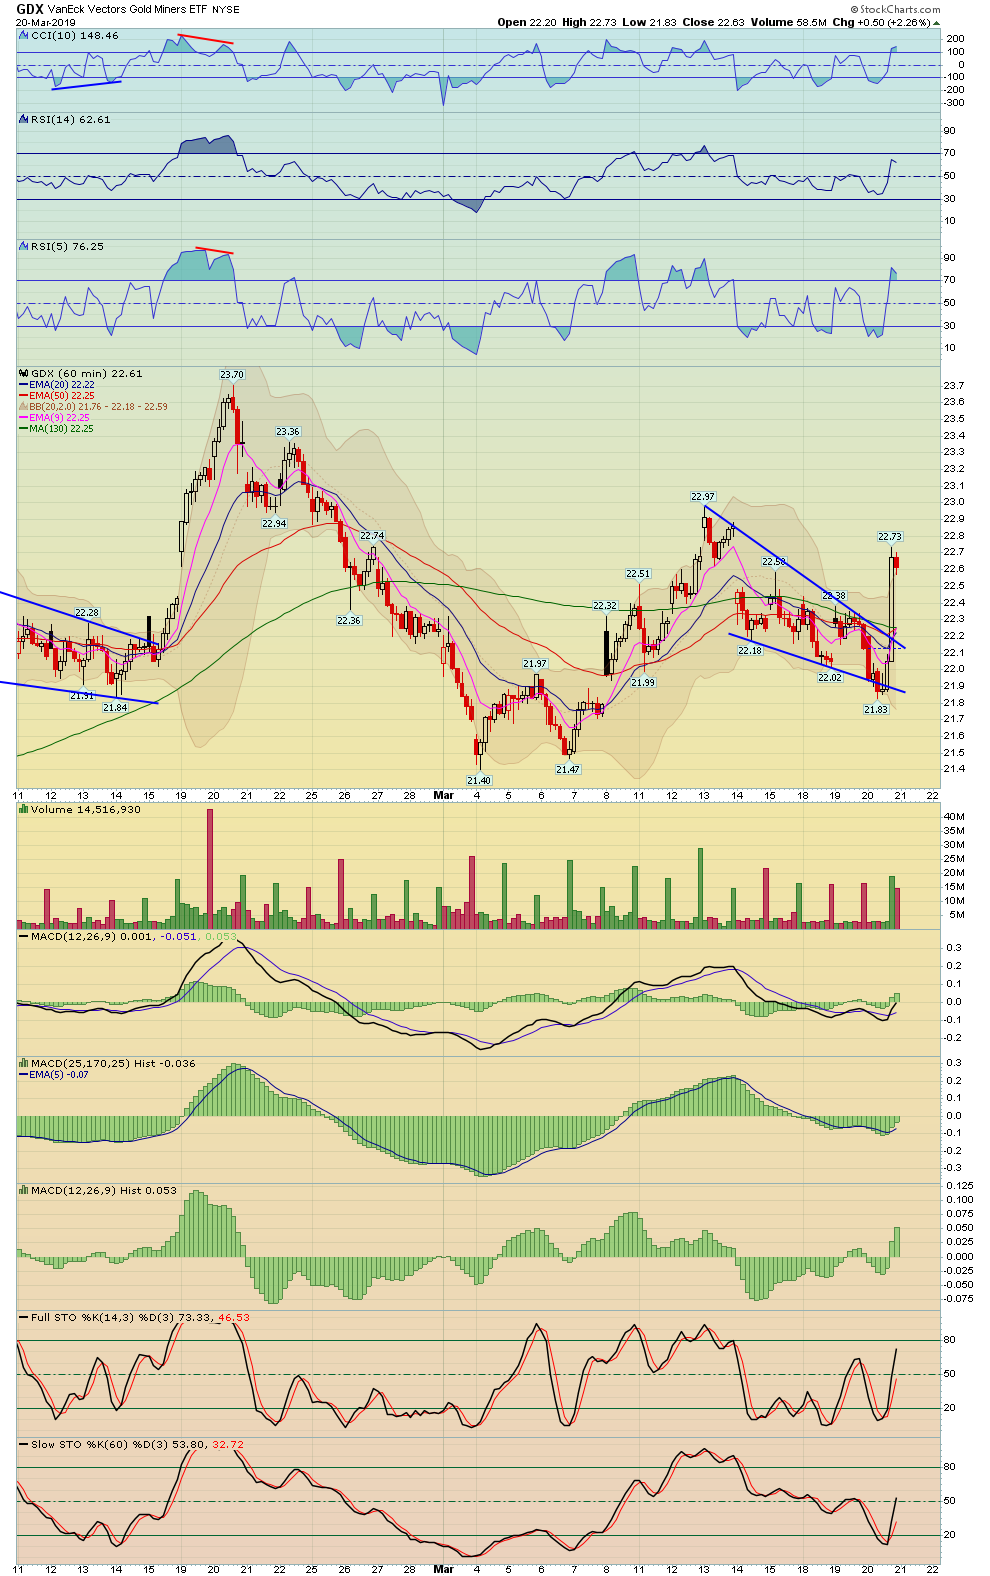
| GDX Gold Miners ETF | GDX - W | 2.26% | 1.48% | 22.63 | |
| Biotechnology | BTK - W | XBI - W | -0.72% | -0.86% | 5,102.01 |
| Healthcare | XLV - W | -0.69% | -0.05% | 91.94 | |
| Drugs | DRG - W | 0.00% | 0.65% | 600.60 | |
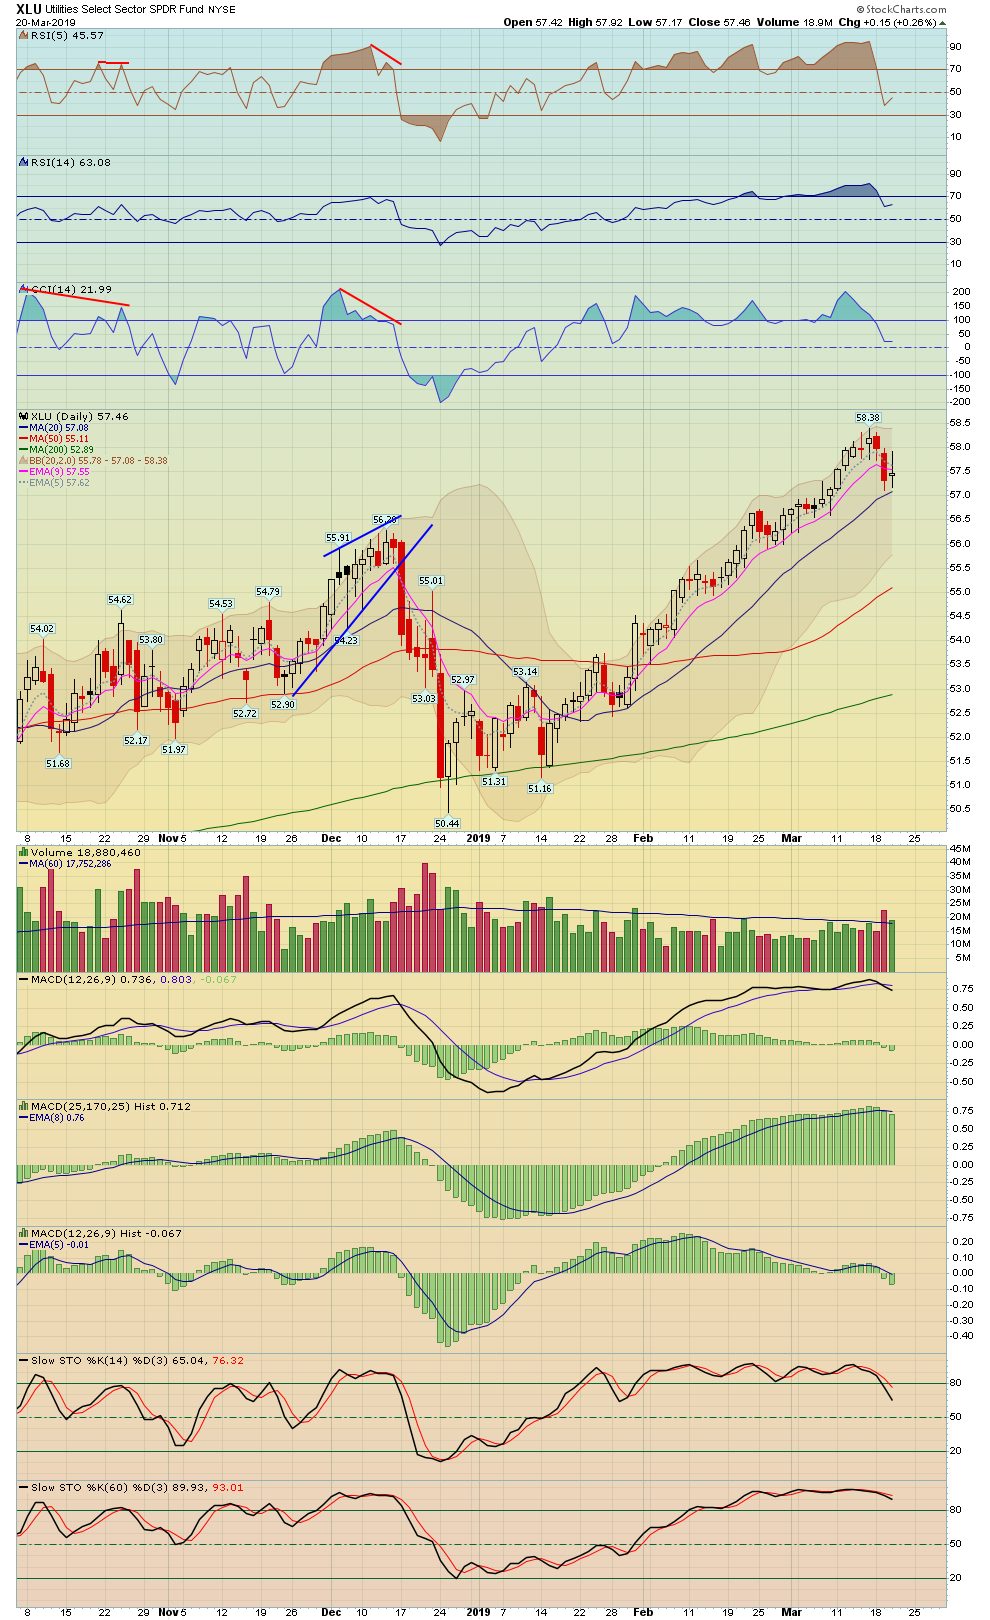
| Utilities | UTIL - W | XLU - W | 0.35% | -1.08% | 770.92 |
| Currencies | Index Symbol | ETF Symbol | % G / L Day | % G / L Week | Close |
|---|---|---|---|---|---|
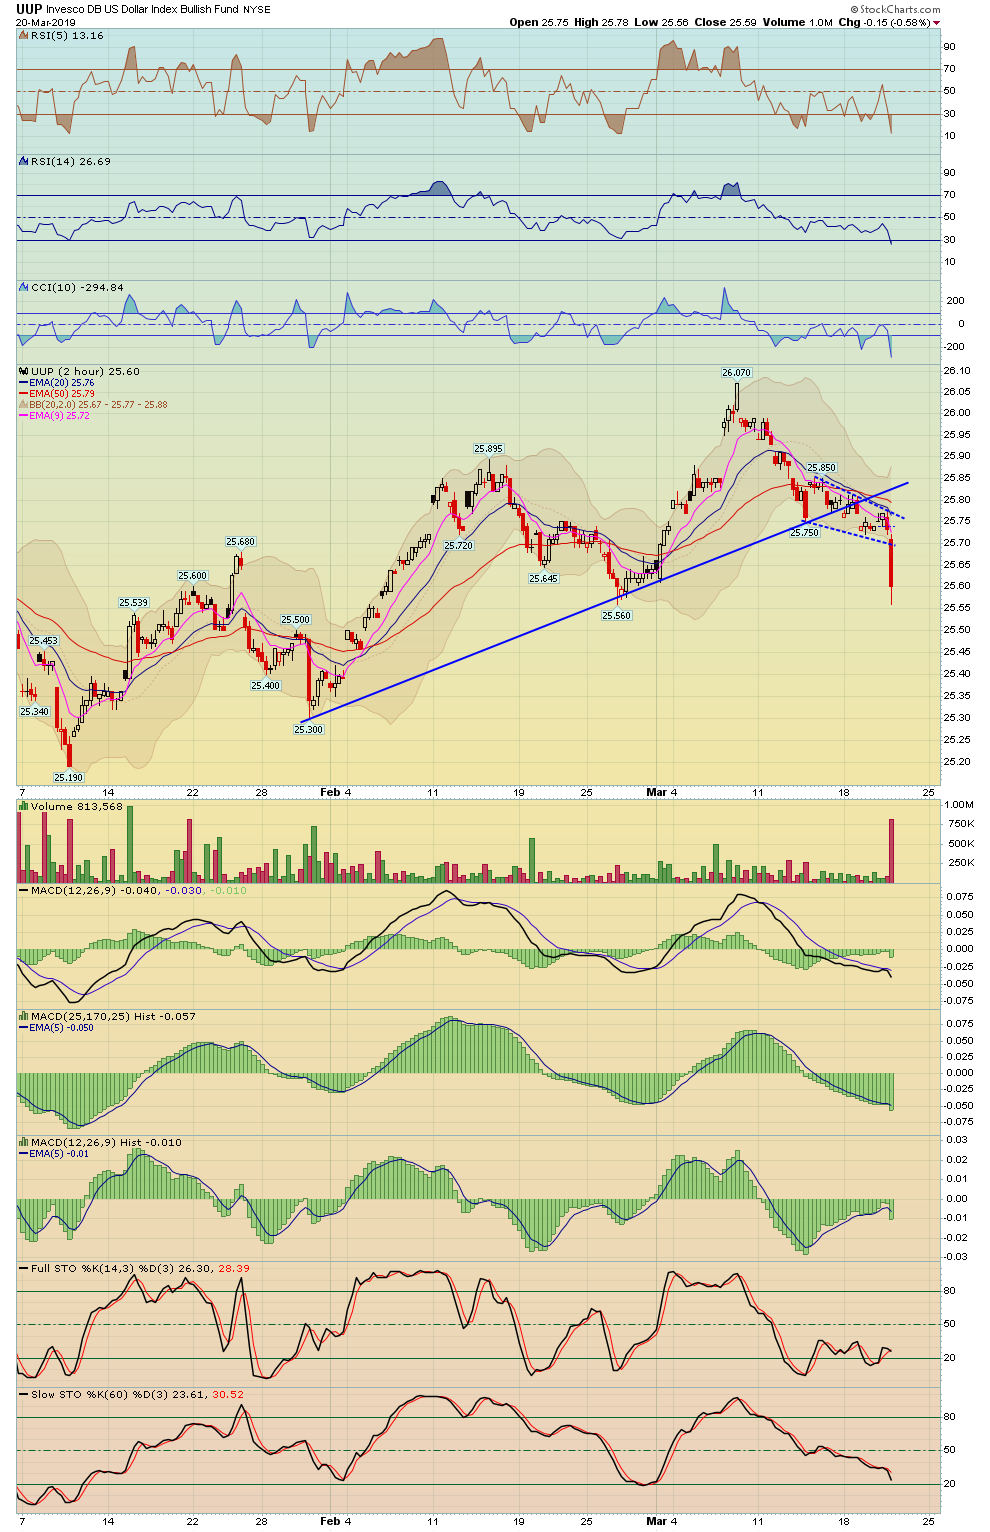
| US Dollar | UUP - W | -0.58% | -0.81% | 25.59 | |
| Euro | XEU - W | FXE - W | 0.56% | 0.58% | 114.15 |
| Yen | XJY - W | FXY - W | 0.64% | 0.72% | 90.36 |
| Australian | XAD - W | FXA - W | 0.36% | 0.35% | 71.15 |
| British Pound | XBP - W | FXB - W | -0.44% | -0.69% | 132.07 |
| Chinese Yuan | CYB - W | 0.50% | 0.46% | 26.22 | |
| Canadian Dollar | CDW - W | FXC - W | 0.12% | 0.32% | 75.16 |
| Swiss Franc | XSF - W | FXF - W | 0.71% | 1.02% | 100.78 |
| Commodities | Index Symbol | ETF Symbol | % G / L Day | % G / L Week | Close |
|---|---|---|---|---|---|
| Commodities | DBC - W | 0.75% | 1.51% | 16.16 | |
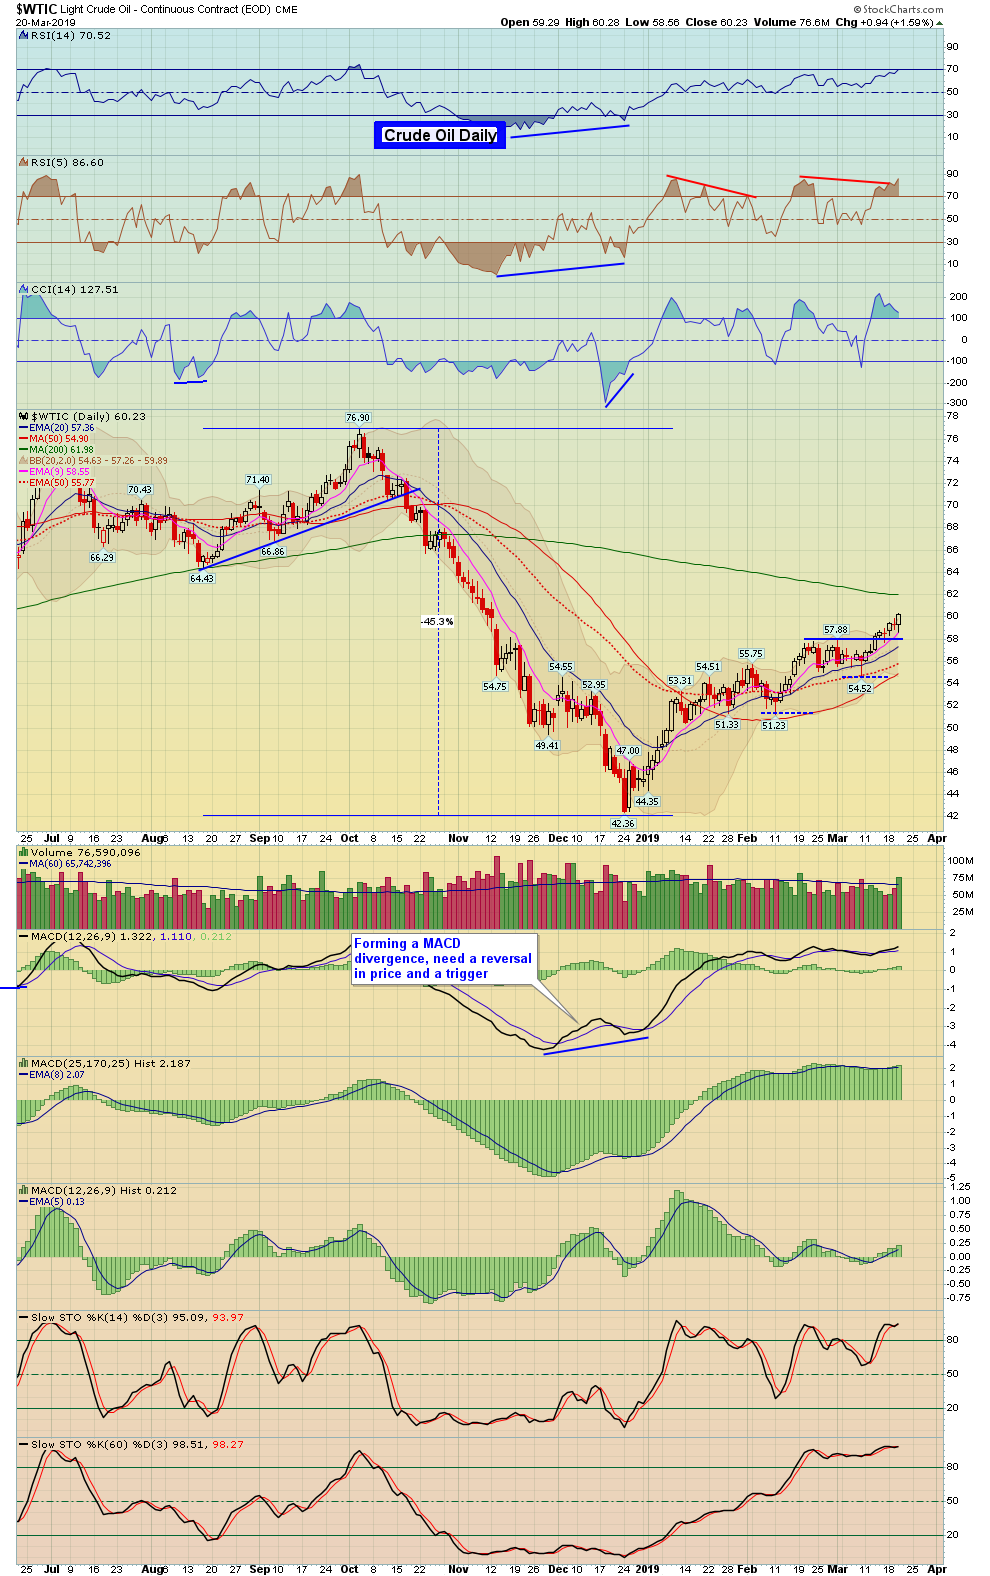
| Crude Oil | WTIC - W | USO - W | 1.59% | 2.92% | 60.23 |
| Gasoline | GASO - W | 1.21% | 2.13% | 1.90 | |
| Natural Gas | NATGAS - W | UNG - W | -1.88% | 0.89% | 2.82 |
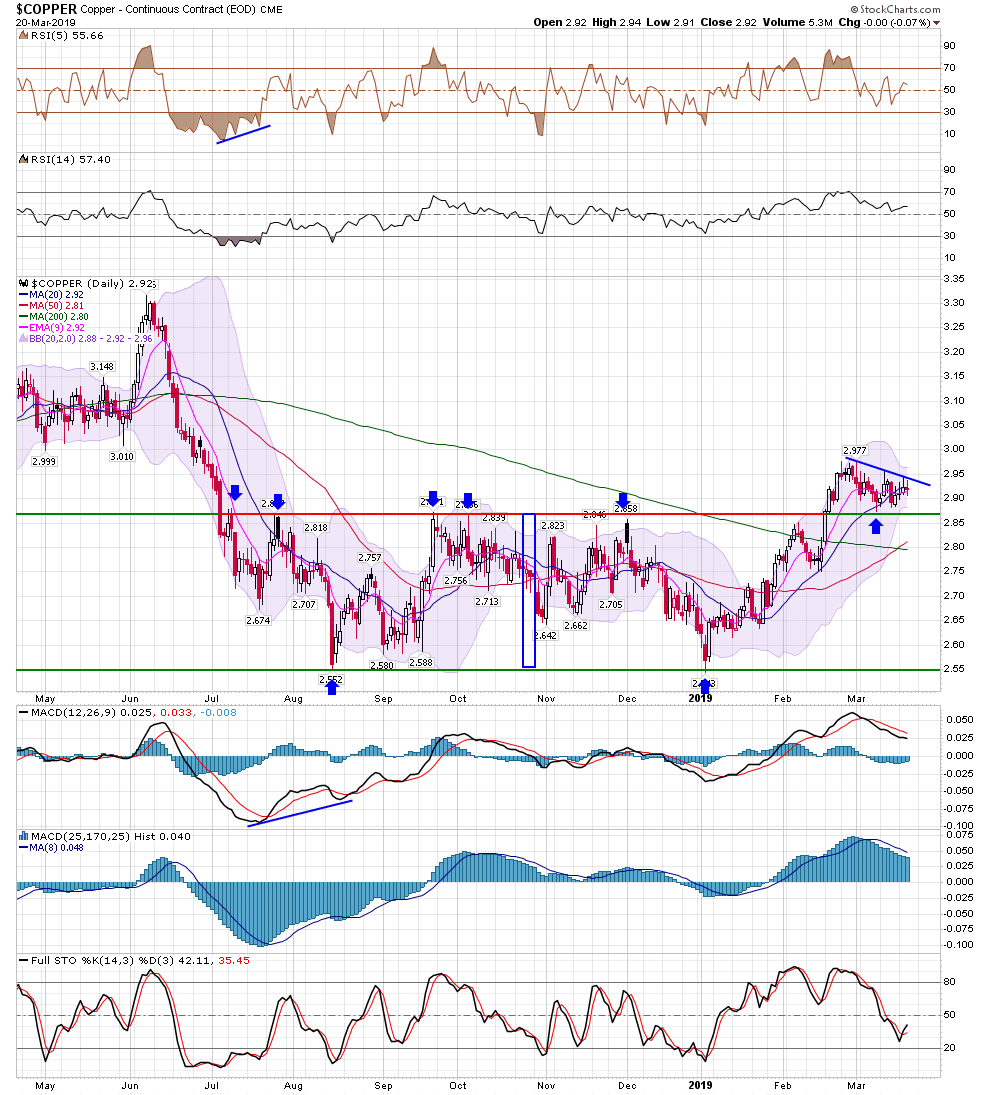
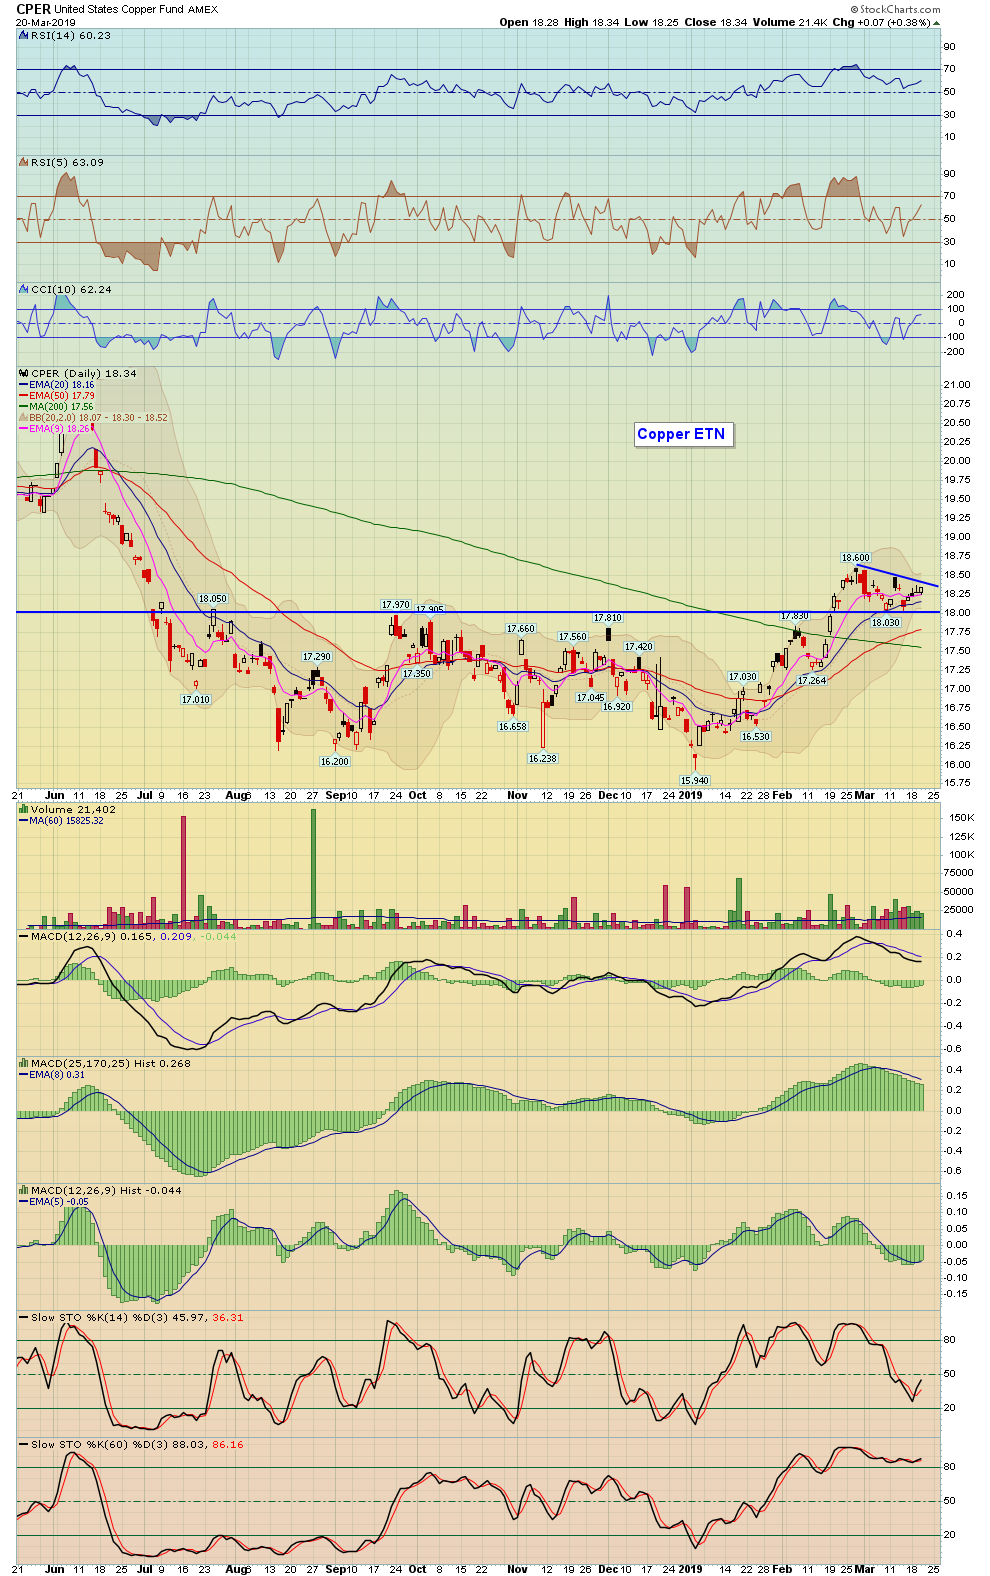
| Copper | COPPER - W | JJCB - W | -0.07% | 0.52% | 2.92 |
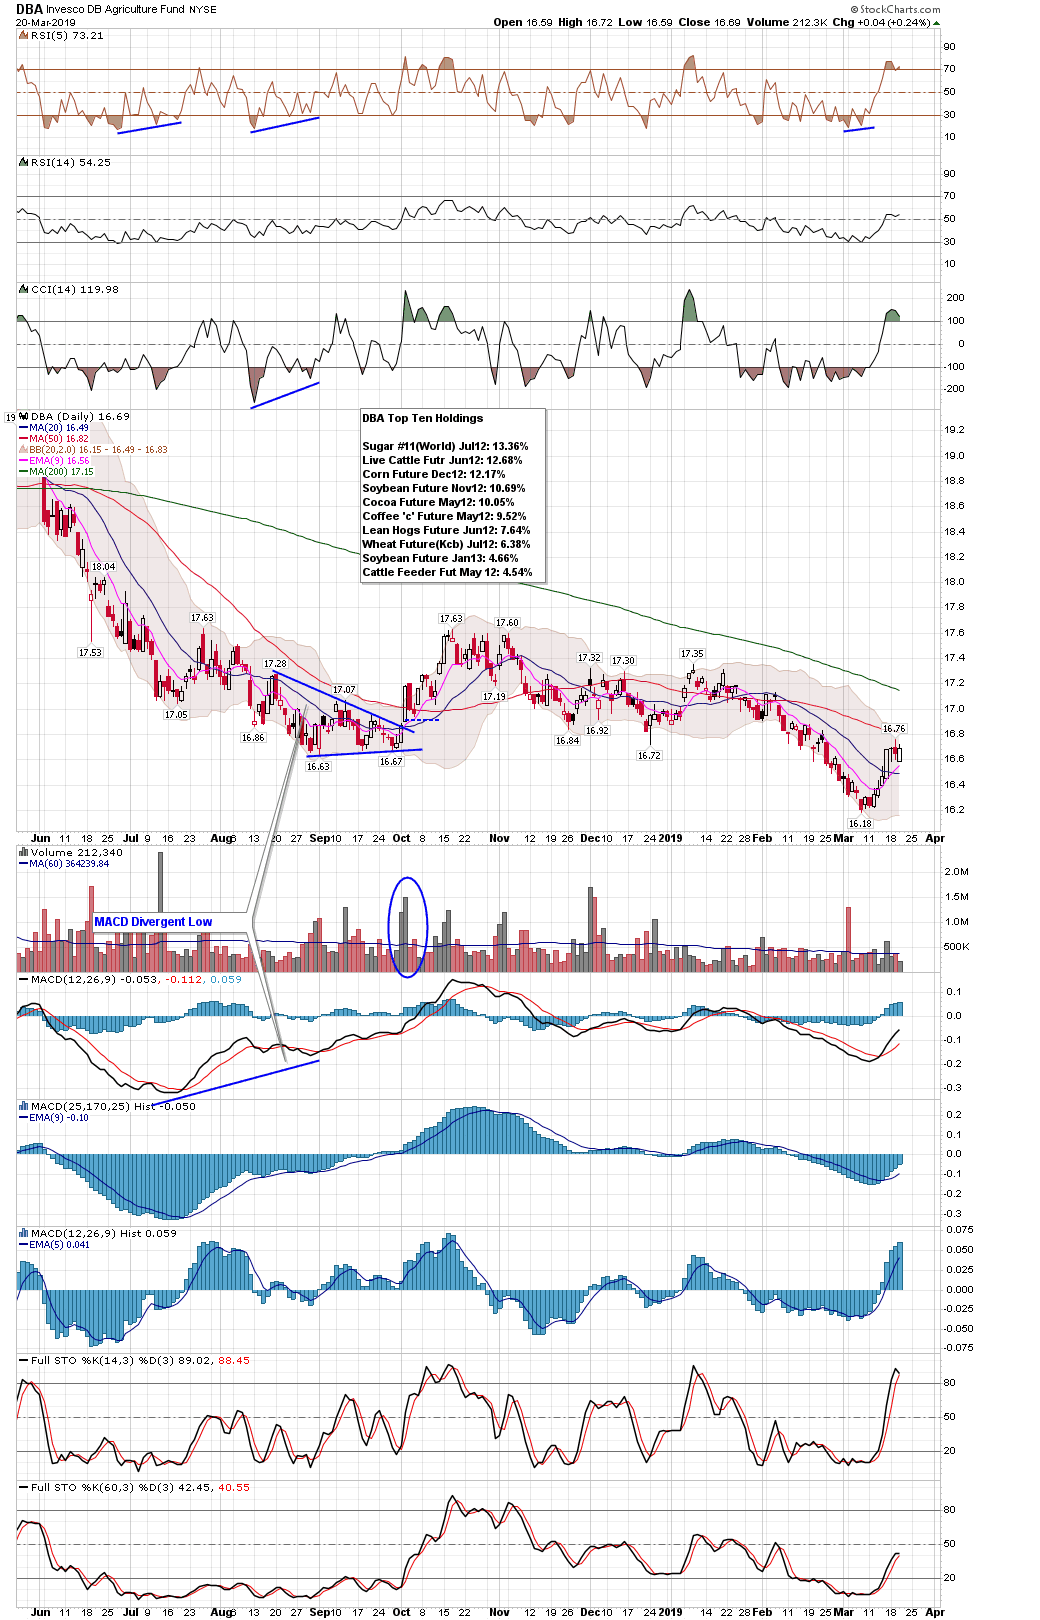
| Agriculture | DBA - W | 0.24% | 0.06% | 16.69 | |
| Corn | CORN - W | CORN - W | 0.07% | -0.47% | 371.50 |
| Wheat | WHEAT - W | WEAT - W | 1.81% | 0.54% | 464.75 |
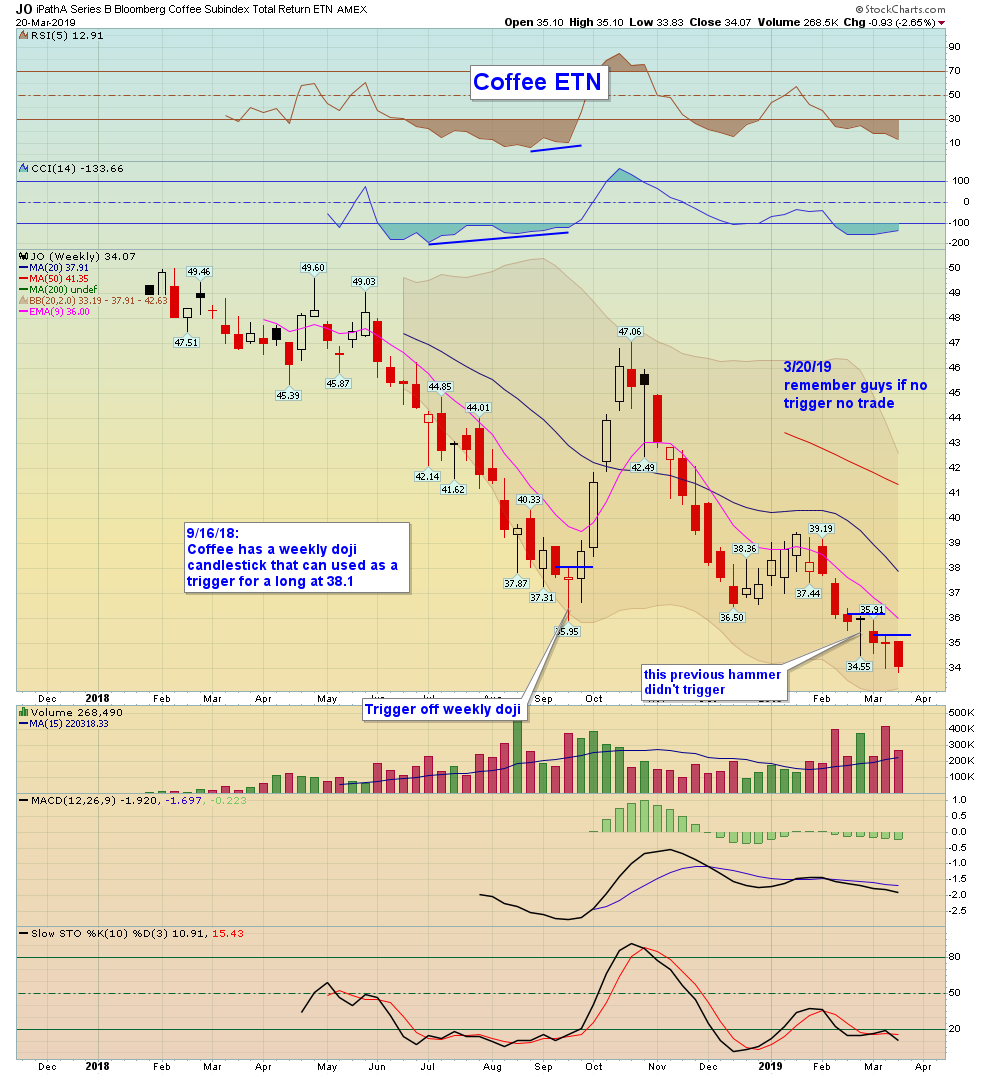
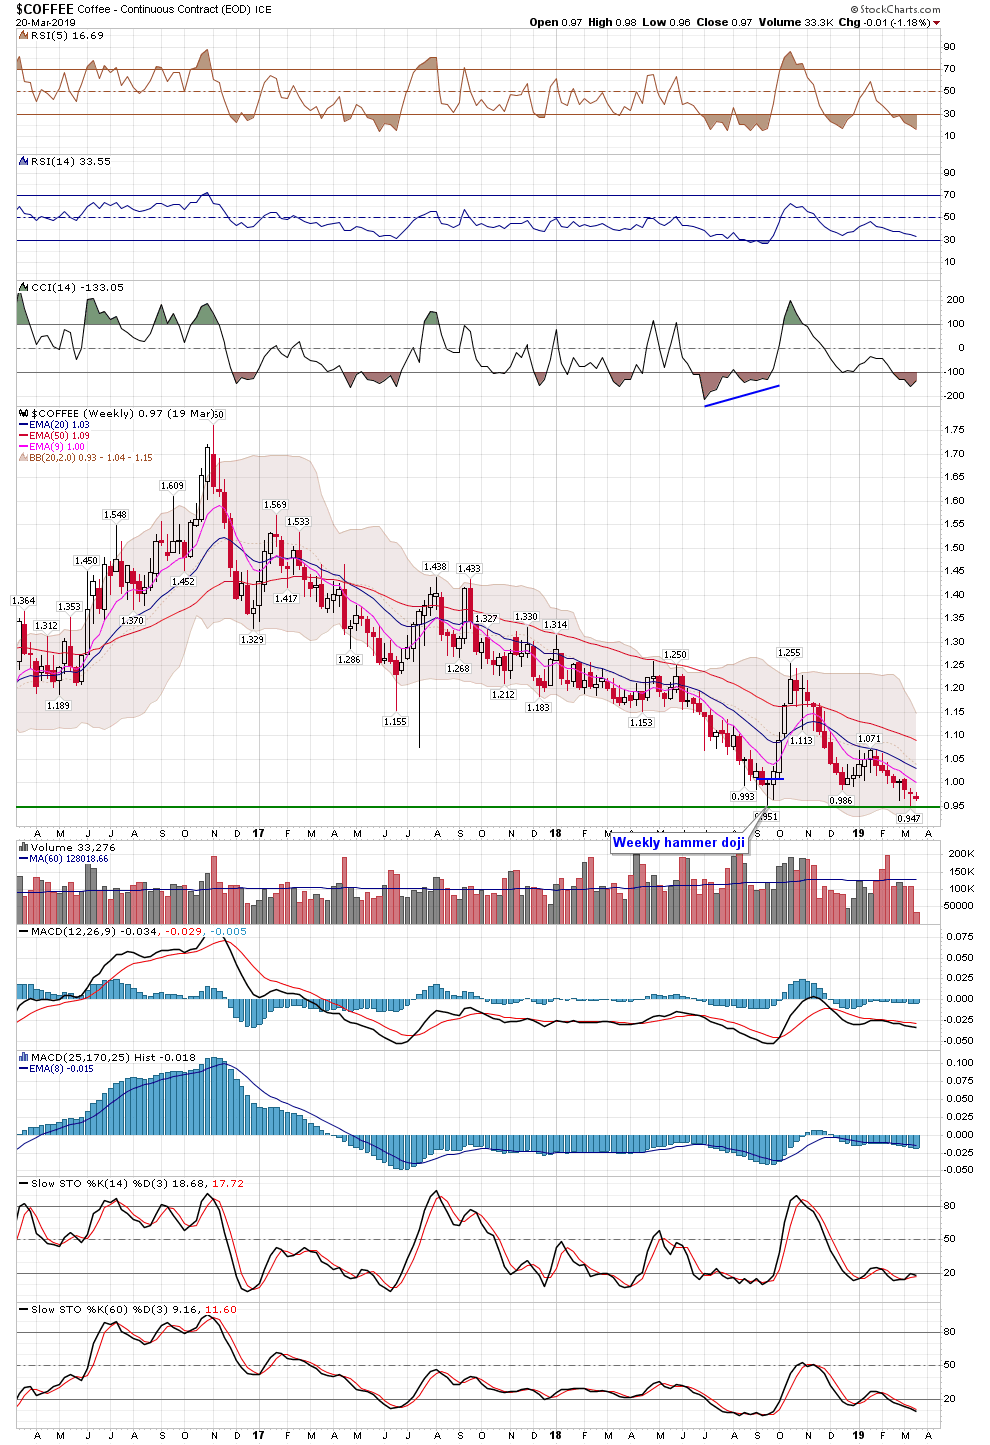
| Coffee | BJO - W | -2.04% | -3.06% | 41.78 | |
| Sugar | CANE - W | 0.27% | 2.04% | 7.50 |
| Precious Metals | Index Symbol | ETF Symbol | % G / L Day | % G / L Week | Close |
|---|---|---|---|---|---|
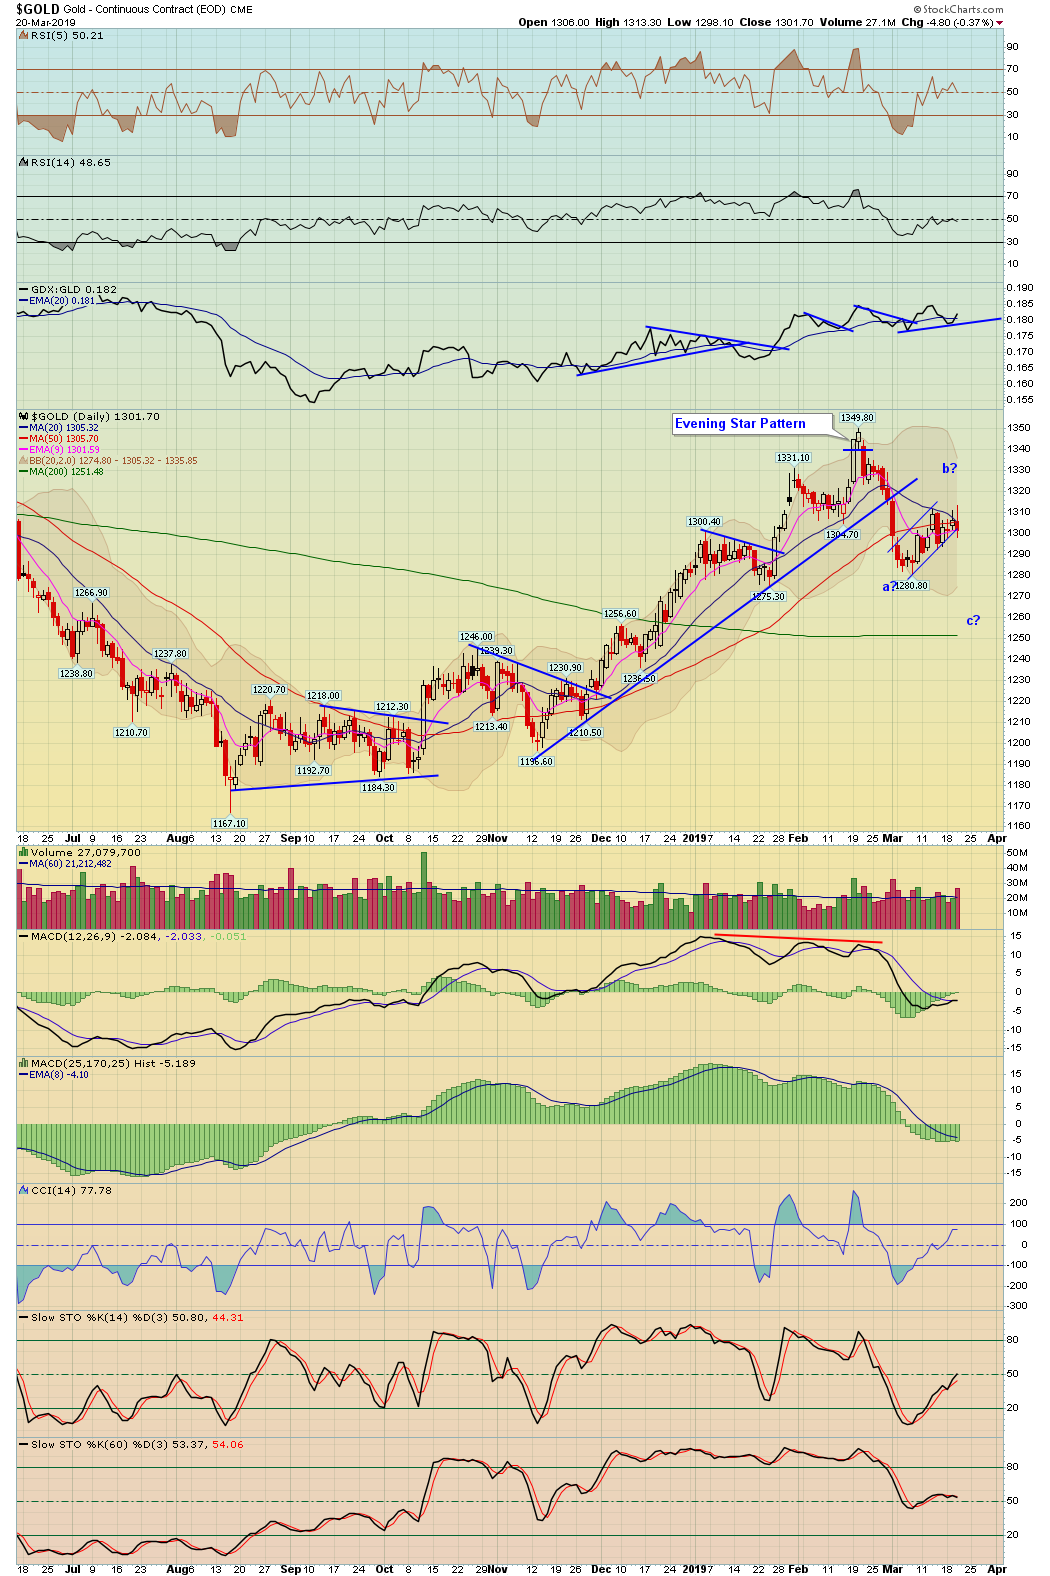
| Gold Metal | GLD - W | 0.65% | 0.98% | 124.18 | |
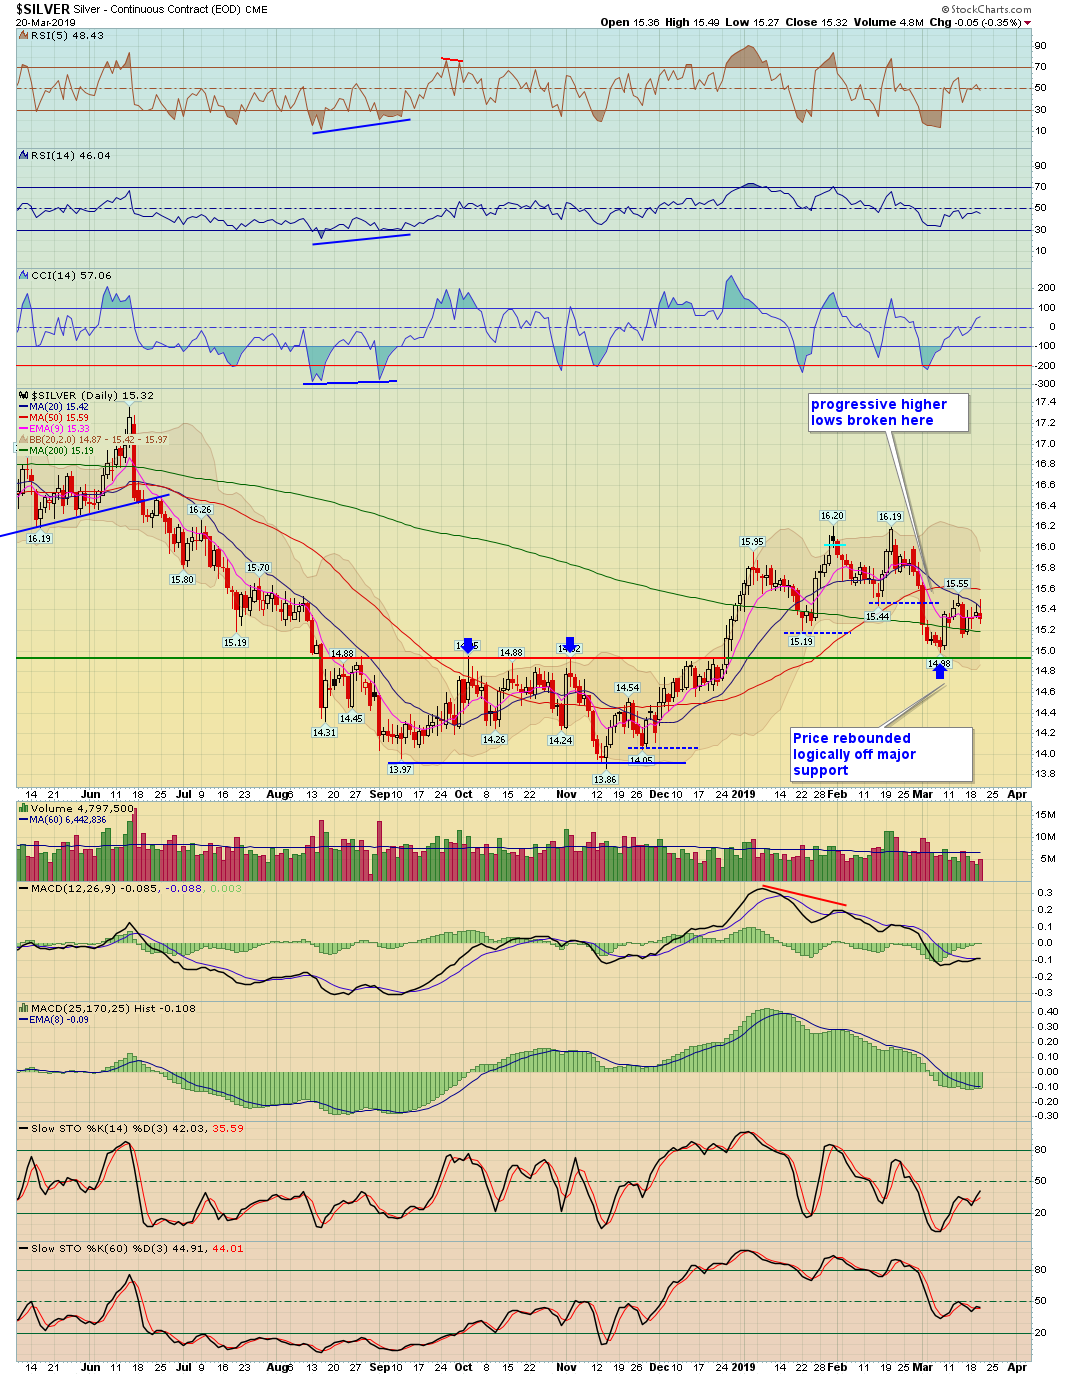
| Silver | SLV - W | 0.97% | 1.47% | 14.54 | |
| Platinum | PPLT - W | 1.63% | 4.32% | 82.13 | |
| Palladium | PALL - W | 0.52% | 2.83% | 152.13 | |
| GDX Gold Miners ETF | GDX - W | 2.26% | 1.48% | 22.63 |
| Bonds | Index Symbol | ETF Symbol | % G / L Day | % G / L Week | Close |
|---|---|---|---|---|---|
| High Yield Corporate Bond | HYG - W | 0.43% | 0.45% | 86.17 | |
| TLT 20 Year Bond ETF | TLT - W | 1.05% | 0.76% | 122.68 | |
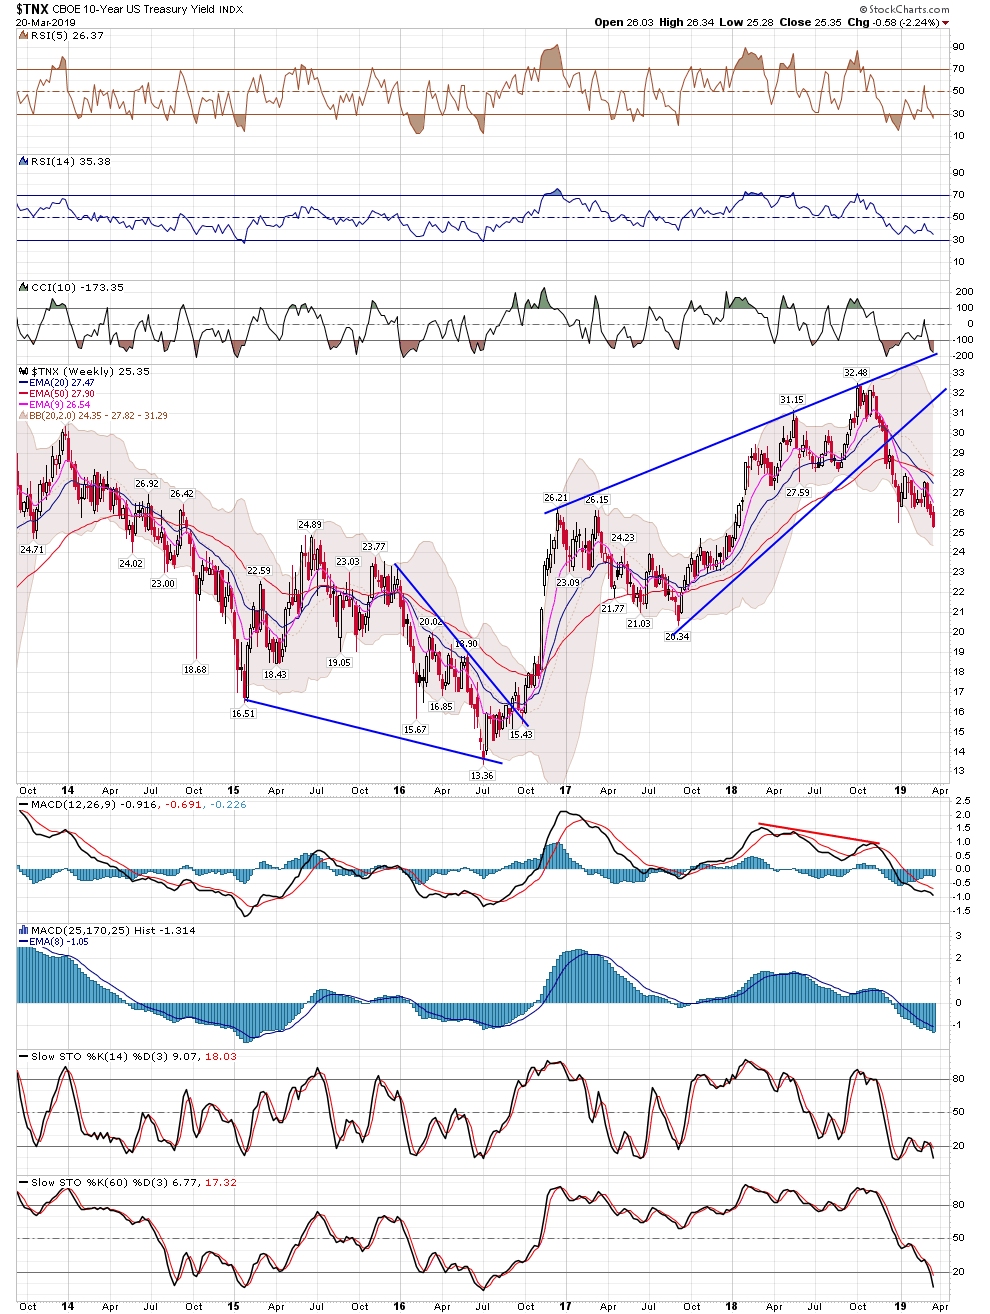
| 10 Year Treasury Yield | TNX - W | -3.02% | -2.24% | 25.35 | |
| 30 Year Treasury Yield | TYX - W | -1.75% | -1.49% | 29.75 |
3
| Date | ET | Release | For | Actual | Briefing.com Forecast | Briefing.com Consensus | Prior | Revised From |
|---|---|---|---|---|---|---|---|---|
| Mar 18 | 10:00 | NAHB Housing Market Index | Mar | 62 | 64 | 63 | 62 | |
| Mar 19 | 10:00 | Factory Orders | Jan | 0.1% | 0.3% | 0.2% | 0.1% | -- |
| Mar 20 | 07:00 | MBA Mortgage Applications Index | 03/16 | 1.6% | NA | NA | 2.3% | |
| Mar 20 | 10:30 | EIA Crude Oil Inventories | 03/16 | -9.6M | NA | NA | -3.9M | |
| Mar 20 | 14:00 | FOMC Rate Decision | Mar | 2.375% | 2.375% | 2.375% | 2.375% | |
| Mar 20 | 14:30 | Fed Chair Press Conference | Mar | NA | NA | NA | ||
| Mar 21 | 08:30 | Initial Claims | 03/16 | 226K | 223K | 229K | ||
| Mar 21 | 08:30 | Continuing Claims | 03/09 | NA | NA | 1776K | ||
| Mar 21 | 08:30 | Philadelphia Fed Index | Mar | 3.0 | 6.0 | -4.1 | ||
| Mar 21 | 10:00 | Leading Indicators | Feb | 0.2% | 0.2% | -0.1% | ||
| Mar 21 | 10:30 | EIA Natural Gas Inventories | 03/16 | NA | NA | -204 bcf | ||
| Mar 22 | 10:00 | Existing Home Sales | Feb | 5.20M | 5.10M | 4.94M | ||
| Mar 22 | 10:00 | Wholesale Inventories | Jan | NA | NA | 1.1% | ||
| Mar 22 | 14:00 | Treasury Budget | Feb | NA | -$227.0B | -$215.2B |

Stock Earnings Calender:
Click here for a list of Stocks that are reporting Earnings
**Generally we never hold a position into earnings since the risk/reward is too great
4 - View Live Chart
5 - View Live Chart
6 - View Live Chart
7
8 - View Live Chart
9 - View Live Chart
10 - View Live Chart
11 - View Live Chart
12 - View Live Chart
13 - View Live Chart
14 - View Live Chart
15 - View Live Chart
16 - View Live Chart
17 - View Live Chart
18 - View Live Chart
19 - View Live Chart
20 - View Live Chart
21 - View Live Chart
22 - View Live Chart
23 - View Live Chart
24 - View Live Chart
25 - View Live Chart
26 - View Live Chart
27 - View Live Chart
28 - View Live Chart
29 - View Live Chart
30 - View Live Chart
31 - View Live Chart
32 - View Live Chart
33 - View Live Chart
34 - View Live Chart
35 - View Live Chart
36 - View Live Chart
37 - View Live Chart
38 - View Live Chart
39 - View Live Chart
40 - View Live Chart
41 - View Live Chart
42 - View Live Chart
43 - View Live Chart
44 - View Live Chart
45 - View Live Chart
46 - View Live Chart
47 - View Live Chart
48 - View Live Chart
49 - View Live Chart
50 - View Live Chart
51 - View Live Chart
52 - View Live Chart
53 - View Live Chart
54 - View Live Chart
55 - View Live Chart
56 - View Live Chart
57 - View Live Chart
58 - View Live Chart
59 - View Live Chart
60 - View Live Chart
61 - View Live Chart
62 - View Live Chart

63 - View Live Chart
64 - View Live Chart
65 - View Live Chart
66 - View Live Chart
67 - View Live Chart
68 - View Live Chart
69 - View Live Chart
70 - View Live Chart
71 - View Live Chart
72 - View Live Chart
73 - View Live Chart
74 - View Live Chart
75 - View Live Chart
76 - View Live Chart
77 - View Live Chart
78 - View Live Chart
79 - View Live Chart
80 - View Live Chart
81 - View Live Chart
82 - View Live Chart
83 - View Live Chart
84 - View Live Chart
85 - View Live Chart
86 - View Live Chart
- Hide Player Link to Newsletter Audio
- Hide Player Link to Newsletter Audio