Sunday December 30h, 2018 Weekend Newsletter - free
Disclaimer: Intraday Chart Links will show up as daily charts unless you have an active stockcharts.com membership and are signed in, you can sign up here.
1
Table of Contents
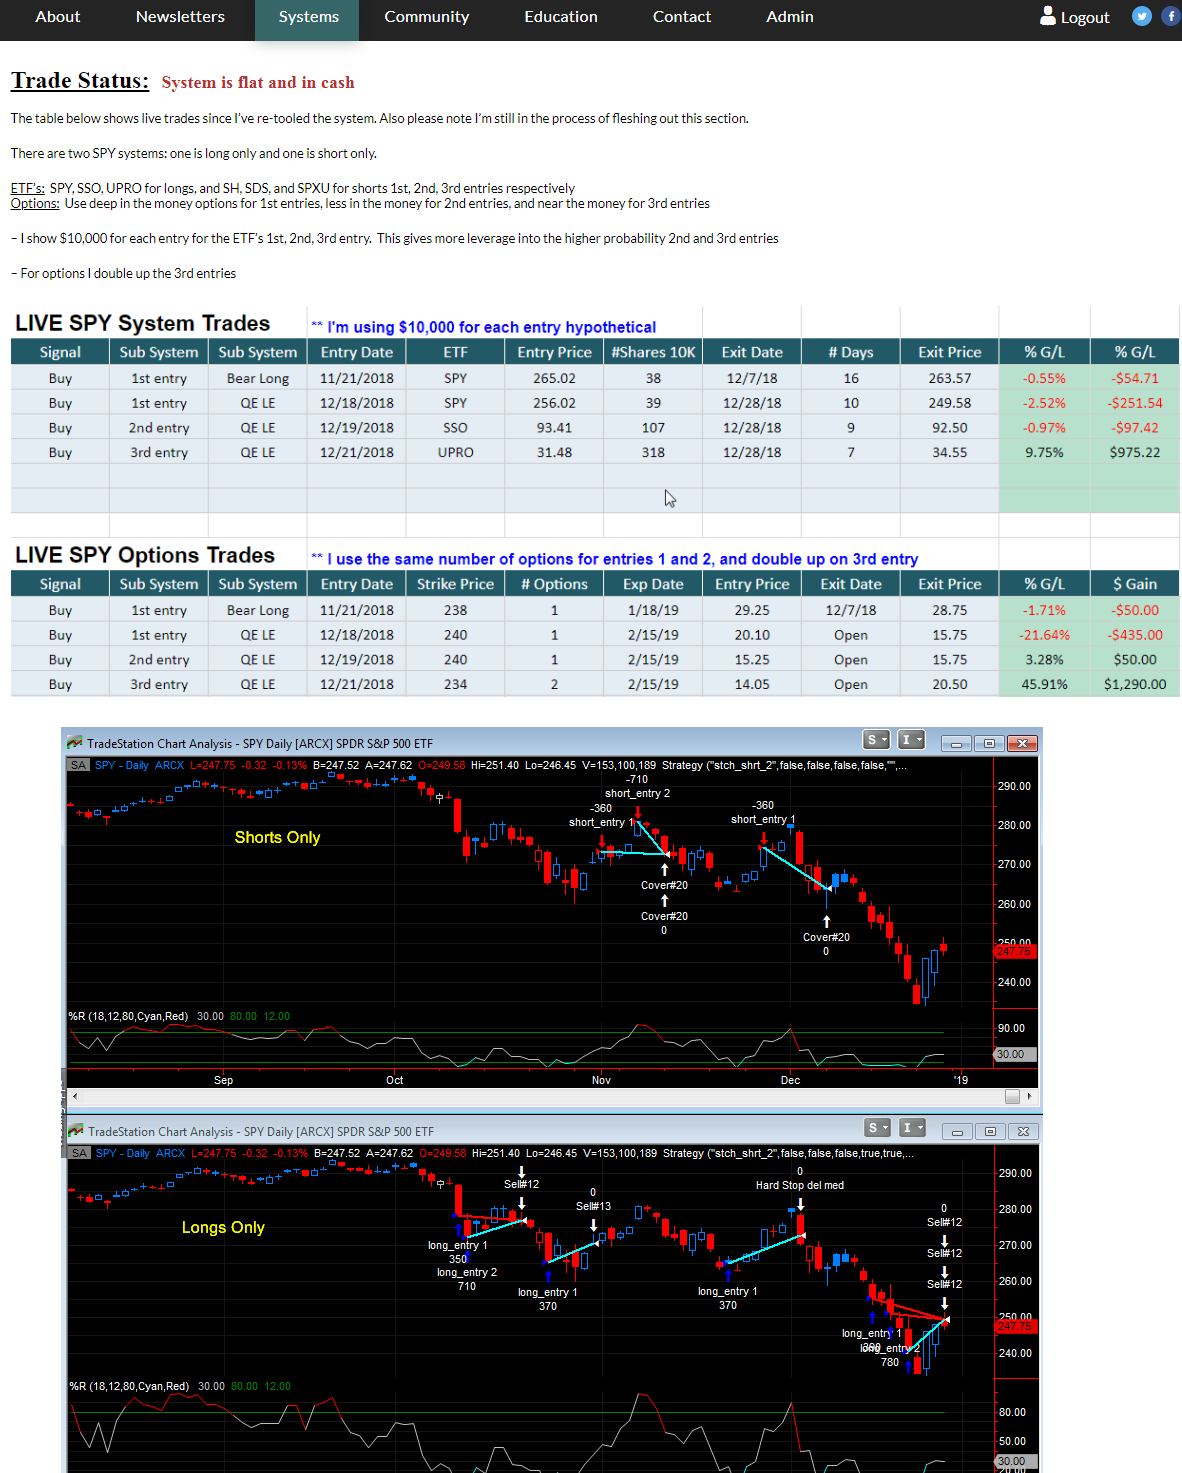
SPY Pro system discussion and clarification for how we are going to trade this
1. Glance at last Week Stats, Upcoming Economic Table, Earnings Release Dates (long term economic indicators)
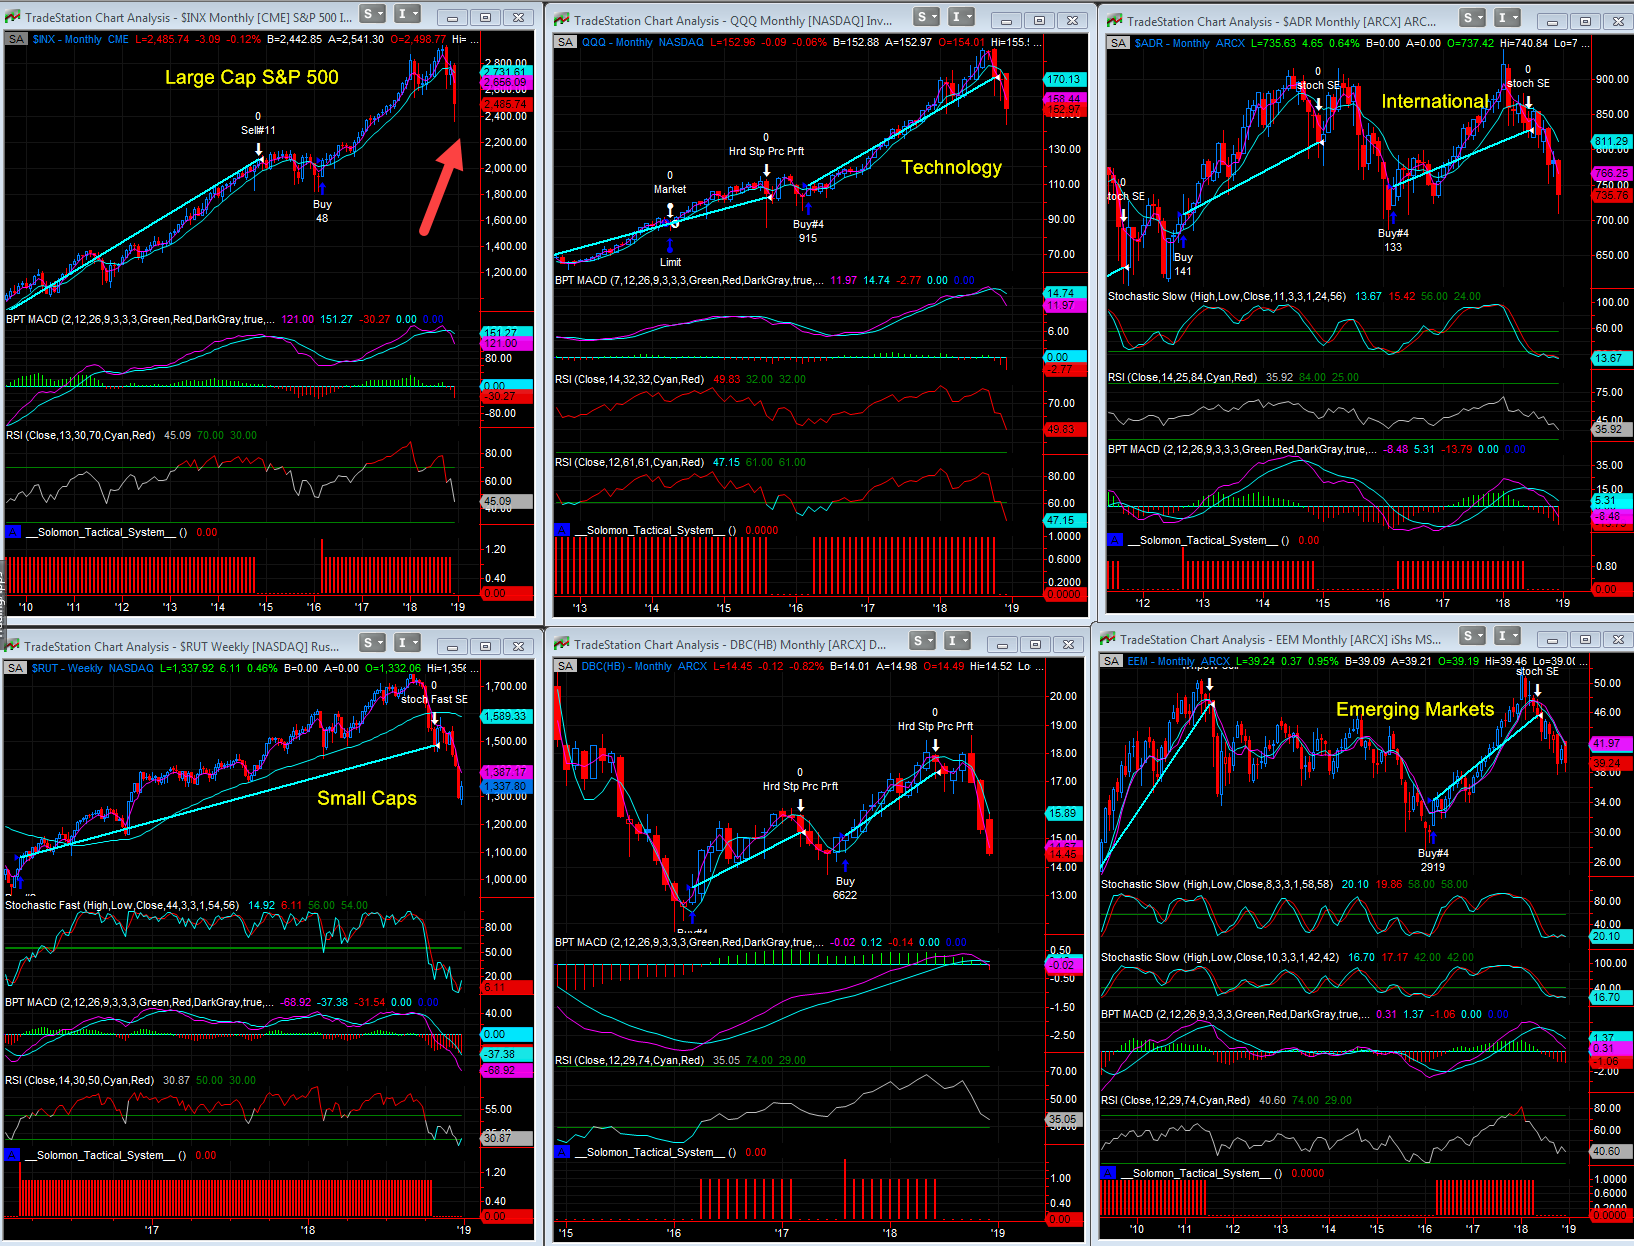
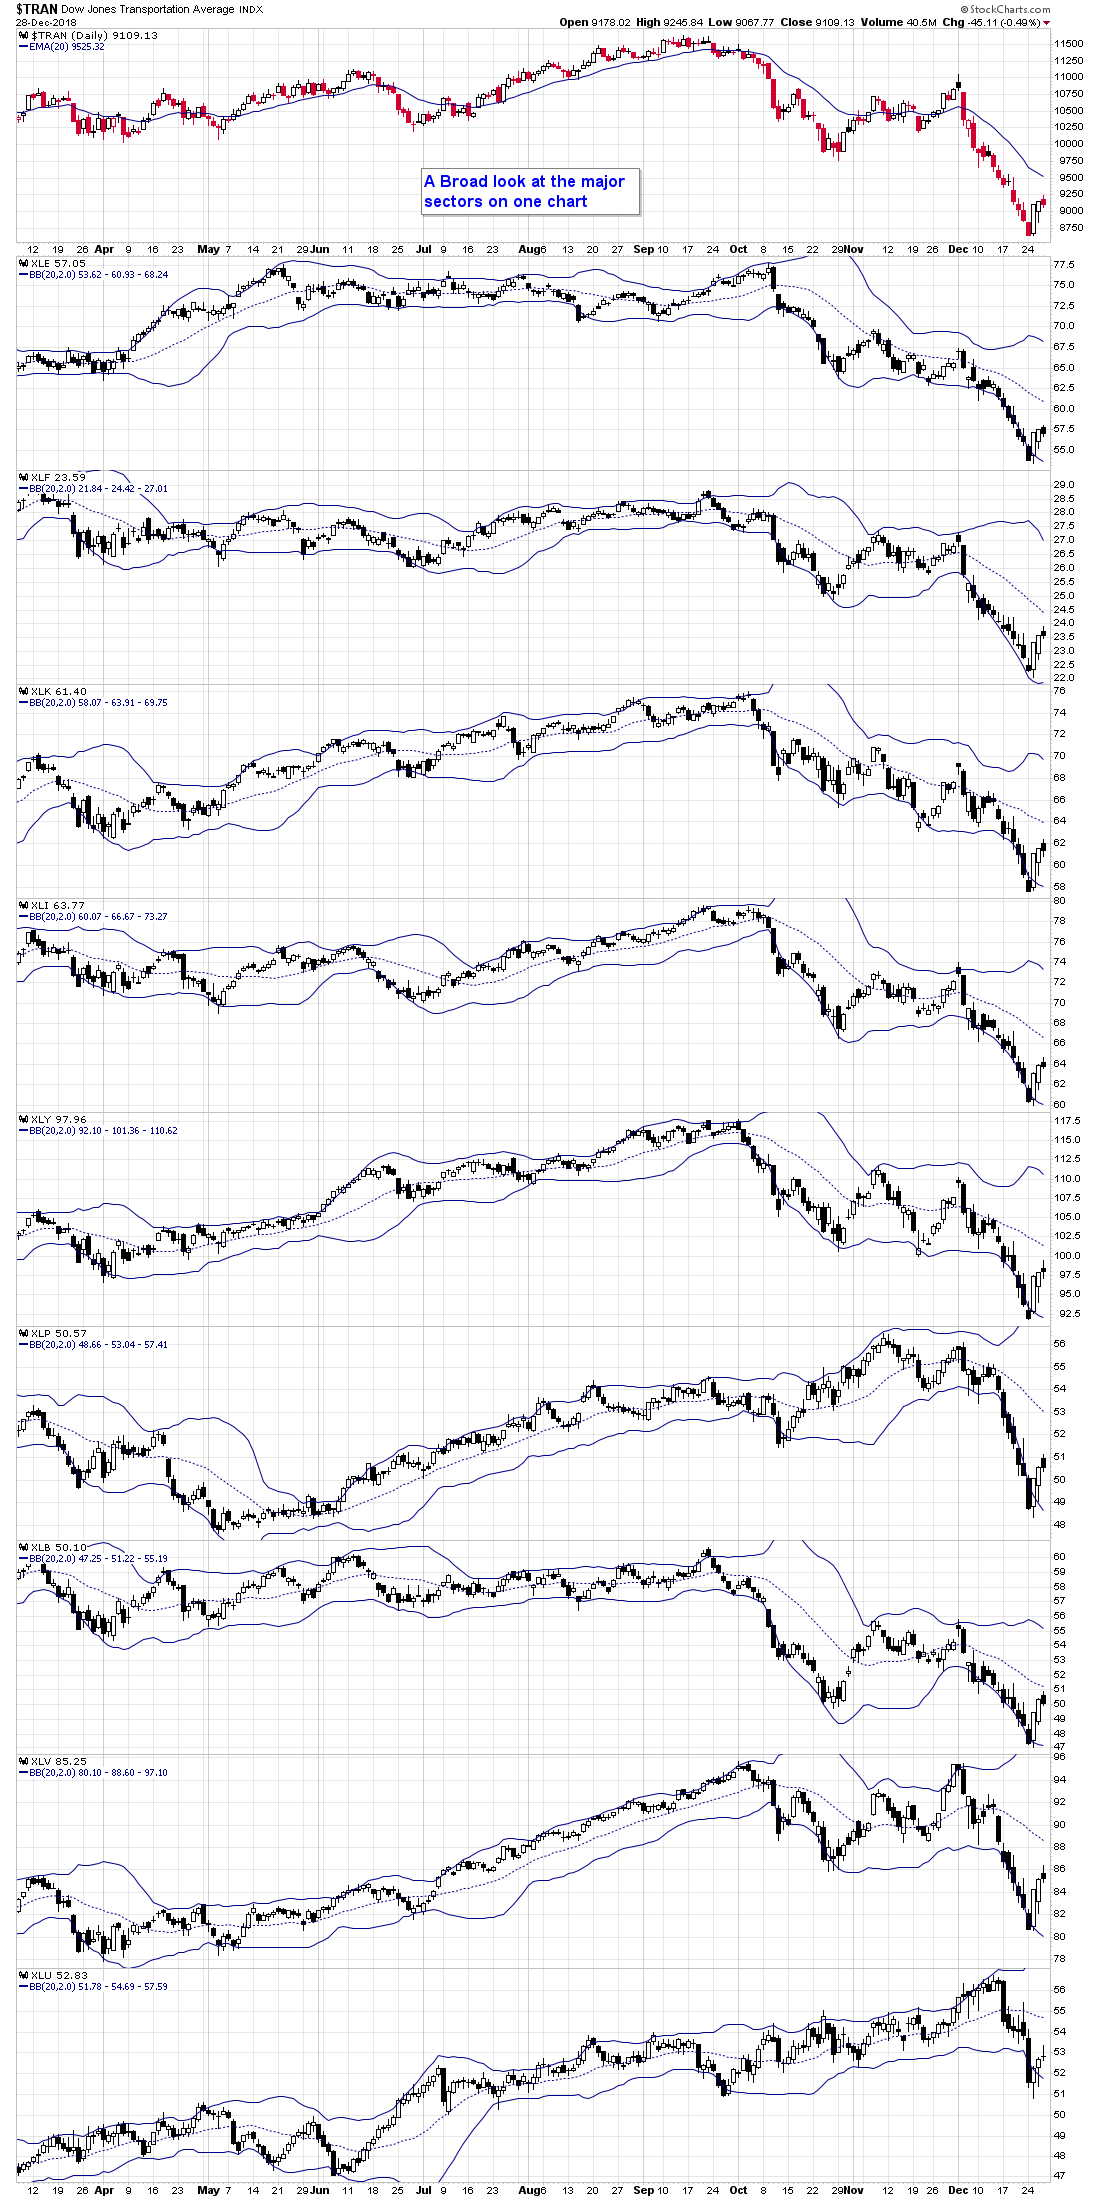
2. Review of the Major Indexes Big Picture, BPT 401K Systems, and Short Term
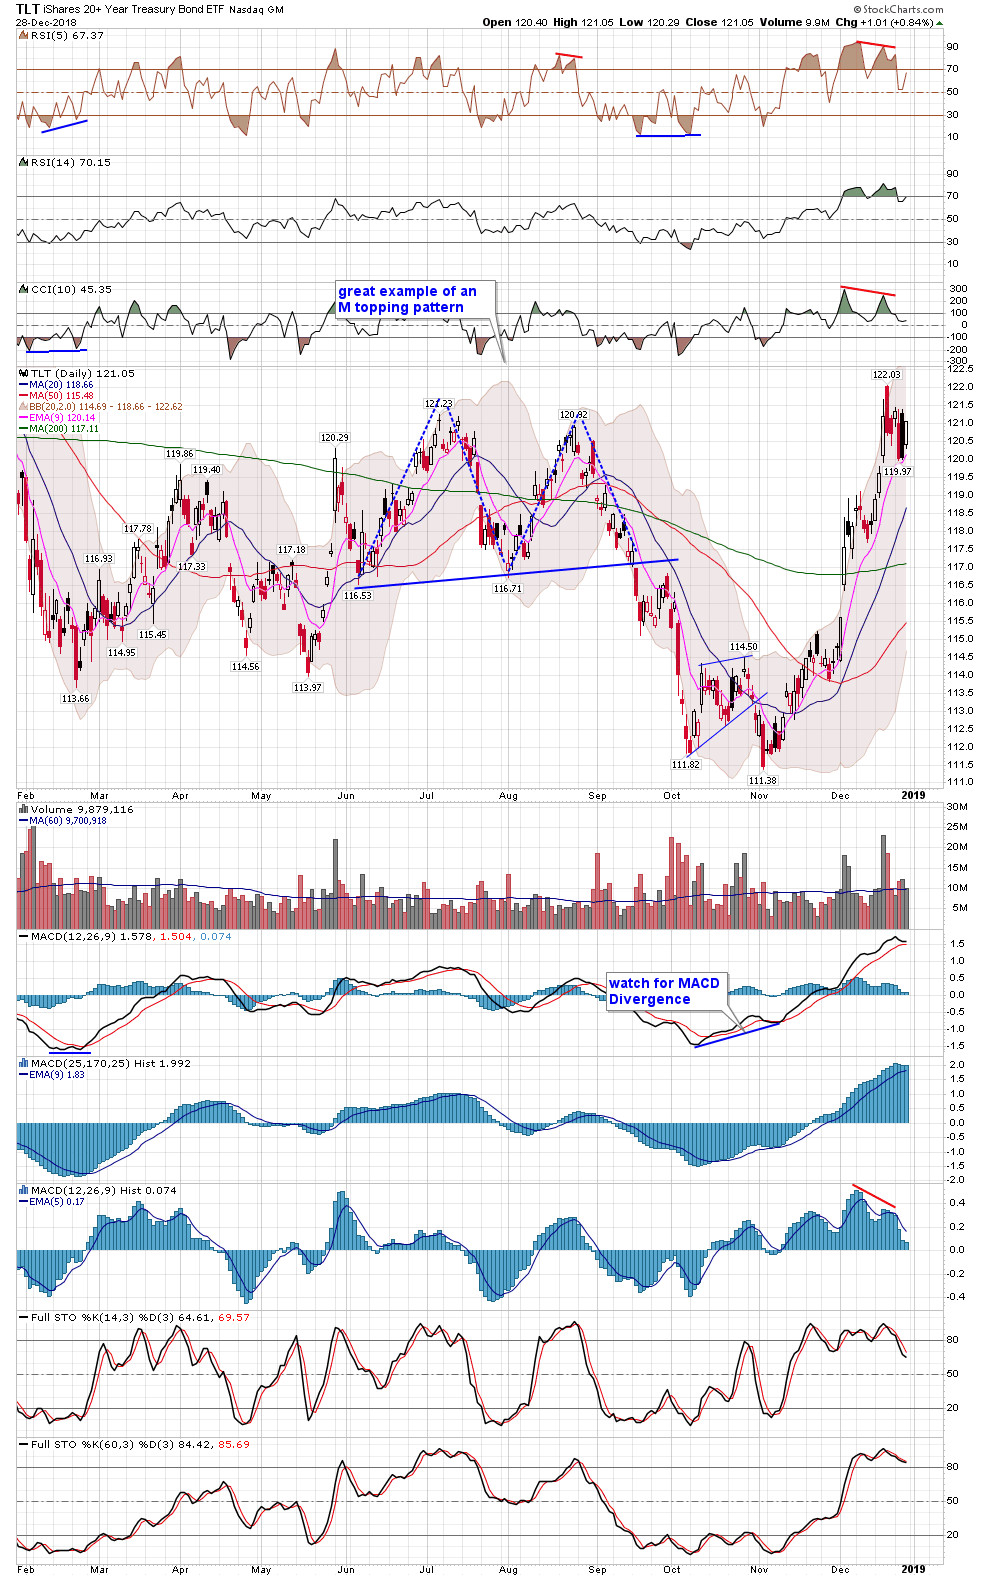
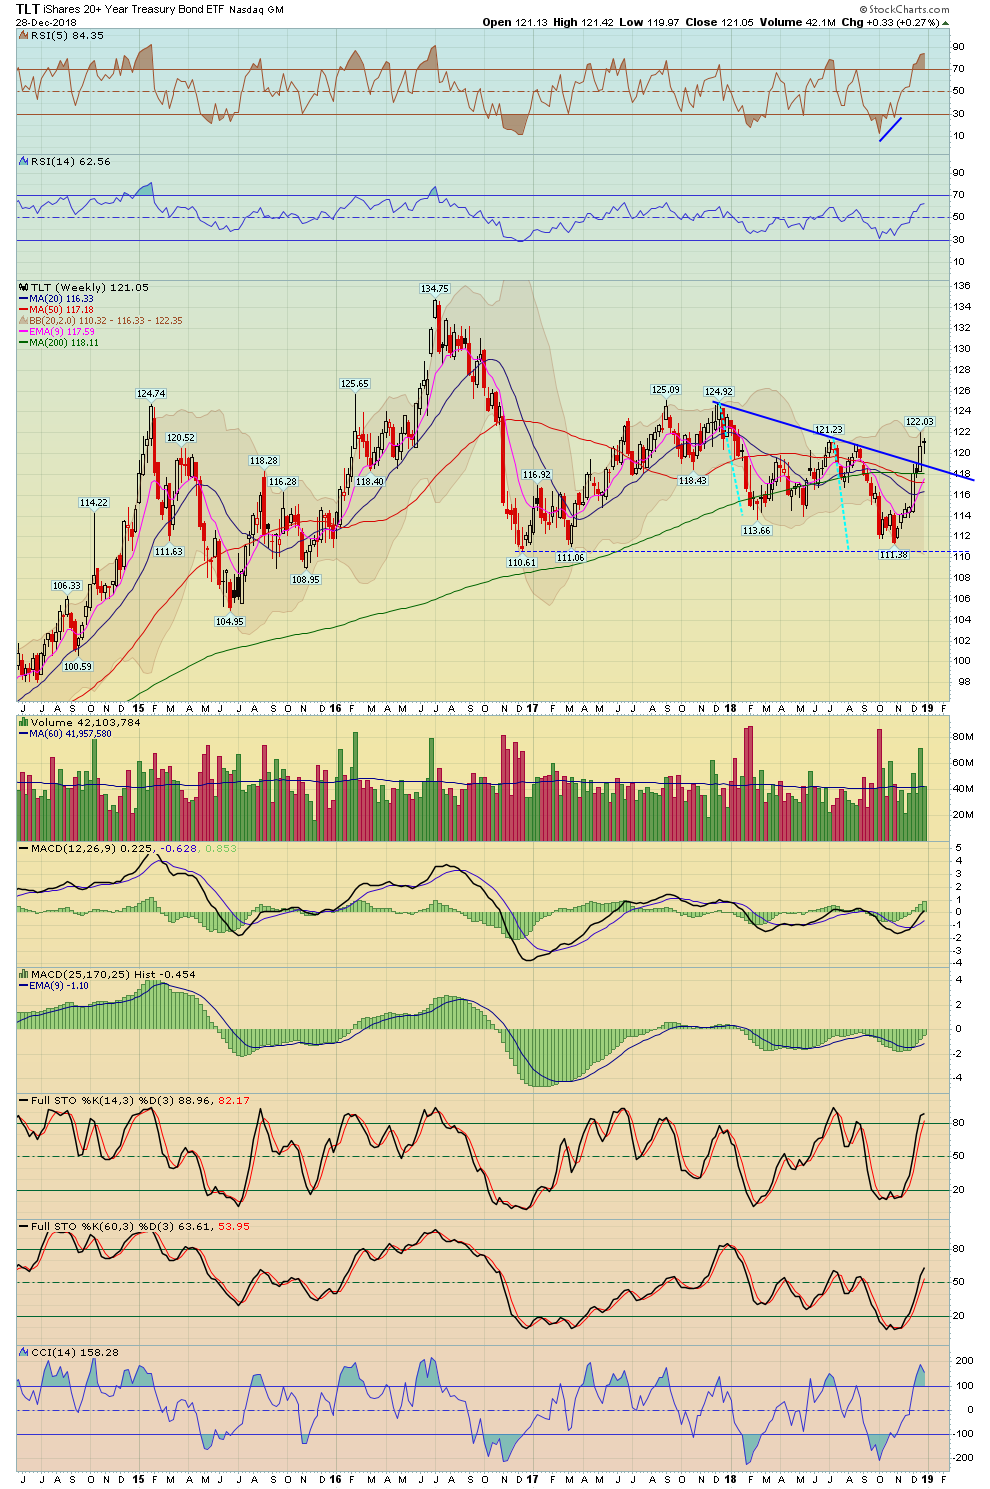
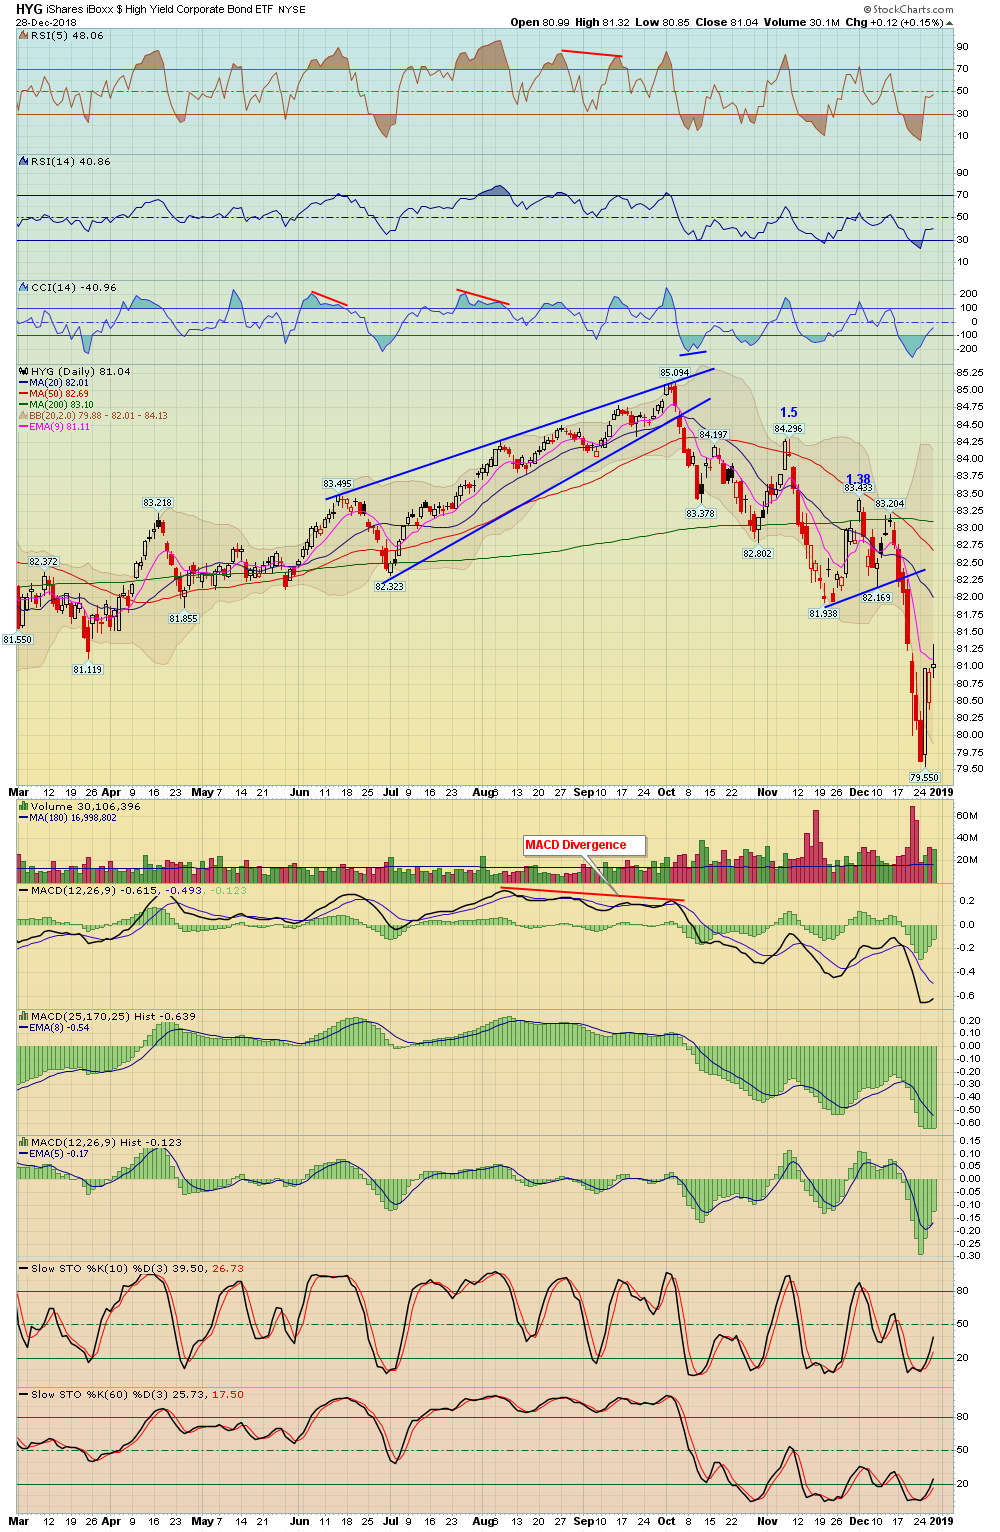
3. Custom Indicators and Quick Overview of Bonds via TLT and HYG, Yield Curve
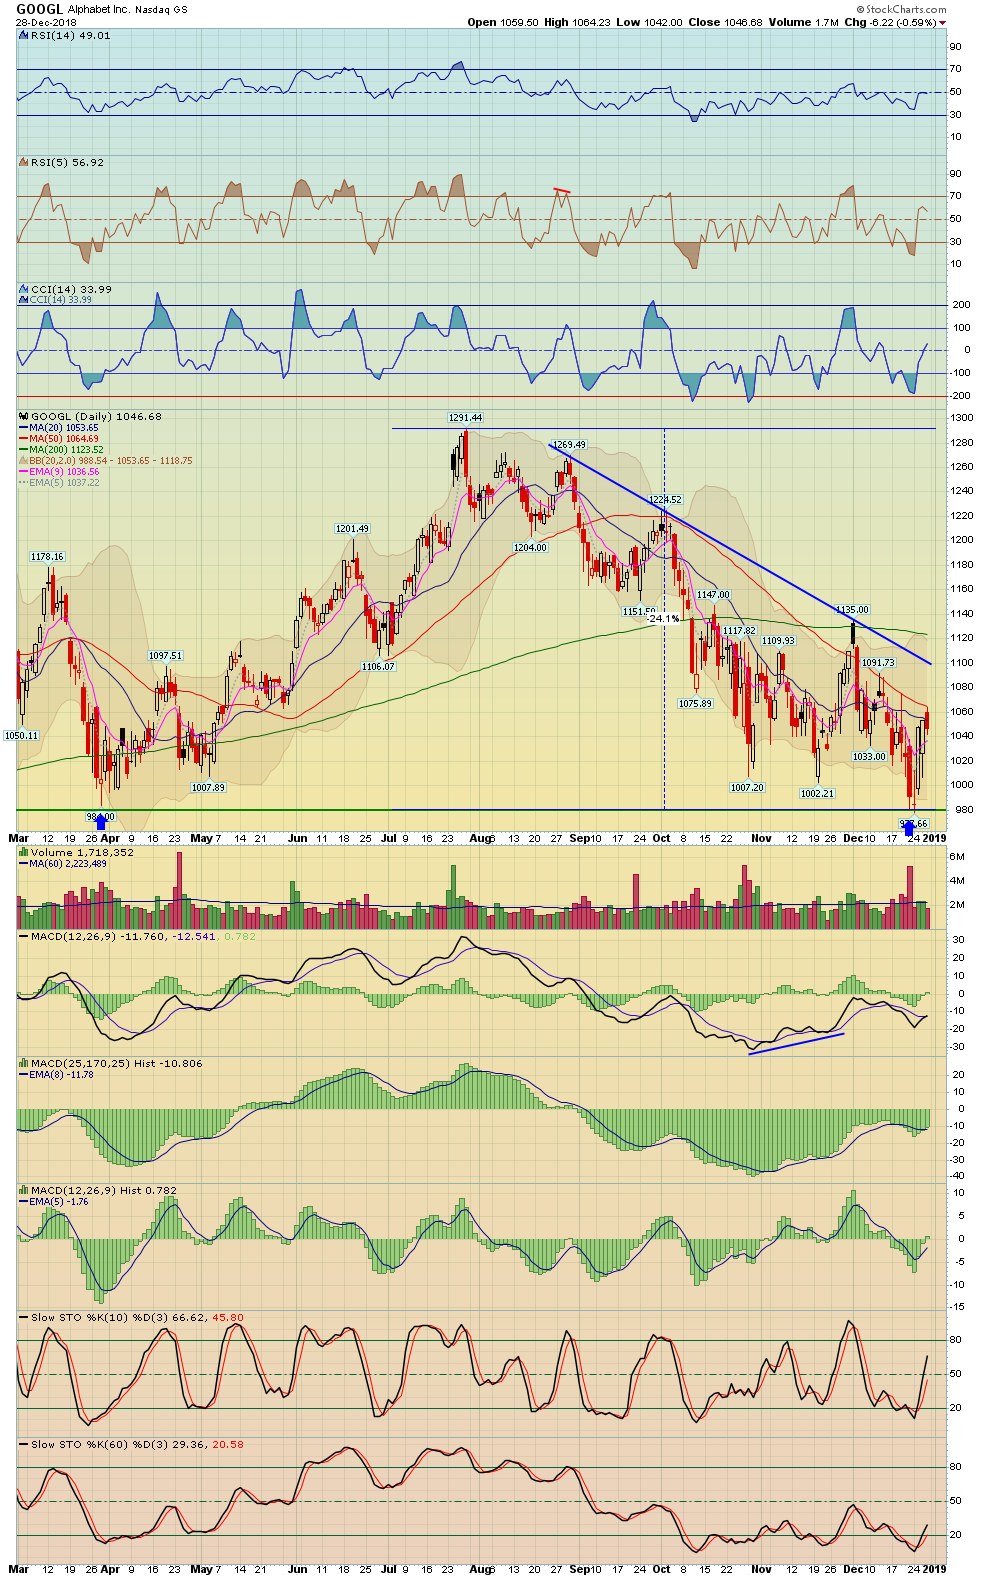
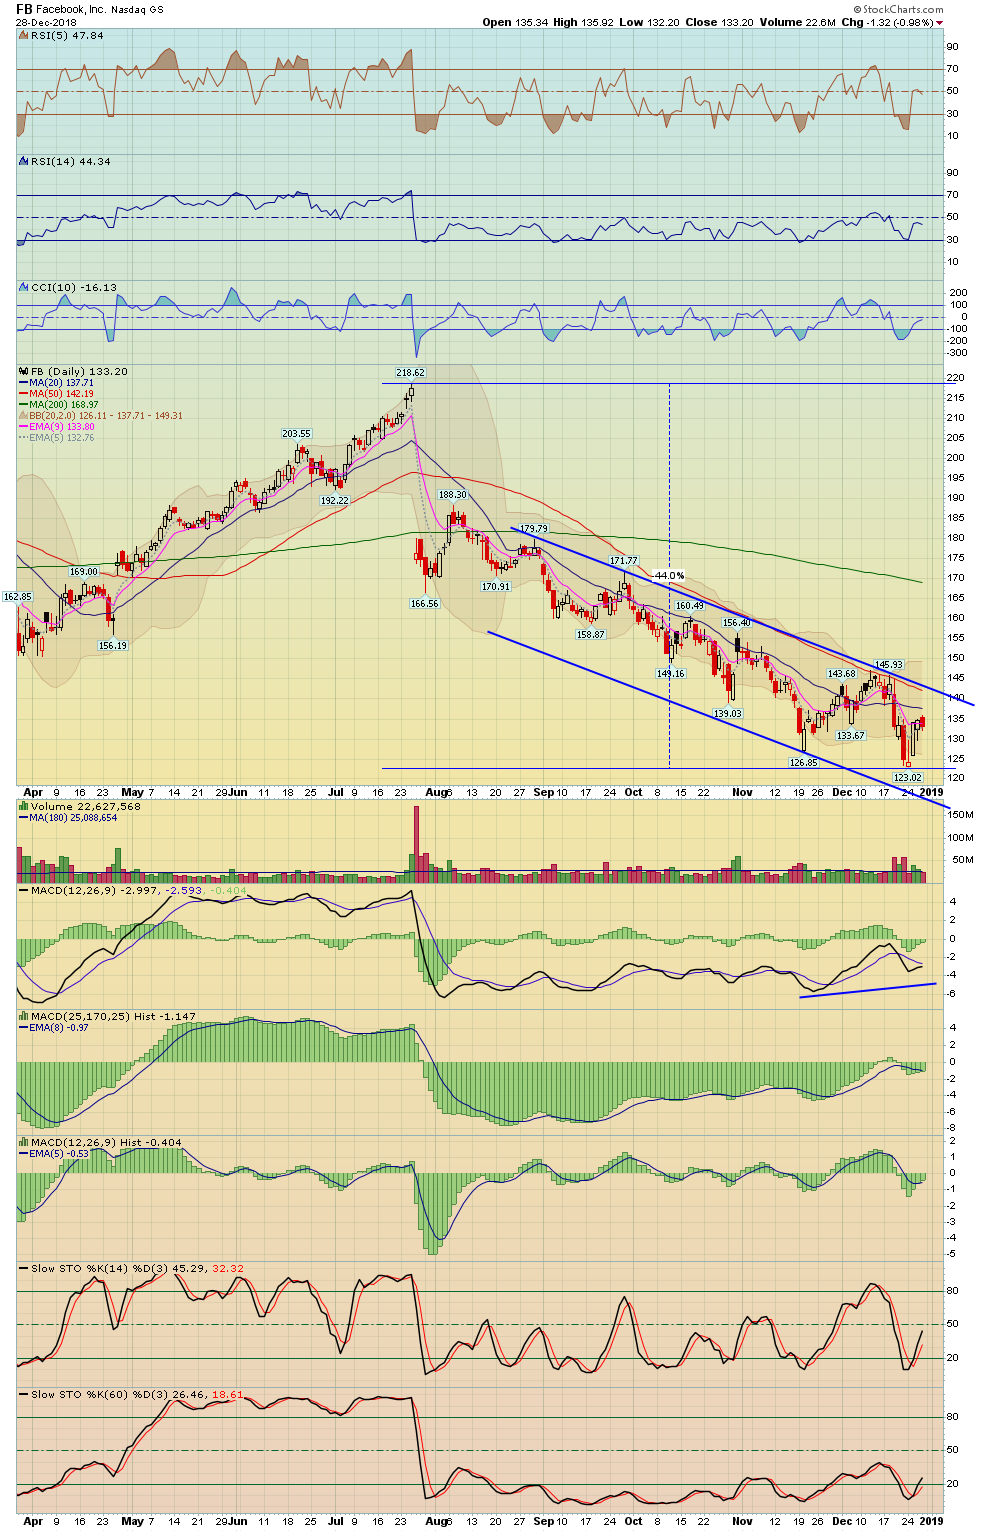
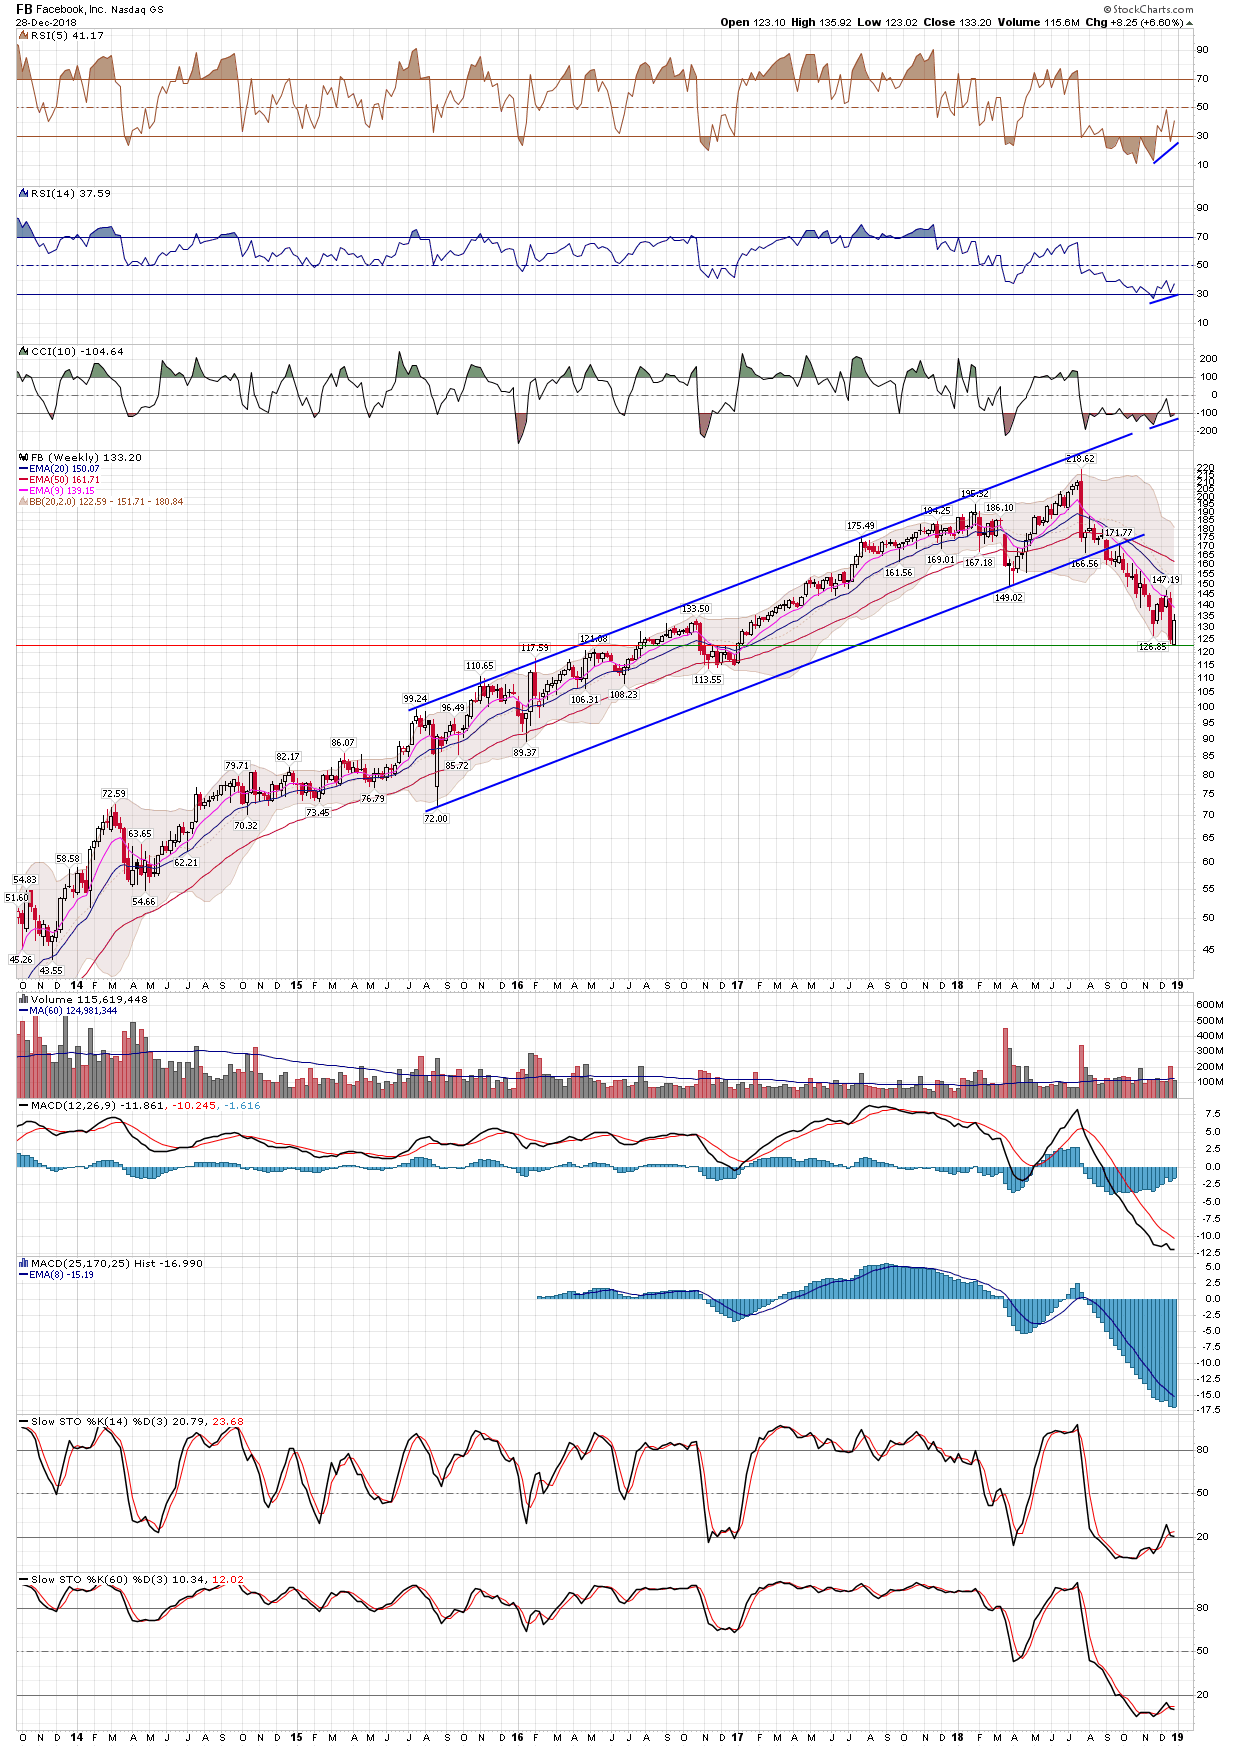
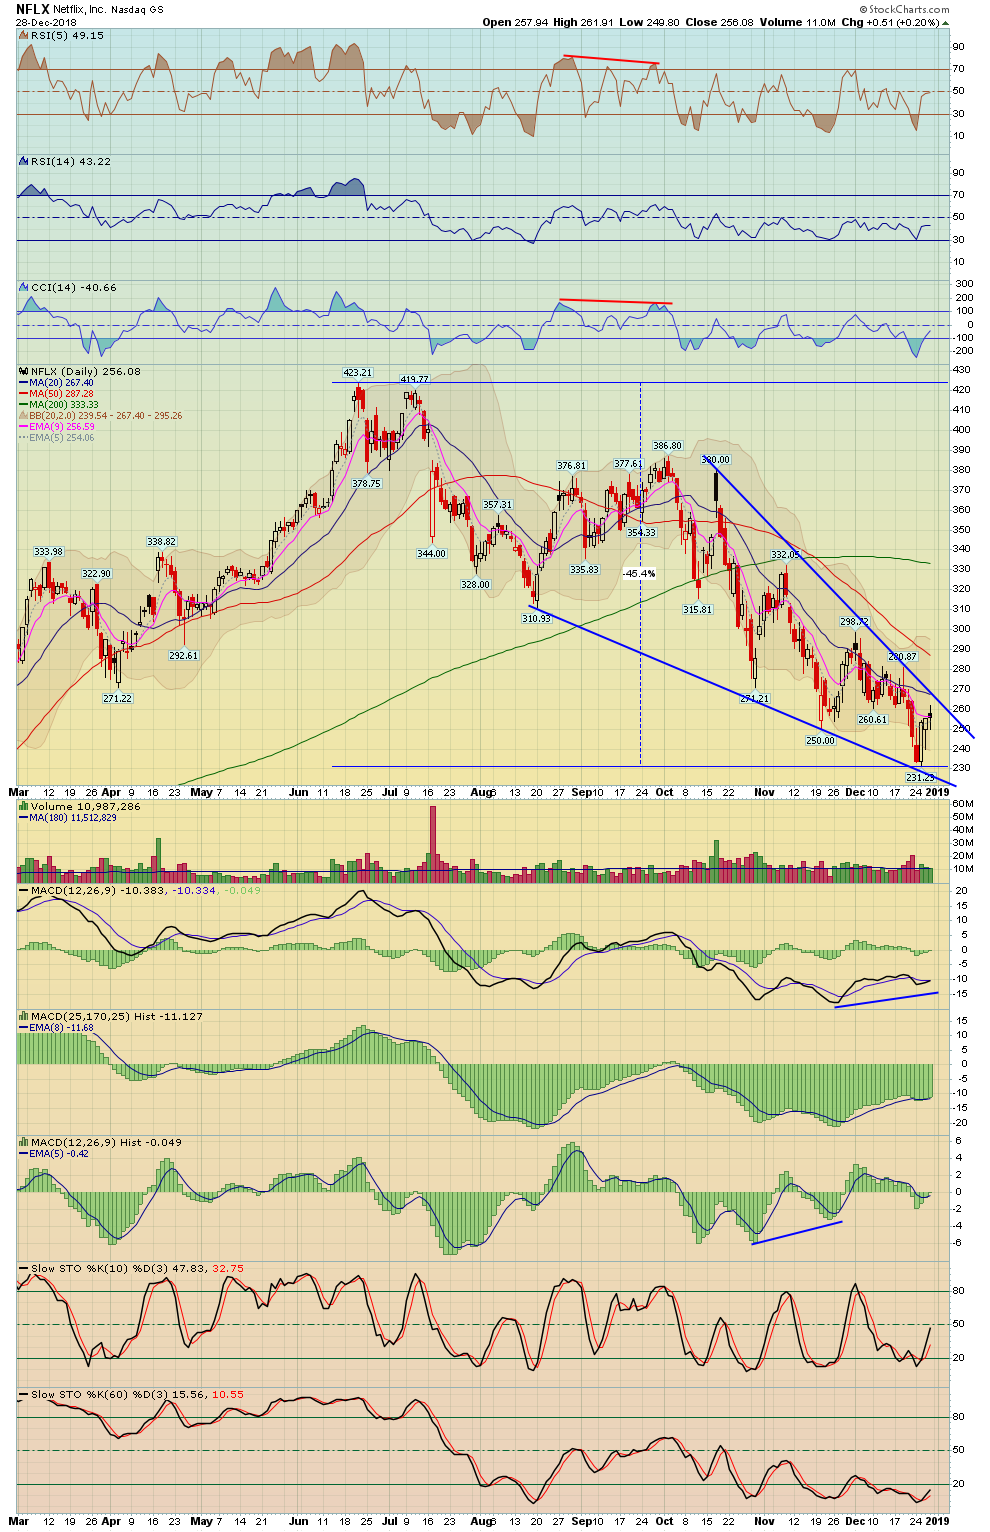
4. FANG Stocks
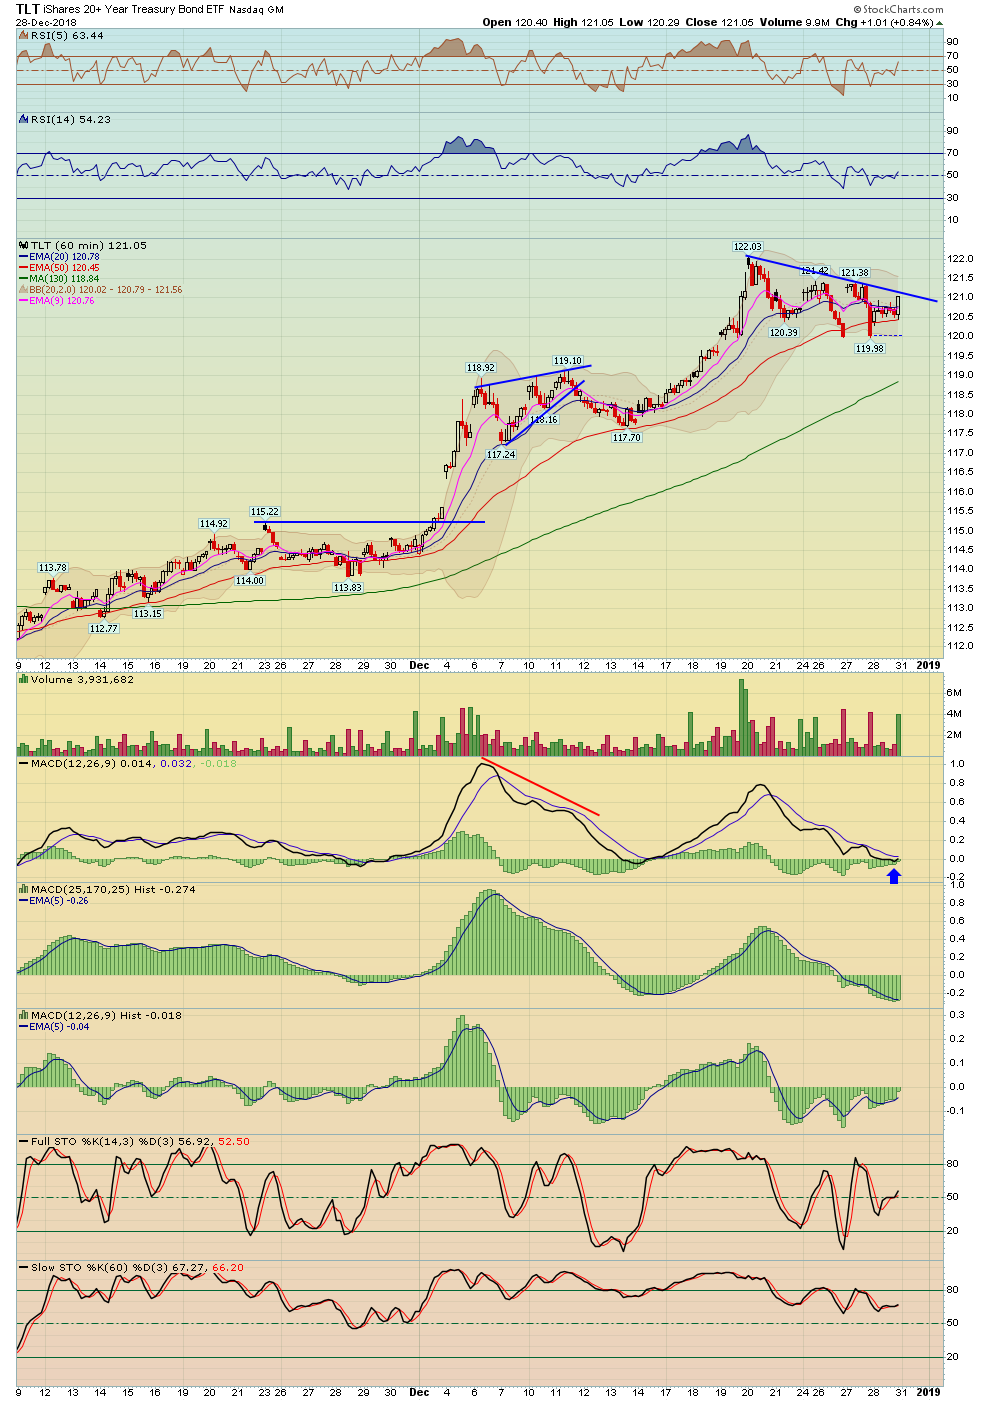
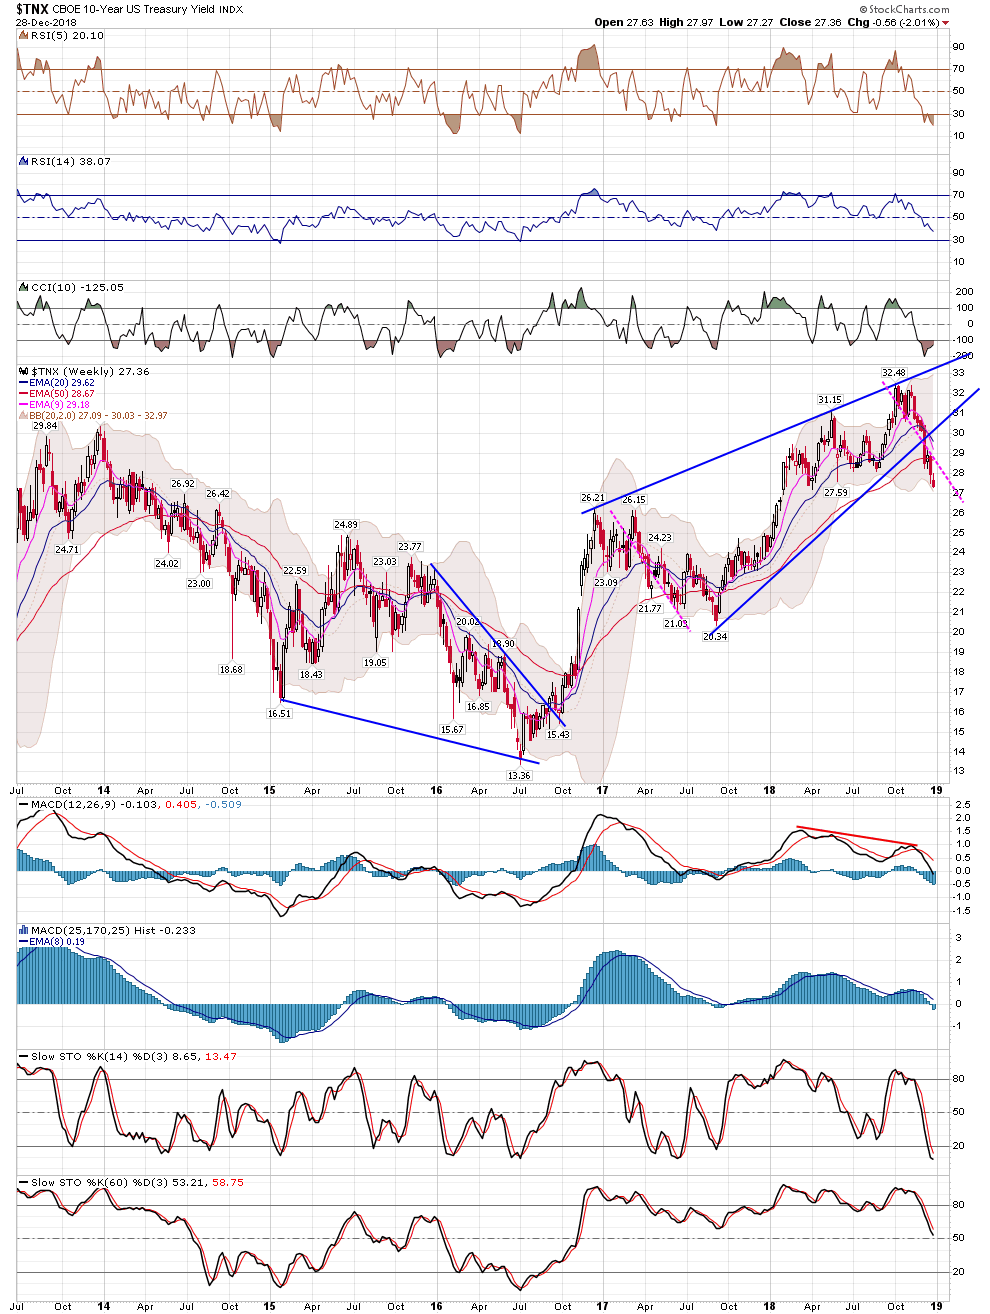
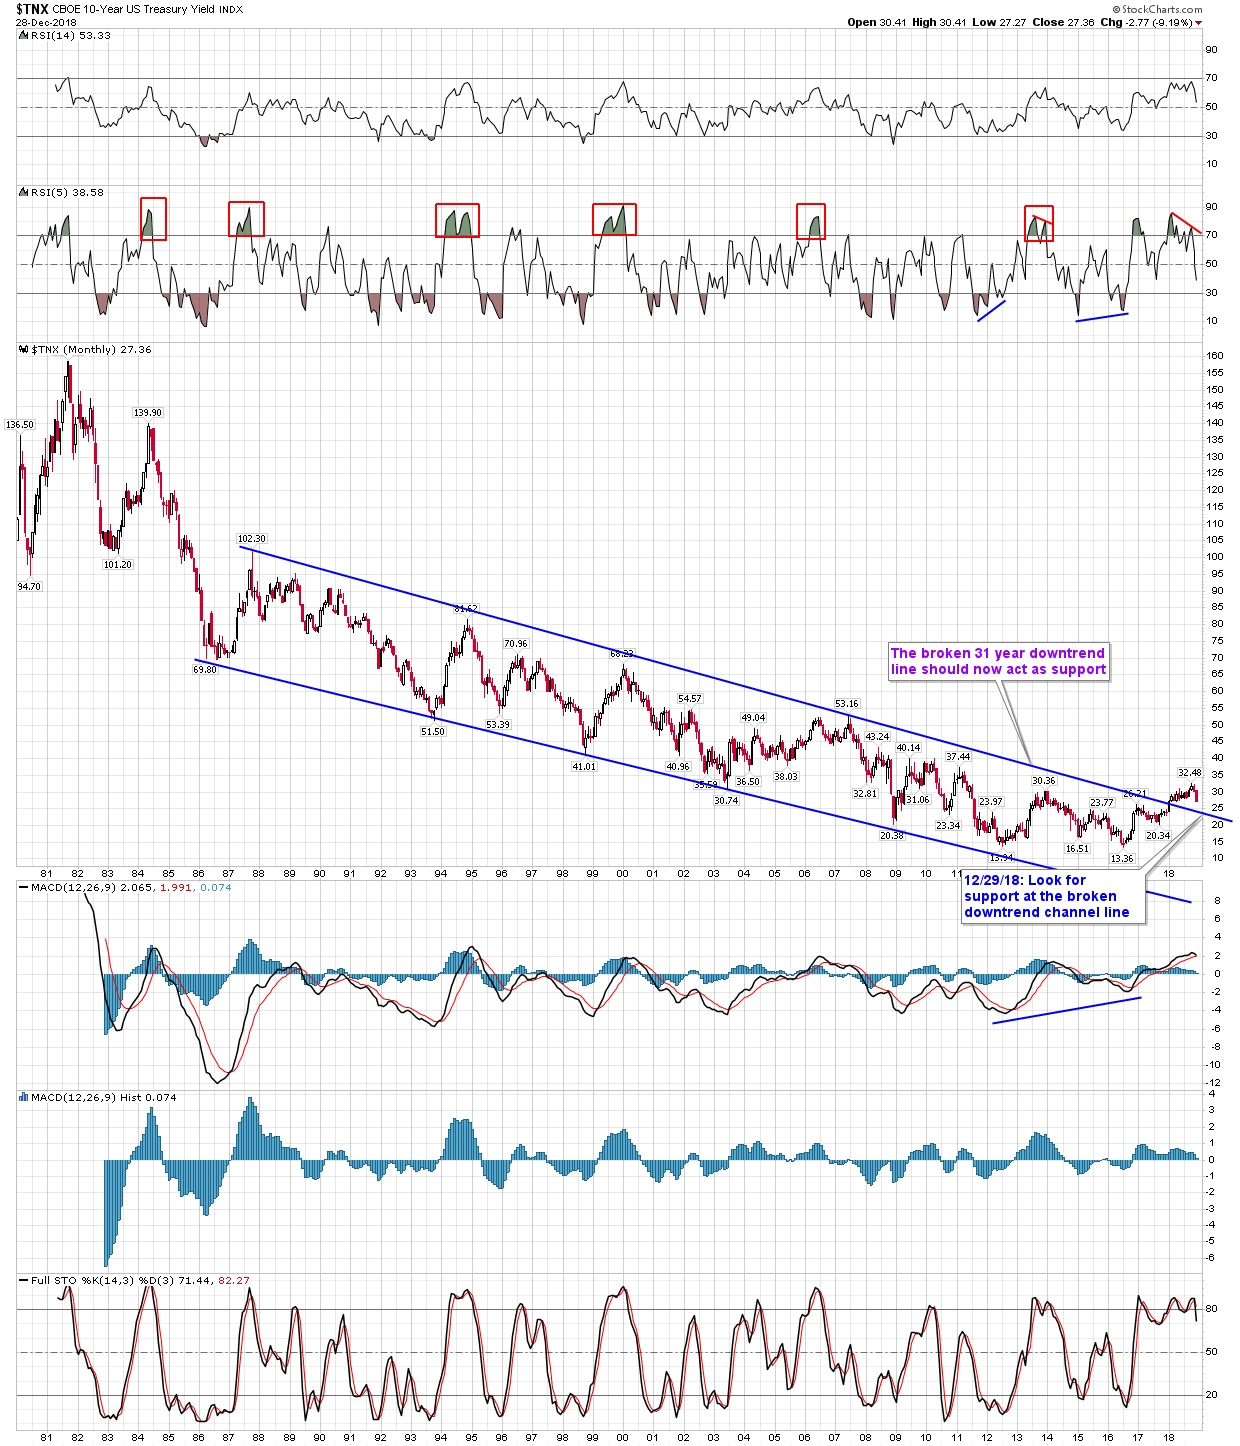
5. Bonds via TLT and HYG, 10 Year Yield
6. Commodities (Crude Oil, Natural Gas, Copper
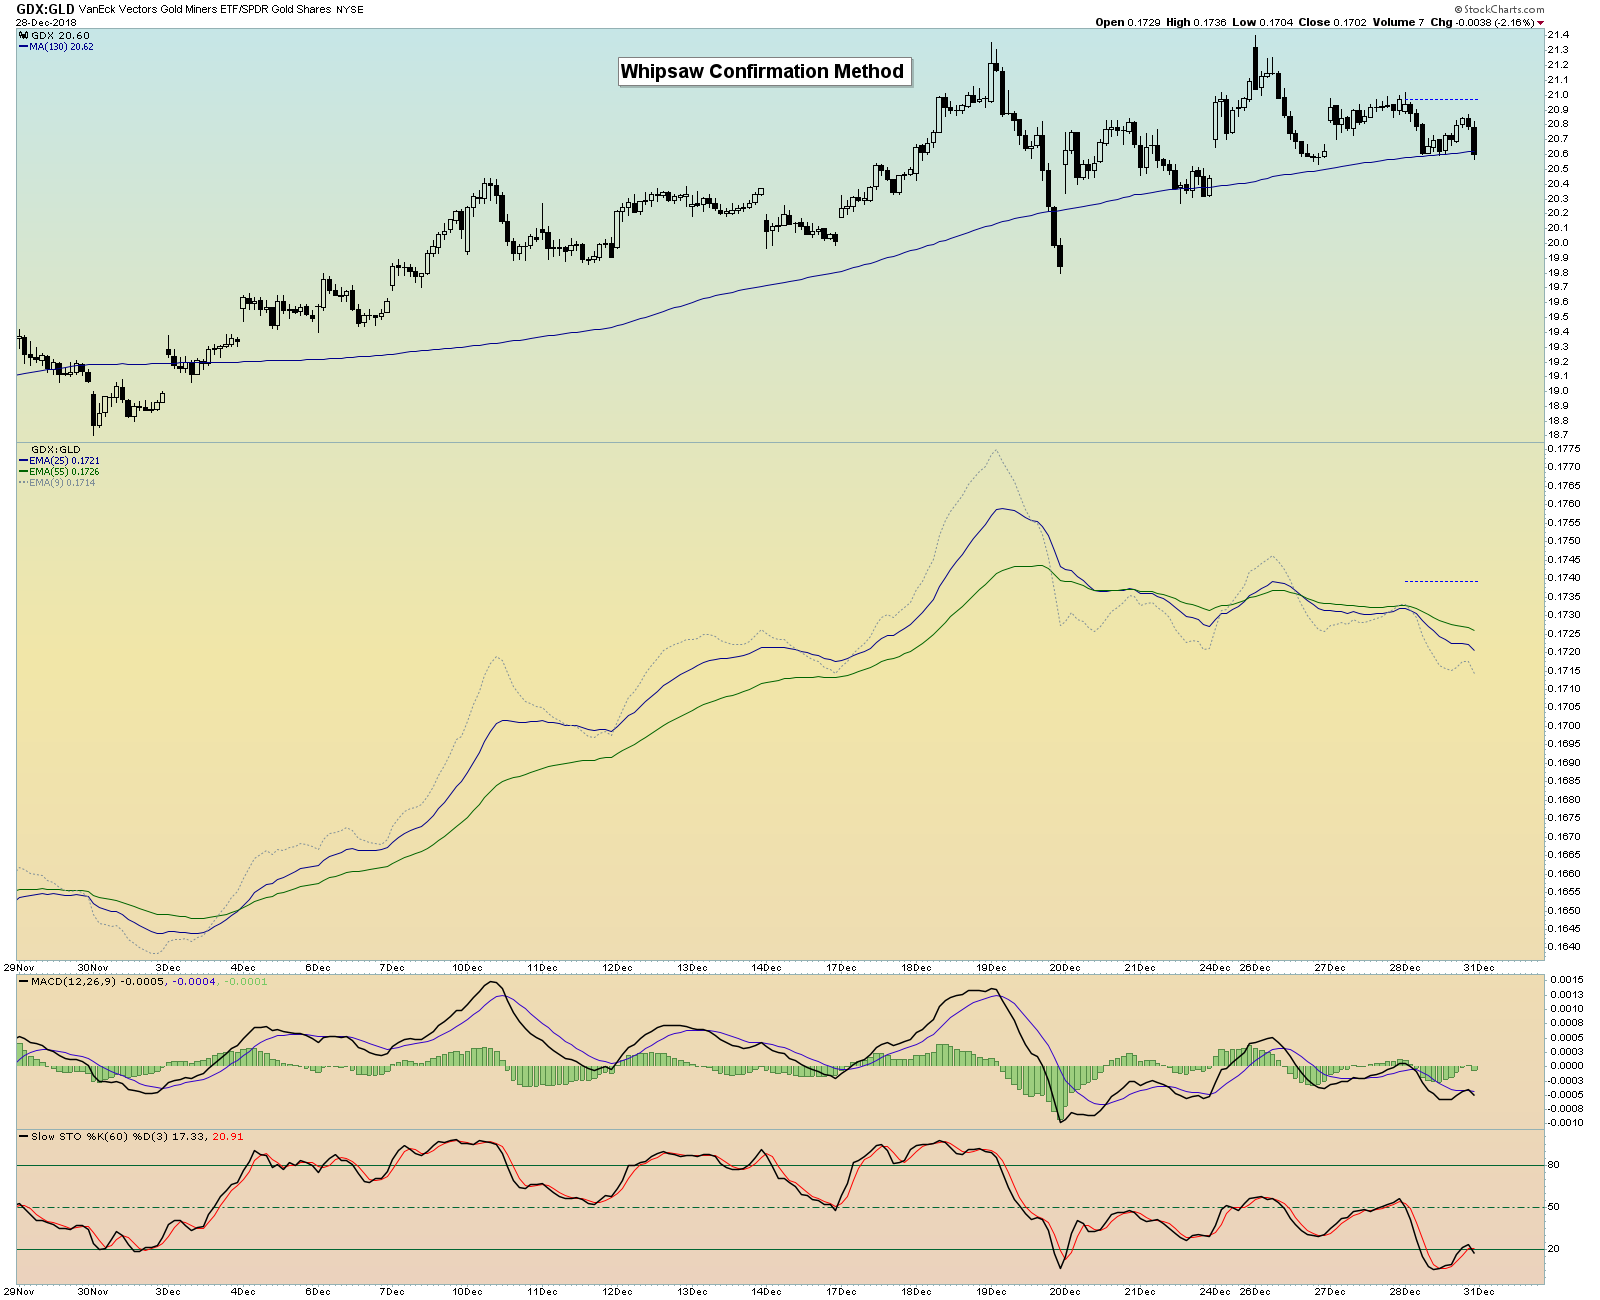
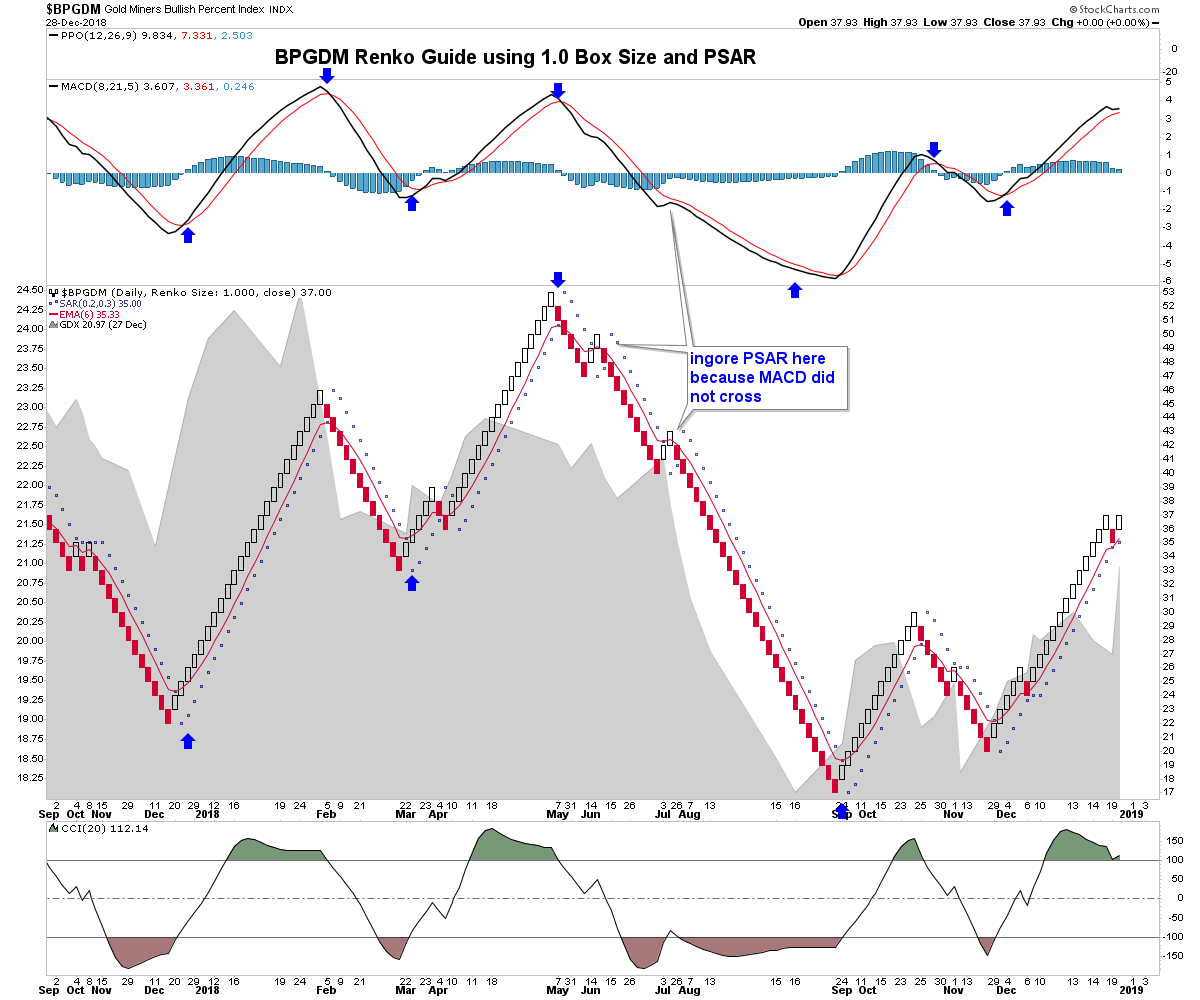
7. Precious Metals (US Dollar, Gold/Silver) and GDX
I hope everyone had a nice weekend so far! On Monday the bond market closes early at 2 pm, however the regular cash market is open for a full day, and of course the market is closed on Tuesday for New Years.
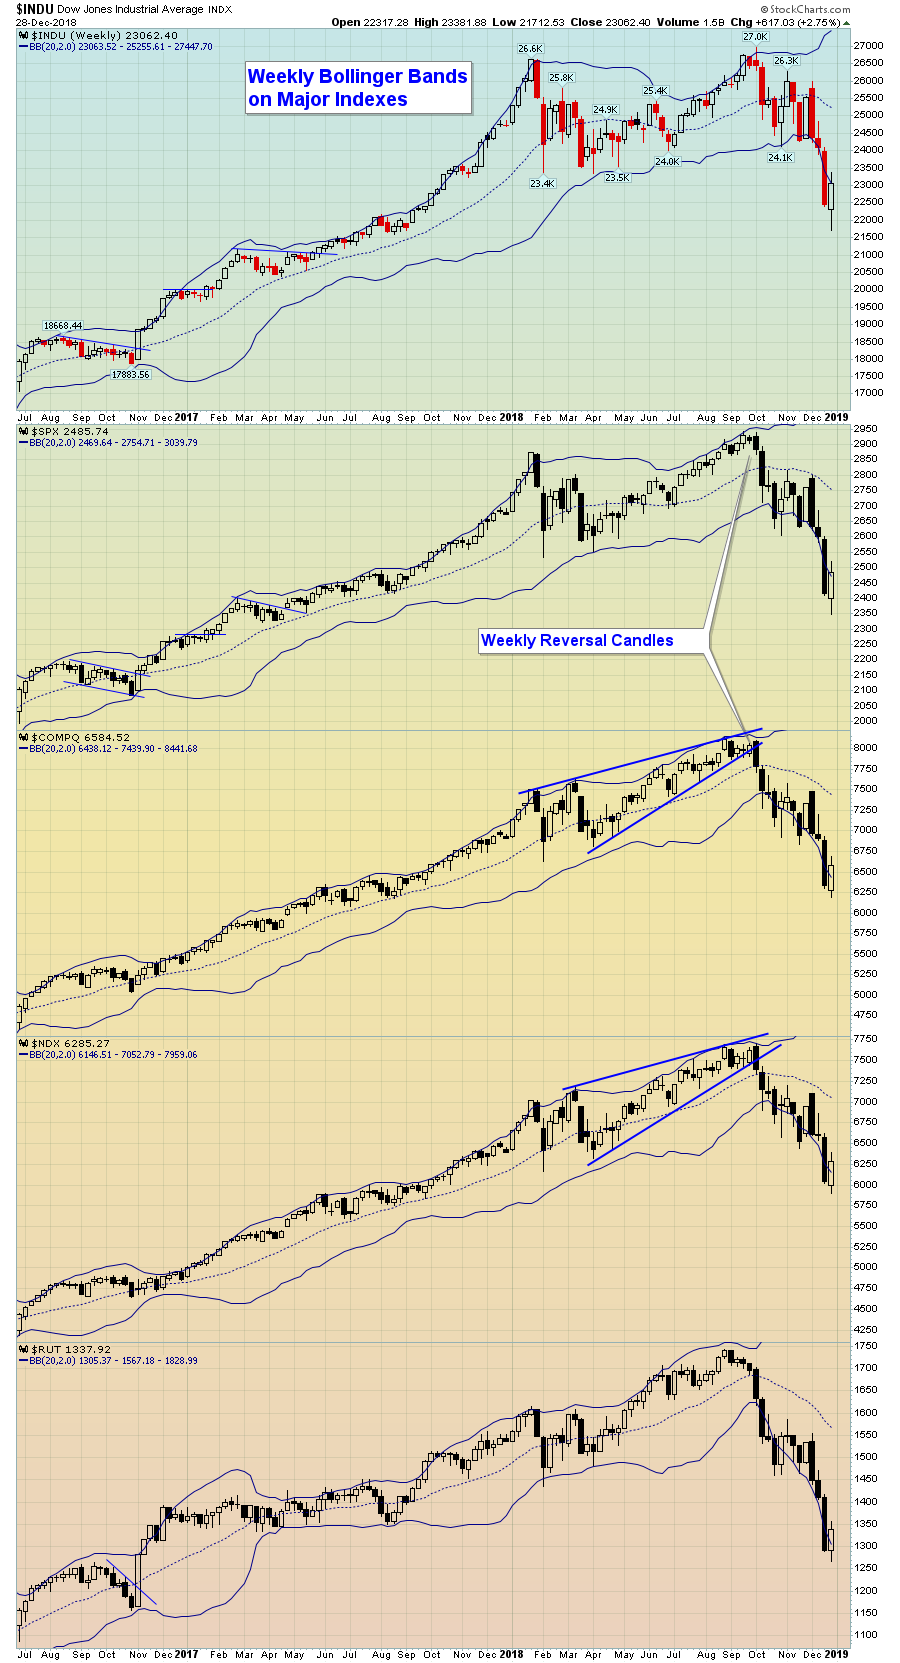
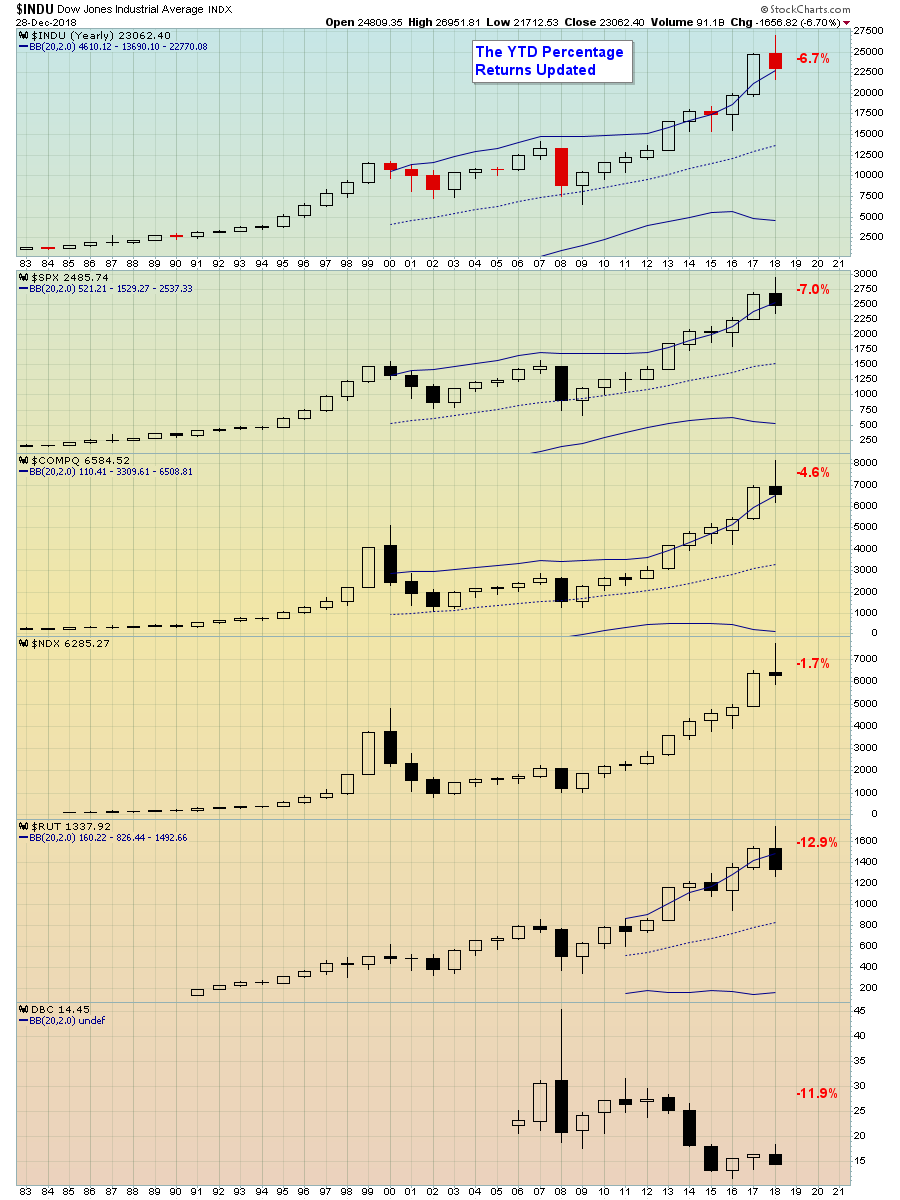
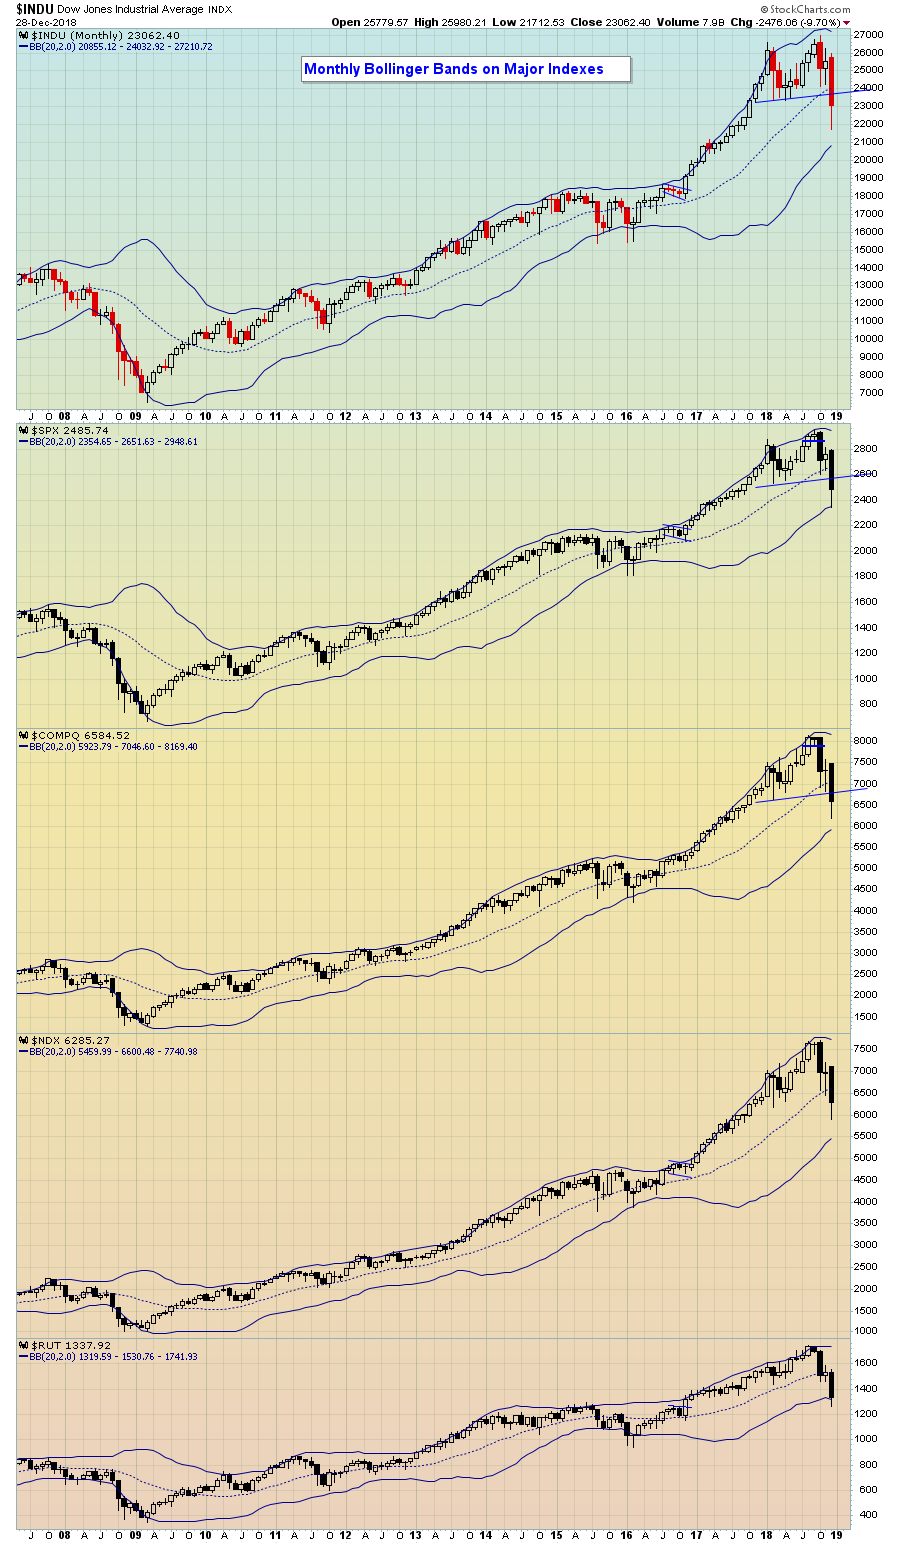
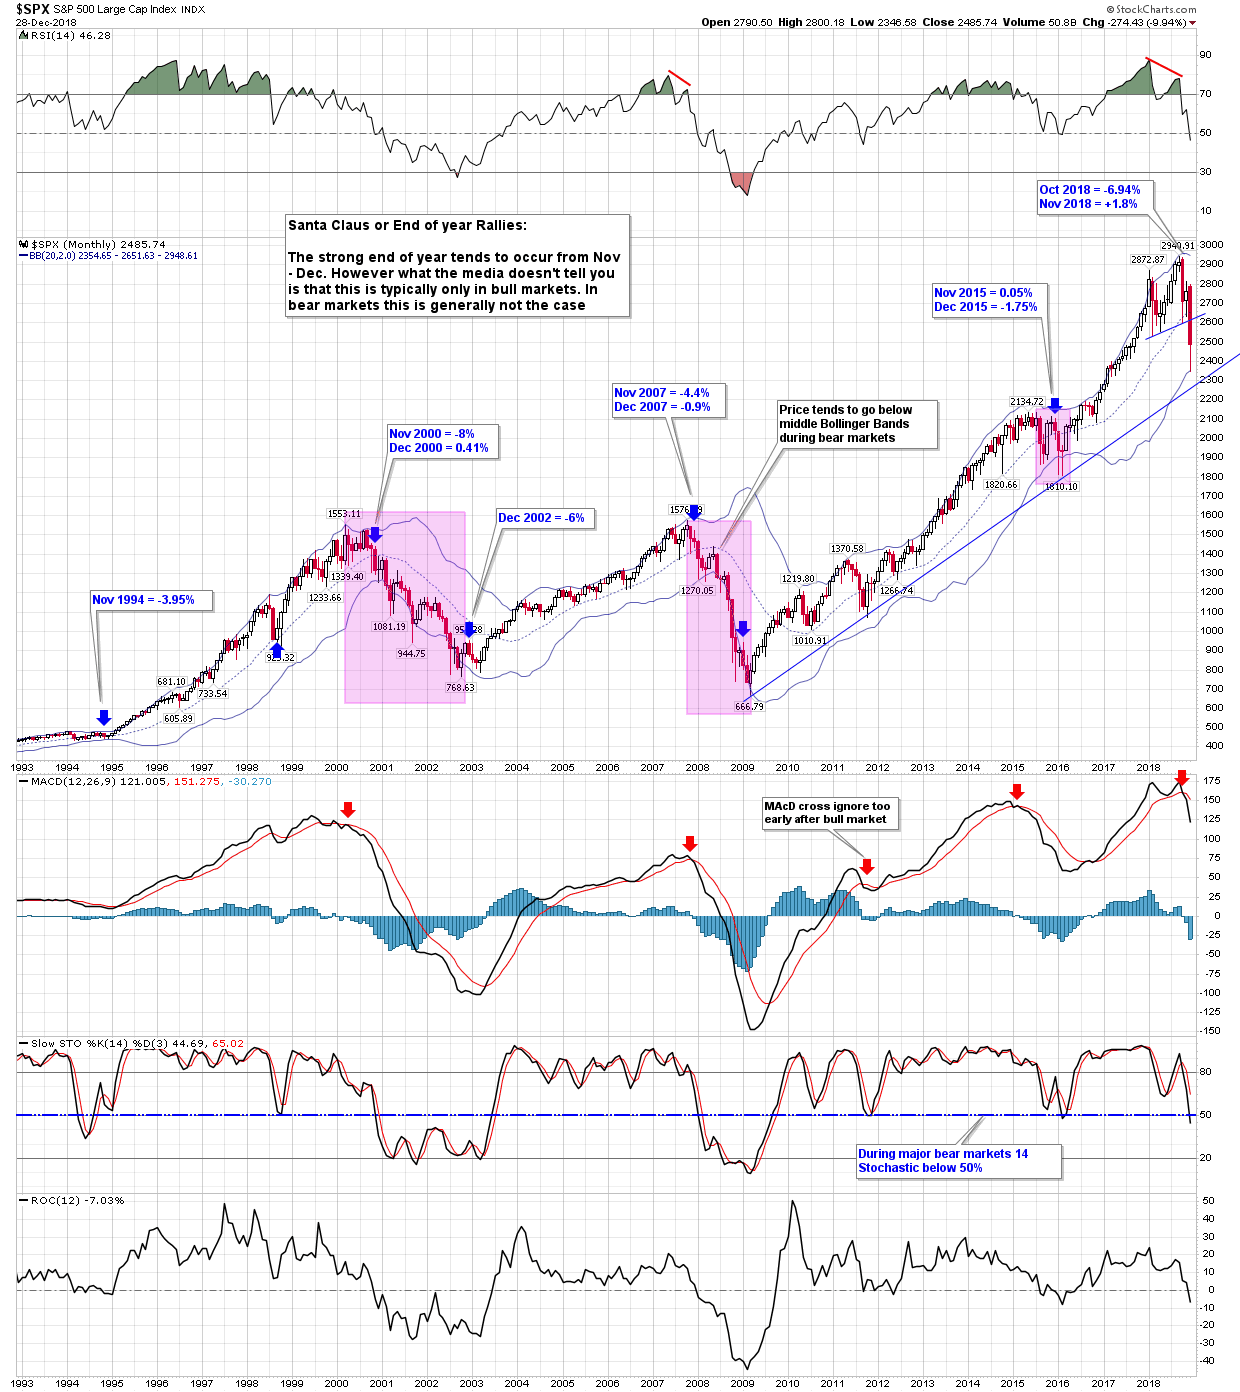
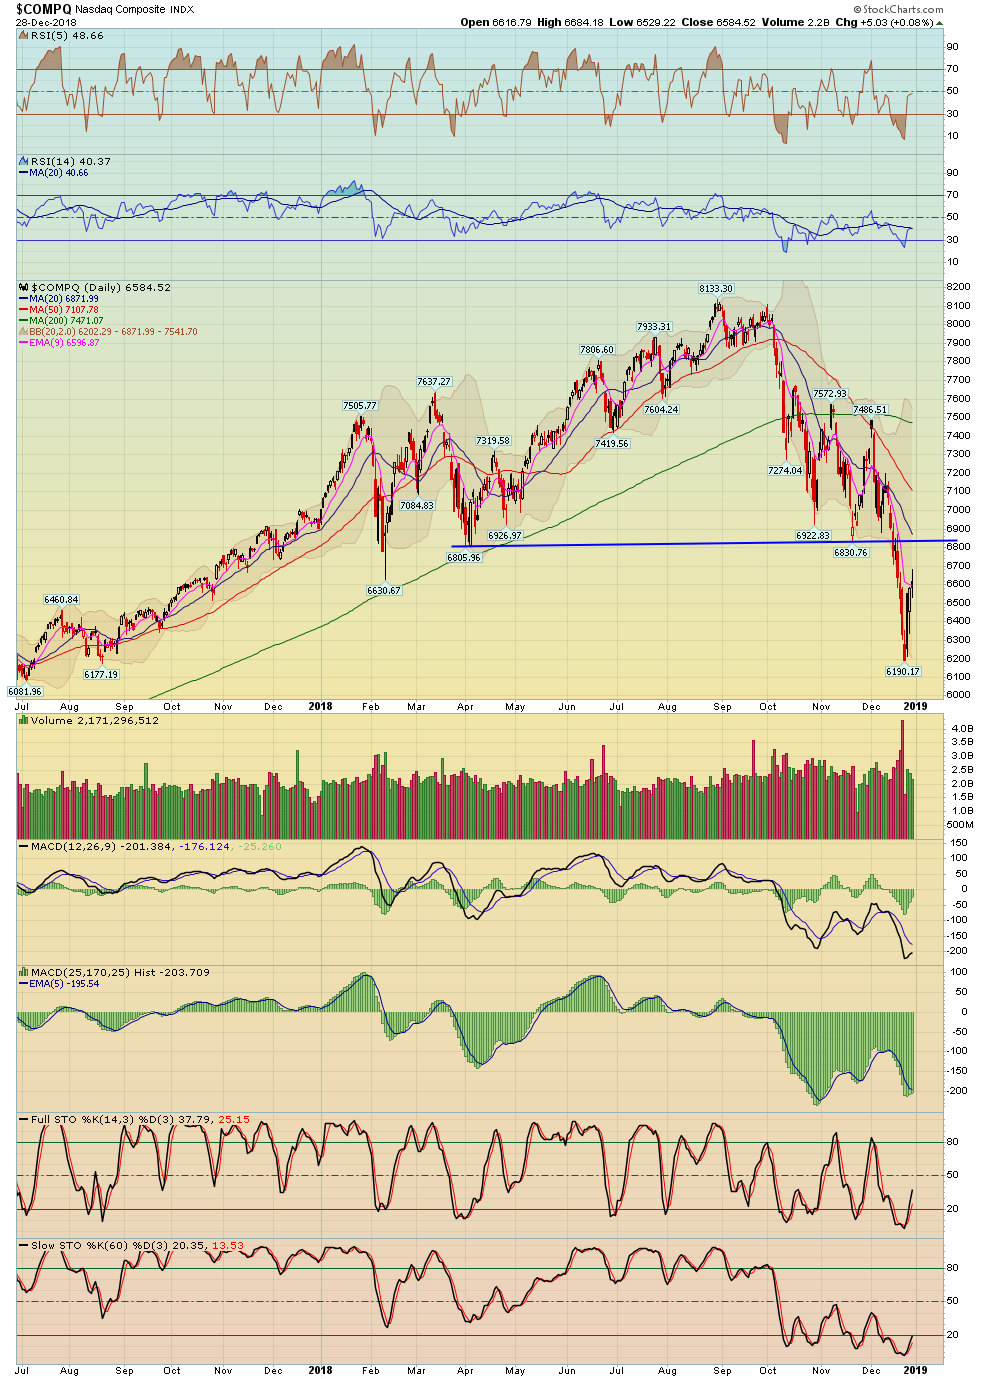
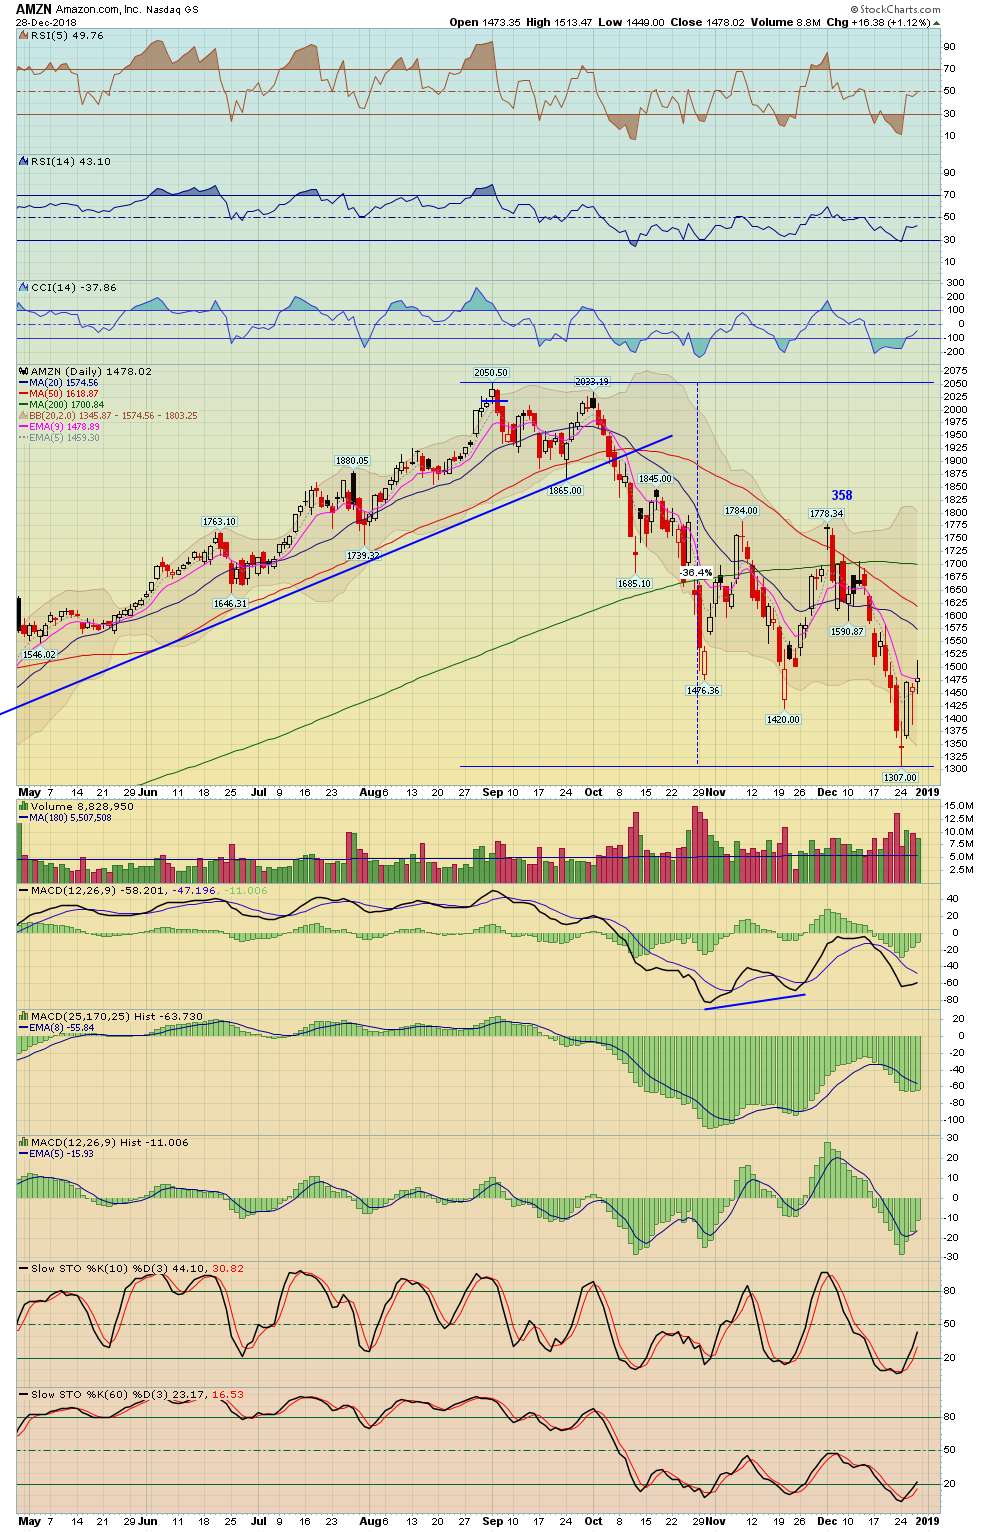
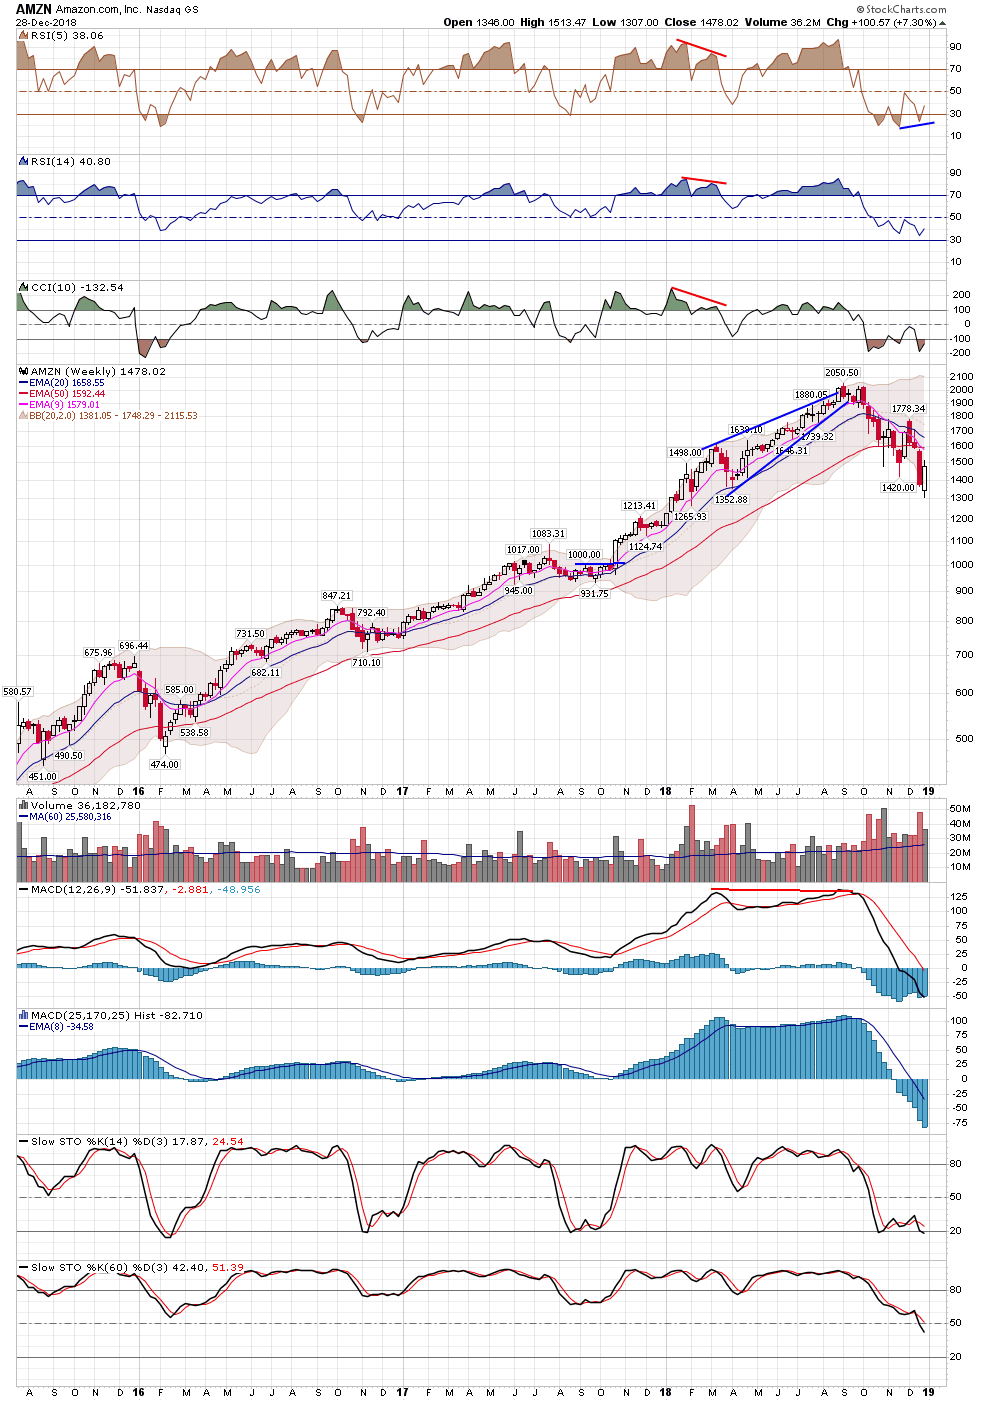
I'm not going to write too much text here as I will be covering my thoughts in me detailed audio transcription so please listen to the full newsletter audio. In short as you know 2018 has been a wild ride for the market with two major corrections; one in Feb/Mar, and one from Oct to present. The market was negative for the year in Feb after that sharp fast 12% correction, and was then up nicely for the year in early fall up about 11 - 14%, and now is down -7% - 14% for the year depending on the index. Thus it's been a wild roller coaster ride. In 2017 the market experienced it's lowest volatility in history, and as Steve and I predicted, 2018 would be a very volatile year and boy was it ever!
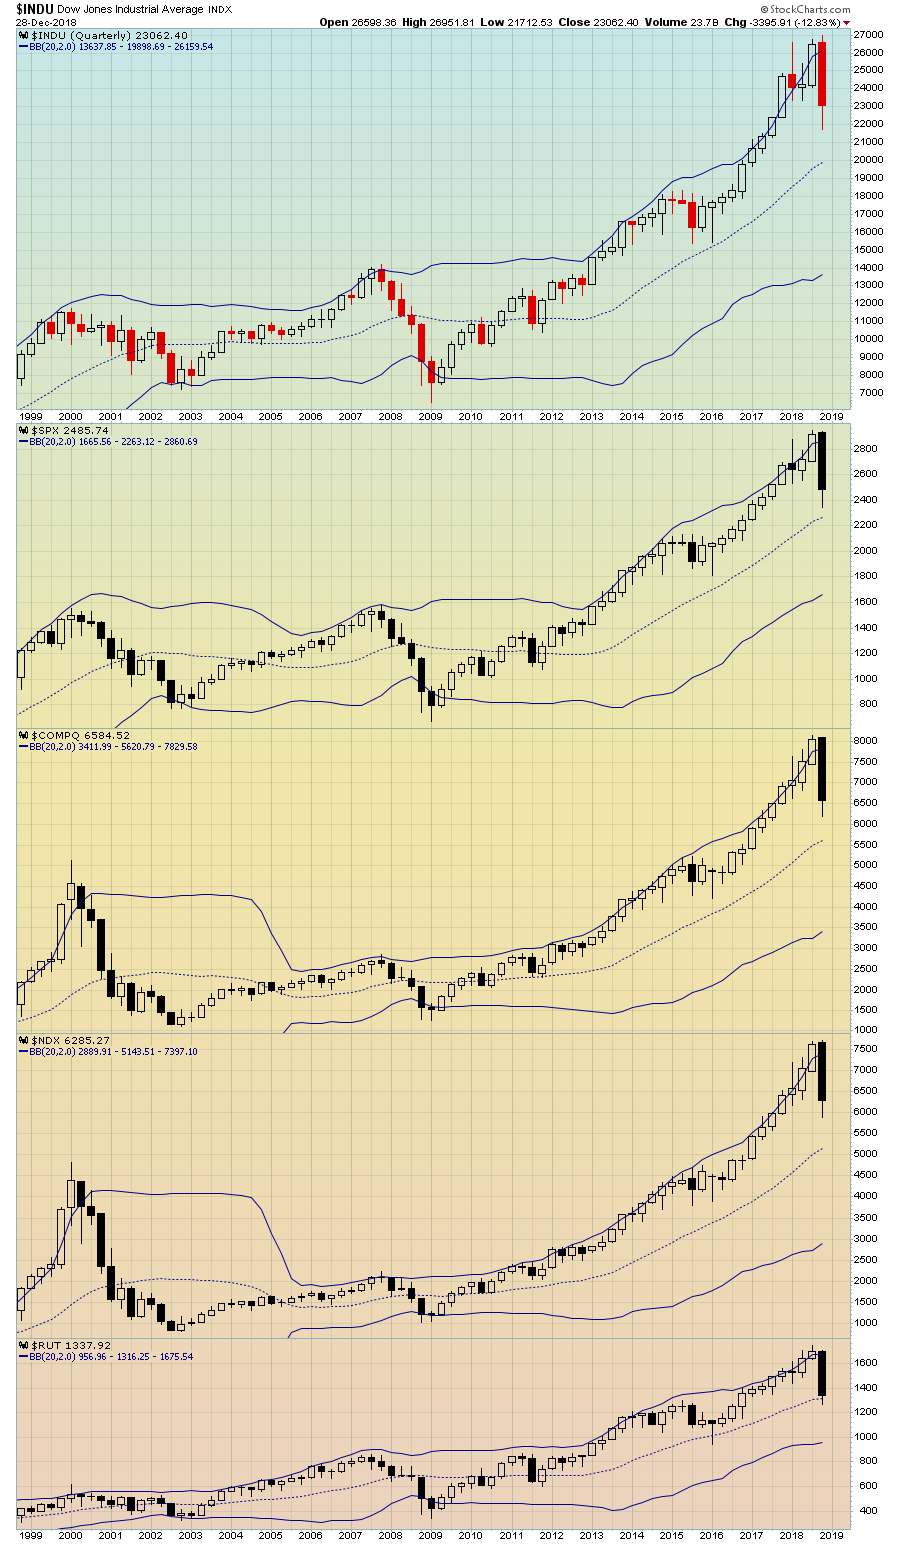
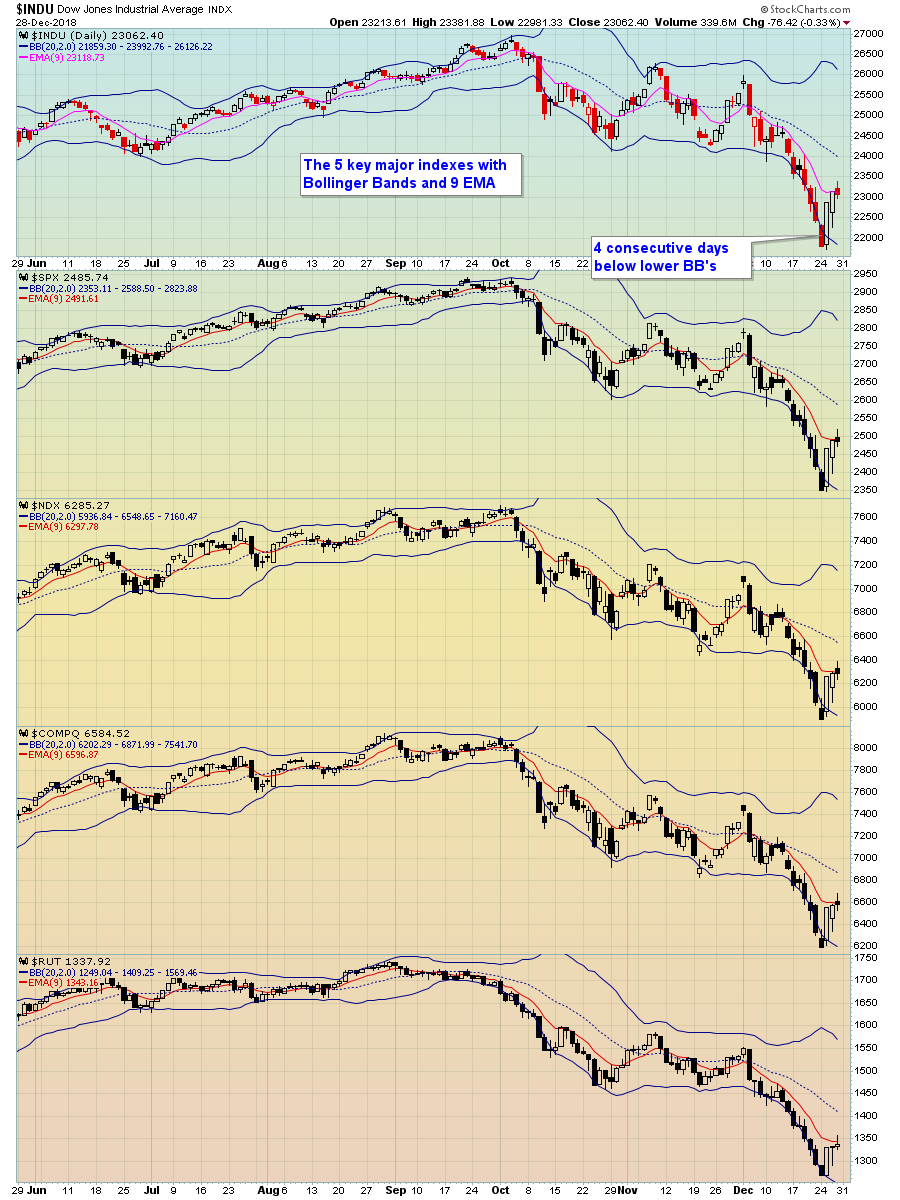
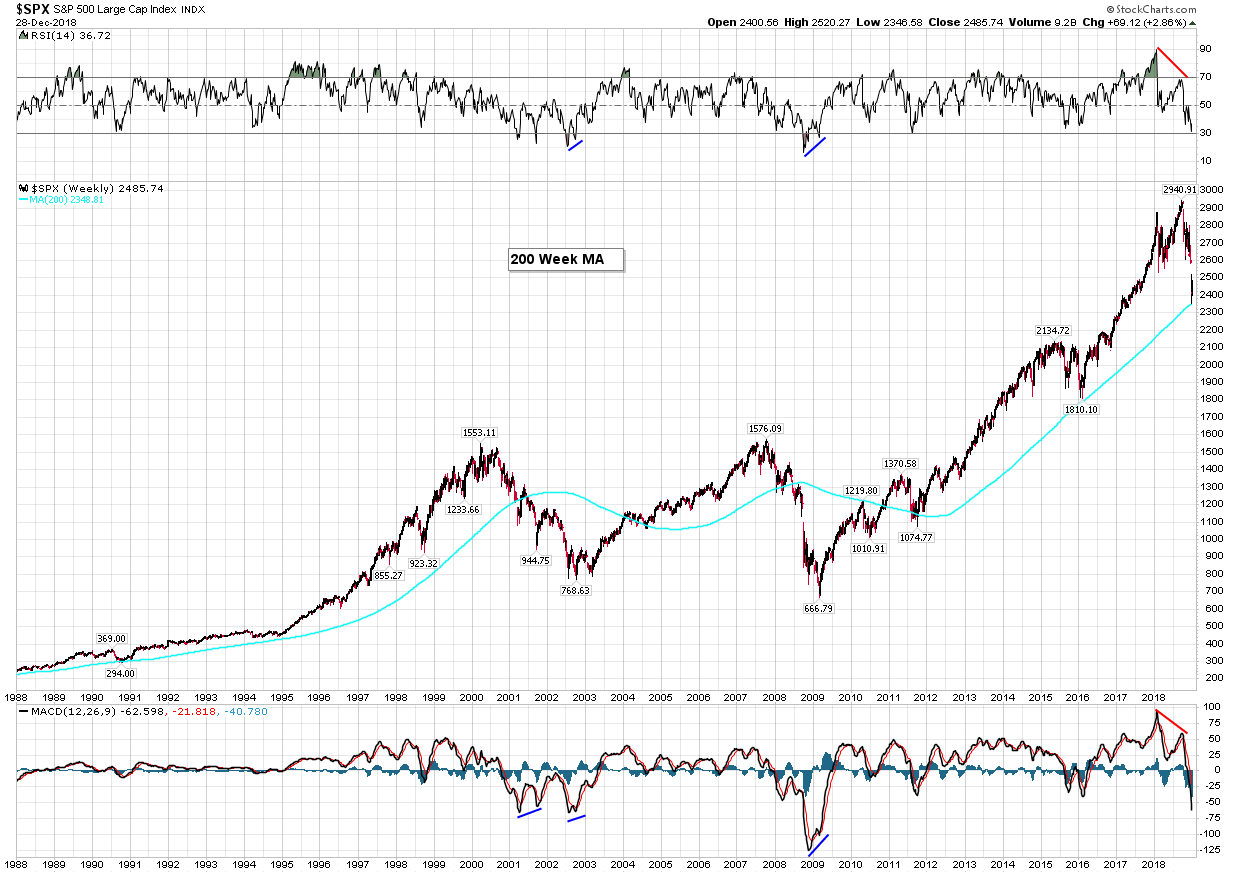
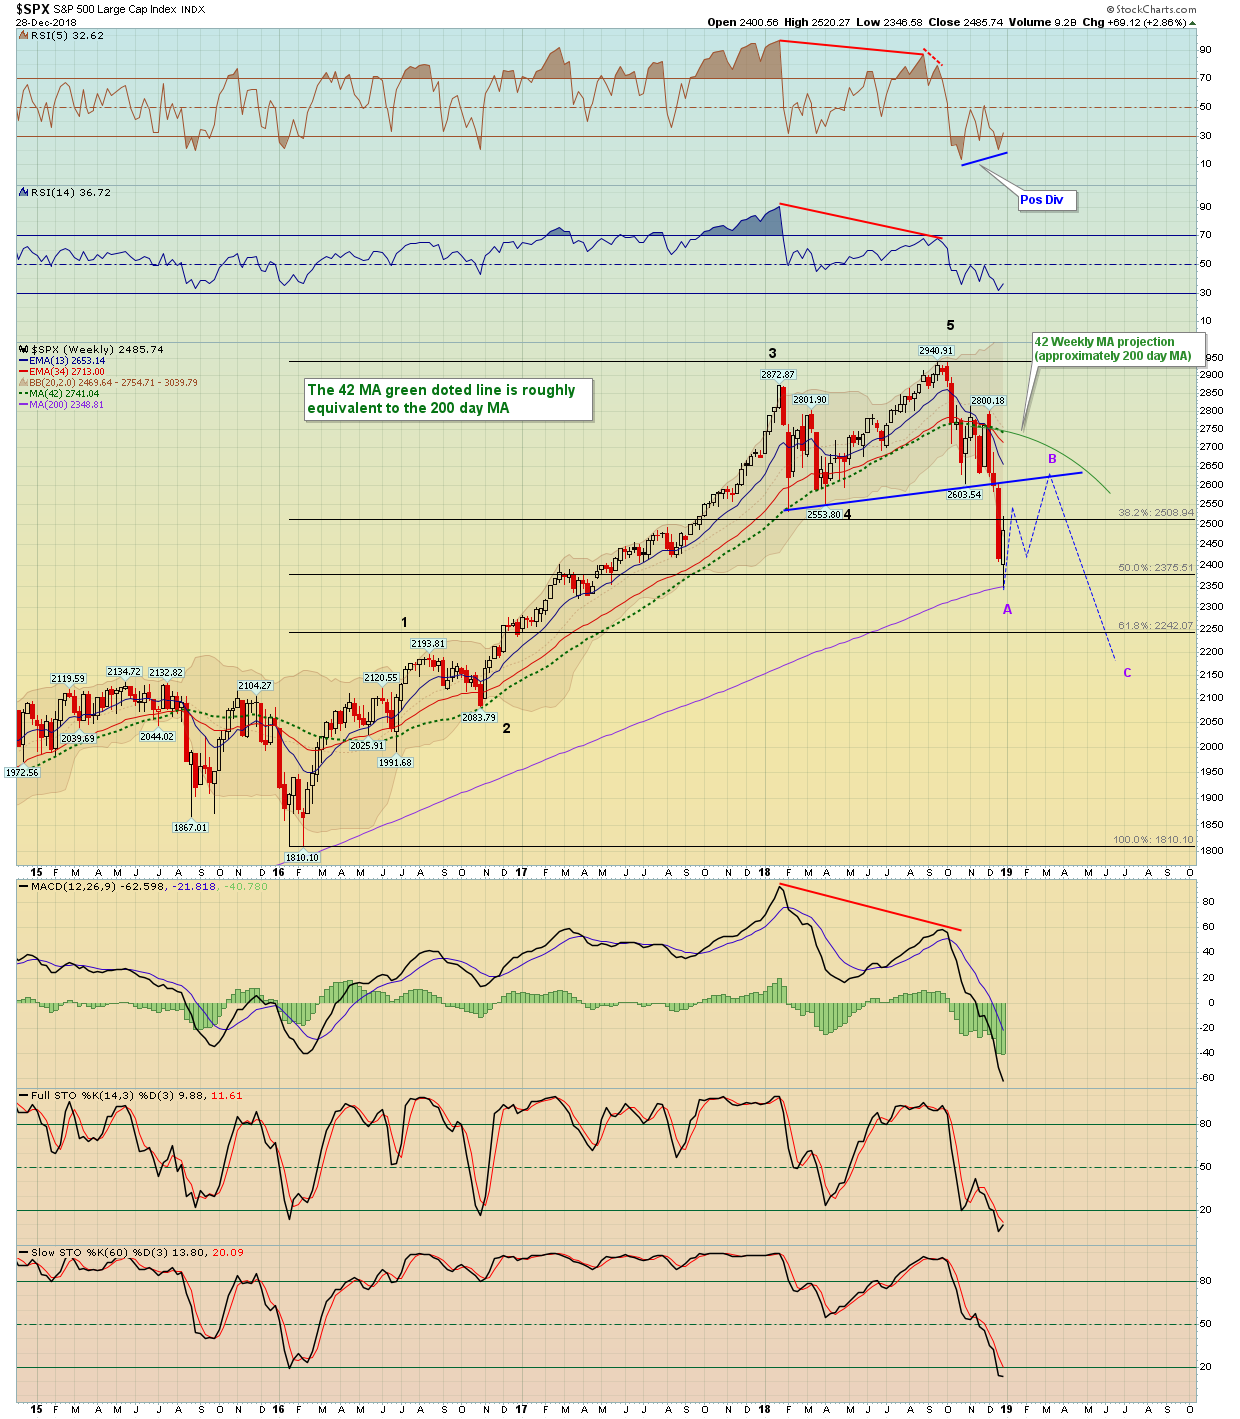
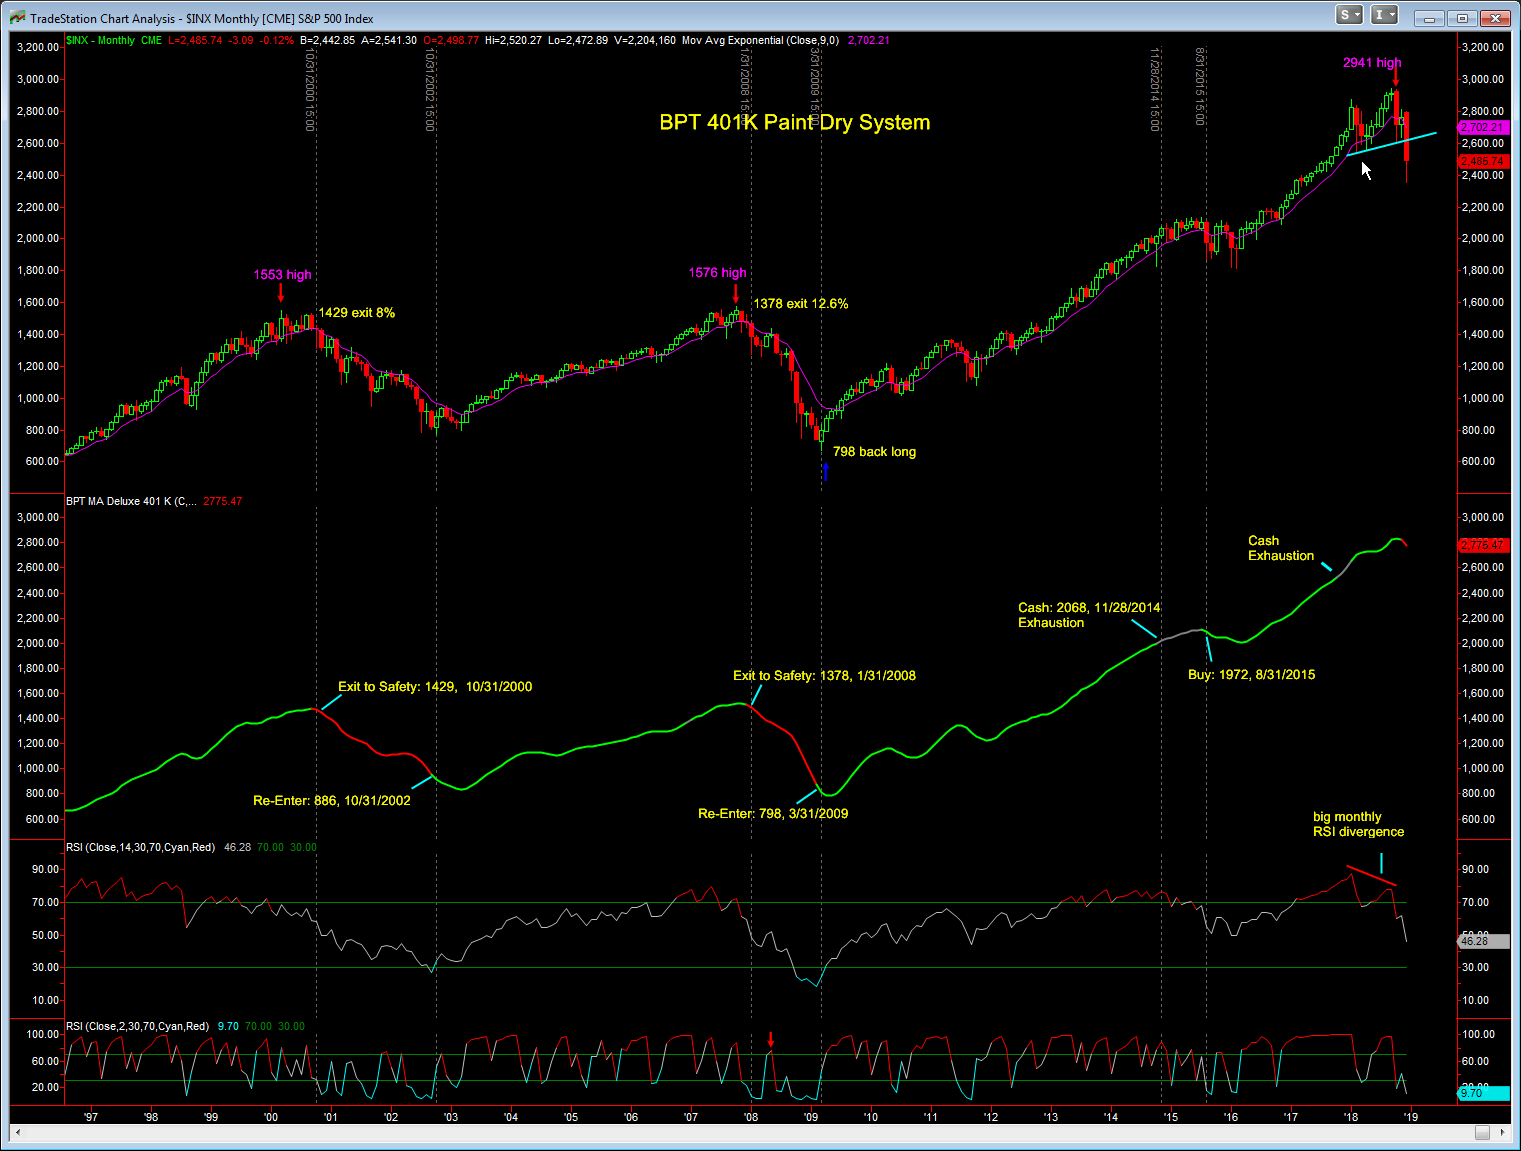
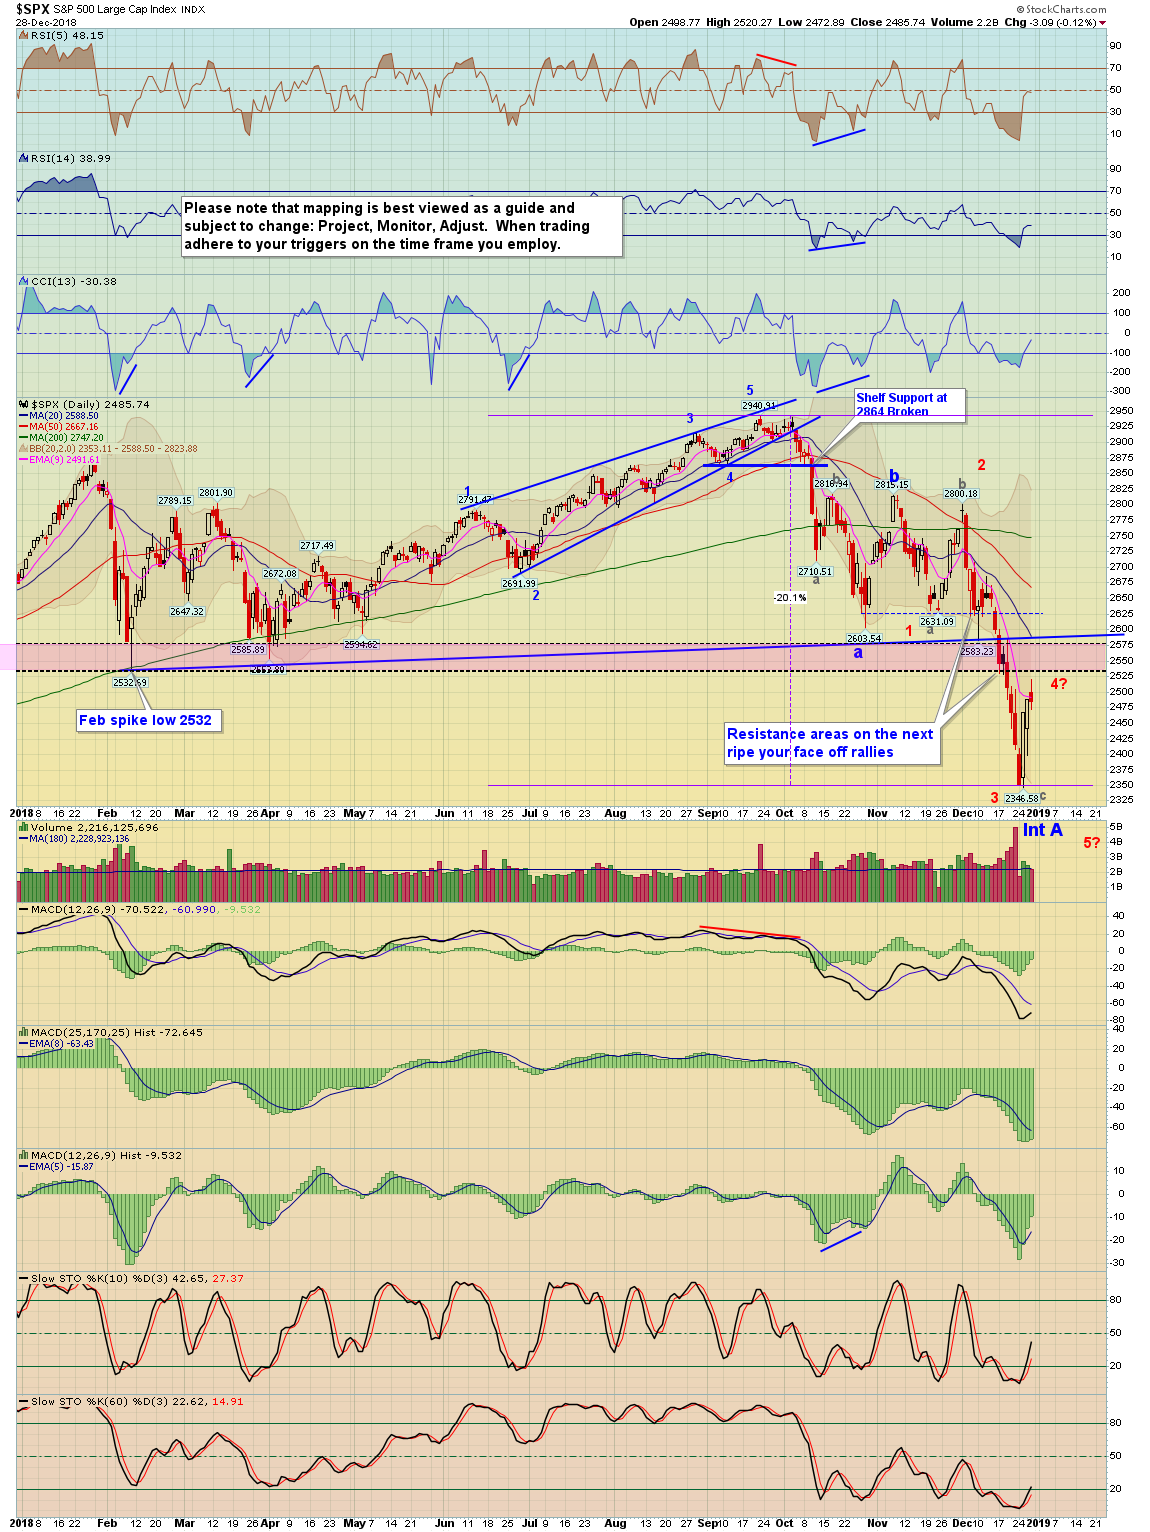
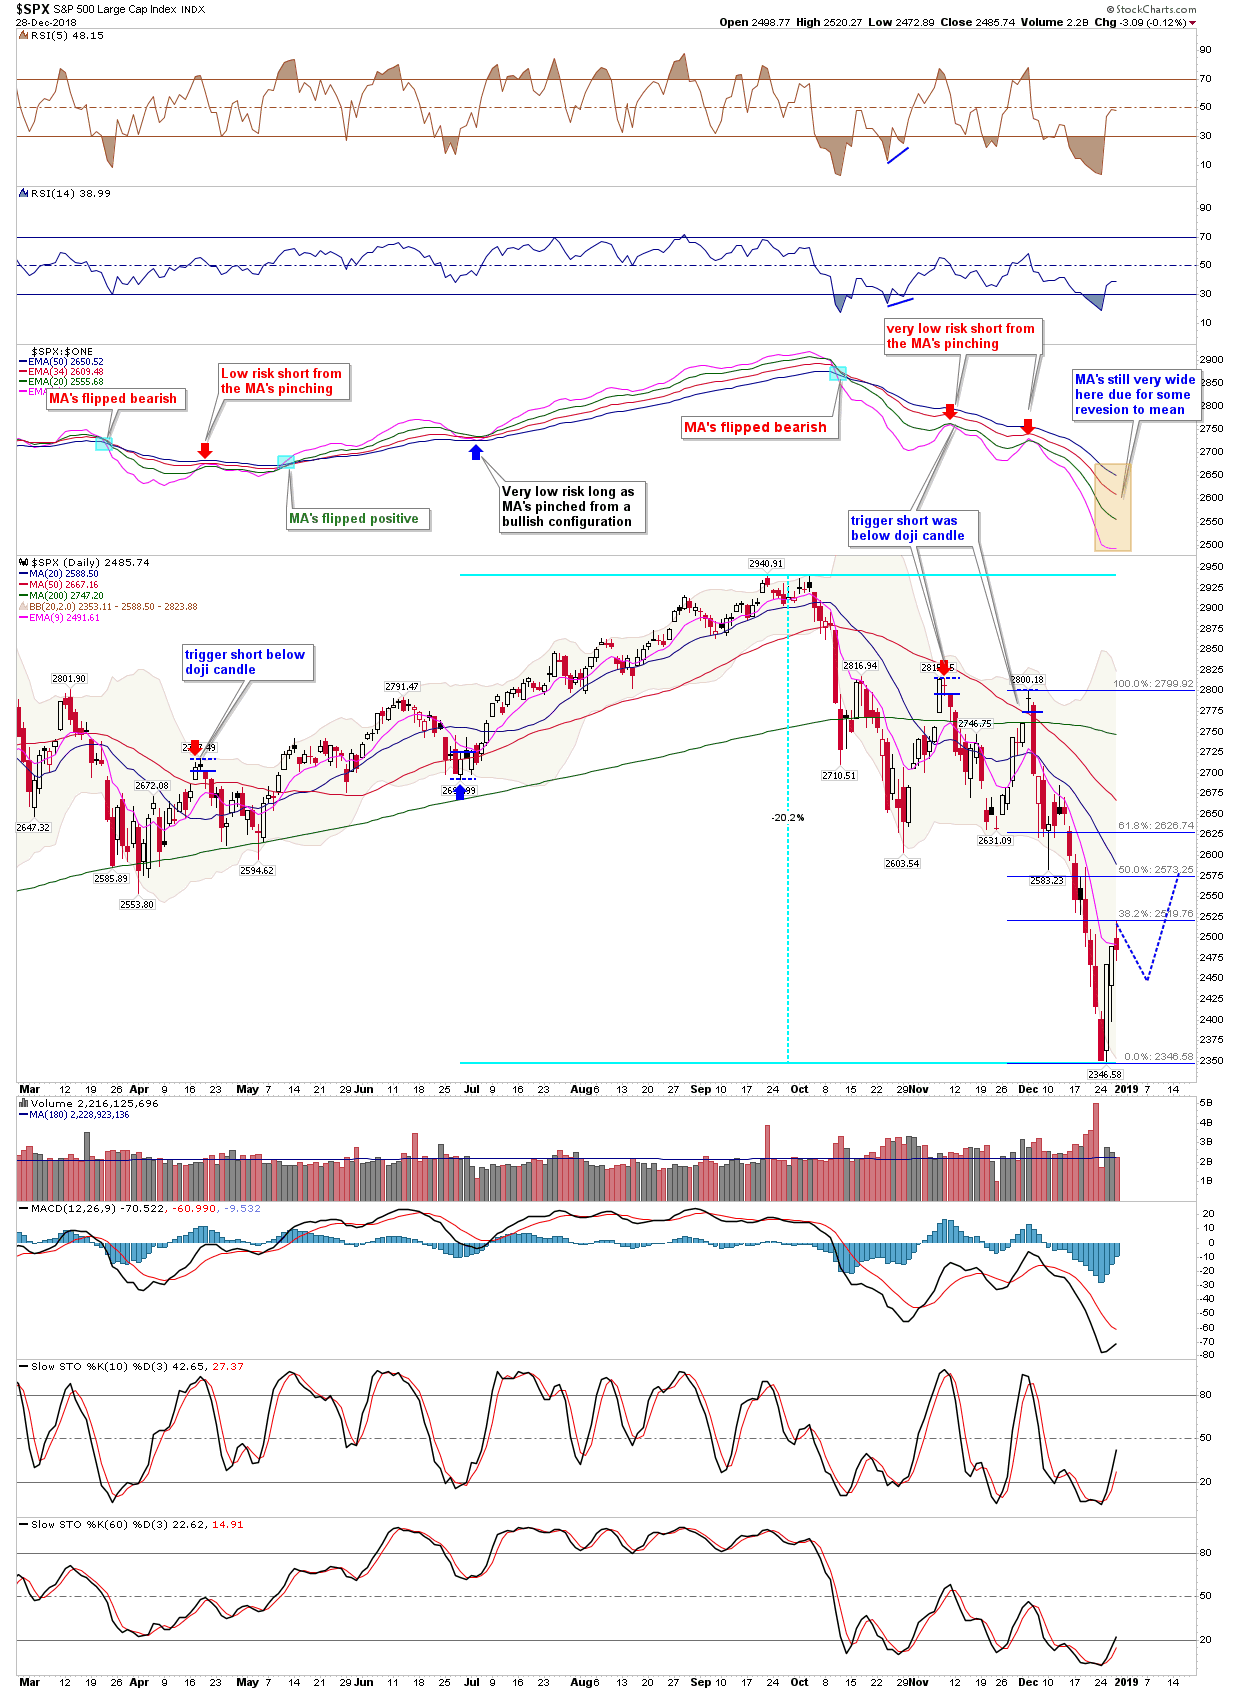
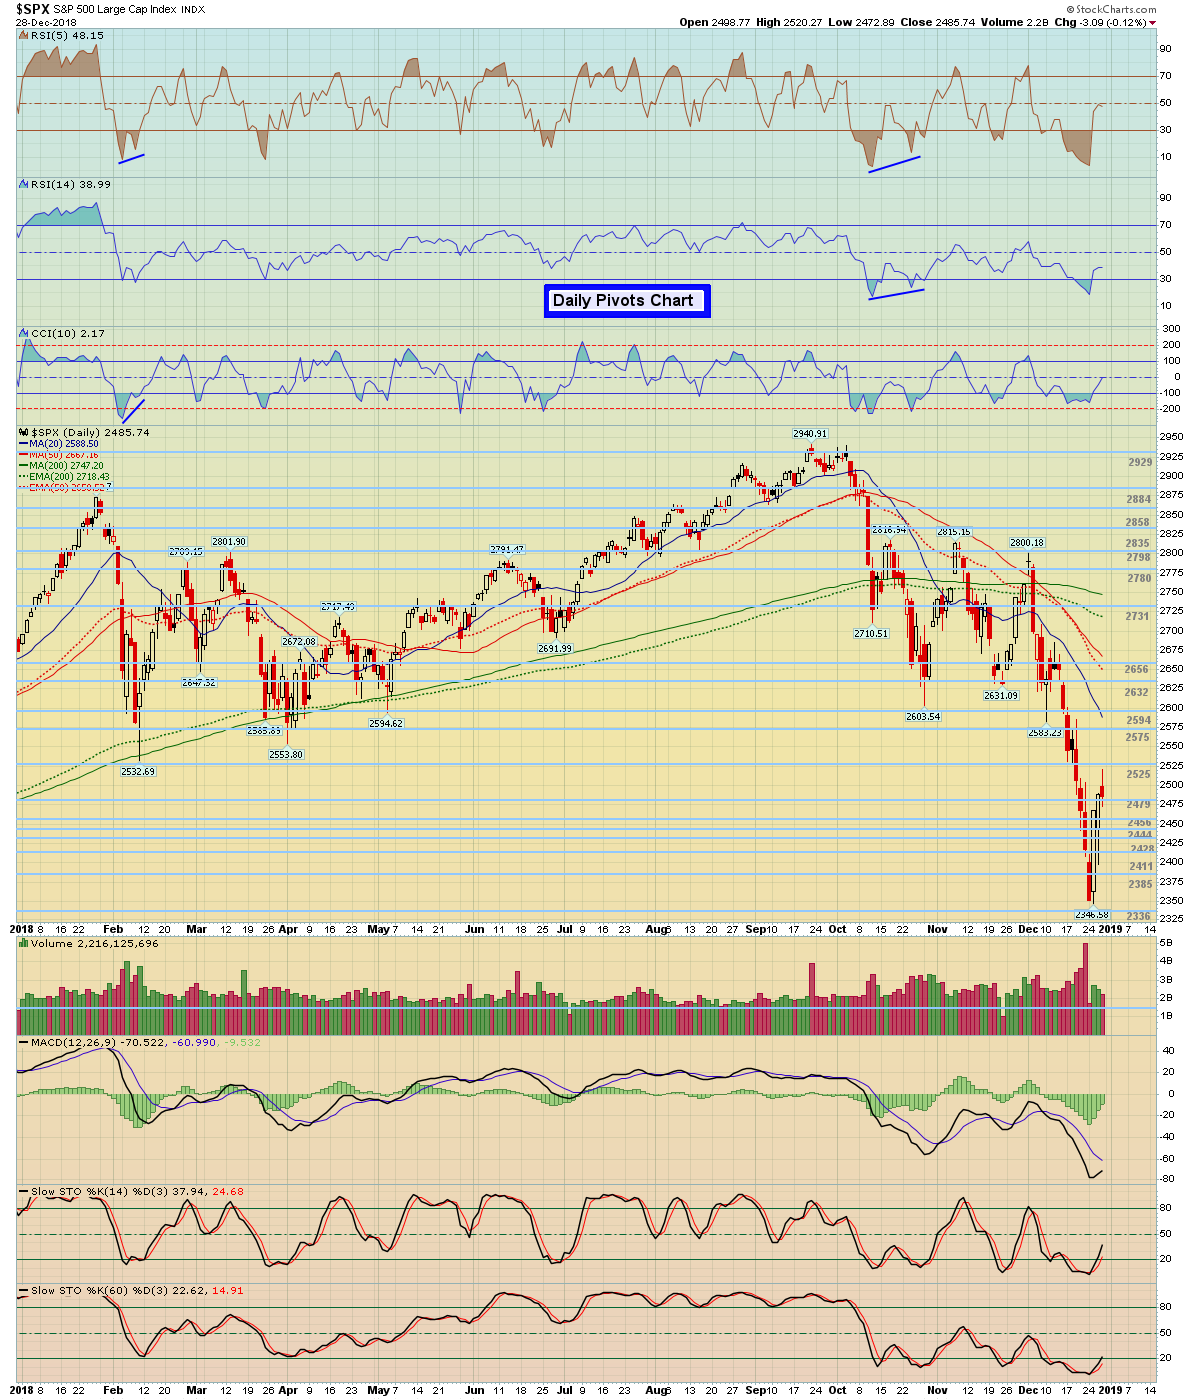
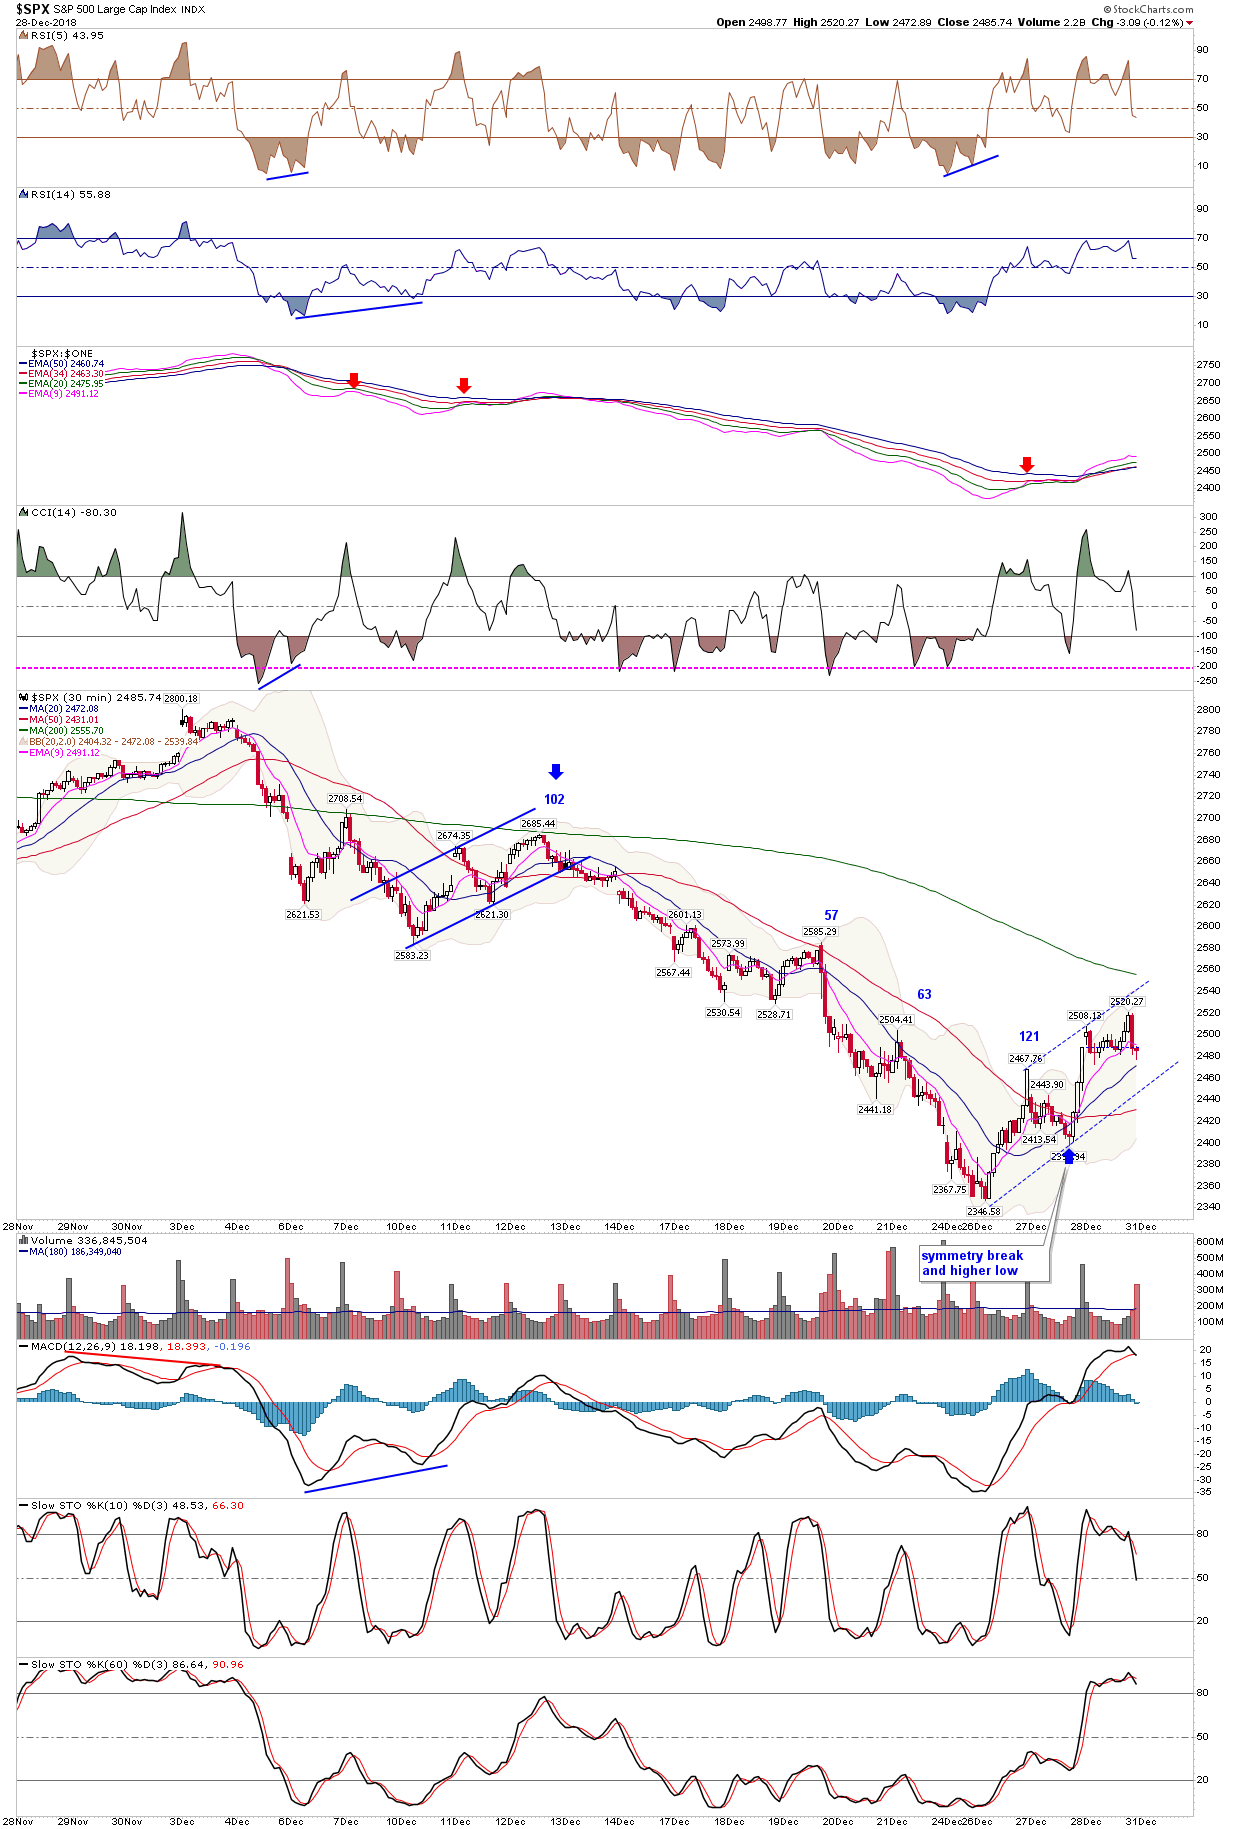
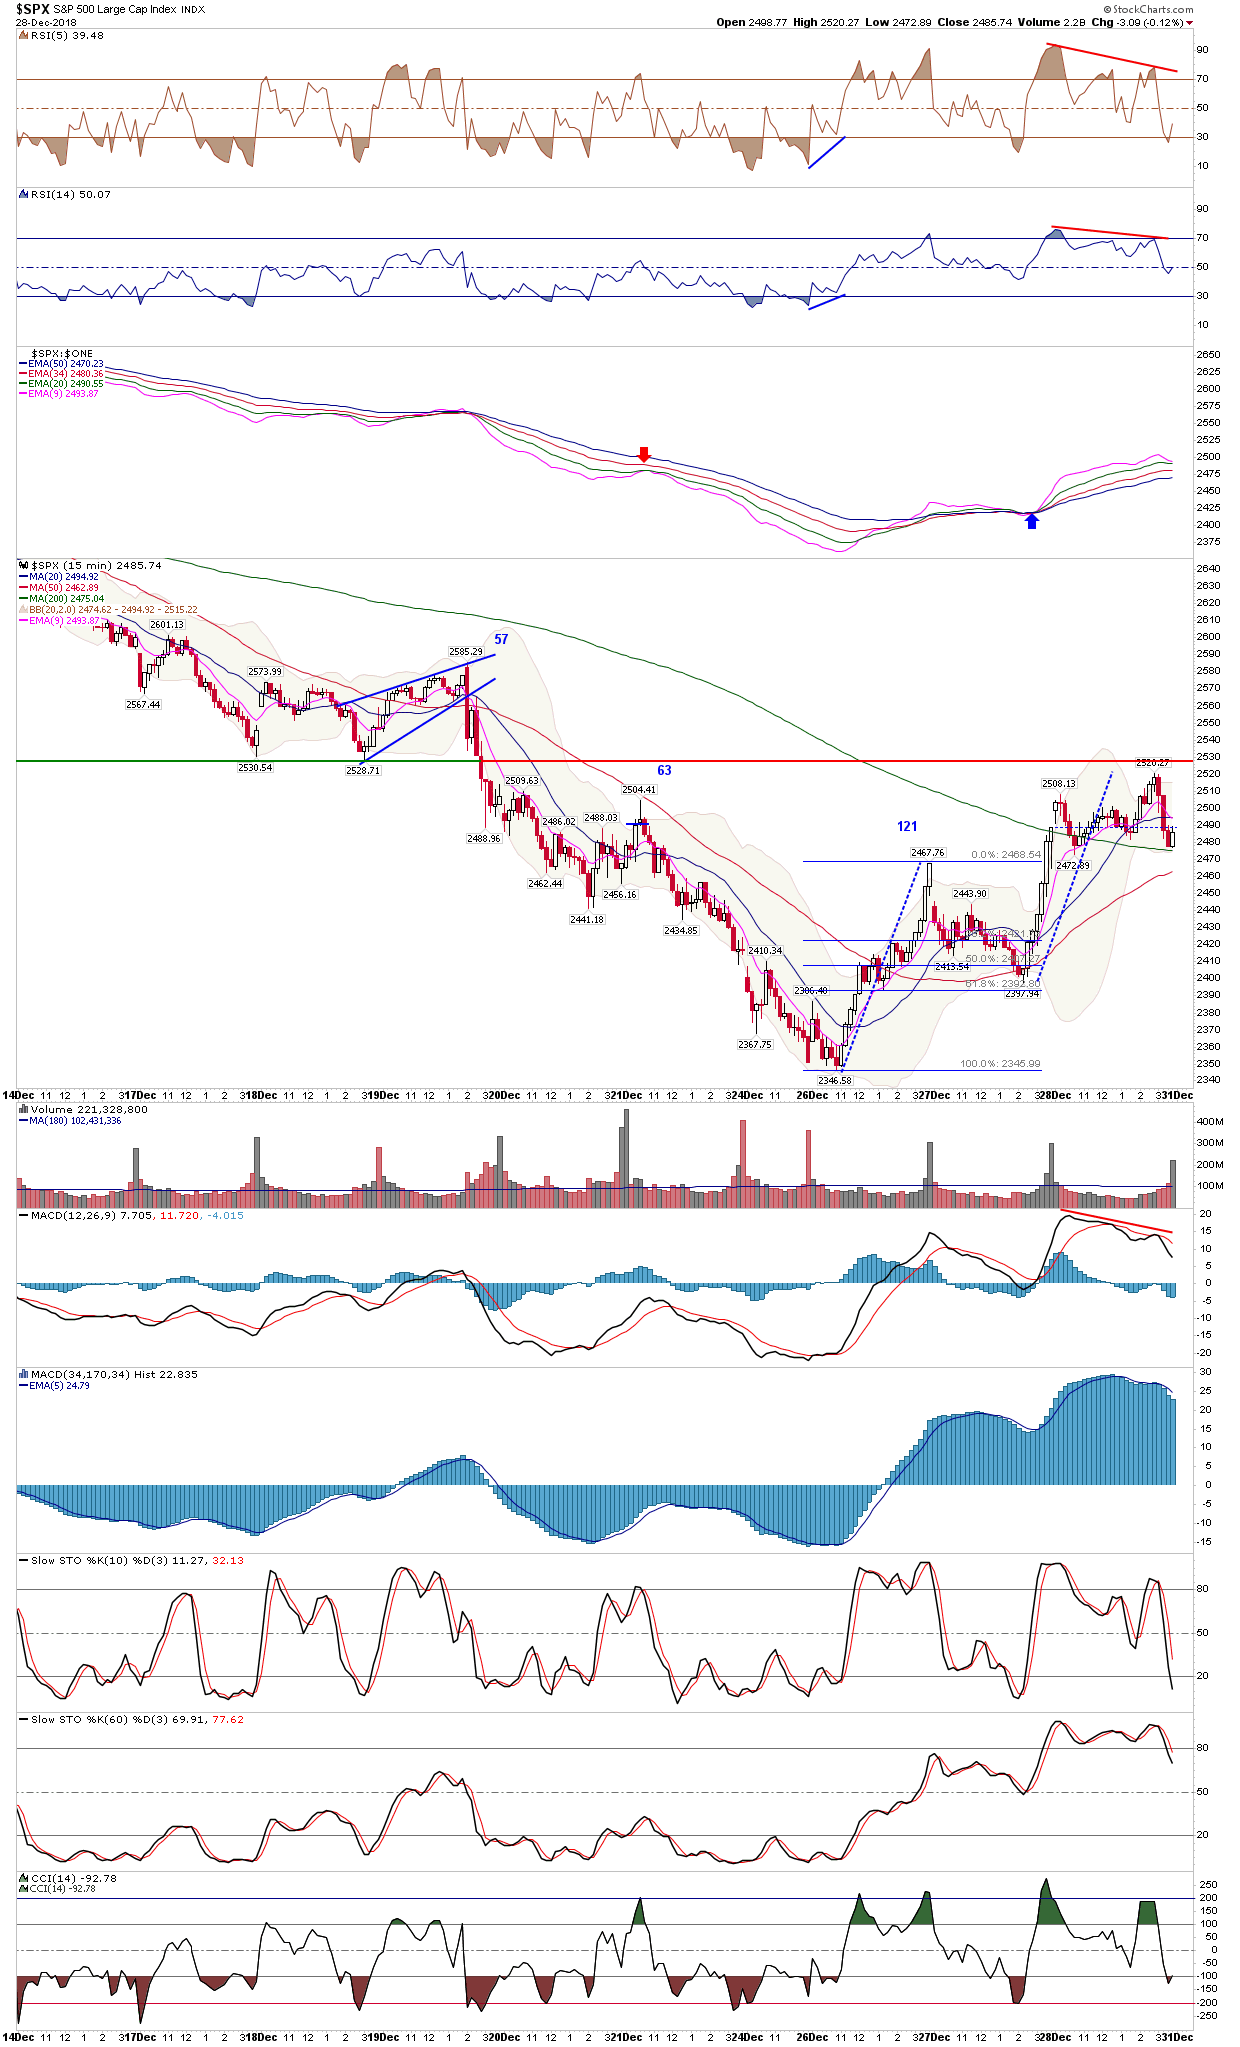
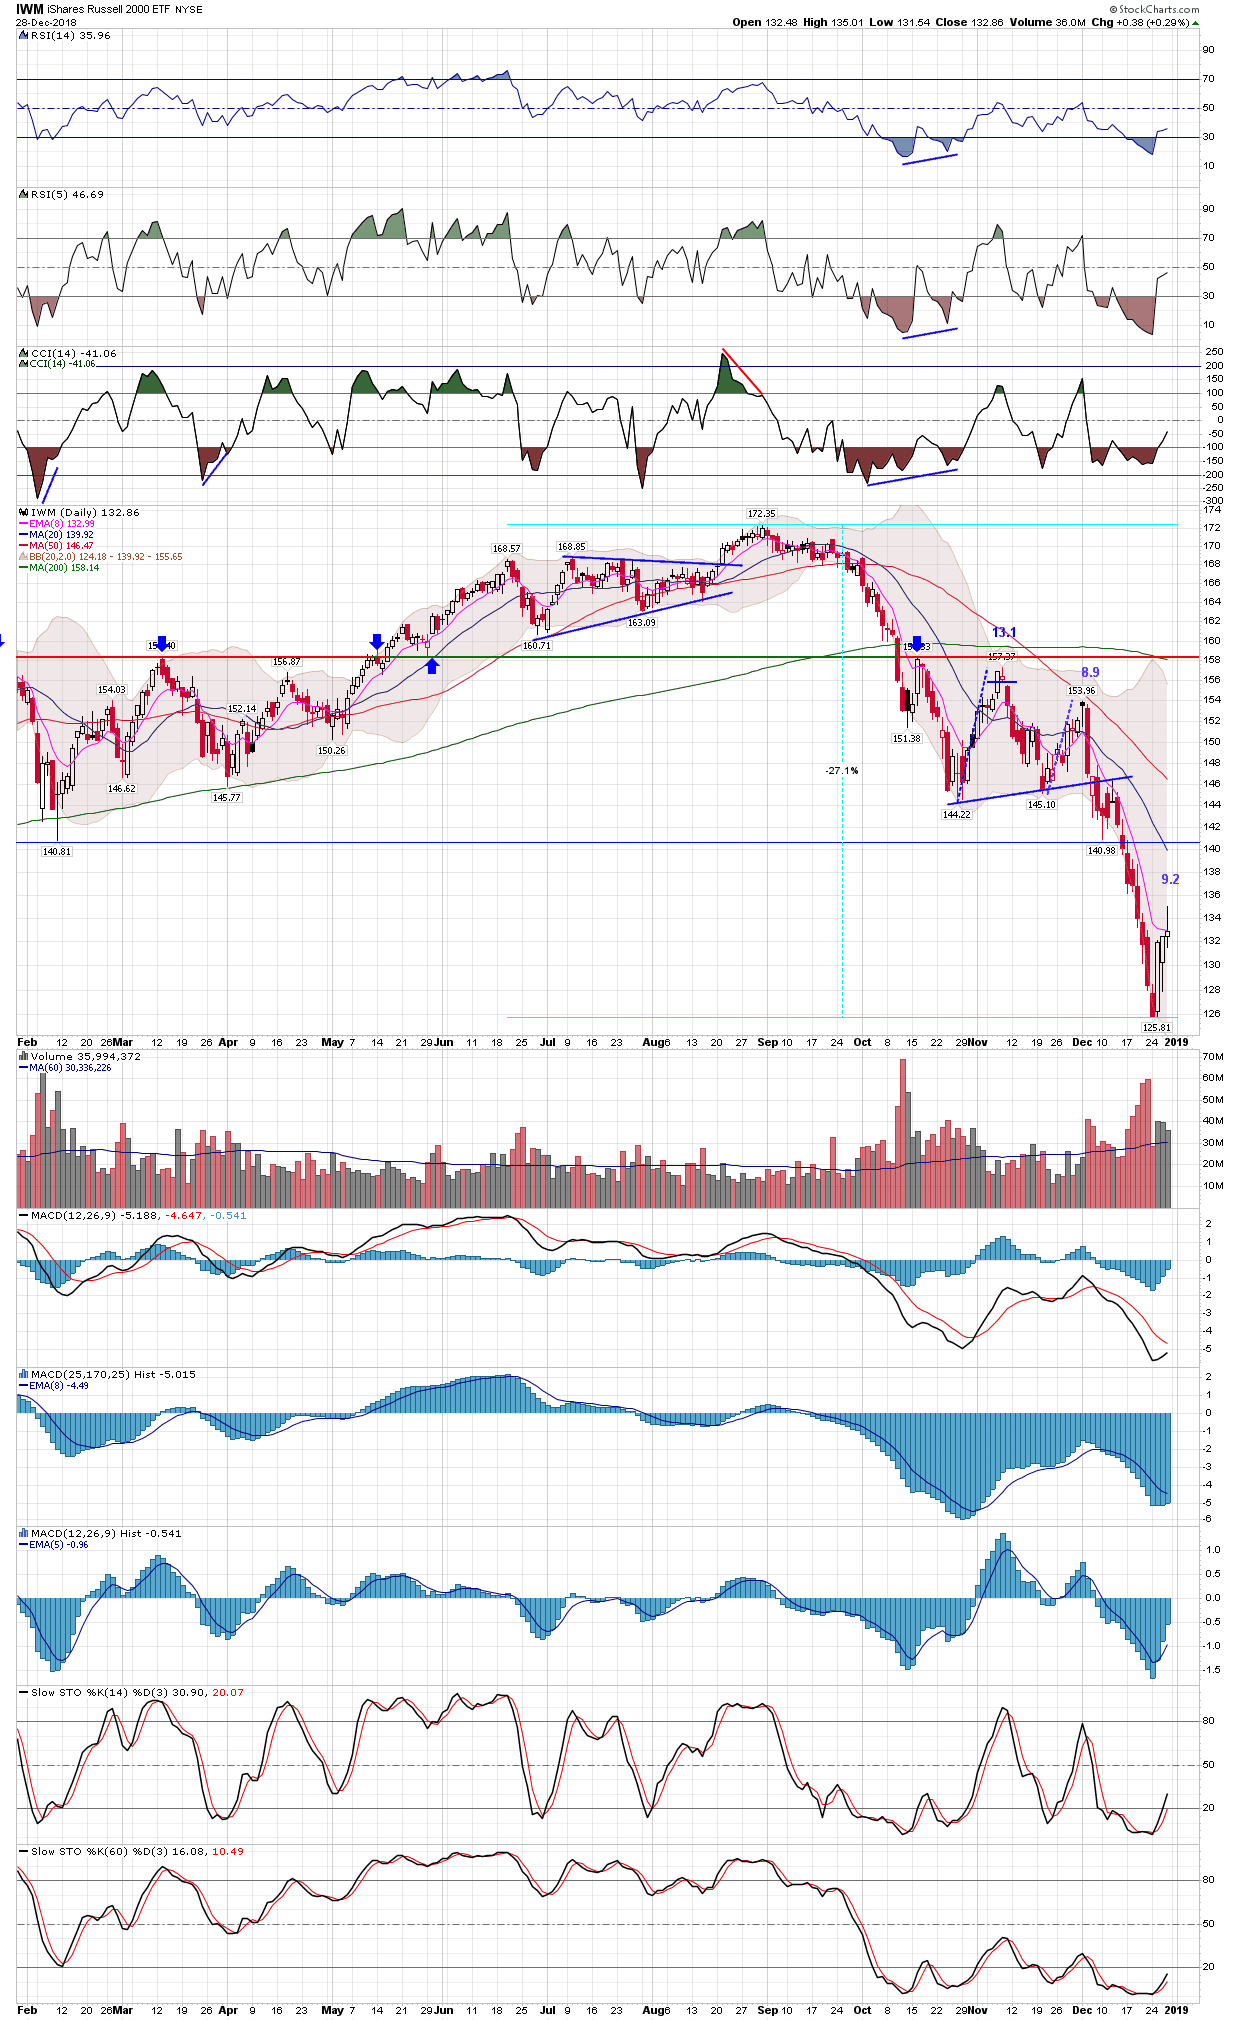
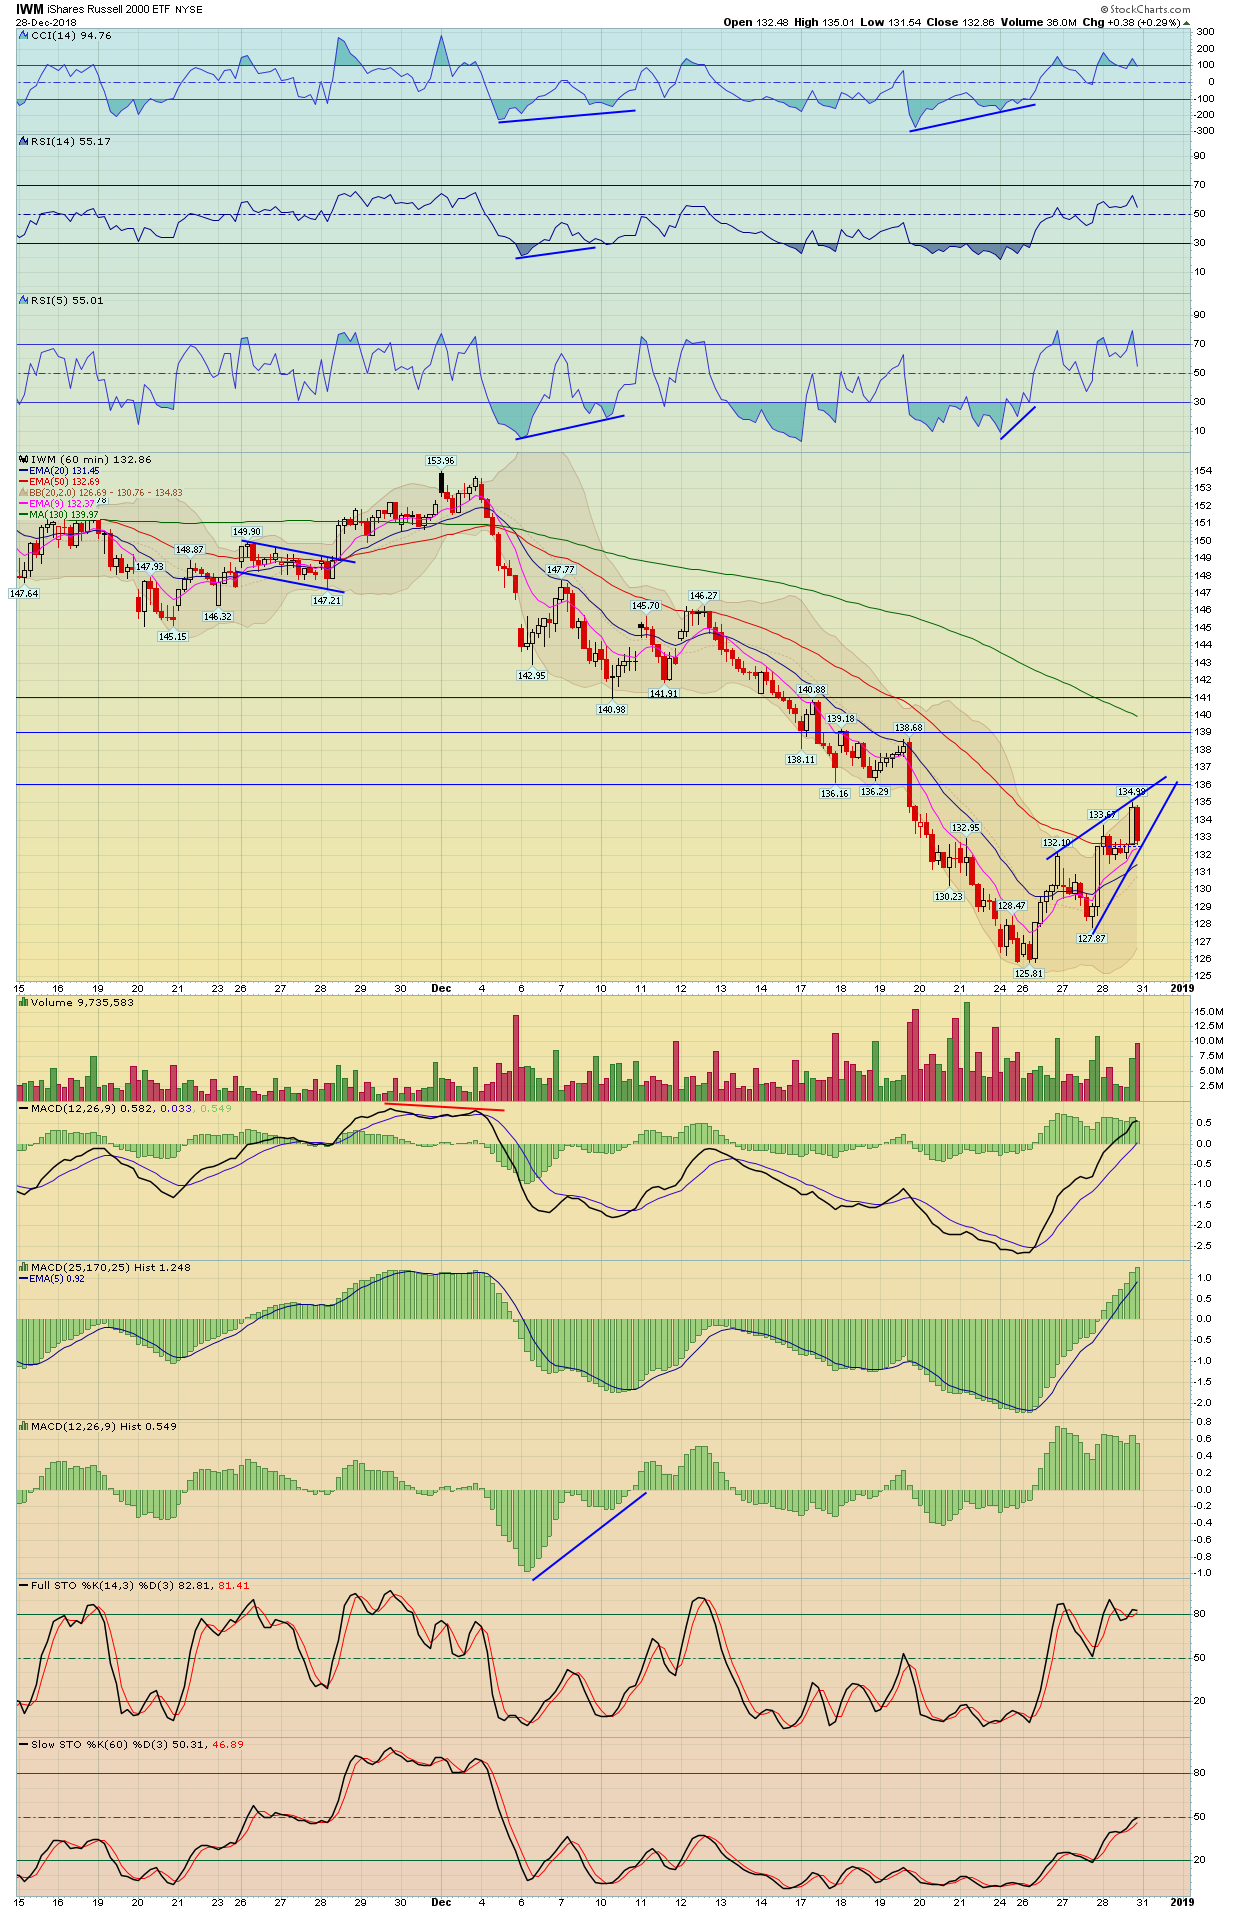
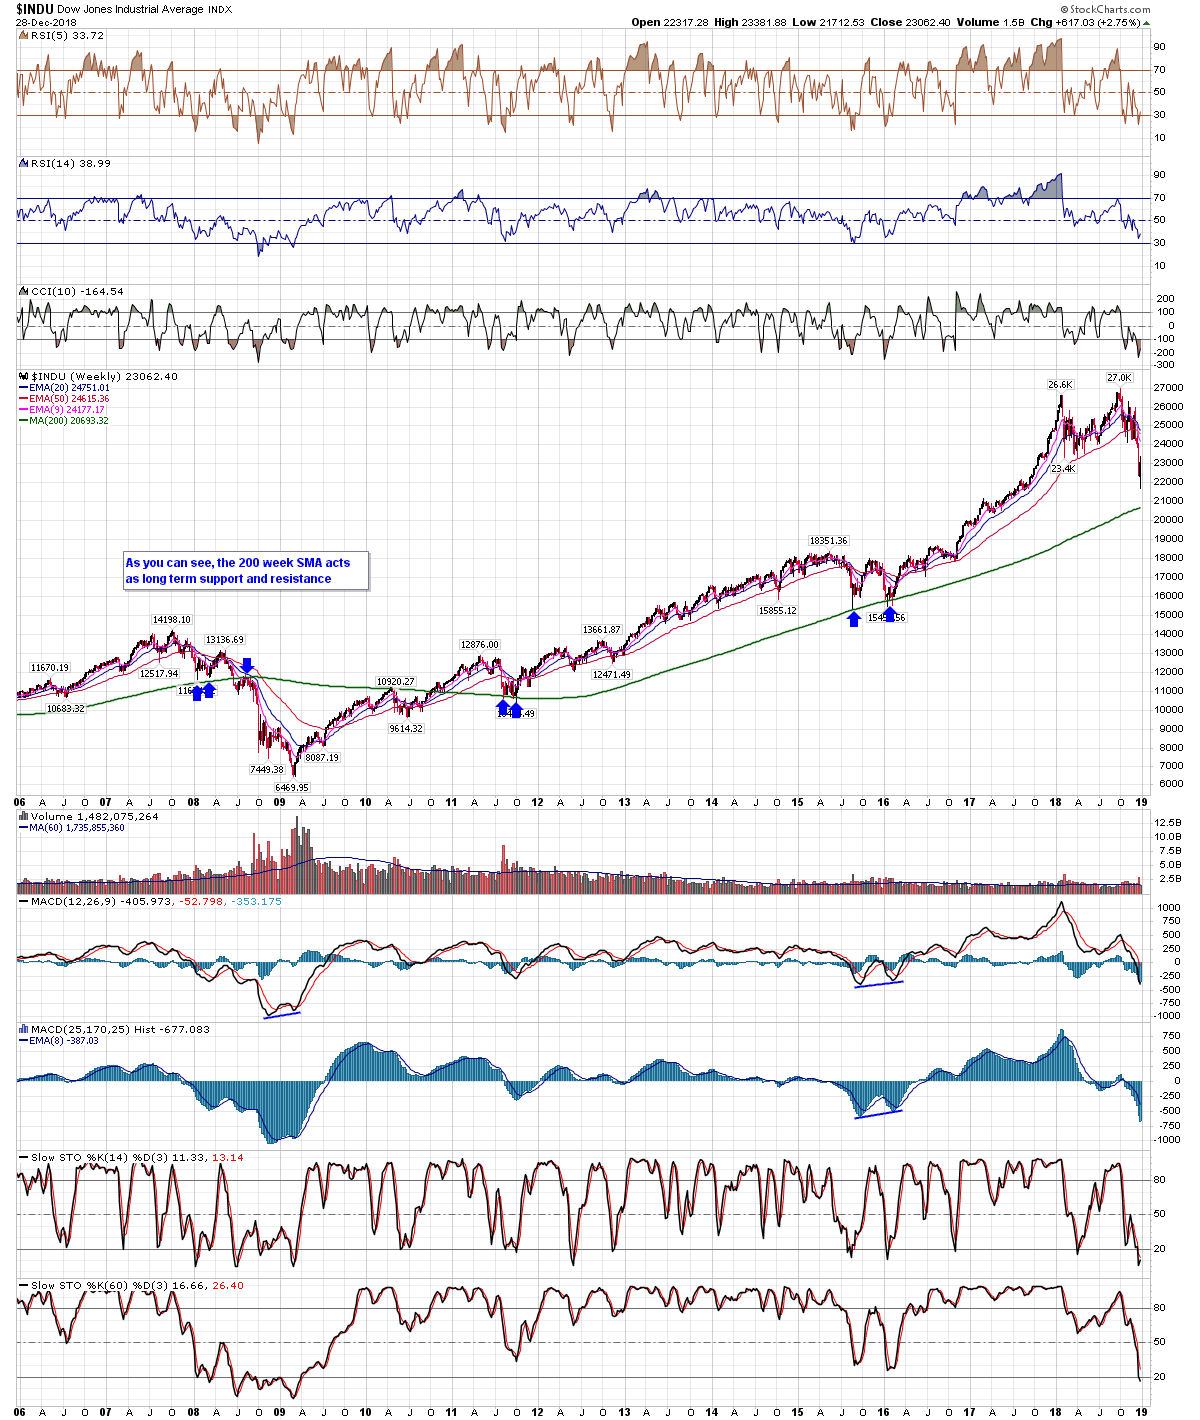
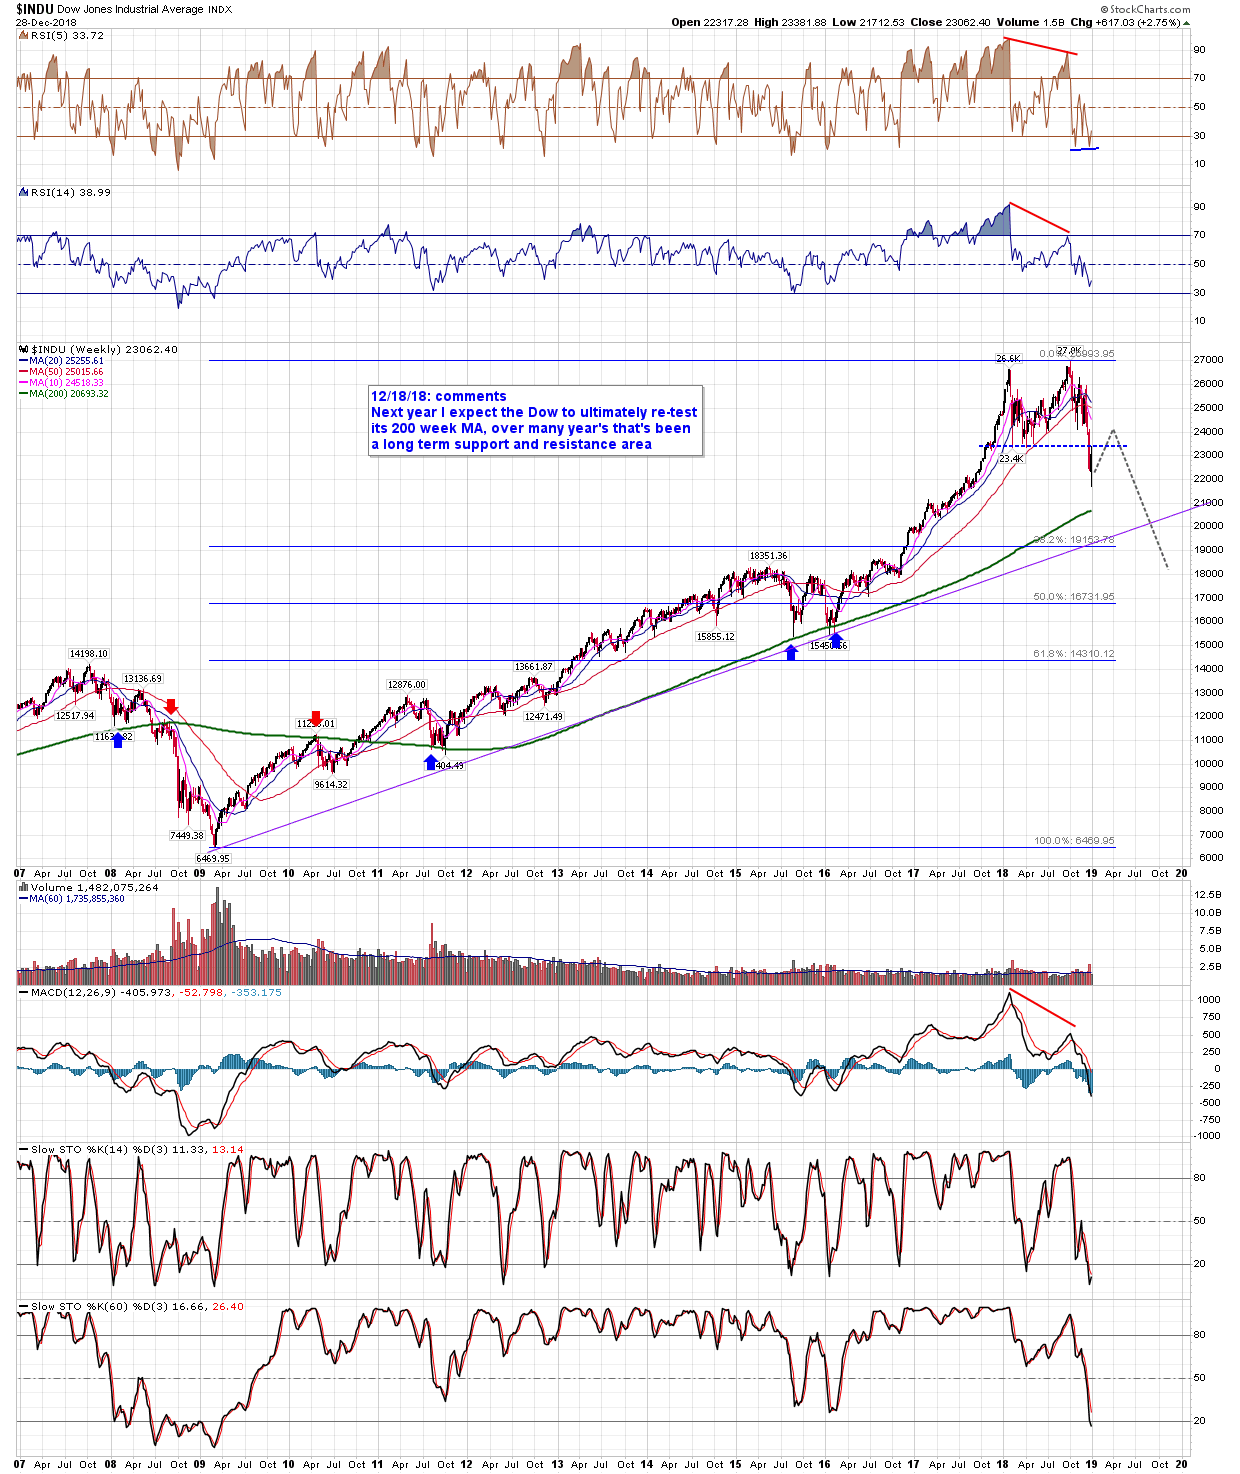
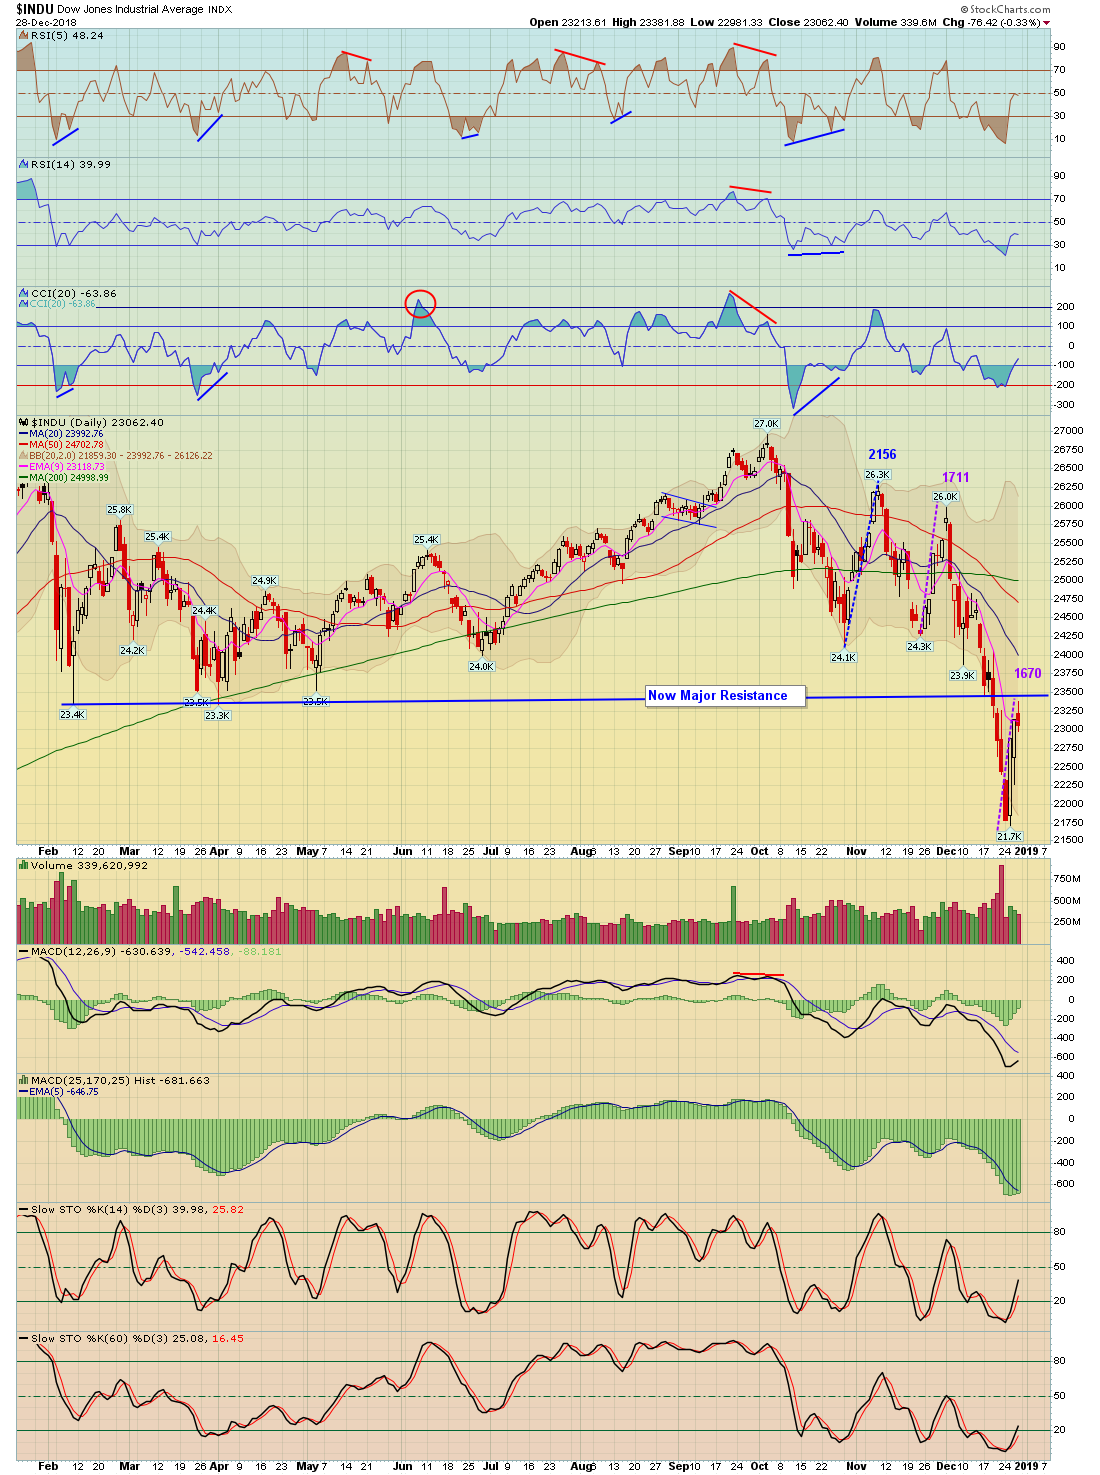
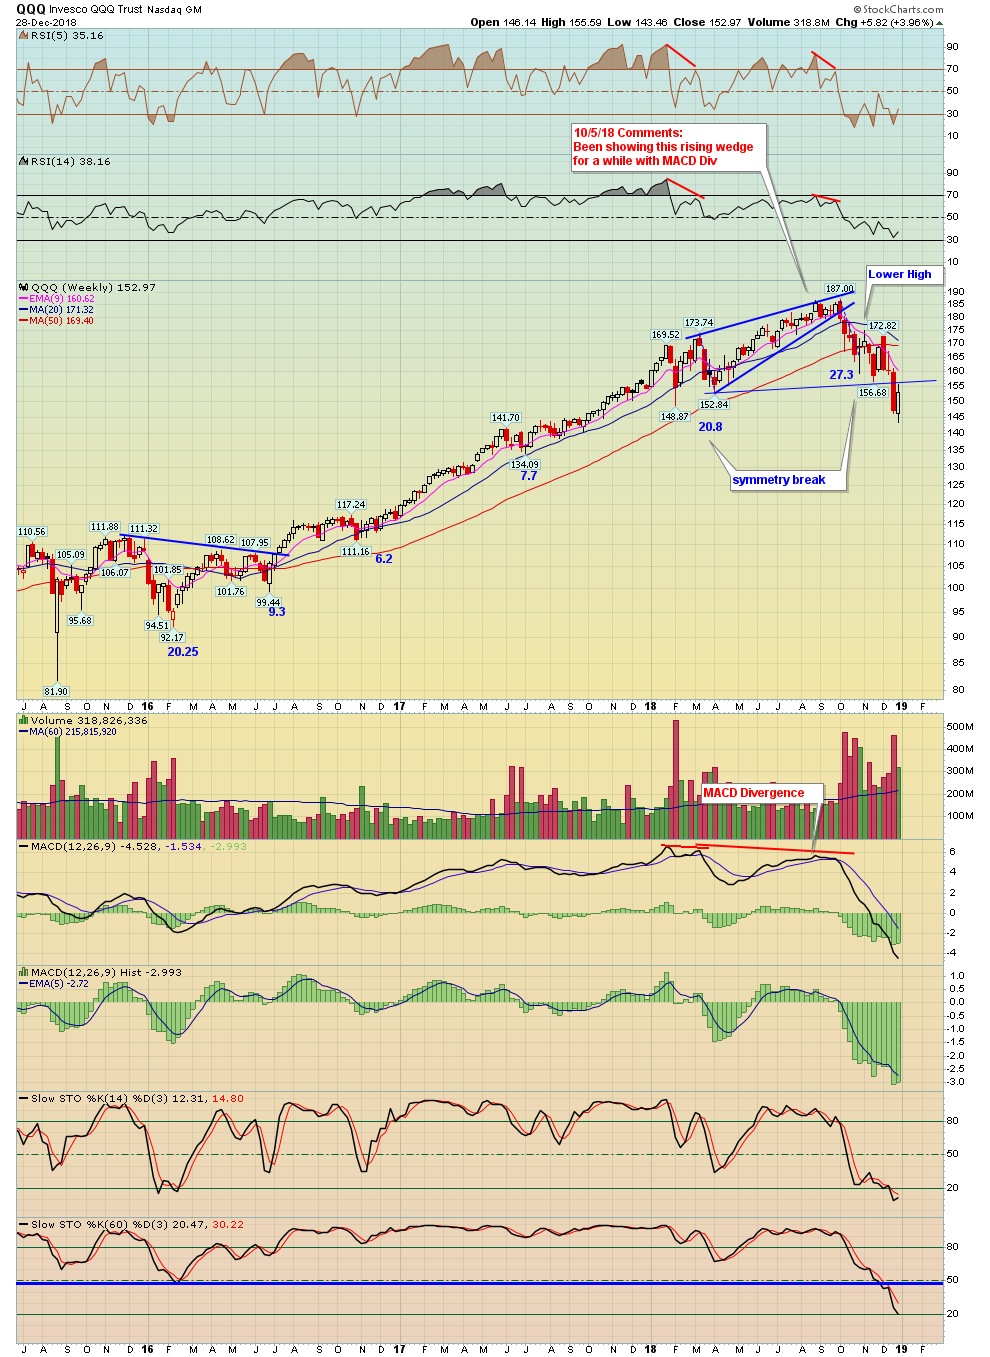
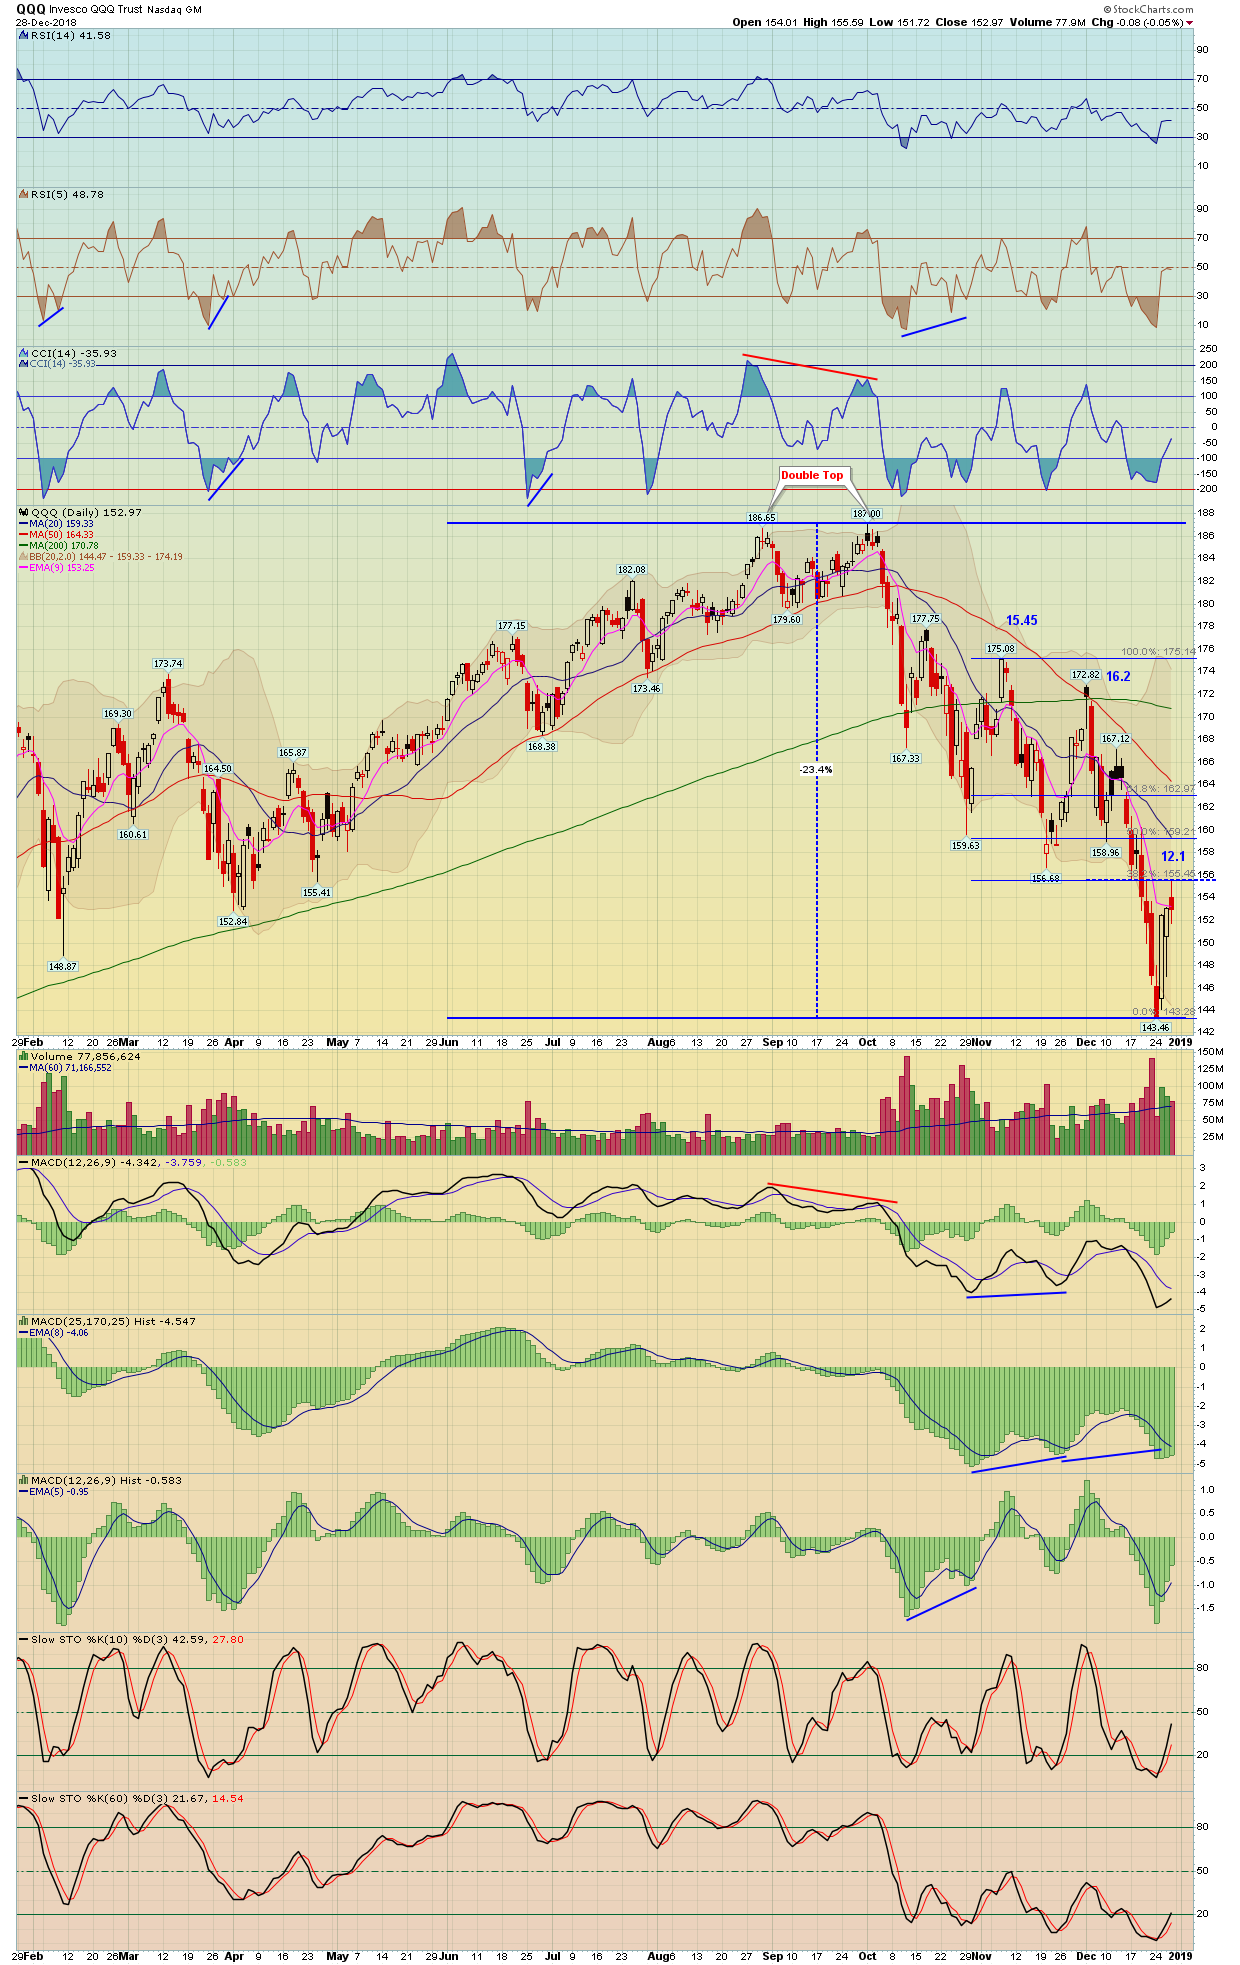
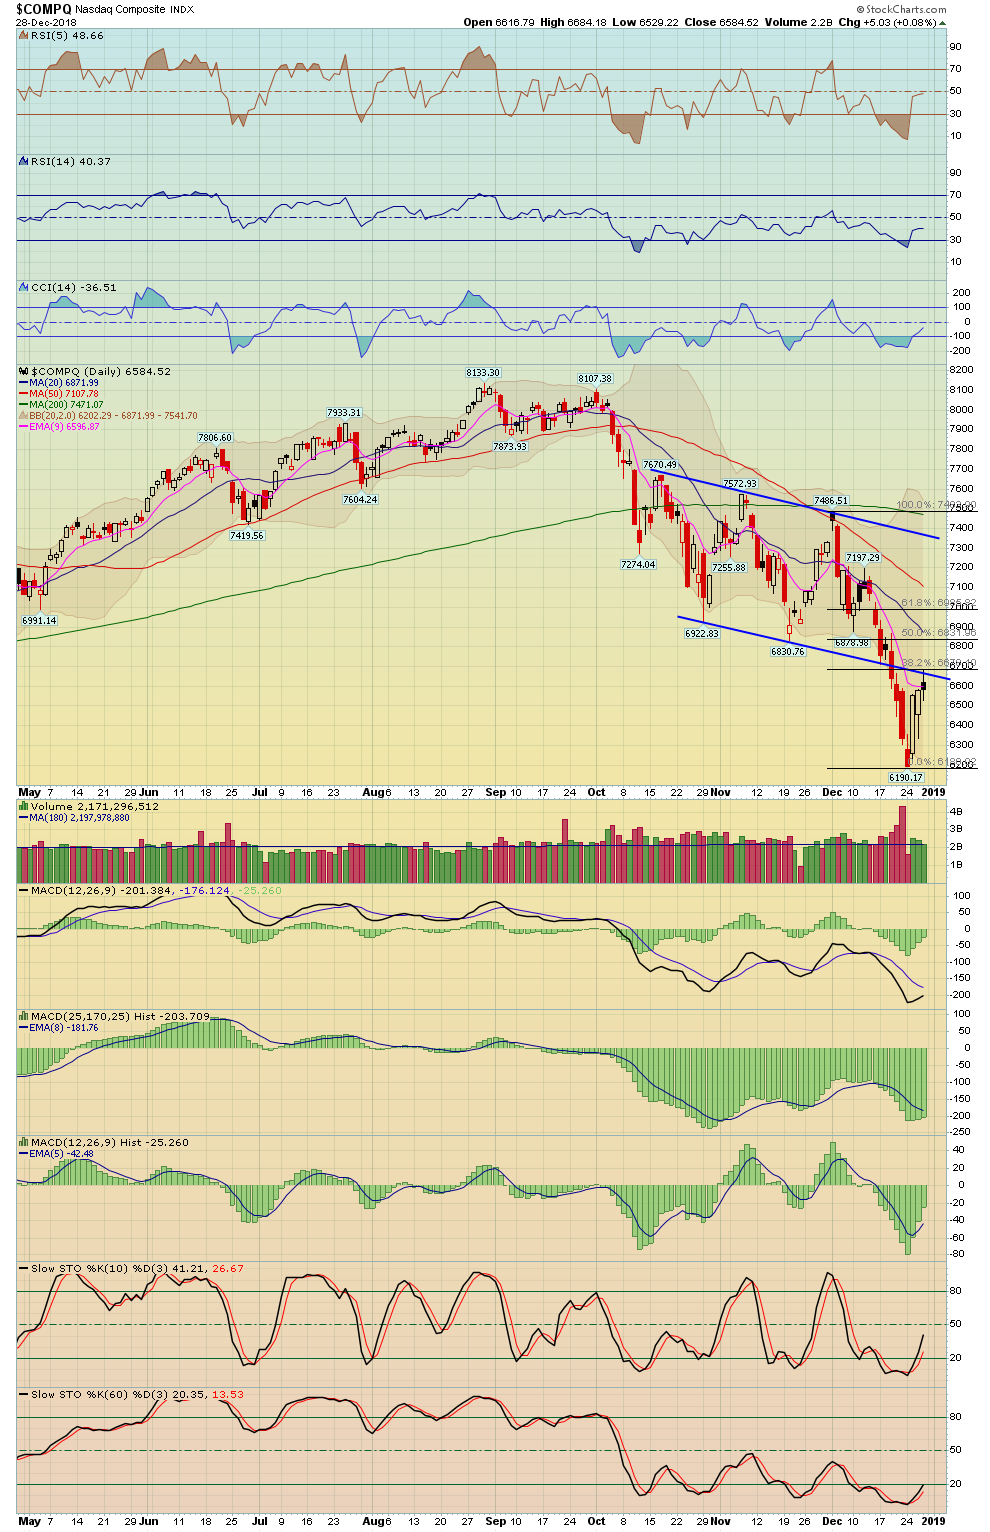
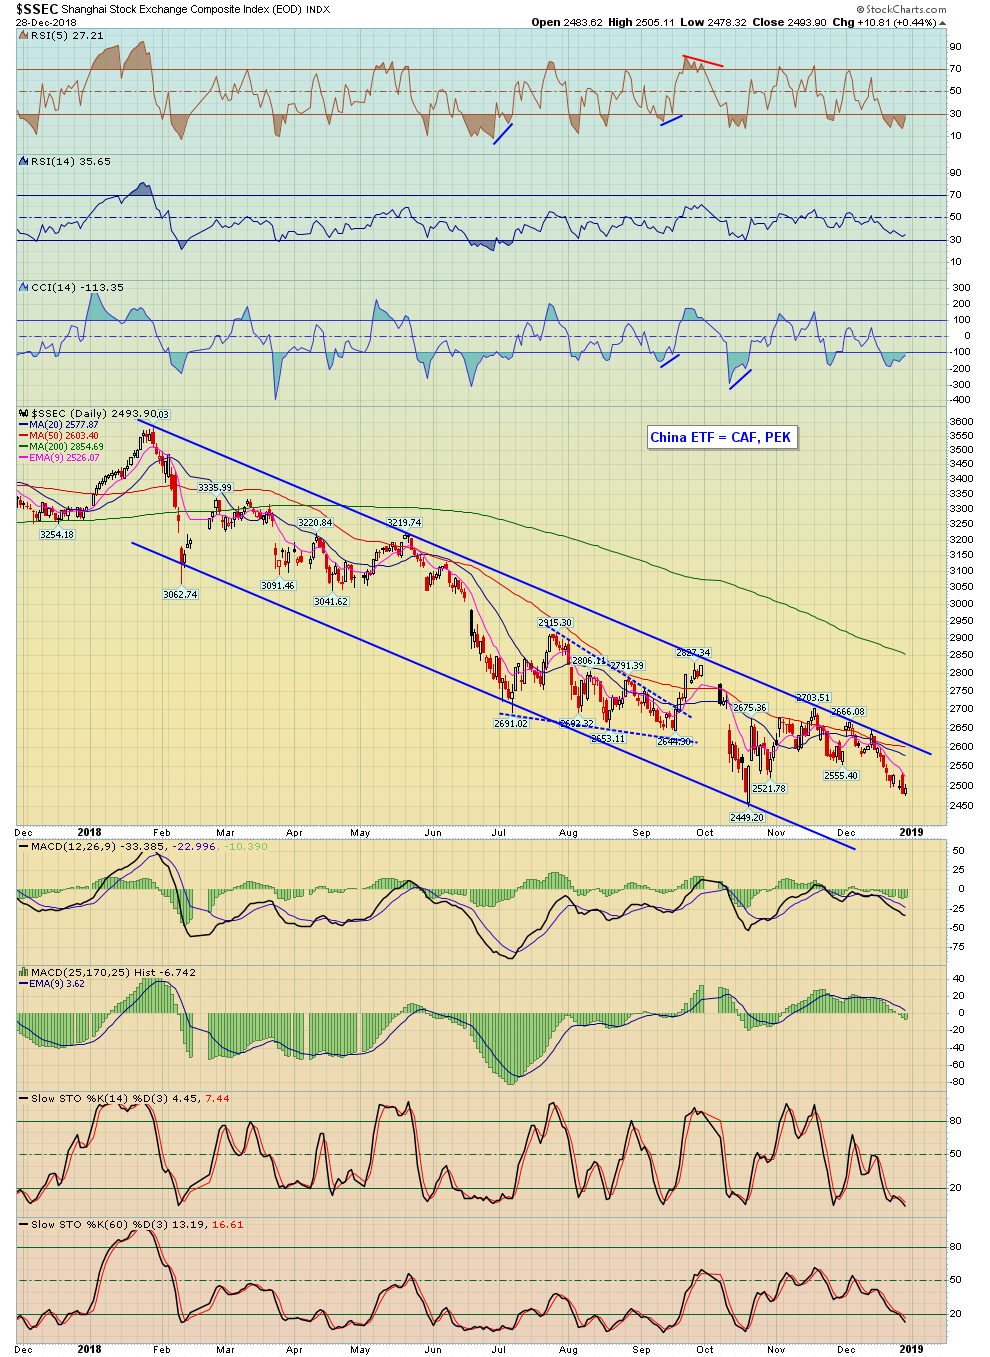
Long term analysis: The market made a significant top in September and is in a bear market with this being the first initial decline. We expect the bear market to continue into 2019 and make new lows, with conservative target areas for the SPX in the low 2000 range. I also expect the Dow Jones to re-test and to at least slightly undercut its 200 week MA.
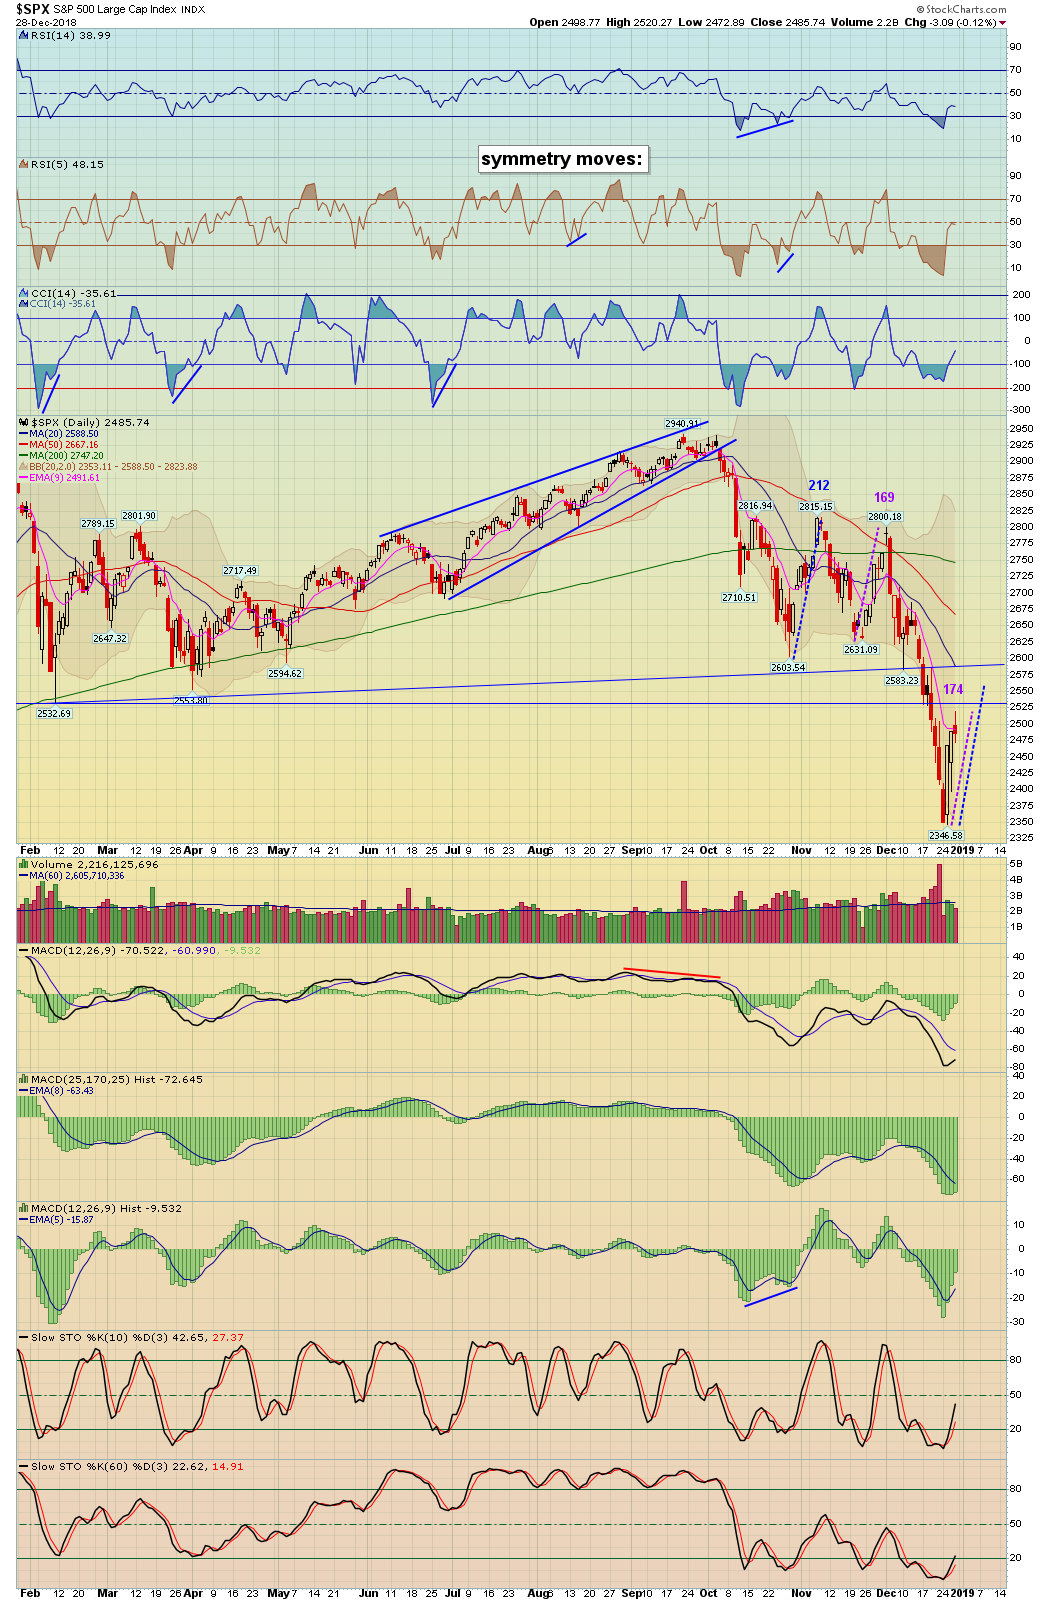
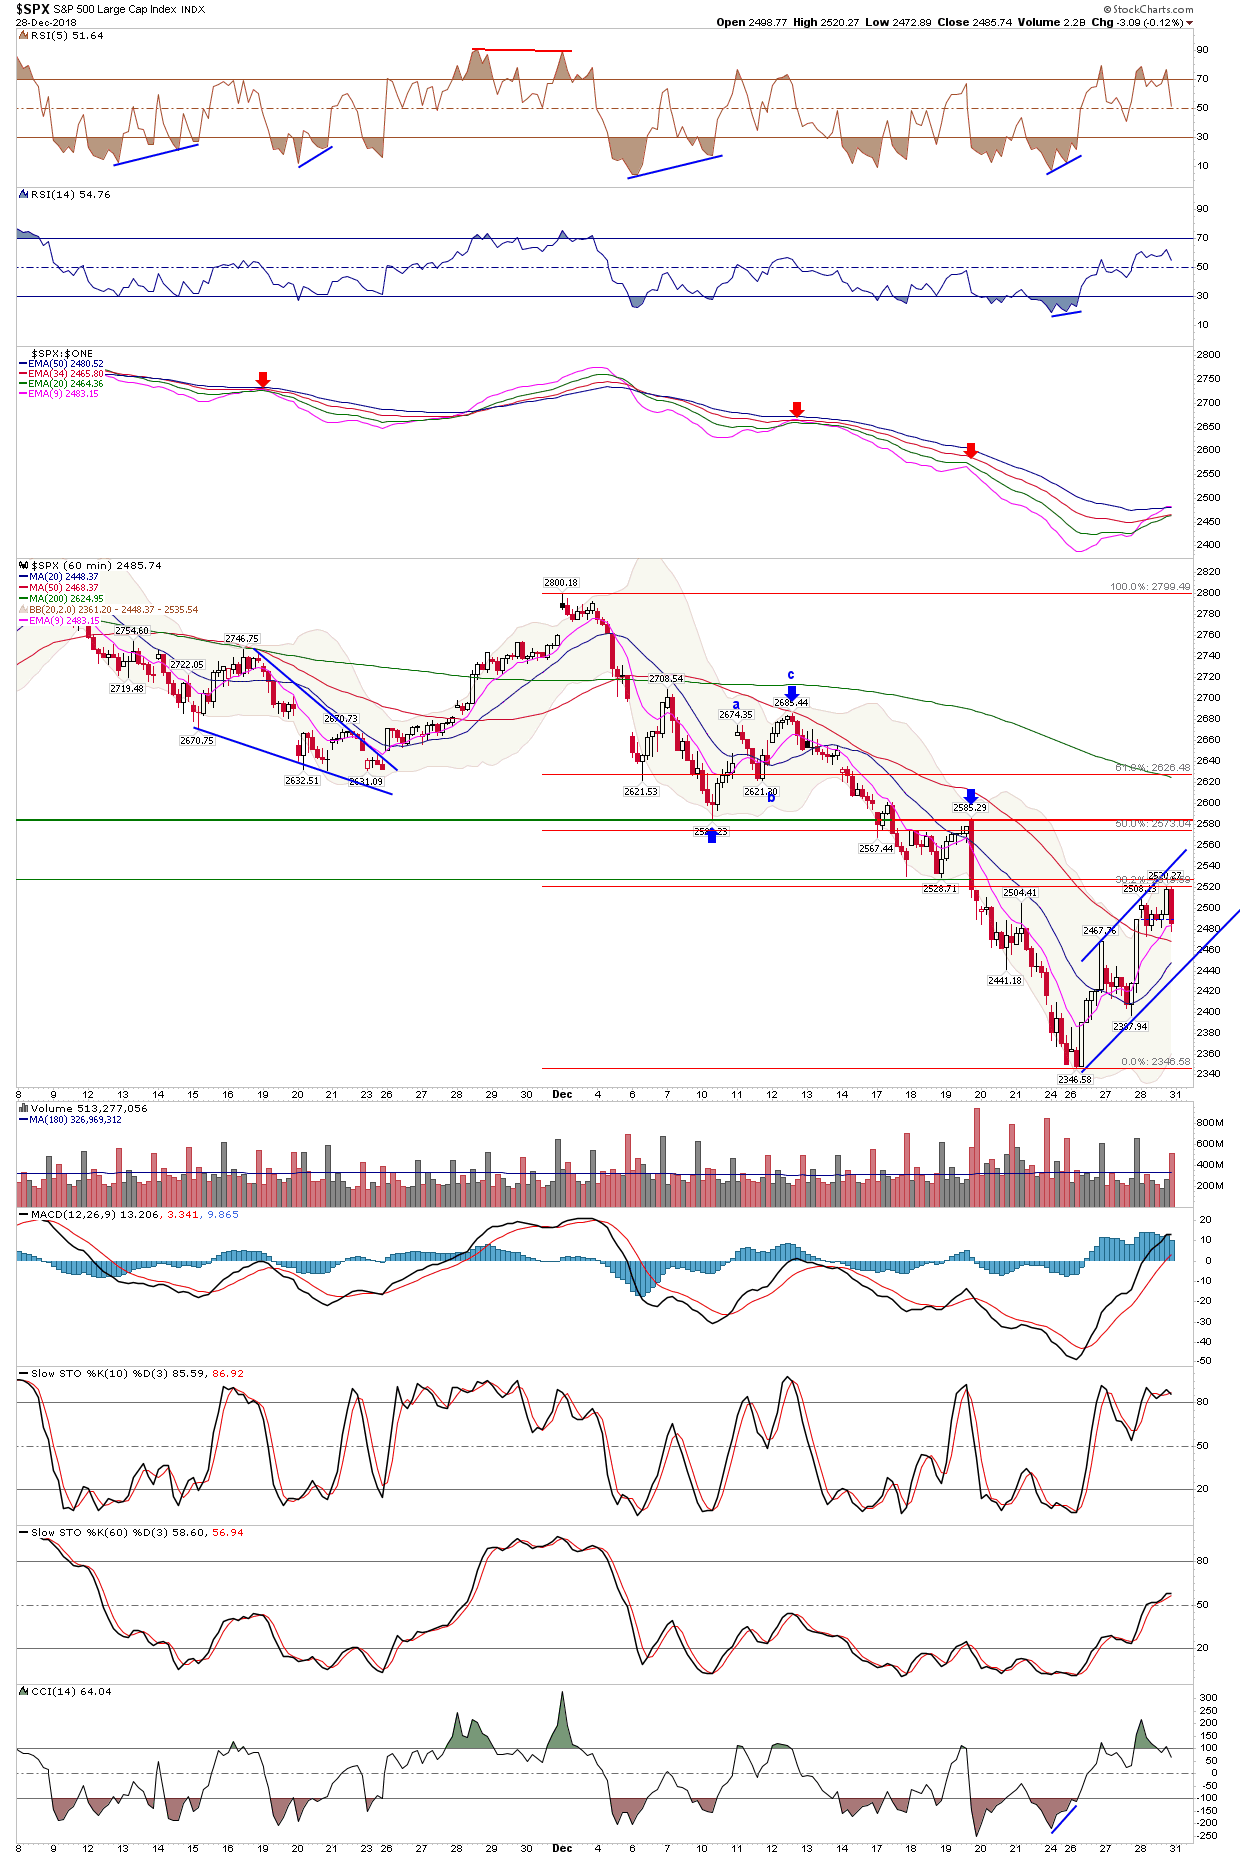
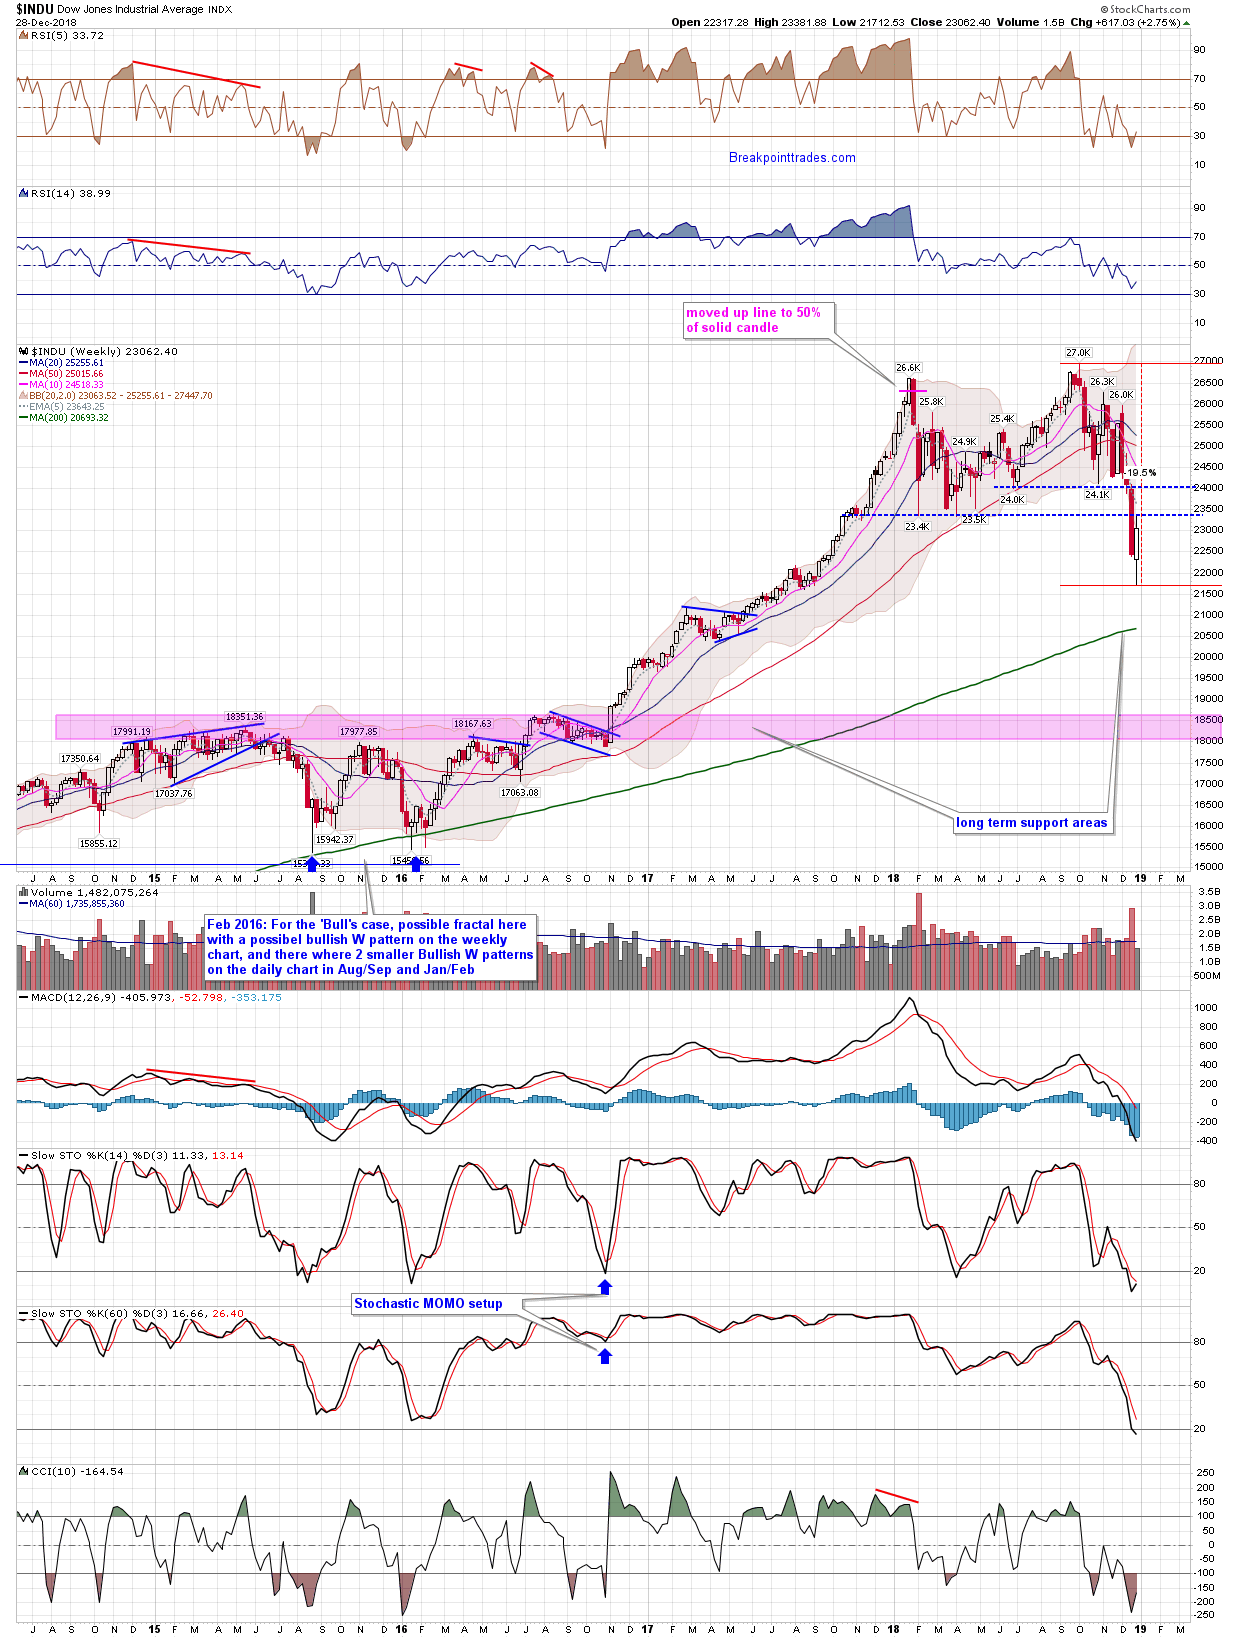
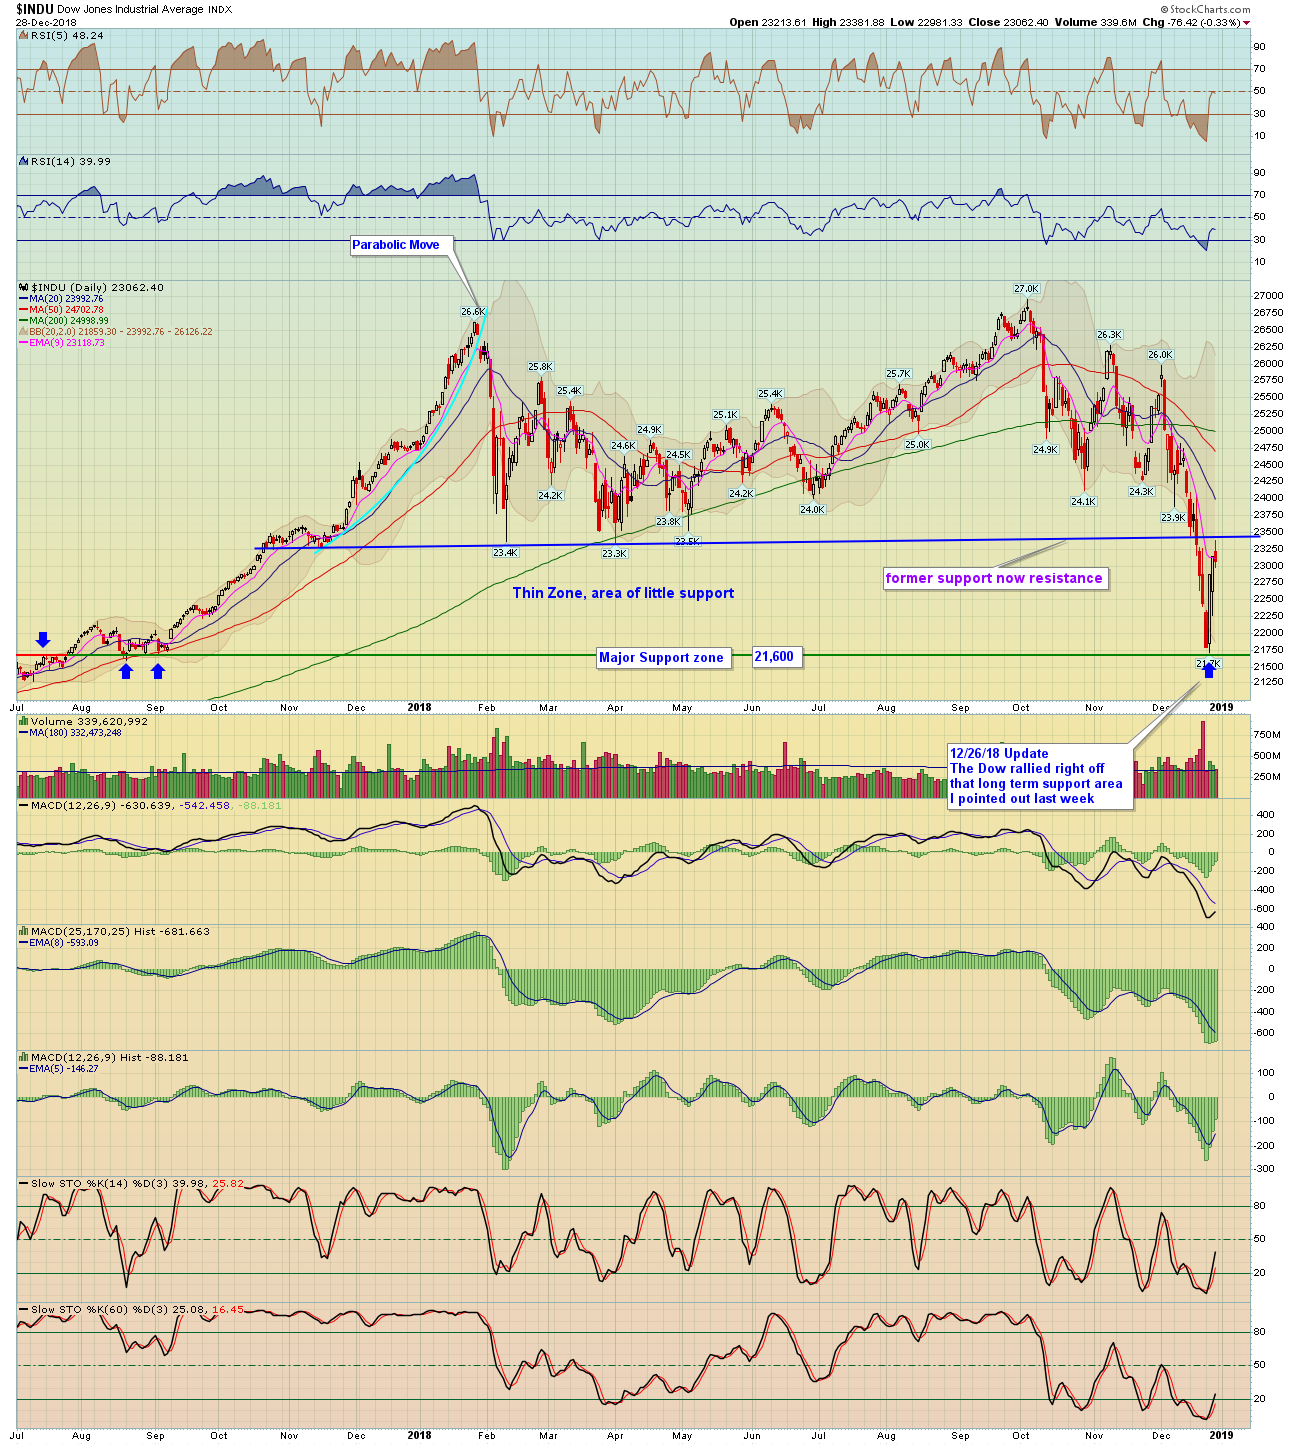
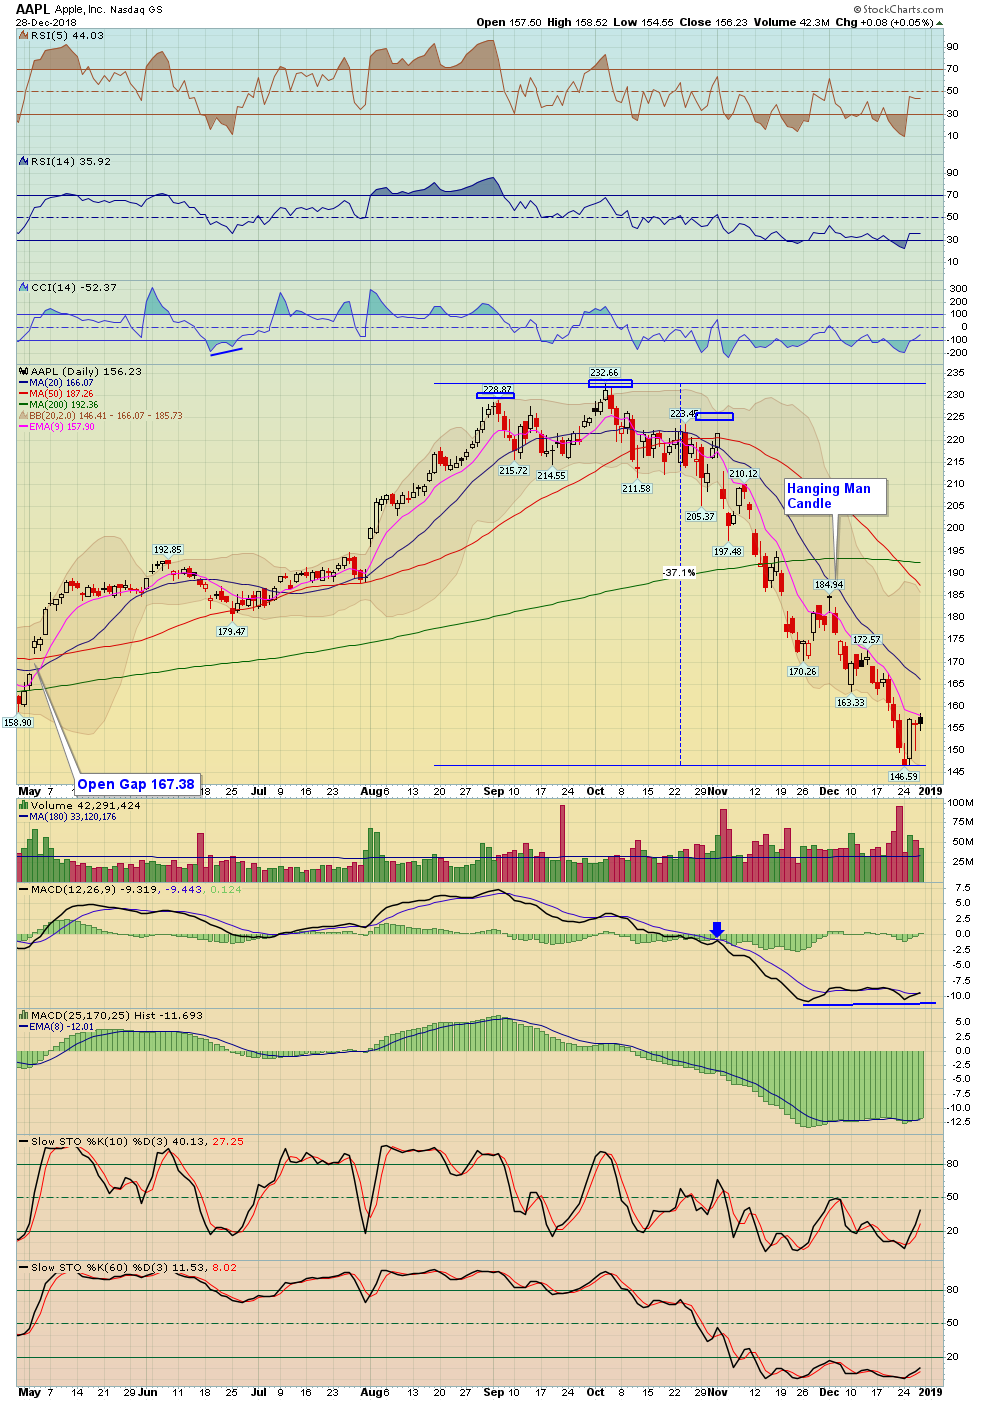
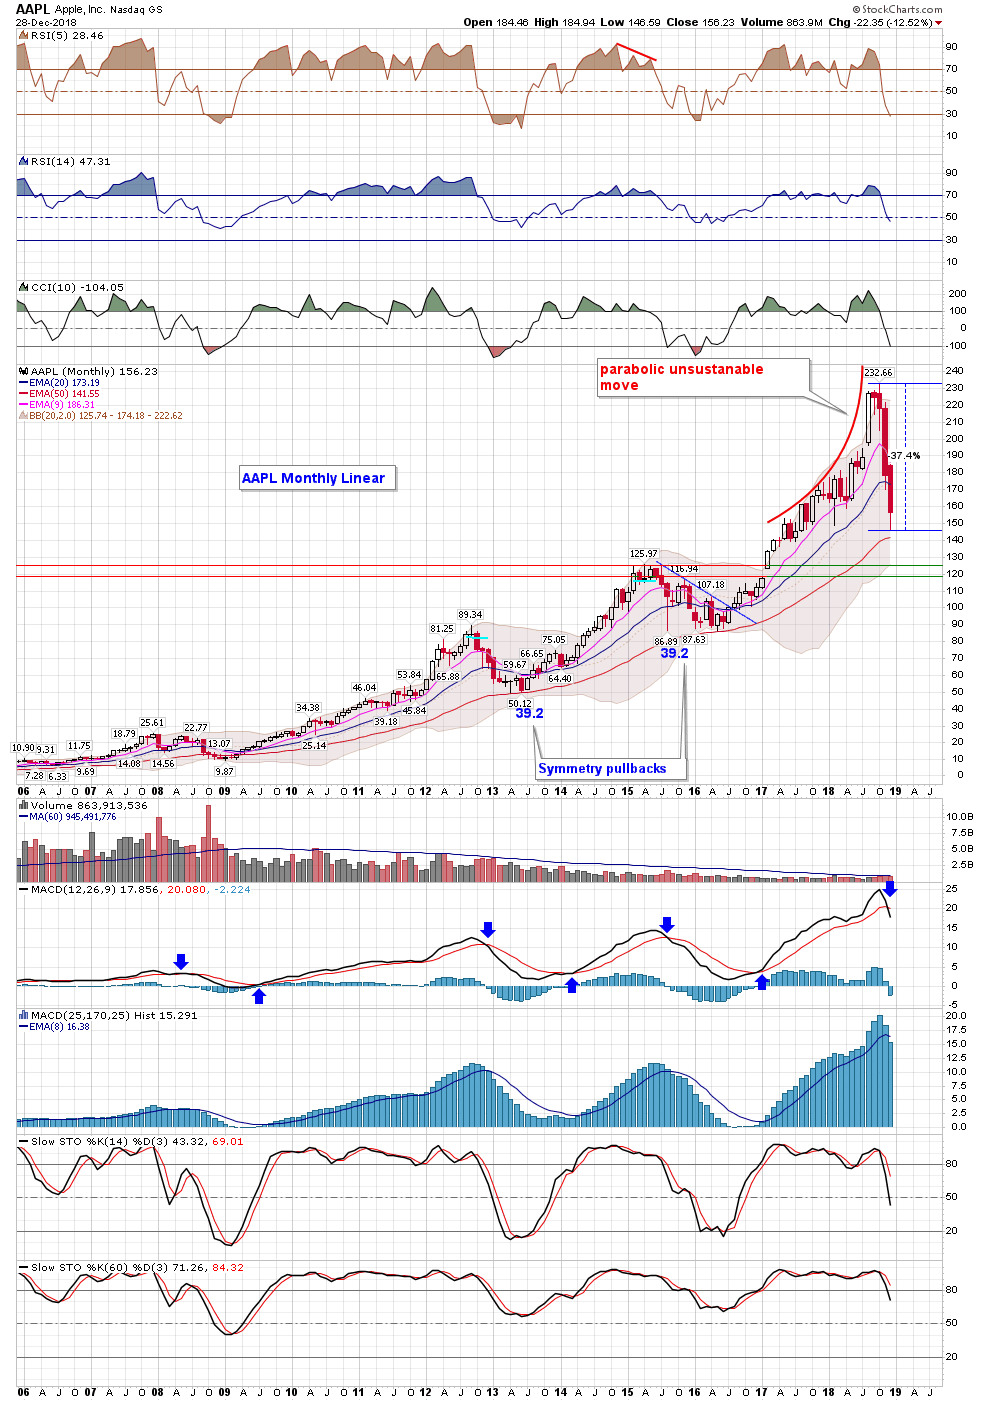
Short term analysis: The market probably put in an initial wave A low last week on Christmas Eve. It's also possible that it hasn't yet and that this bounce is simply a 4th wave bounce with one more sell off coming in a wave 5 to finally complete this initial wave A of the bear market, however we lean that wave A is in. We should now be in some sort of Initial wave B bounce that will be choppy and should work higher over time, but will ultimately form a lower high early next year. Mark sure to also to pay attention to the symmetry moves that the indexes made last week - I discuss this on the daily index charts below; eventually the move into Friday's highs matched a prior symmetry move.
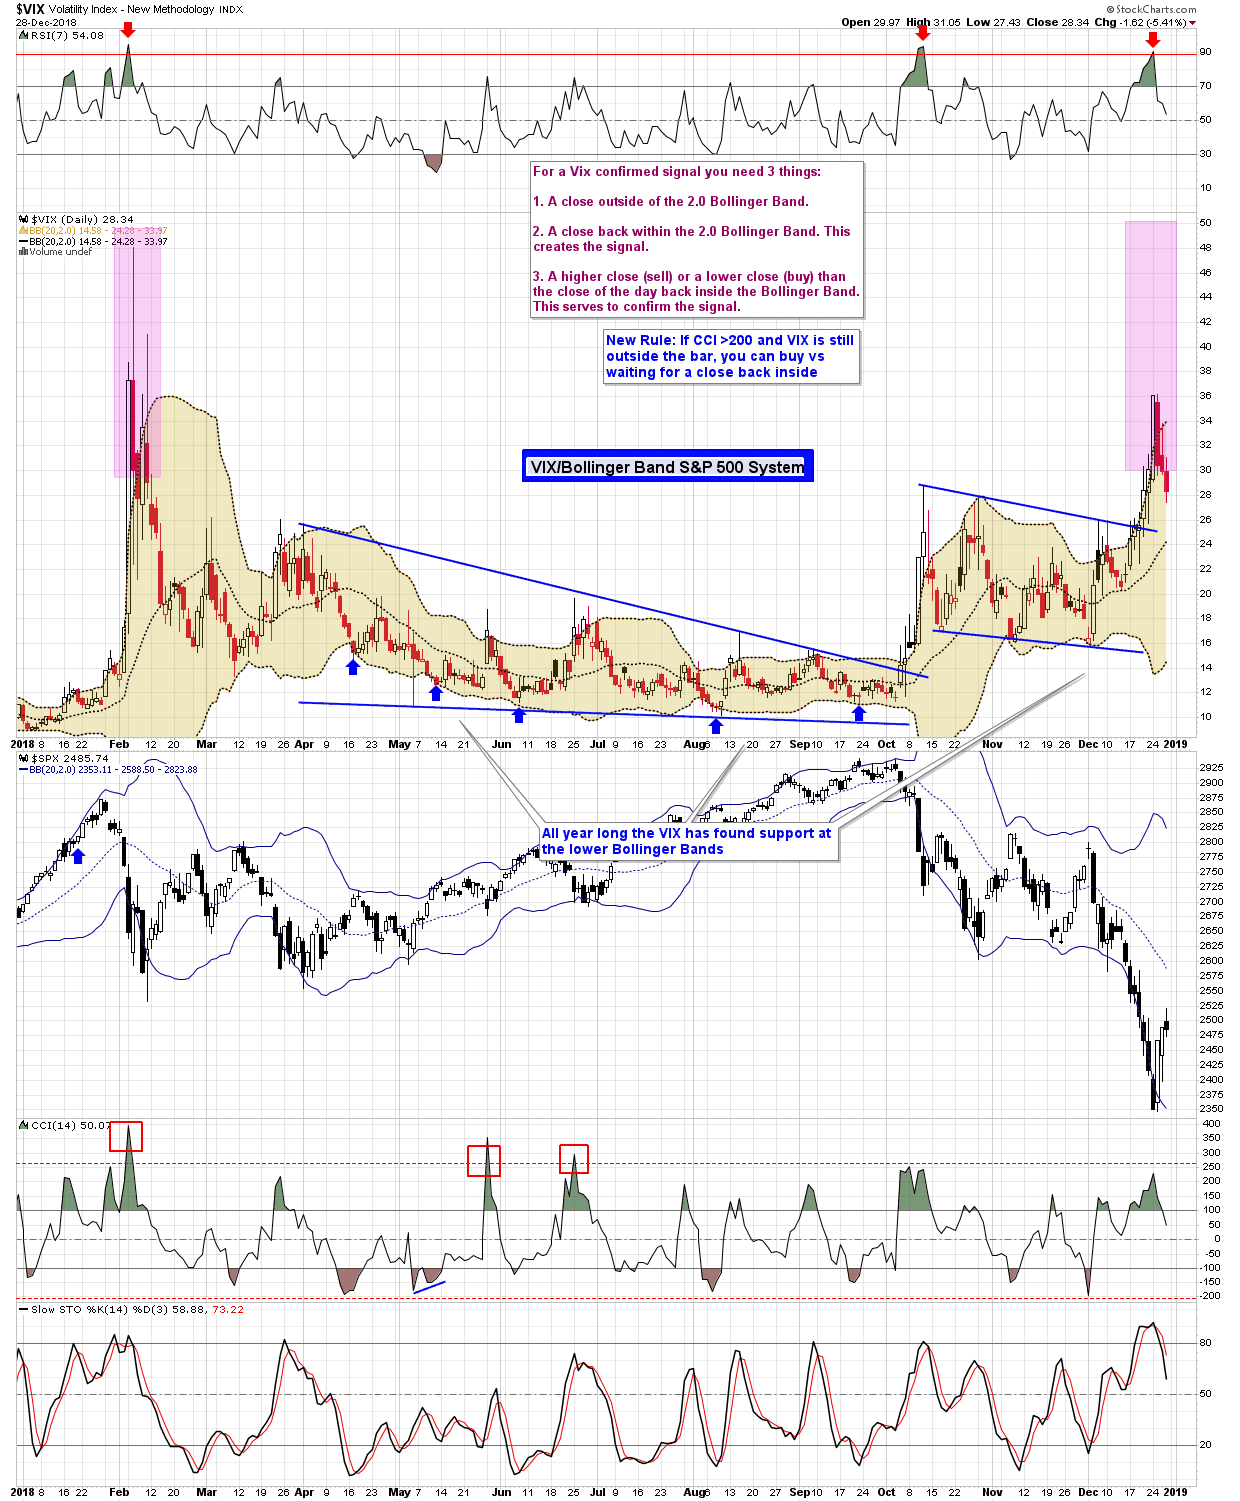
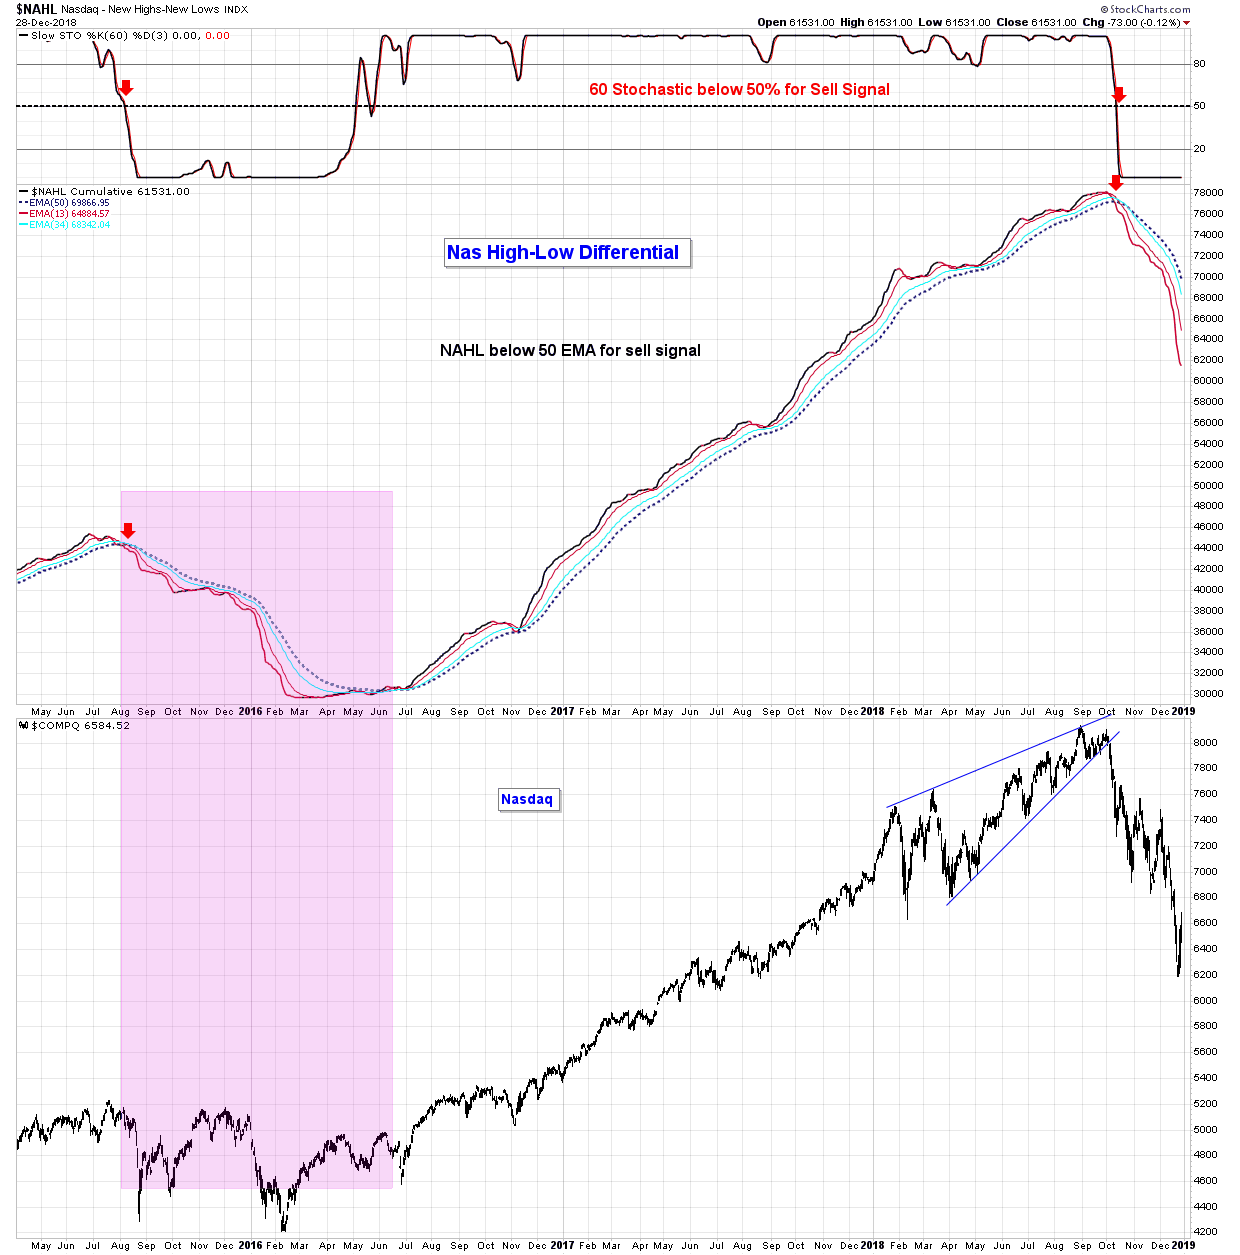
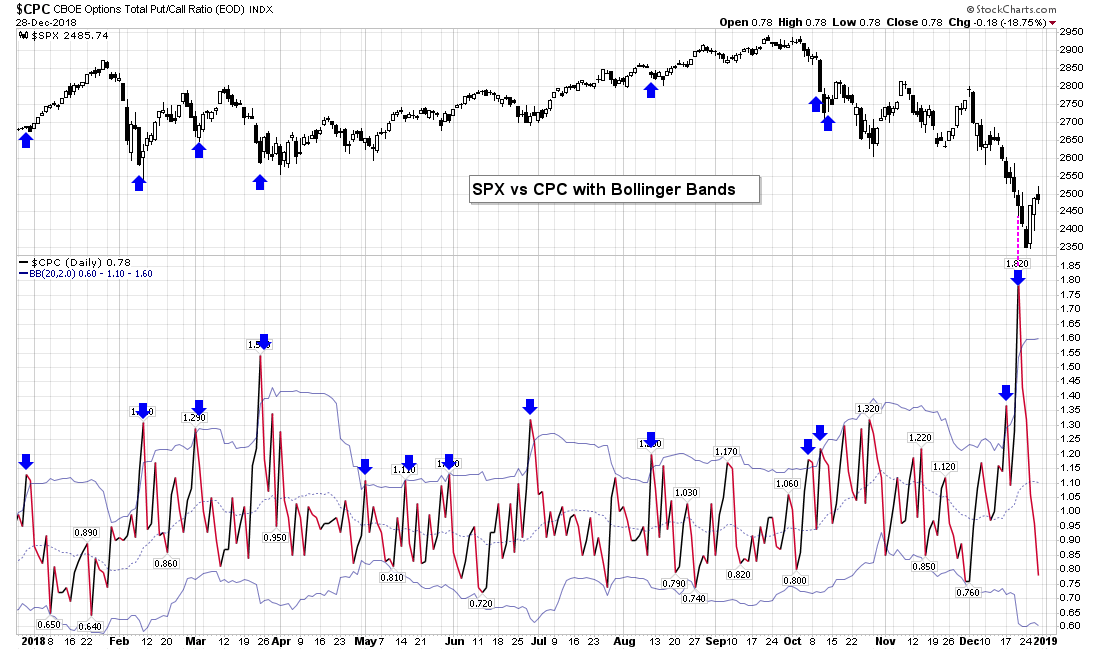
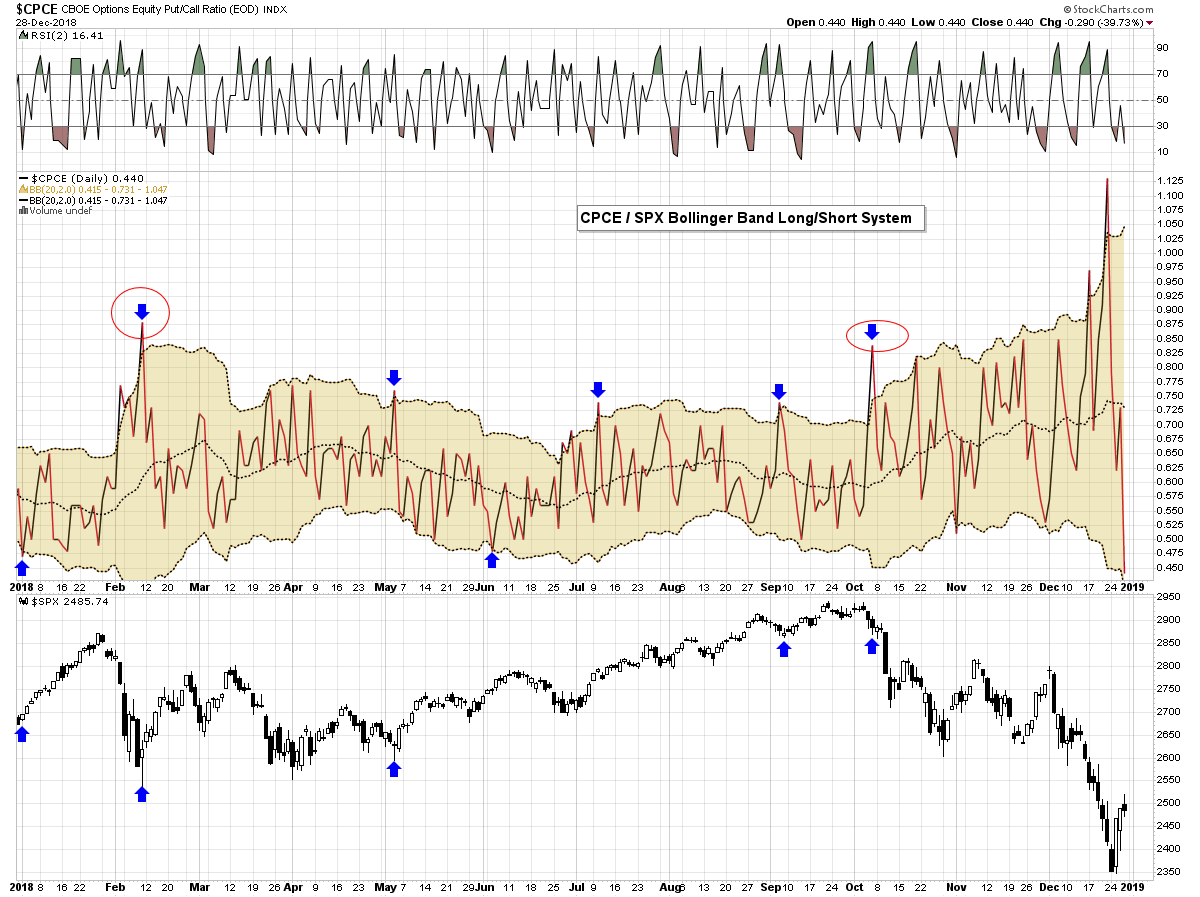
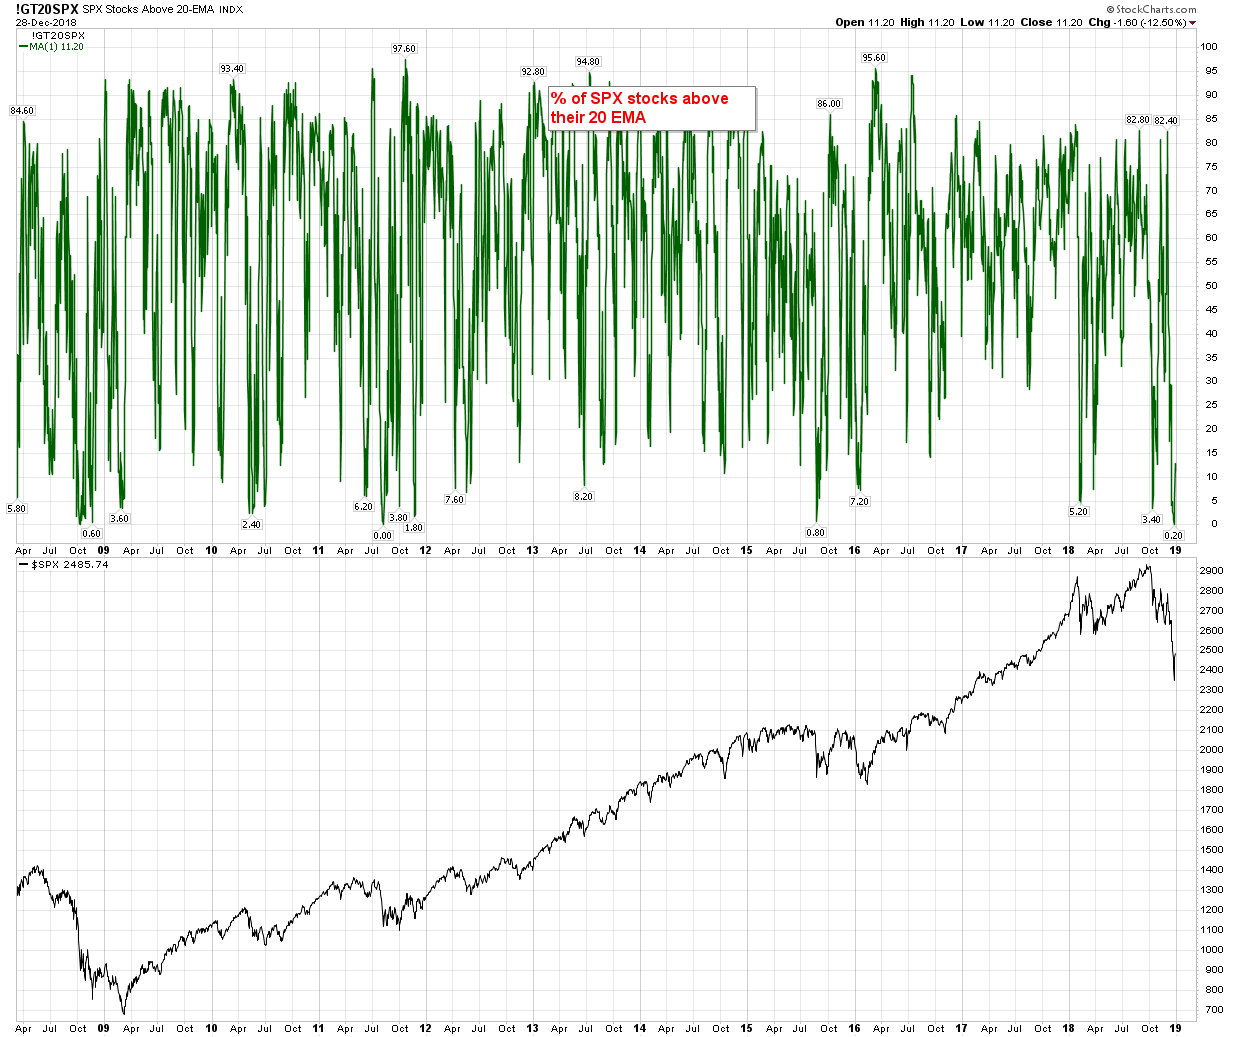
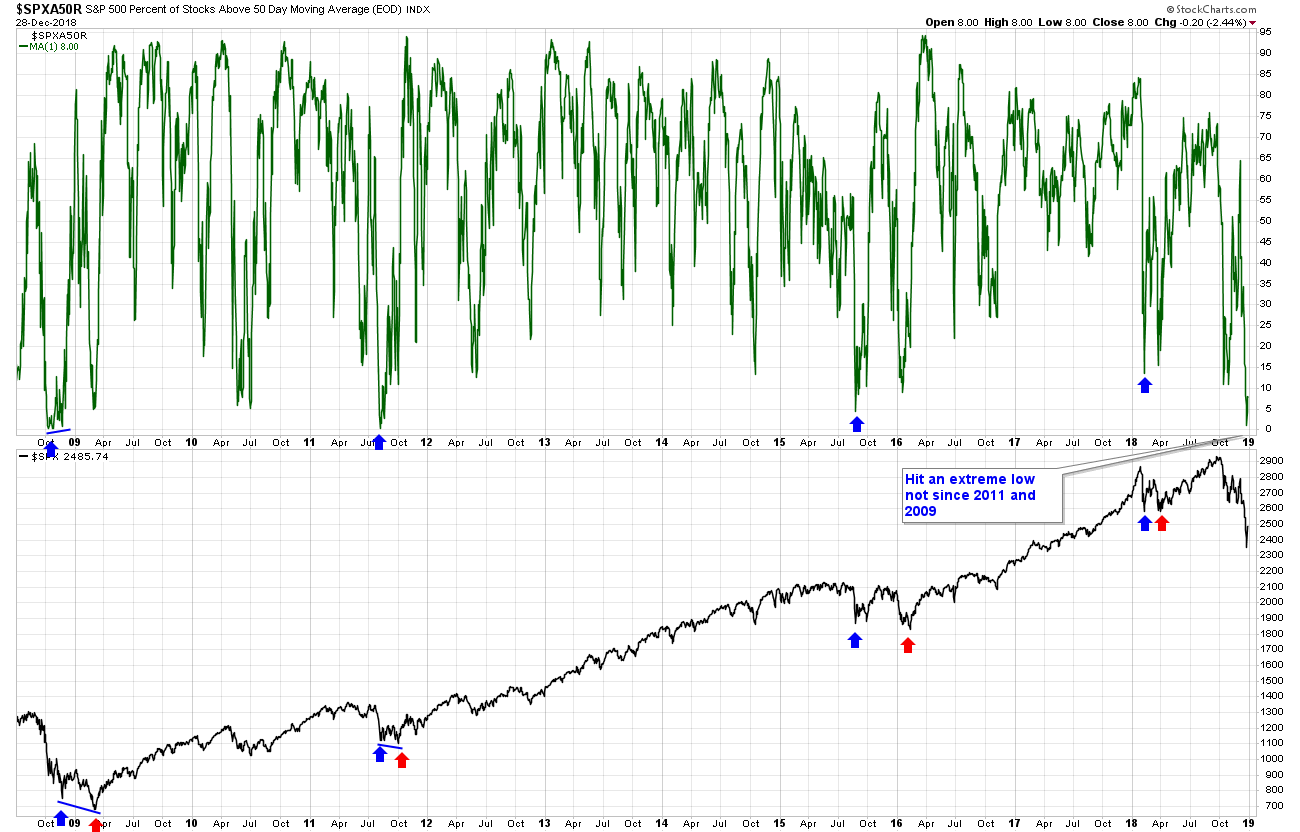
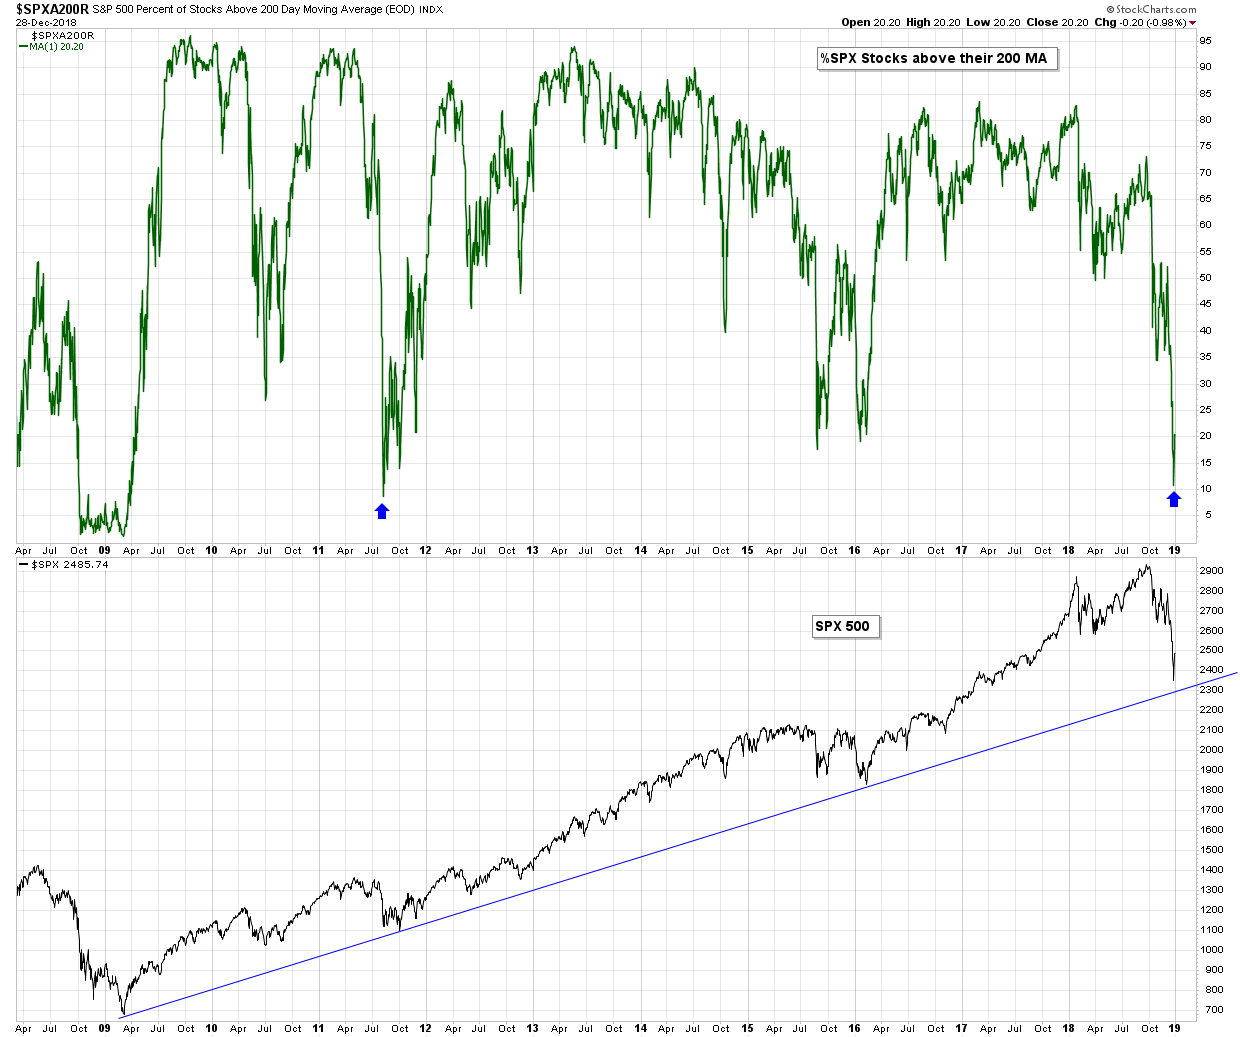
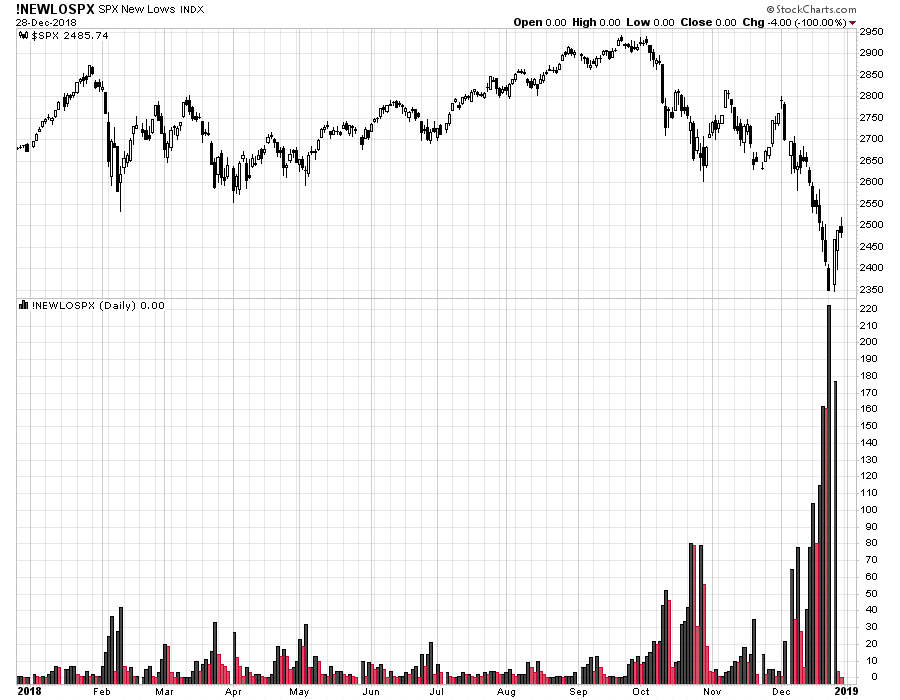
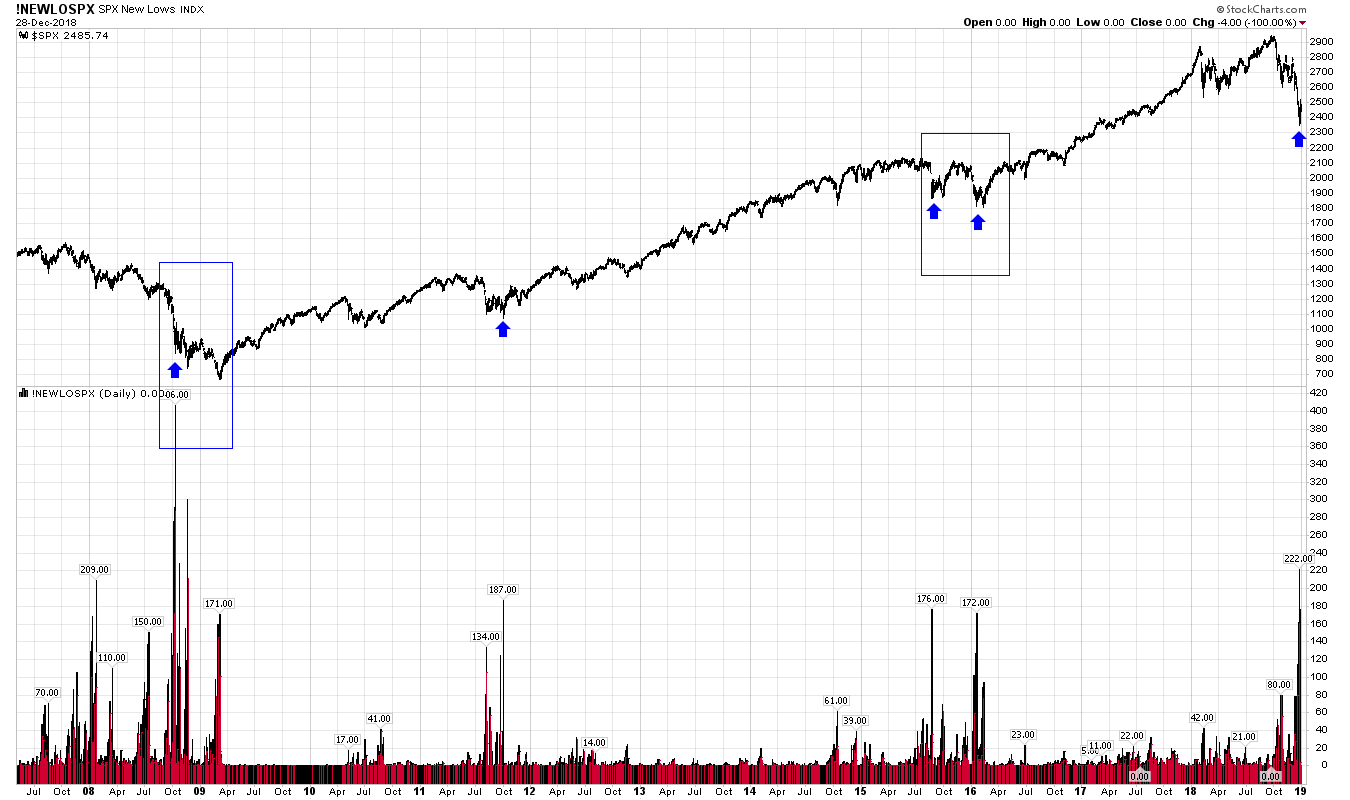
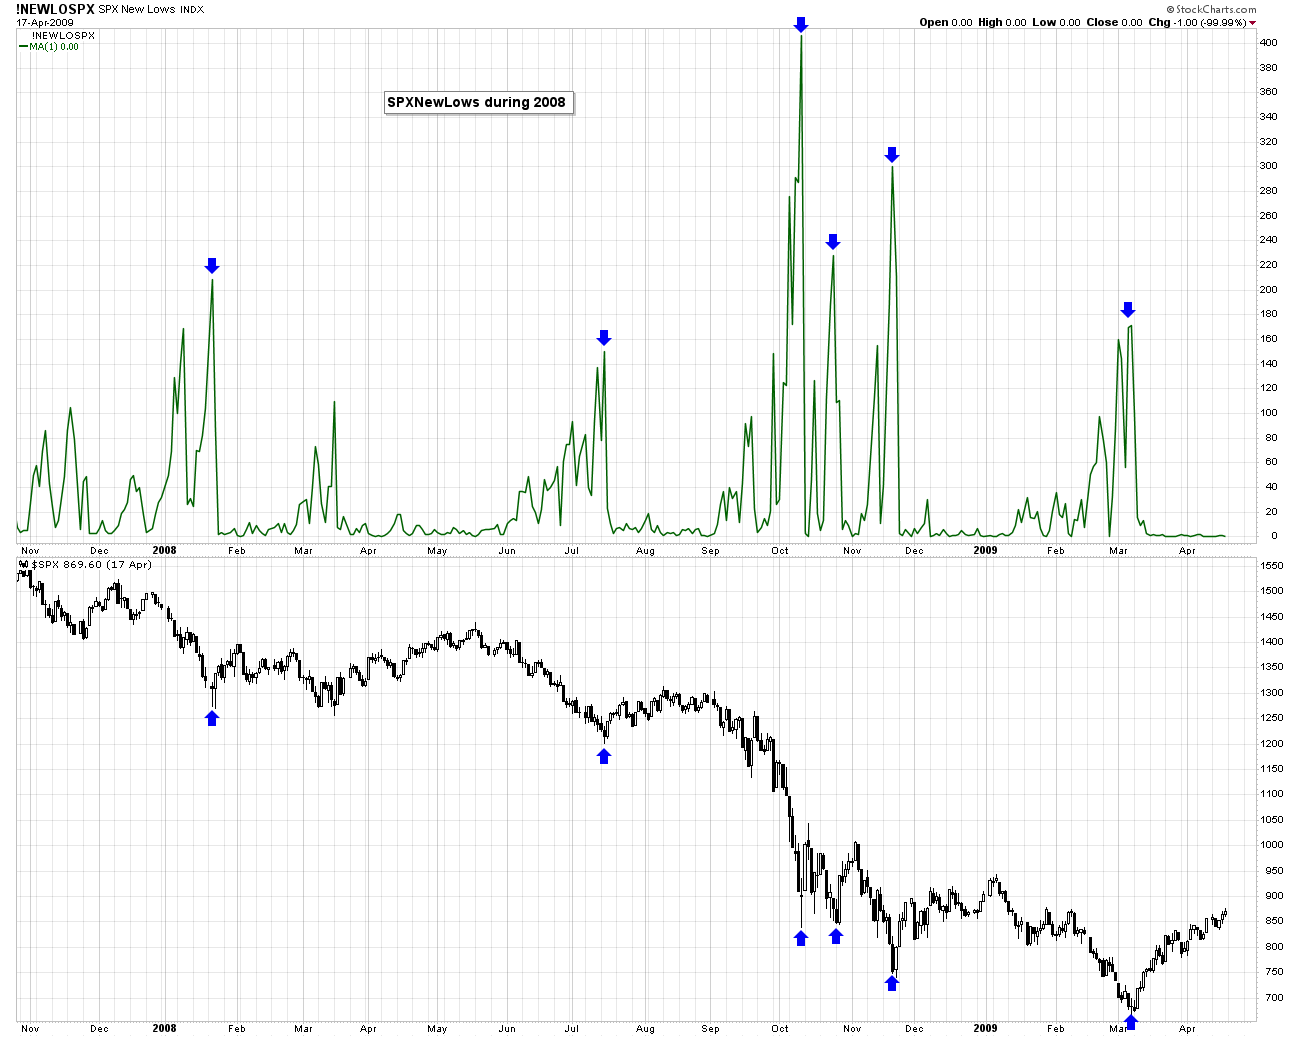
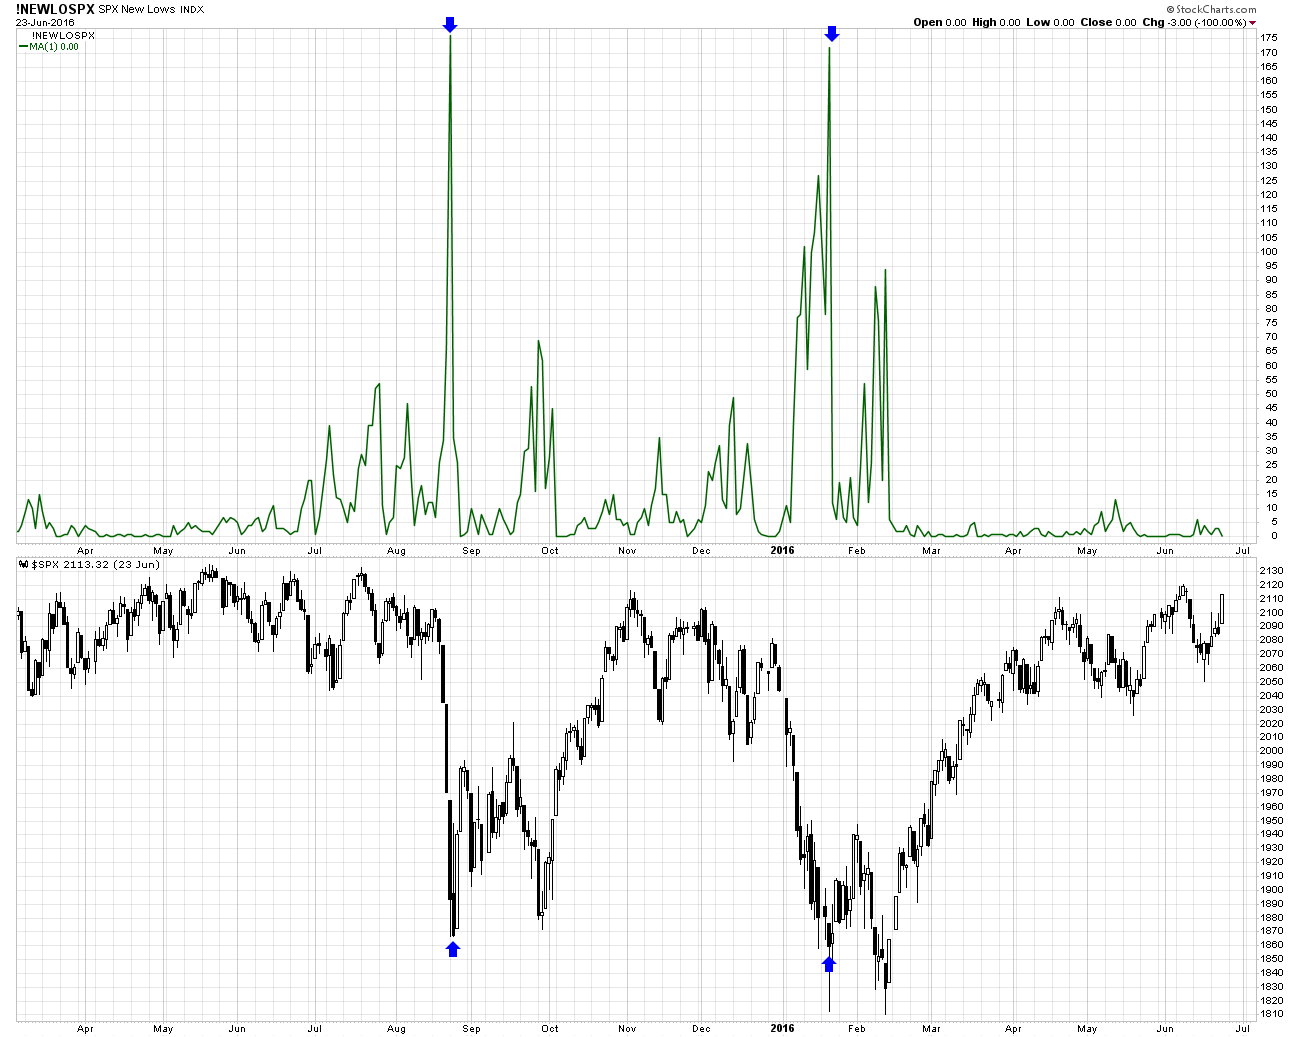
As you saw over the last week, we saw many extremes in various technical indicators that we follow; such as the percentage of stocks in the SPX above their 20 EMA, 50 SMA, and 200 SMA's. The CPC put/call ratio hit an all time record high on the previous week, the New Lows indicators also had huge spikes, and various fear sentiment indicators were at extremes. This all points to a potential wave A low for now. However as I will show below, in almost all cases while the market has had trade bottoms after extreme readings in these indicators, it has almost always made new lows weeks to a few months later. That also fits with our bear market scenario where this has been the initial down leg of the bear market and we expect the next good rally to form a lower high, followed by another decline to test the lows or make new lows.
let's get to the charts
Matt
2
3
| Major Indexes | Index Symbol | ETF Symbol | % G / L Day | % G / L Week | Close |
|---|---|---|---|---|---|
| Dow Jones | INDU - W | DIA - W | -0.33% | 2.75% | 23,062.40 |
| S&P 500 | SPX - W | SPY - W | -0.12% | 2.86% | 2,485.74 |
| Wilshire 5000 | WLSH - W | -0.04% | 3.02% | 25,541.17 | |
| Nasdaq | COMPQ - W | 0.08% | 3.97% | 6,584.52 | |
| NDX 100 | NDX - W | QQQ - W | -0.05% | 3.95% | 6,285.27 |
| Russel 2000 (Small Caps) | RUT - W | IWM - W | 0.46% | 3.55% | 1,337.92 |
| Market Sectors | Index Symbol | ETF Symbol | % G / L Day | % G / L Week | Close |
|---|---|---|---|---|---|
| Transports | TRAN - W | IYT - W | -0.49% | 2.64% | 9,109.13 |
| Banks | BKX - W | 0.13% | 3.19% | 85.15 | |
| Financials | XLF - W | -0.04% | 3.51% | 23.59 | |
| Brokers | XBD - W | -0.14% | 3.85% | 235.40 | |
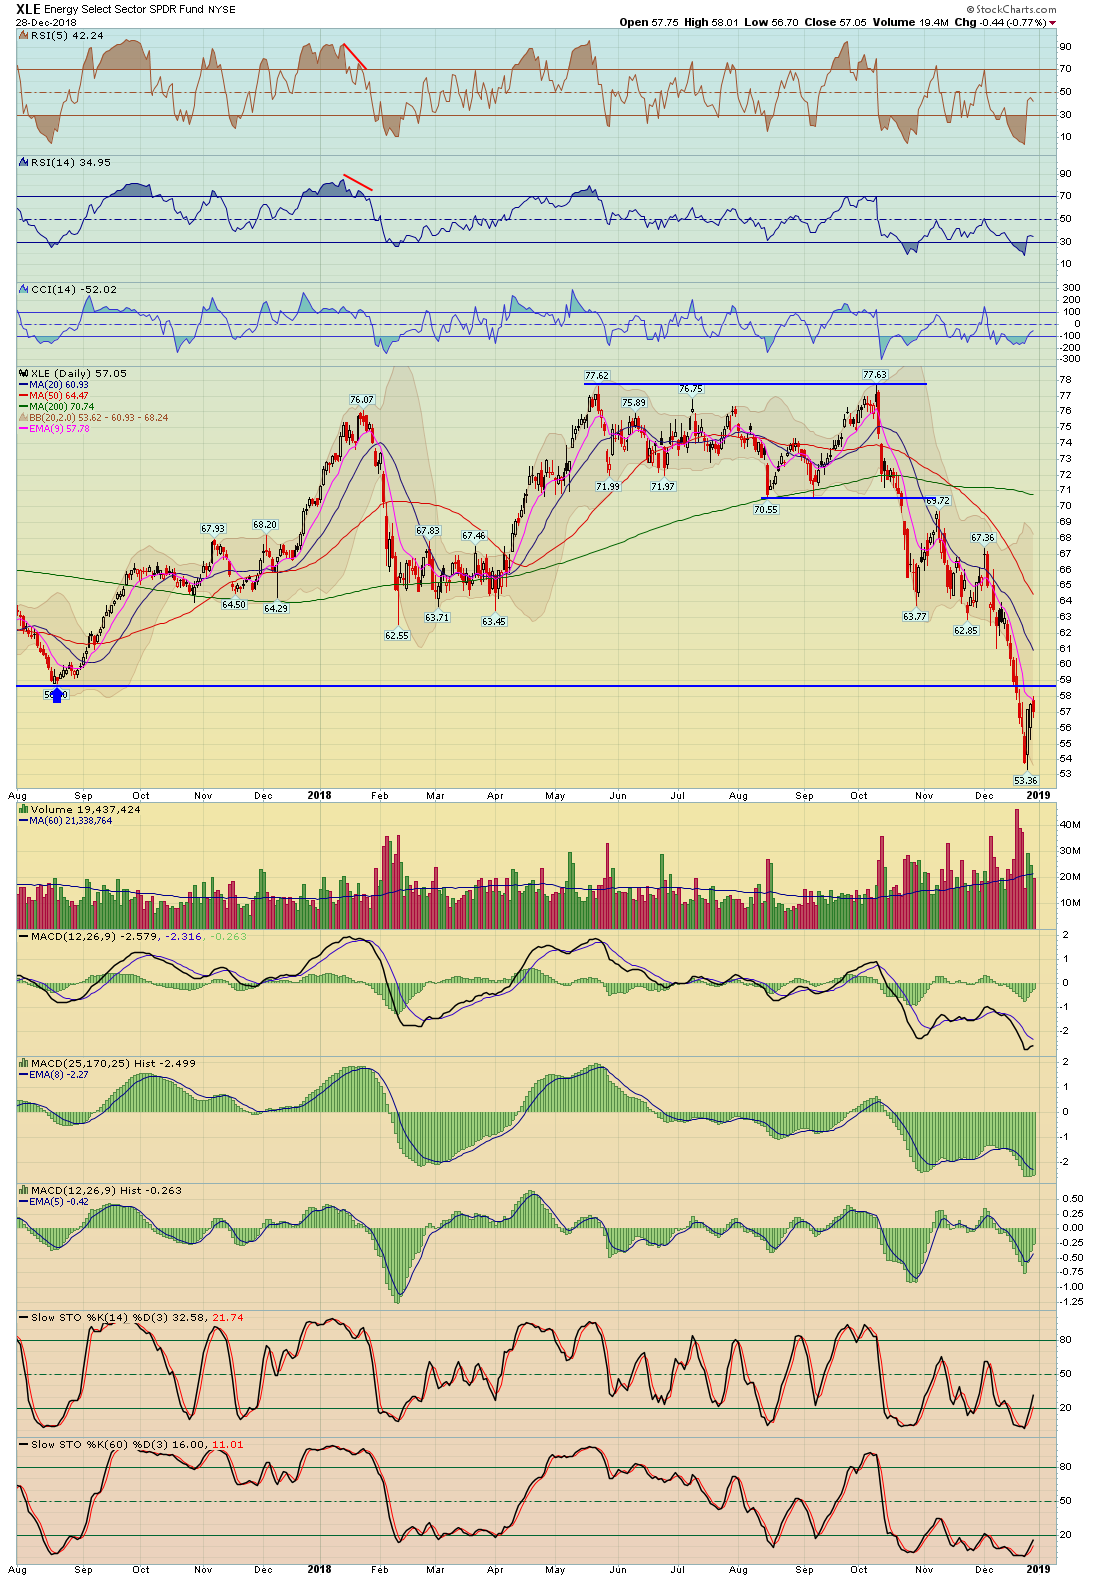
| XLE (Energy Select) | XLE - W | -0.77% | 1.68% | 57.05 | |
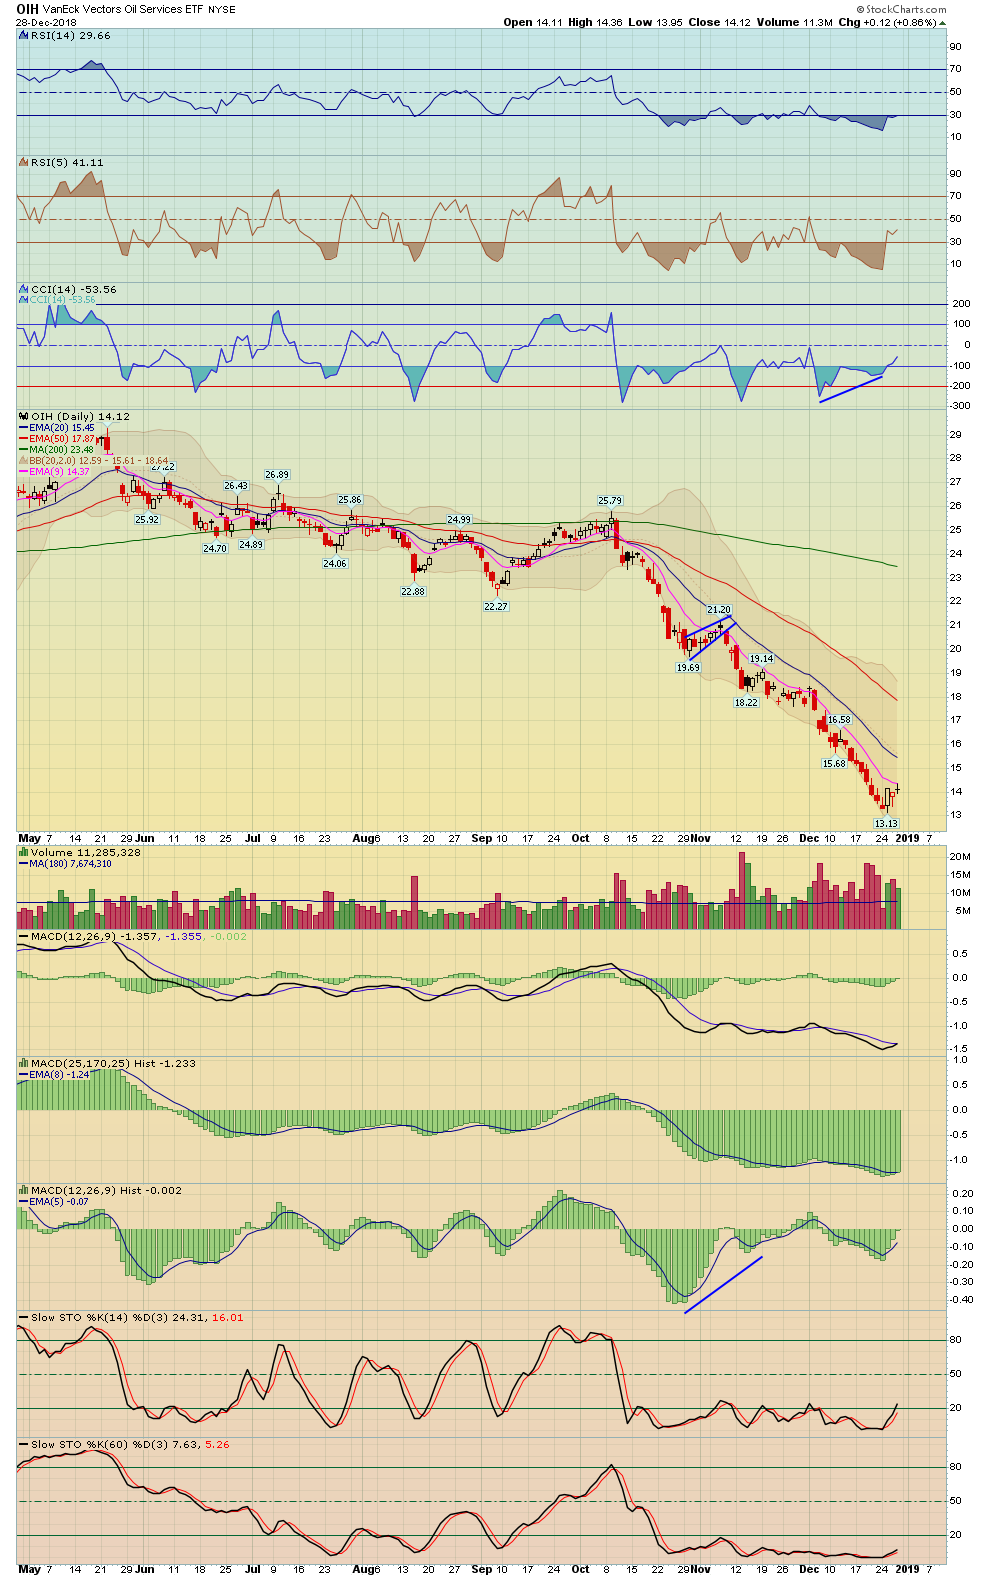
| Oil Service Holders | OIH - W | 0.86% | 3.44% | 14.12 | |
| Technology | XLK - W | -0.23% | 3.72% | 61.40 | |
| Semiconductor | SOX - W | SMH - W | 0.69% | 4.18% | 1,147.37 |
| Communication Services | XLC - W | -0.31% | 3.54% | 41.22 | |
| Retail | XRT - W | 0.52% | 5.60% | 40.76 | |
| Consumer Staples | XLP - W | 0.00% | 0.78% | 50.57 | |
| Consumer Discretionary | XLY - W | 0.01% | 4.48% | 97.96 | |
| Industrials | XLI - W | -0.27% | 2.44% | 63.77 | |
| Real Estate | IYR - W | 0.31% | 0.03% | 74.71 | |
| Homebuilders | HGX - W | XHB - W | 0.04% | 3.20% | 242.05 |
| Materials | XLB - W | -0.54% | 3.09% | 50.10 | |
| Metals And Mining | XME - W | -0.76% | 1.91% | 26.19 | |
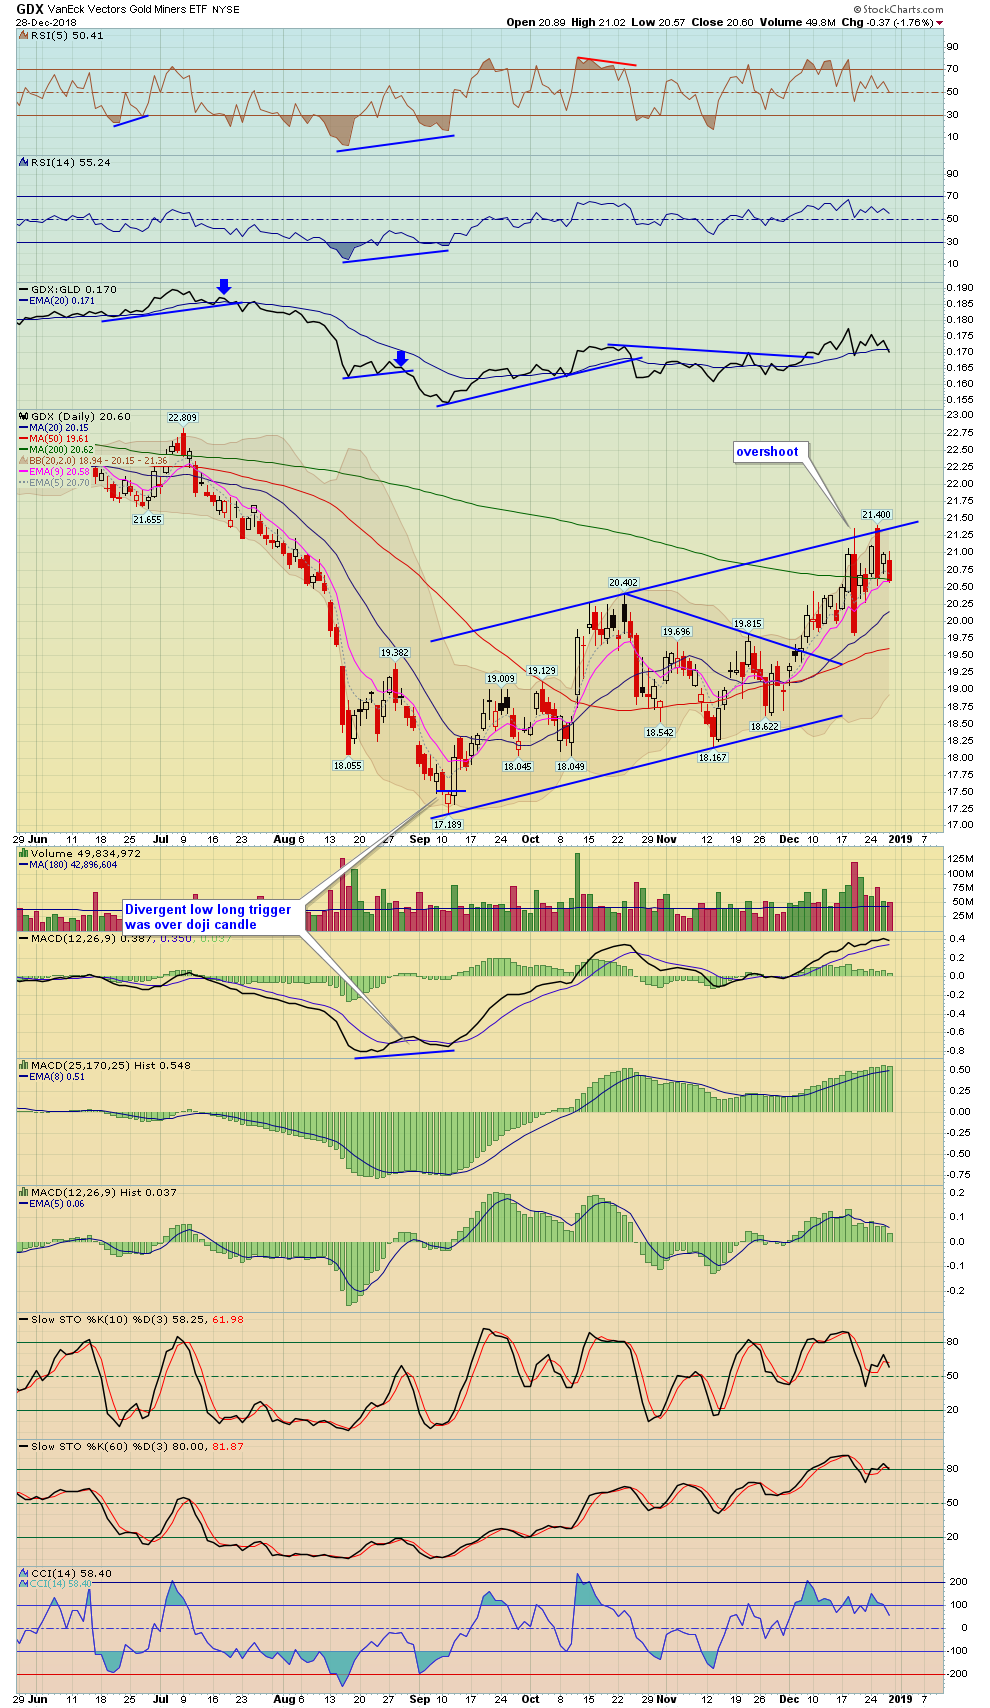
| GDX Gold Miners ETF | GDX - W | -1.76% | 0.78% | 20.60 | |
| Biotechnology | BTK - W | XBI - W | -0.07% | 4.68% | 4,125.53 |
| Healthcare | XLV - W | 0.12% | 3.11% | 85.25 | |
| Drugs | DRG - W | 0.55% | 2.47% | 562.27 | |
| Utilities | UTIL - W | XLU - W | 0.15% | -1.45% | 711.94 |
| Currencies | Index Symbol | ETF Symbol | % G / L Day | % G / L Week | Close |
|---|---|---|---|---|---|
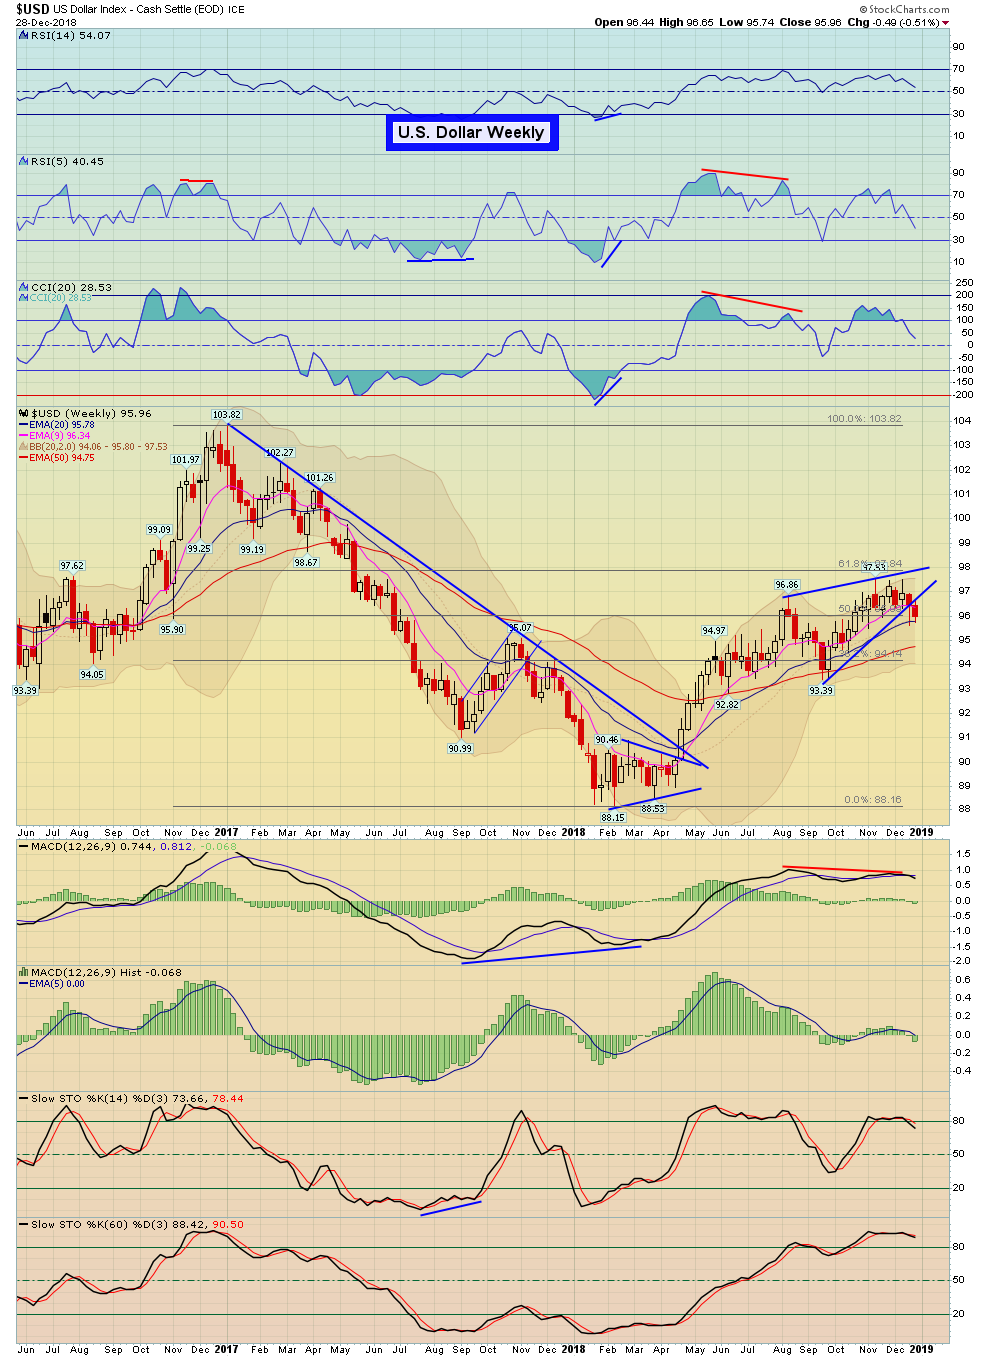
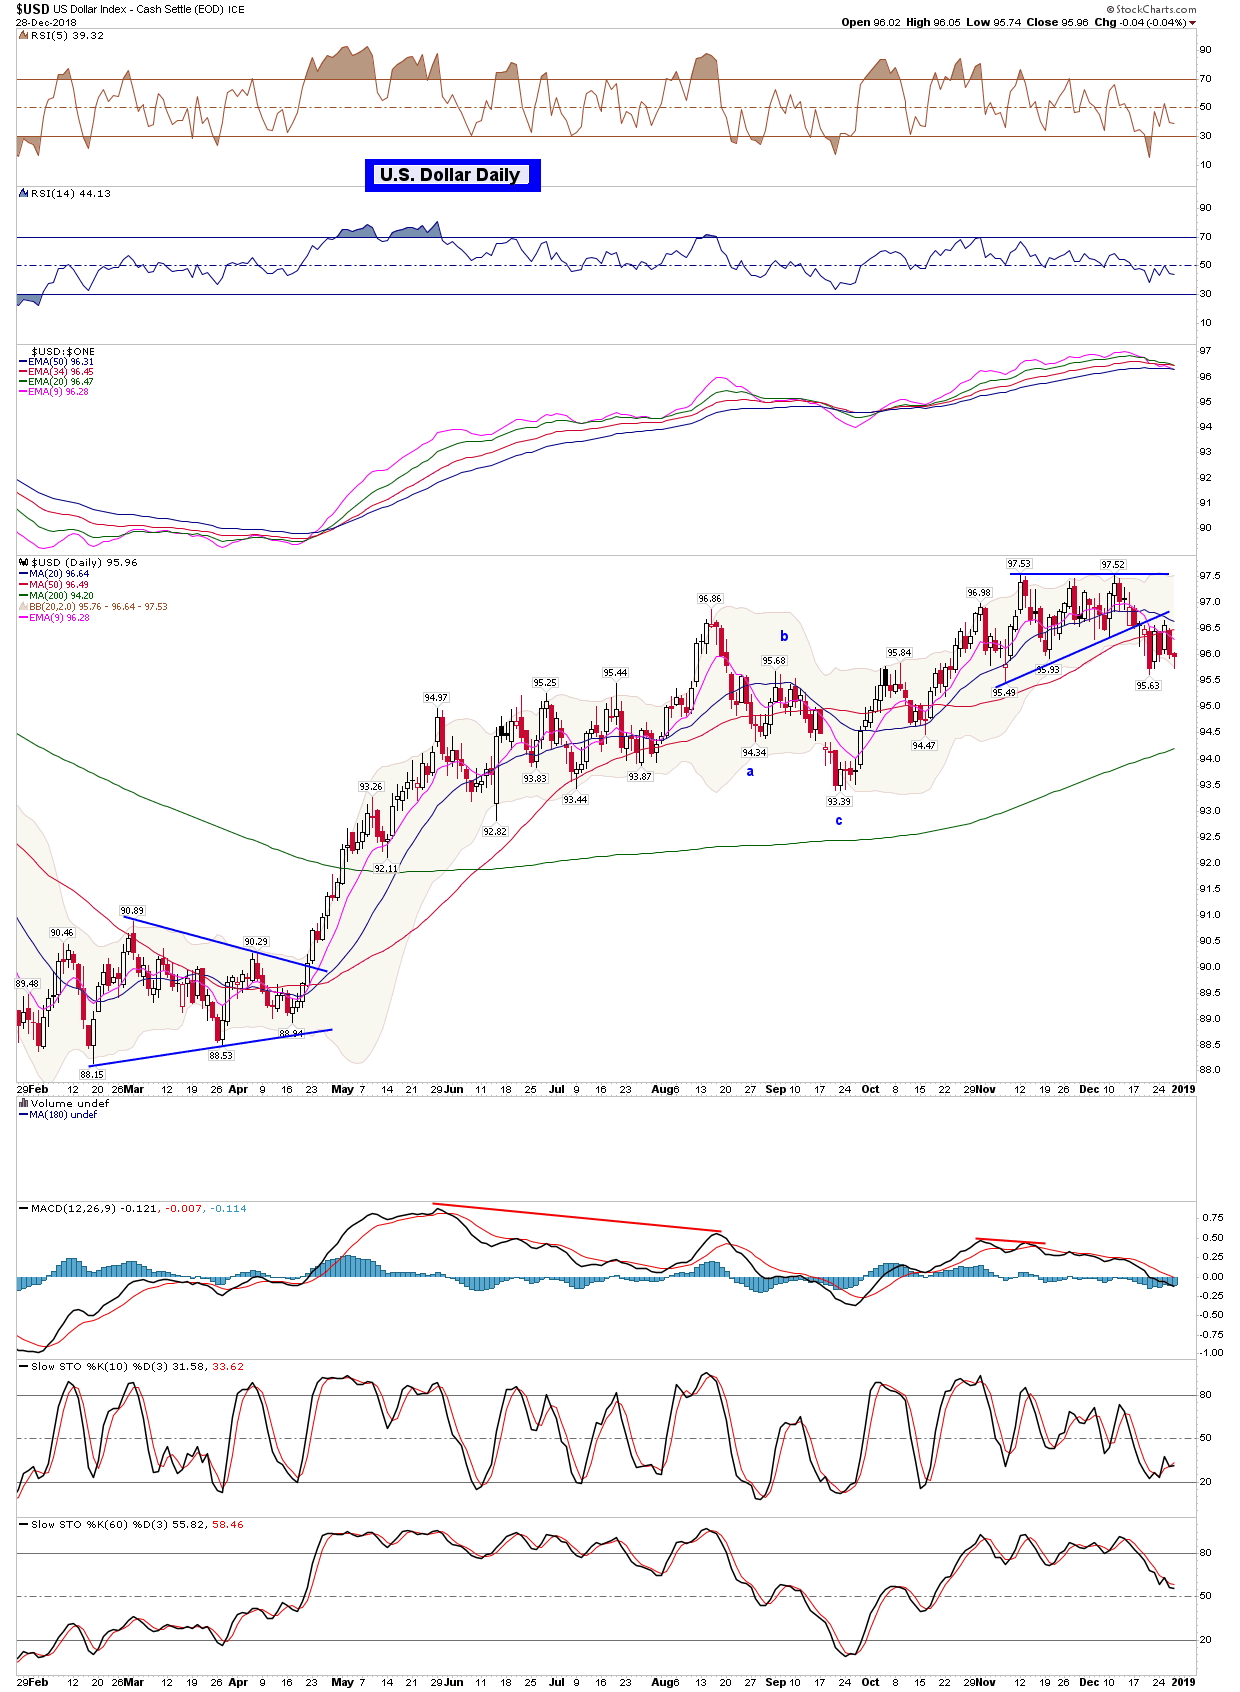
| US Dollar | UUP - W | -0.27% | -0.62% | 25.50 | |
| Euro | XEU - W | FXE - W | 0.10% | 0.29% | 114.44 |
| Yen | XJY - W | FXY - W | 0.51% | 0.38% | 90.62 |
| Australian | XAD - W | FXA - W | 0.11% | -0.01% | 70.40 |
| British Pound | XBP - W | FXB - W | 0.39% | 0.47% | 126.99 |
| Chinese Yuan | CYB - W | 0.10% | 0.78% | 25.26 | |
| Canadian Dollar | CDW - W | FXC - W | -0.08% | -0.26% | 73.33 |
| Swiss Franc | XSF - W | FXF - W | 0.38% | 1.10% | 101.60 |
| Commodities | Index Symbol | ETF Symbol | % G / L Day | % G / L Week | Close |
|---|---|---|---|---|---|
| Commodities | DBC - W | -0.82% | -0.69% | 14.45 | |
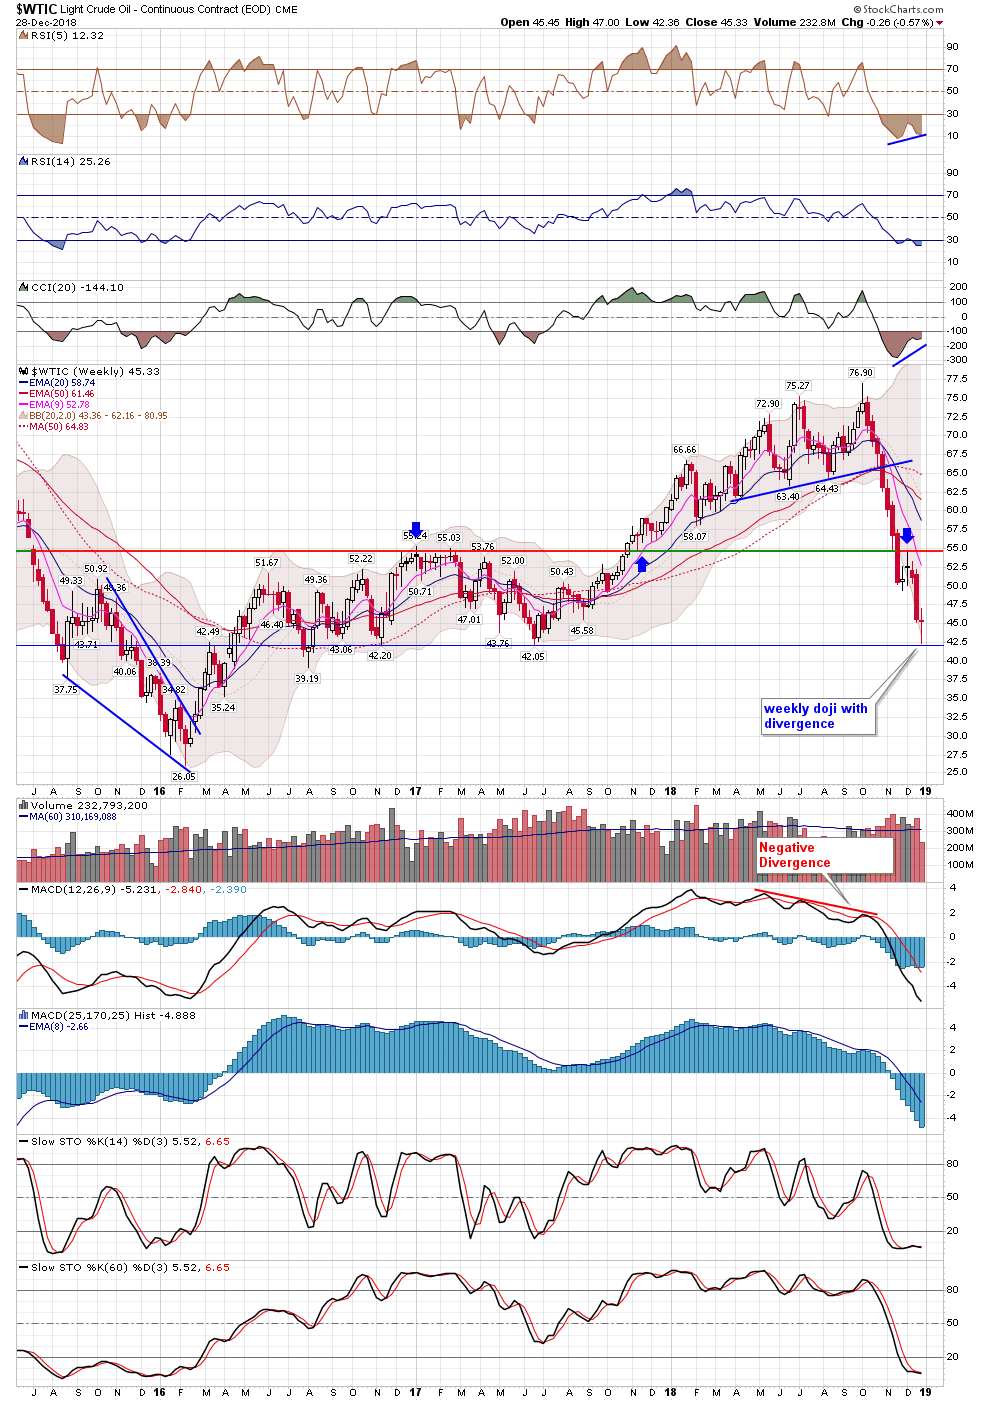
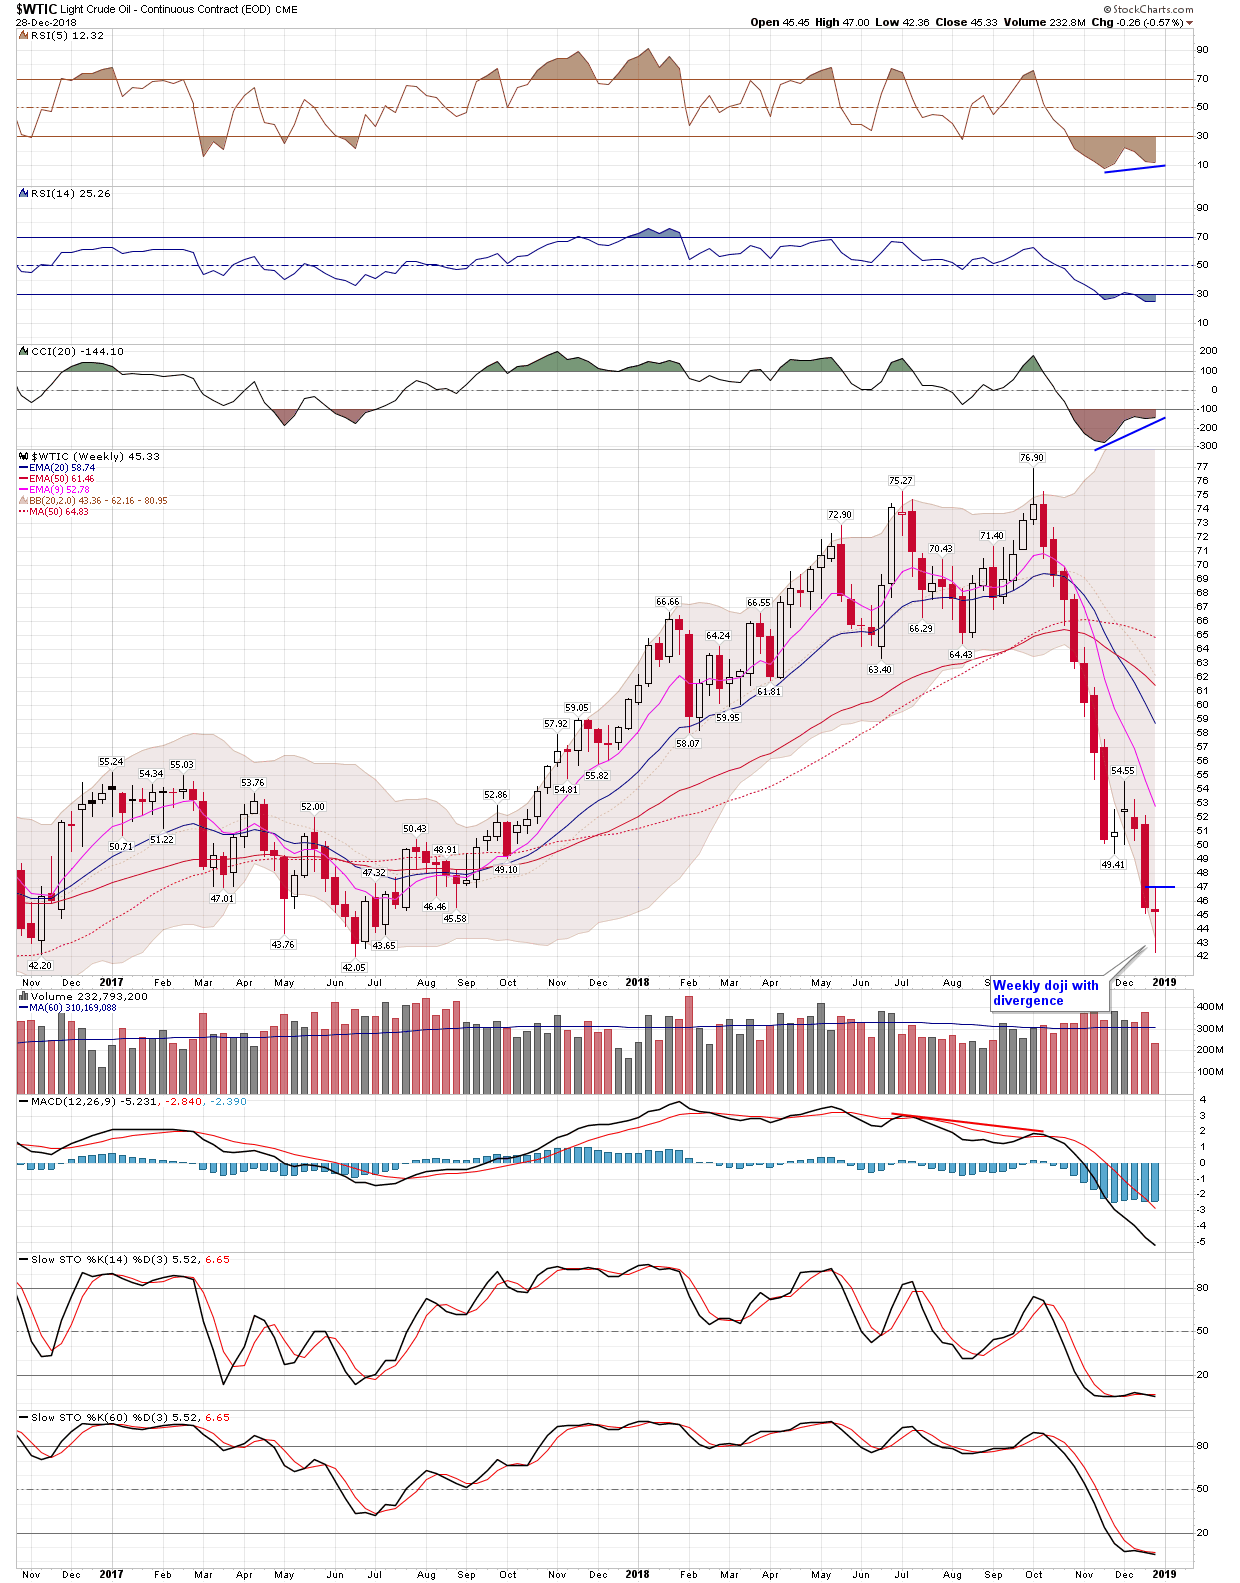
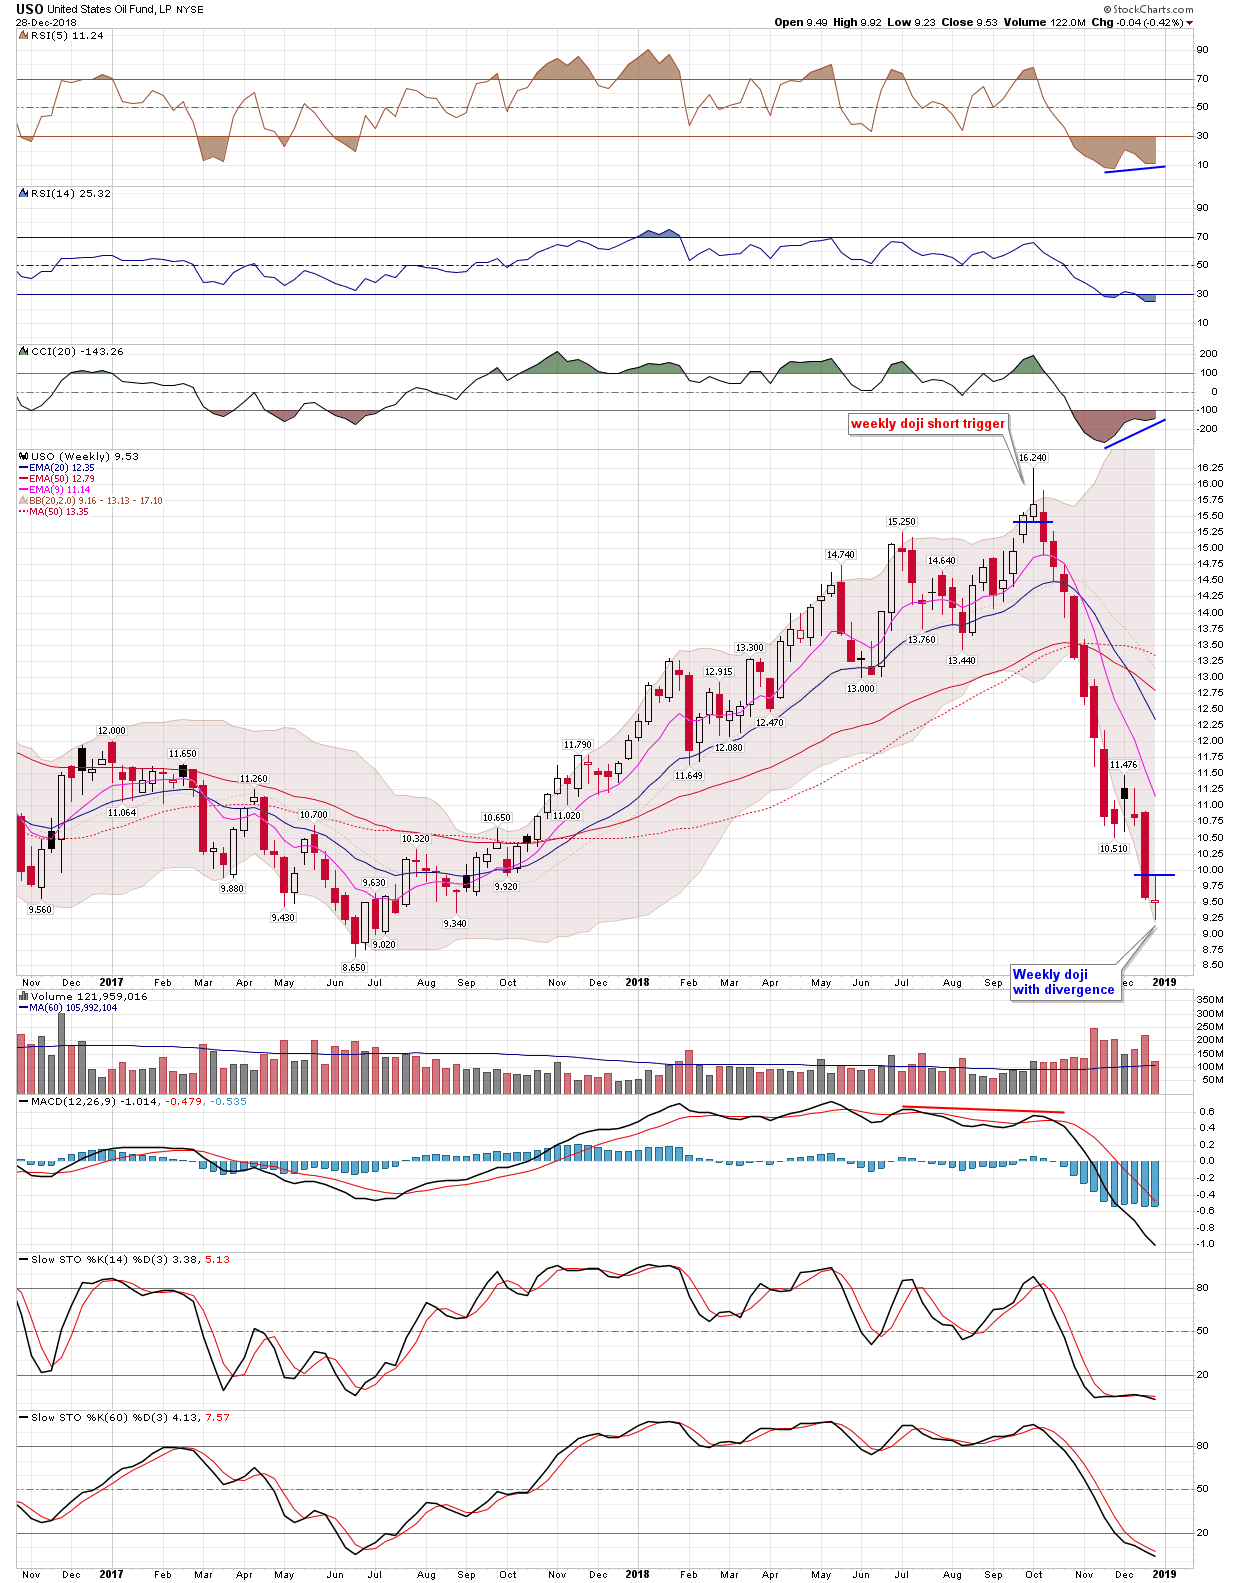
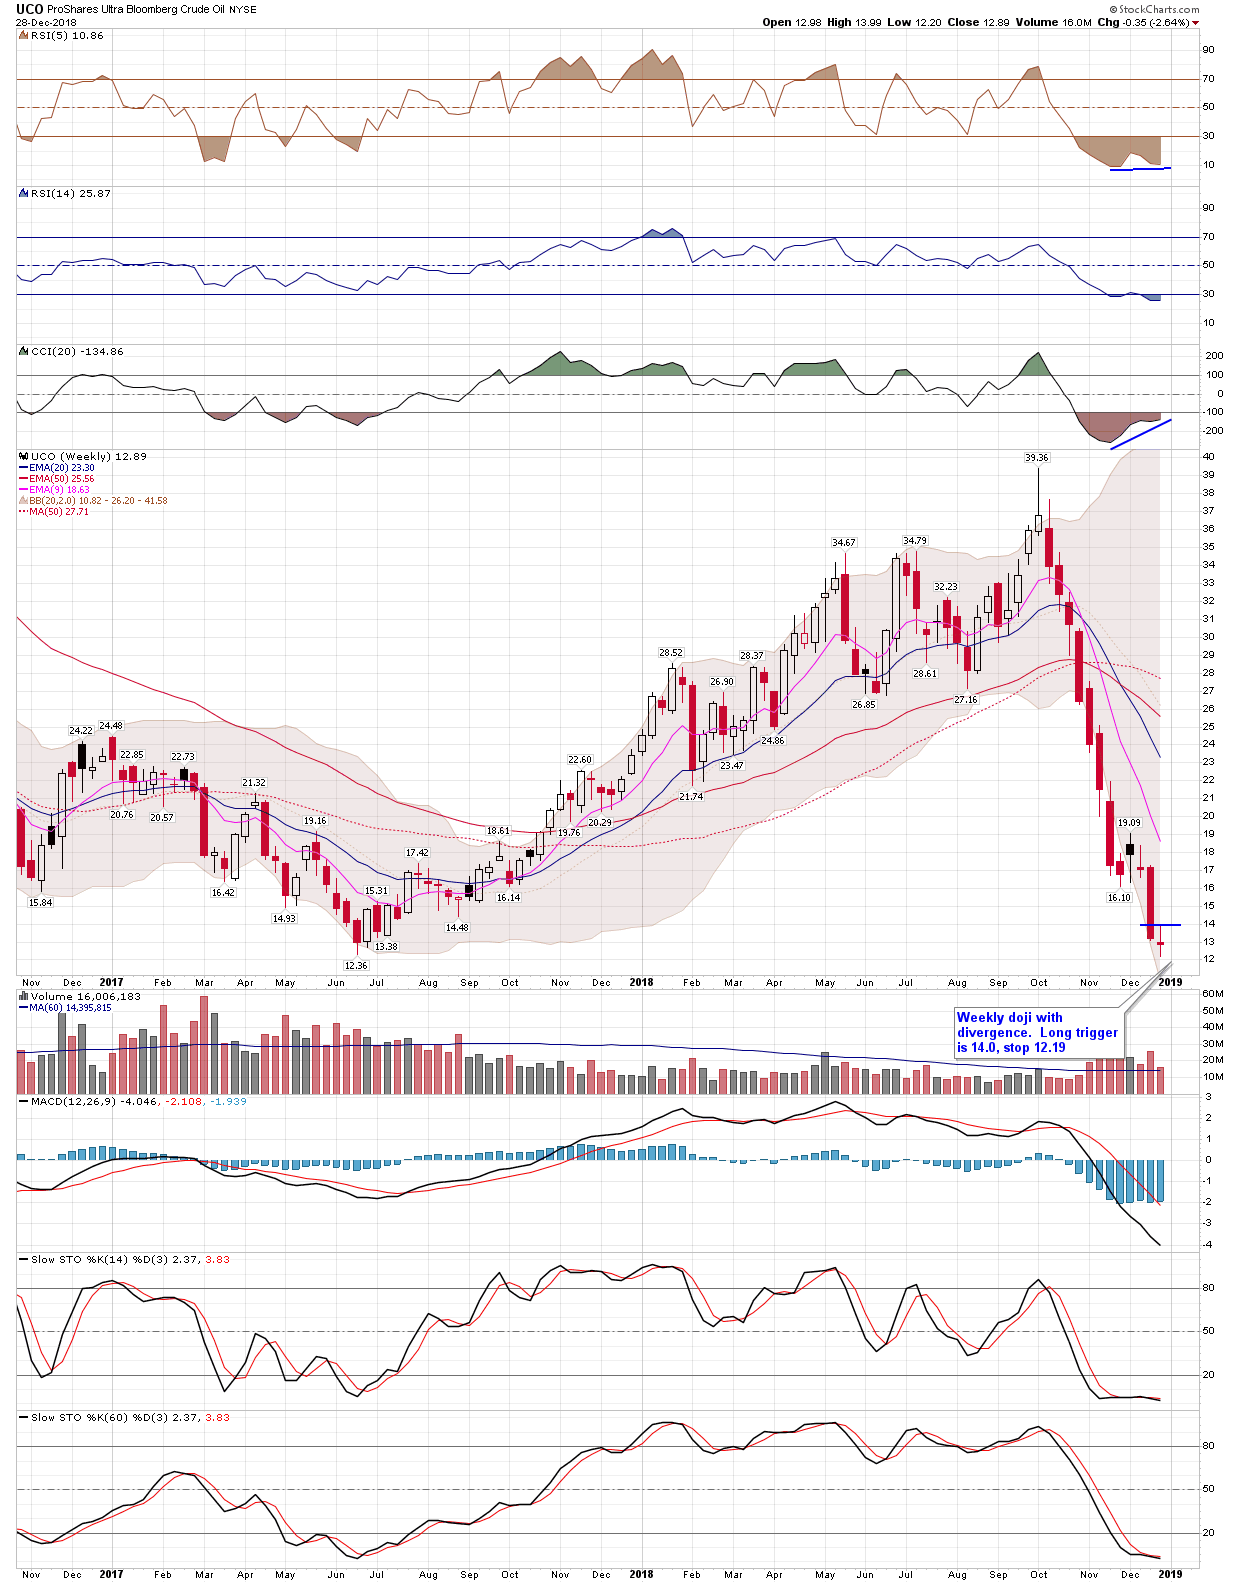
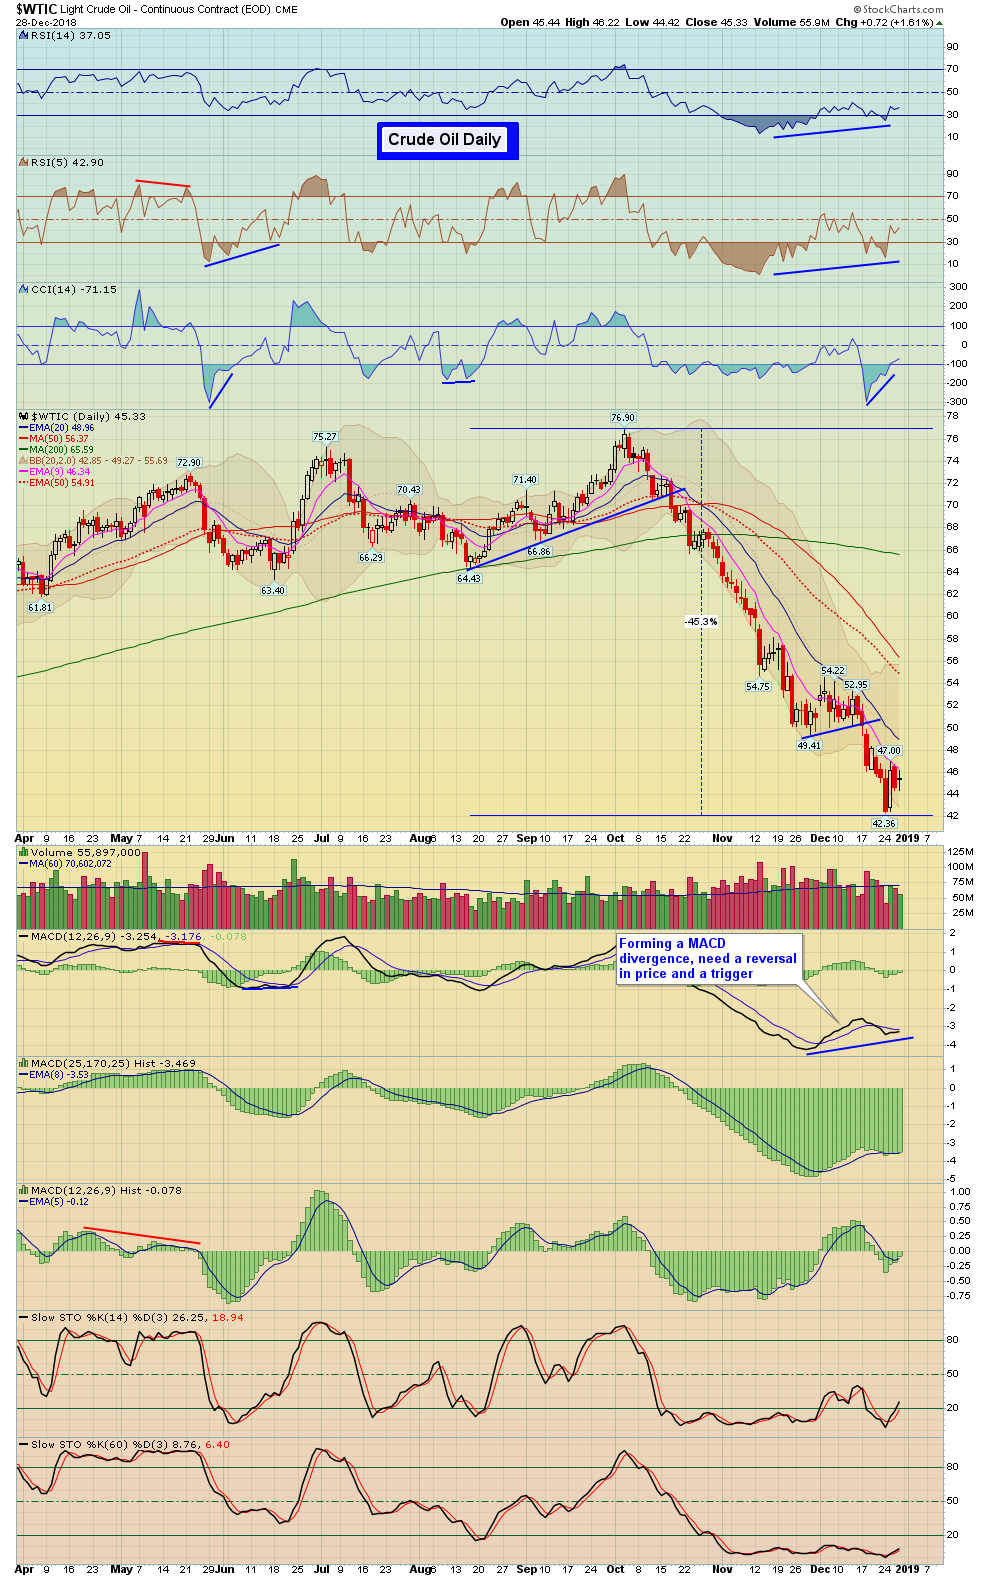
| Crude Oil | WTIC - W | USO - W | 1.61% | -0.57% | 45.33 |
| Gasoline | GASO - W | 1.28% | -0.36% | 1.30 | |
| Natural Gas | NATGAS - W | UNG - W | -6.85% | -11.92% | 3.30 |
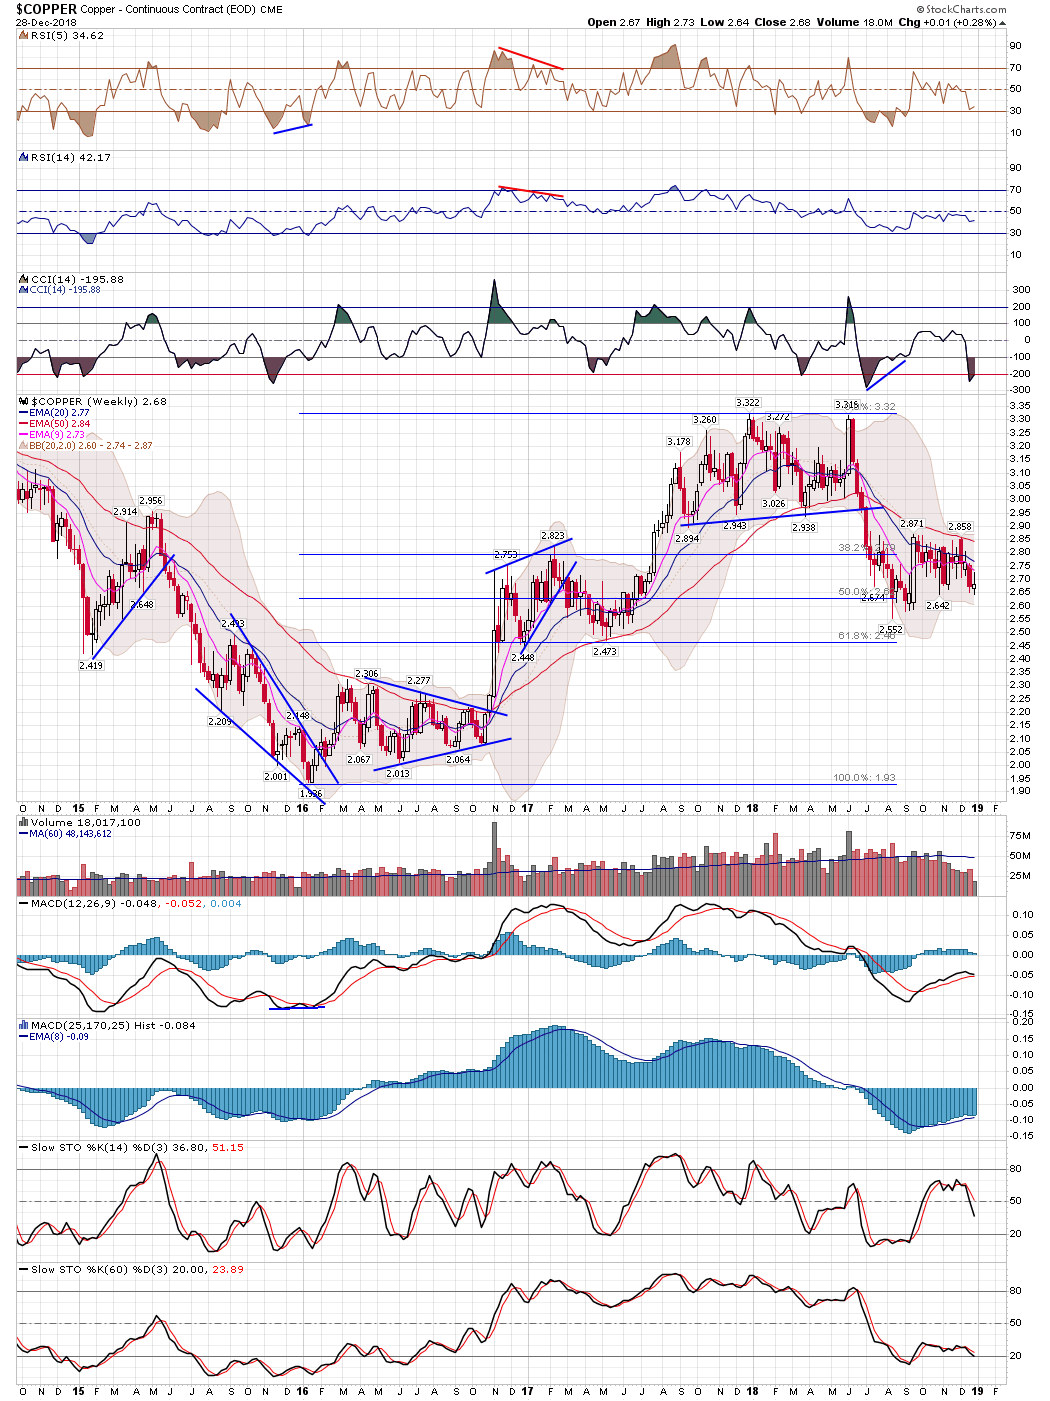
| Copper | COPPER - W | JJCB - W | 0.51% | 0.28% | 2.68 |
| Agriculture | DBA - W | 0.41% | 0.89% | 16.97 | |
| Corn | CORN - W | CORN - W | 0.27% | -0.79% | 375.50 |
| Wheat | WHEAT - W | WEAT - W | 0.20% | -0.49% | 511.50 |
| Coffee | BJO - W | -2.04% | -3.06% | 41.78 | |
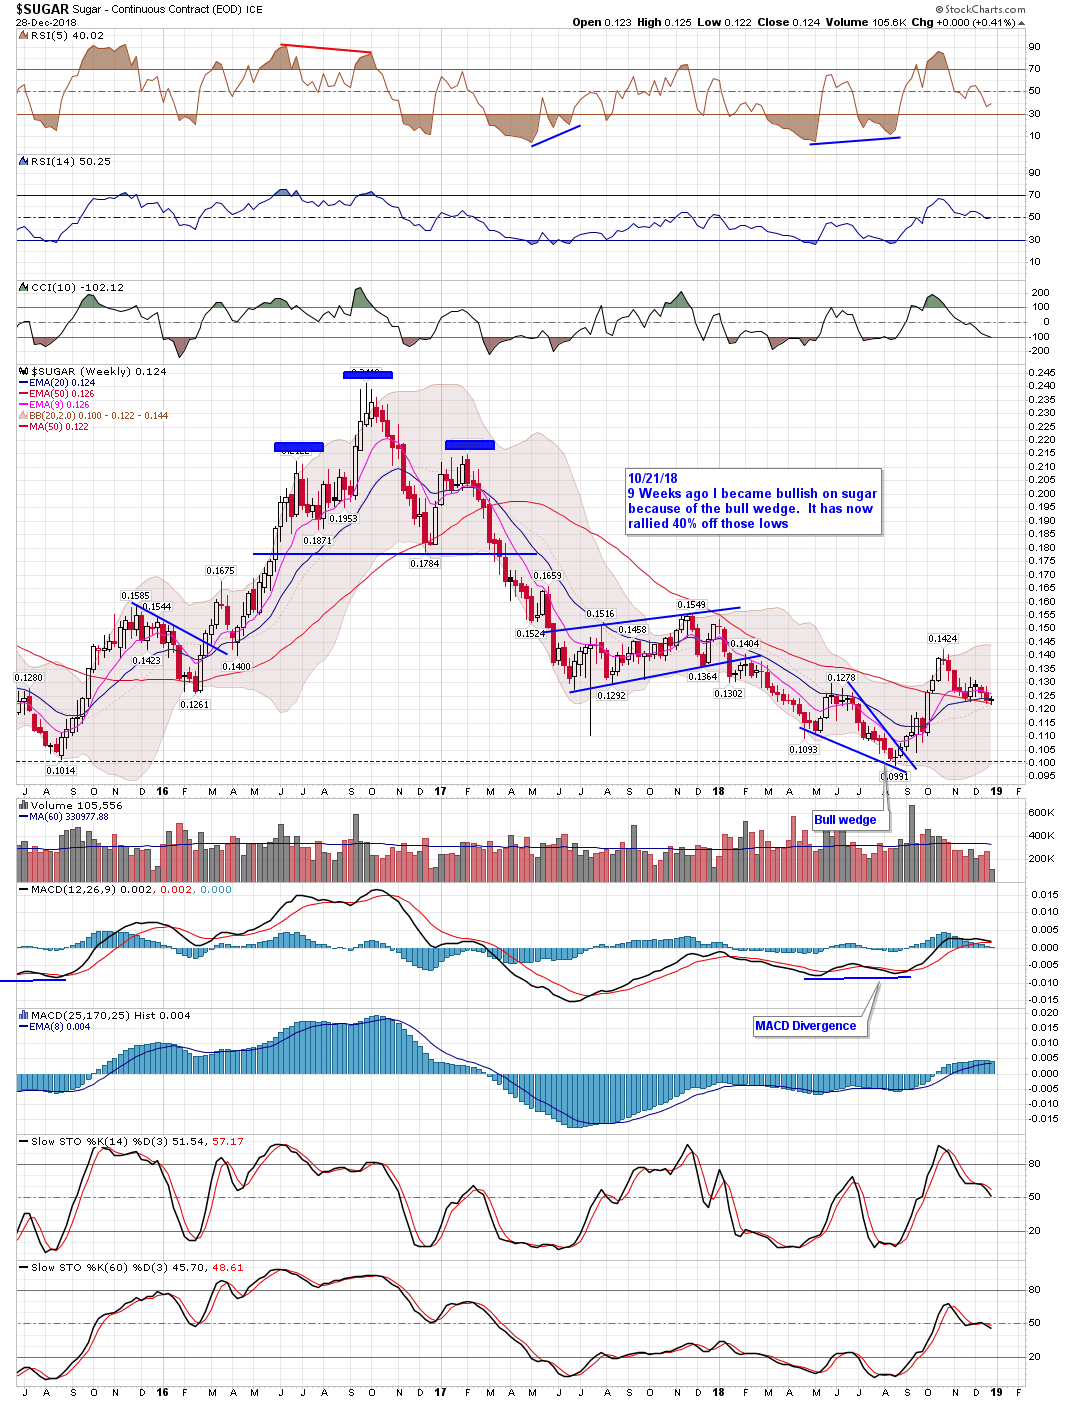
| Sugar | CANE - W | 0.42% | 0.14% | 7.22 |
| Precious Metals | Index Symbol | ETF Symbol | % G / L Day | % G / L Week | Close |
|---|---|---|---|---|---|
| Gold Metal | GLD - W | 0.41% | 1.97% | 121.06 | |
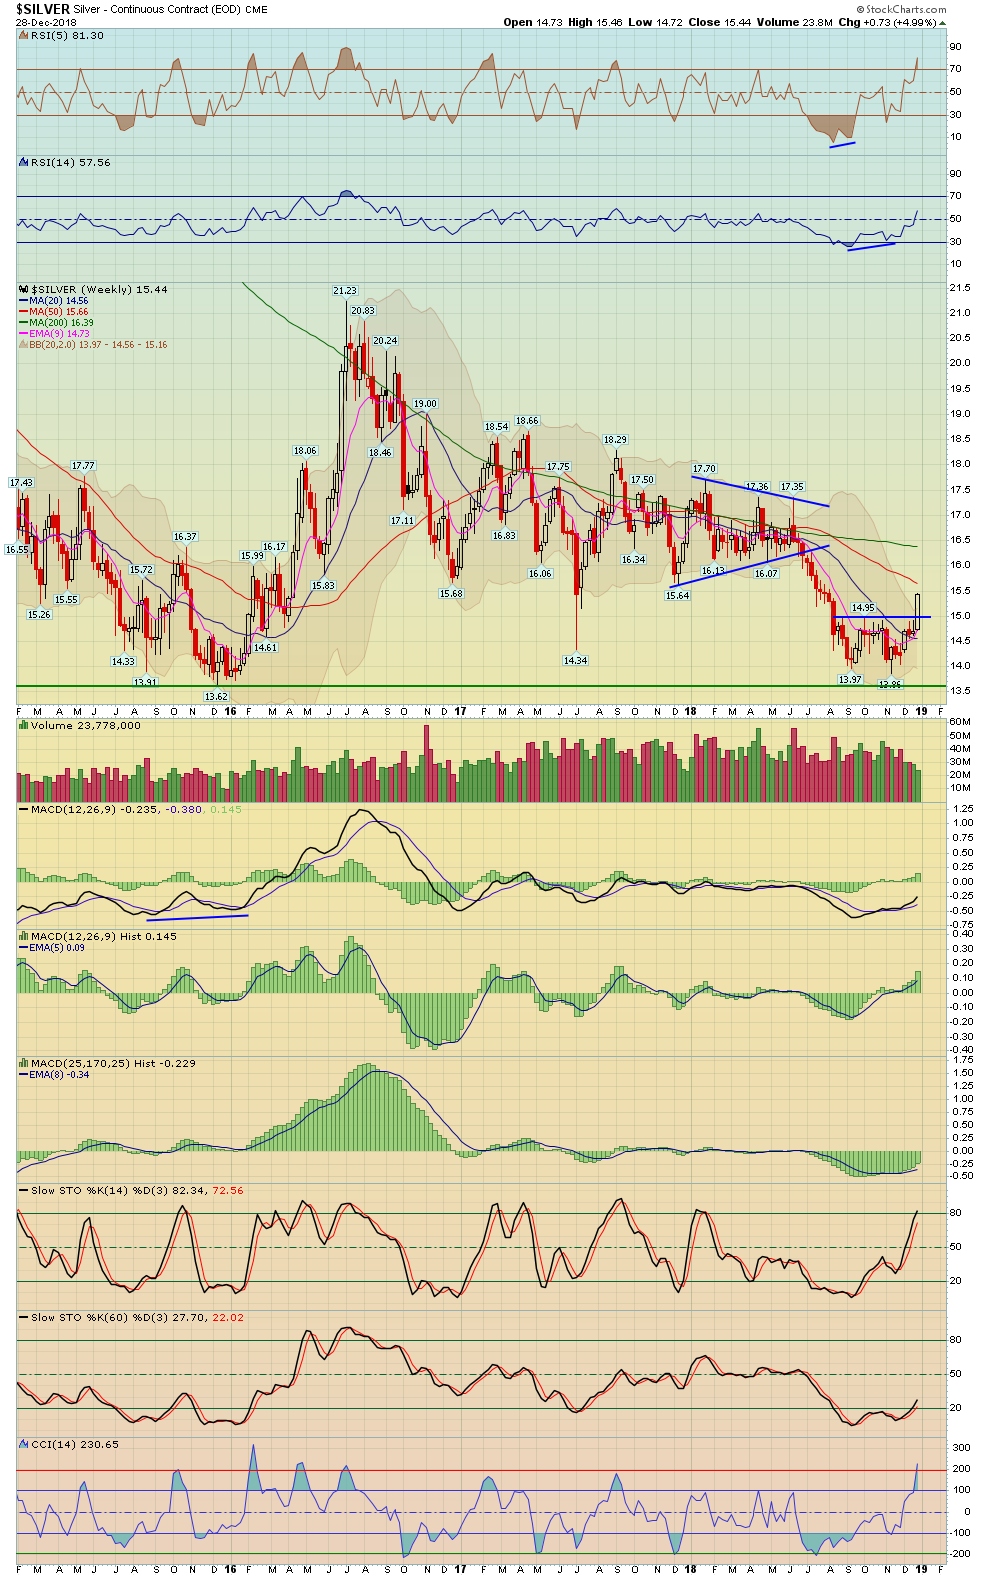
| Silver | SLV - W | 0.84% | 4.95% | 14.42 | |
| Platinum | PPLT - W | -0.92% | 0.10% | 74.72 | |
| Palladium | PALL - W | 0.18% | 3.26% | 119.72 | |
| GDX Gold Miners ETF | GDX - W | -1.76% | 0.78% | 20.60 |
| Bonds | Index Symbol | ETF Symbol | % G / L Day | % G / L Week | Close |
|---|---|---|---|---|---|
| High Yield Corporate Bond | HYG - W | 0.15% | 1.01% | 81.04 | |
| TLT 20 Year Bond ETF | TLT - W | 0.84% | 0.27% | 121.05 | |
| 10 Year Treasury Yield | TNX - W | -0.26% | -2.01% | 27.36 | |
| 30 Year Treasury Yield | TYX - W | 0.40% | 0.46% | 30.42 |
4
| Date | ET | Release | For | Actual | Briefing.com Forecast | Briefing.com Consensus | Prior | Revised From |
|---|---|---|---|---|---|---|---|---|
| Jan 02 | 07:00 | MBA Mortgage Applications Index | 12/29 | NA | NA | NA | ||
| Jan 03 | 08:15 | ADP Employment Change | Dec | 190K | 170K | 179K | ||
| Jan 03 | 08:30 | Continuing Claims | 12/29 | NA | NA | 1701K | ||
| Jan 03 | 08:30 | Initial Claims | 12/29 | 218K | 220K | 216K | ||
| Jan 03 | 10:00 | Construction Spending | Nov | 0.1% | 0.3% | -0.1% | ||
| Jan 03 | 10:00 | ISM Manufacturing Index | Dec | 57.3 | 57.8 | 59.3 | ||
| Jan 03 | 14:00 | Auto Sales | Dec | NA | NA | 4.01M | ||
| Jan 03 | 14:00 | Truck Sales | Dec | NA | NA | 9.48M | ||
| Jan 04 | 08:30 | Nonfarm Payrolls | Dec | 190K | 180K | 155K | ||
| Jan 04 | 08:30 | Nonfarm Private Payrolls | Dec | 185K | 175K | 161K | ||
| Jan 04 | 08:30 | Avg. Hourly Earnings | Dec | 0.3% | 0.3% | 0.2% | ||
| Jan 04 | 08:30 | Unemployment Rate | Dec | 3.7% | 3.7% | 3.7% | ||
| Jan 04 | 08:30 | Average Workweek | Dec | 34.5 | 34.5 | 34.4 | ||
| Jan 04 | 10:30 | EIA Natural Gas Inventories | 12/29 | NA | NA | -48 bcf | ||
| Jan 04 | 11:00 | EIA Crude Oil Inventories | 12/29 | NA | NA | -0.05M |

Stock Earnings Calender:
Click here for a list of Stocks that are reporting Earnings
**Generally we never hold a position into earnings since the risk/reward is too great
5 - View Live Chart
6 - View Live Chart
7 - View Live Chart
8 - View Live Chart
9 - View Live Chart
10 - View Live Chart
11 - View Live Chart
12 - View Live Chart
13 - View Live Chart
14 - View Live Chart
15 - View Live Chart
16 - View Live Chart
17
18
19 - View Live Chart
20 - View Live Chart
21 - View Live Chart
22 - View Live Chart
23 - View Live Chart
24 - View Live Chart
25 - View Live Chart
26 - View Live Chart
27 - View Live Chart
28 - View Live Chart
29 - View Live Chart
30 - View Live Chart
31 - View Live Chart
32 - View Live Chart
33 - View Live Chart
34 - View Live Chart
35 - View Live Chart
36 - View Live Chart
37 - View Live Chart
38 - View Live Chart
39 - View Live Chart
40 - View Live Chart
41 - View Live Chart
42 - View Live Chart
43 - View Live Chart
44 - View Live Chart
45 - View Live Chart
46 - View Live Chart
47 - View Live Chart
48 - View Live Chart
49 - View Live Chart
50 - View Live Chart
51 - View Live Chart
52 - View Live Chart
53 - View Live Chart
54 - View Live Chart
55 - View Live Chart
56 - View Live Chart
57 - View Live Chart
58 - View Live Chart
59 - View Live Chart
60 - View Live Chart
61 - View Live Chart
62 - View Live Chart
63 - View Live Chart
64 - View Live Chart
65 - View Live Chart
66 - View Live Chart
67 - View Live Chart
68 - View Live Chart
69 - View Live Chart
70 - View Live Chart
71 - View Live Chart
72 - View Live Chart
73 - View Live Chart
74 - View Live Chart
75 - View Live Chart
76 - View Live Chart
77 - View Live Chart
78 - View Live Chart
79 - View Live Chart
80 - View Live Chart
81 - View Live Chart
82 - View Live Chart
83 - View Live Chart
84 - View Live Chart
85 - View Live Chart
86 - View Live Chart
87 - View Live Chart
88 - View Live Chart
89 - View Live Chart
90 - View Live Chart
91 - View Live Chart
92 - View Live Chart
93 - View Live Chart
94 - View Live Chart
95 - View Live Chart
- Hide Player Link to Newsletter Audio
- Hide Player Link to Newsletter Audio
- Hide Player Link to Newsletter Audio