Weekend Commodity Newsletter Sunday, June 3rd 2018 - free
Disclaimer: Intraday Chart Links will show up as daily charts unless you have an active stockcharts.com membership and are signed in, you can sign up here.
1
Table Of Contents:
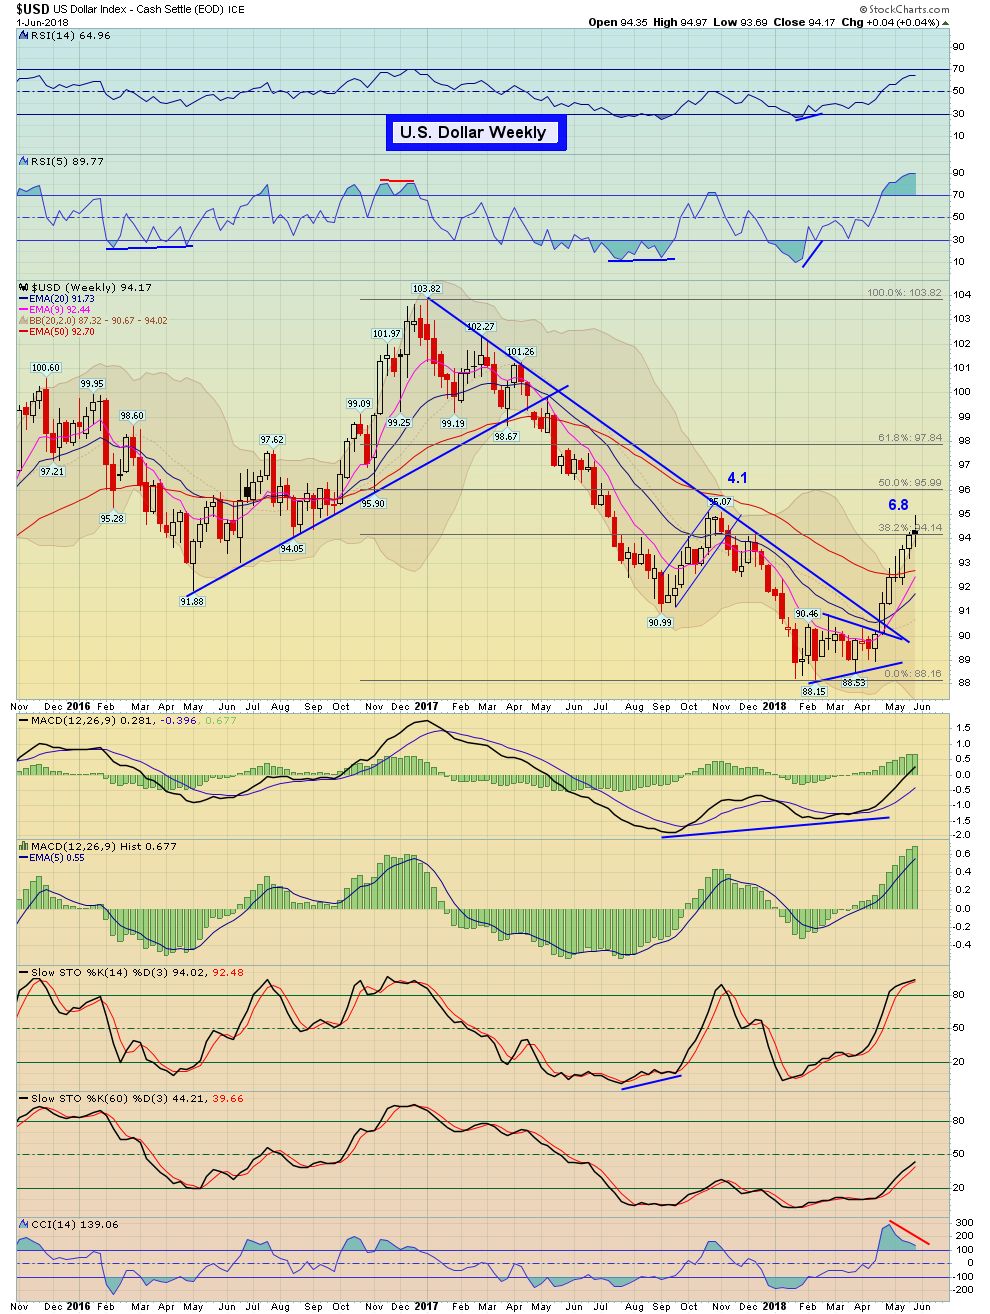
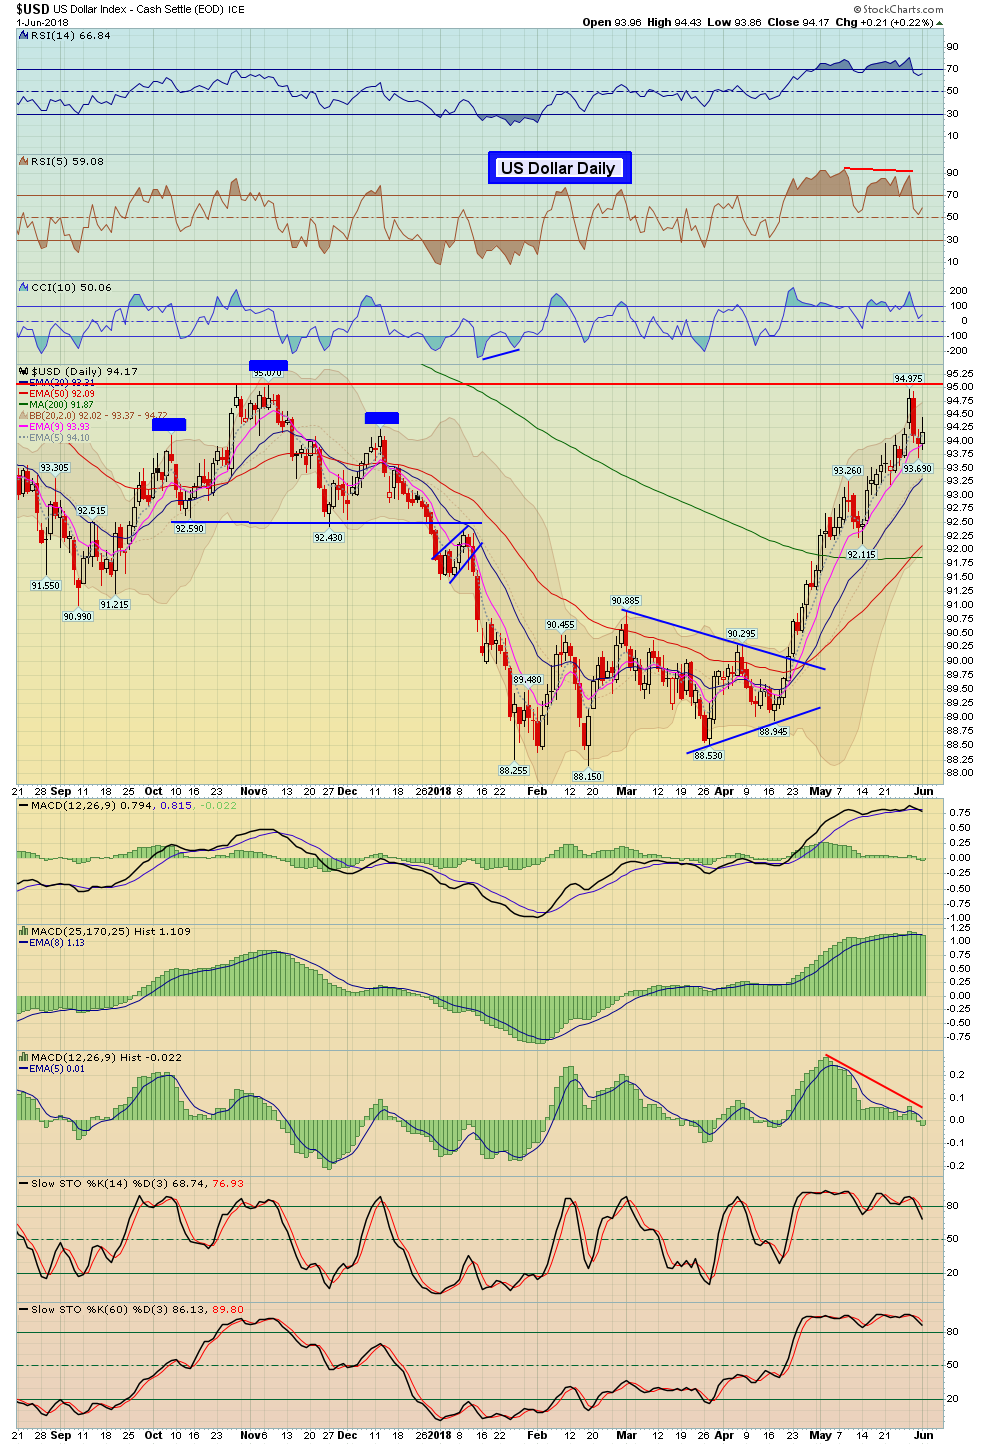
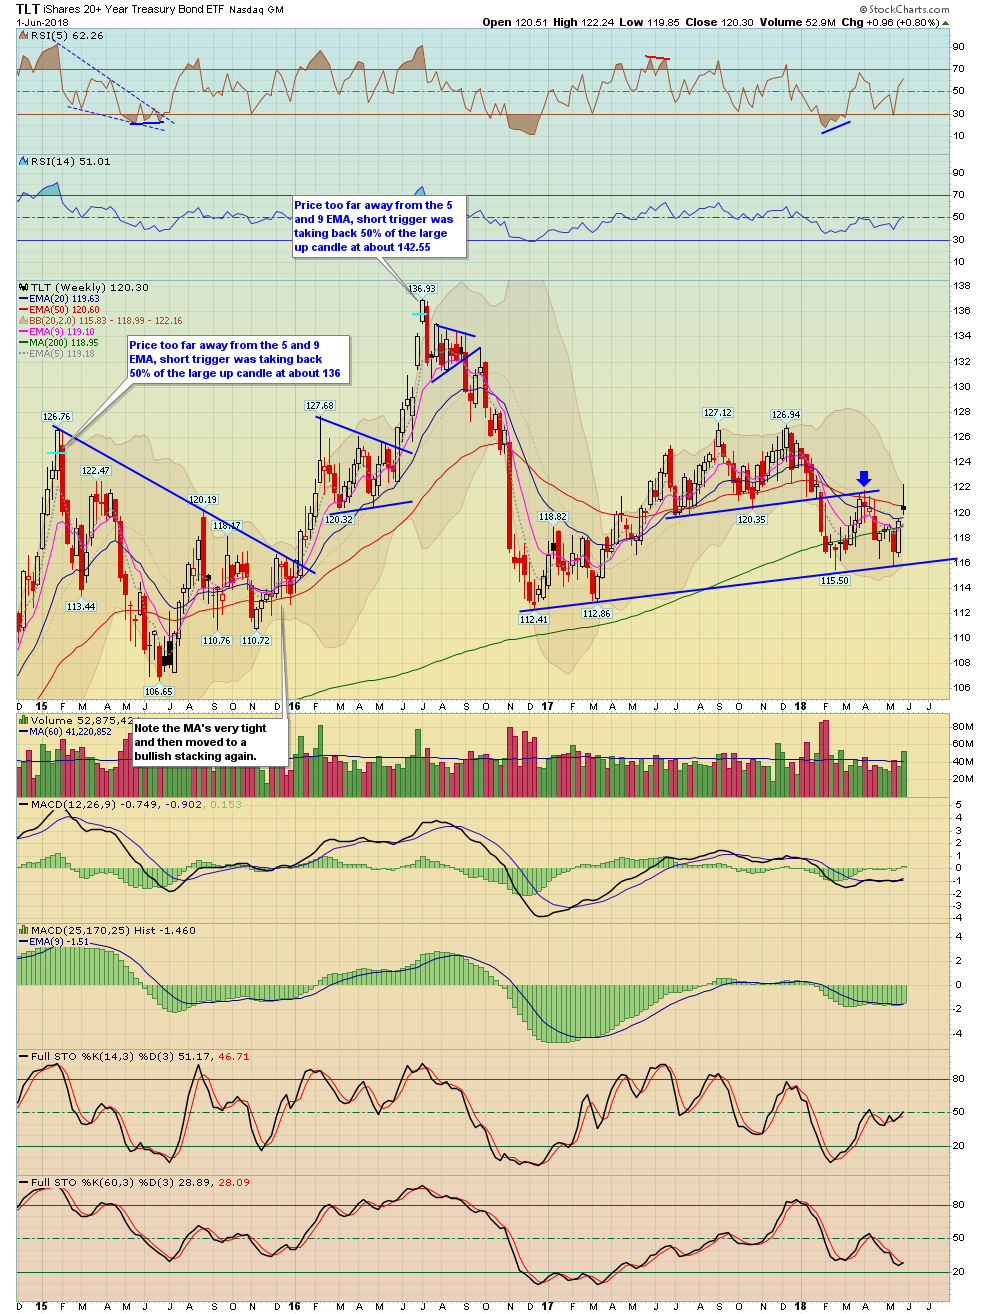
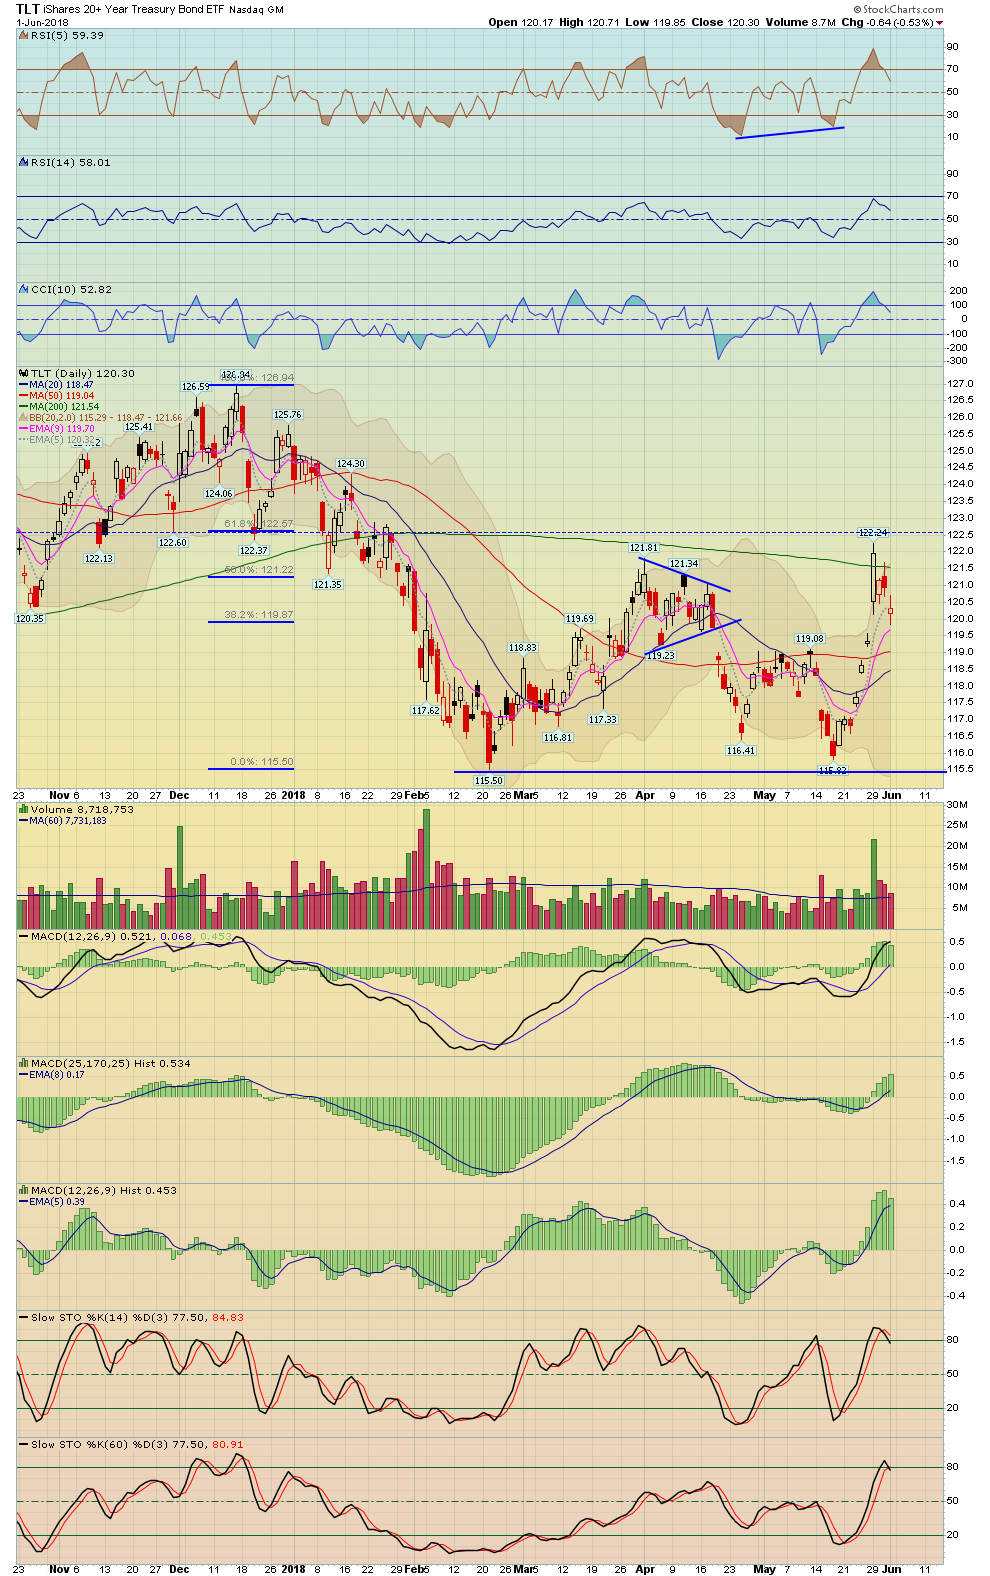
1. Opening Dialogue Market Review, US Dollar, Bonds/Rates
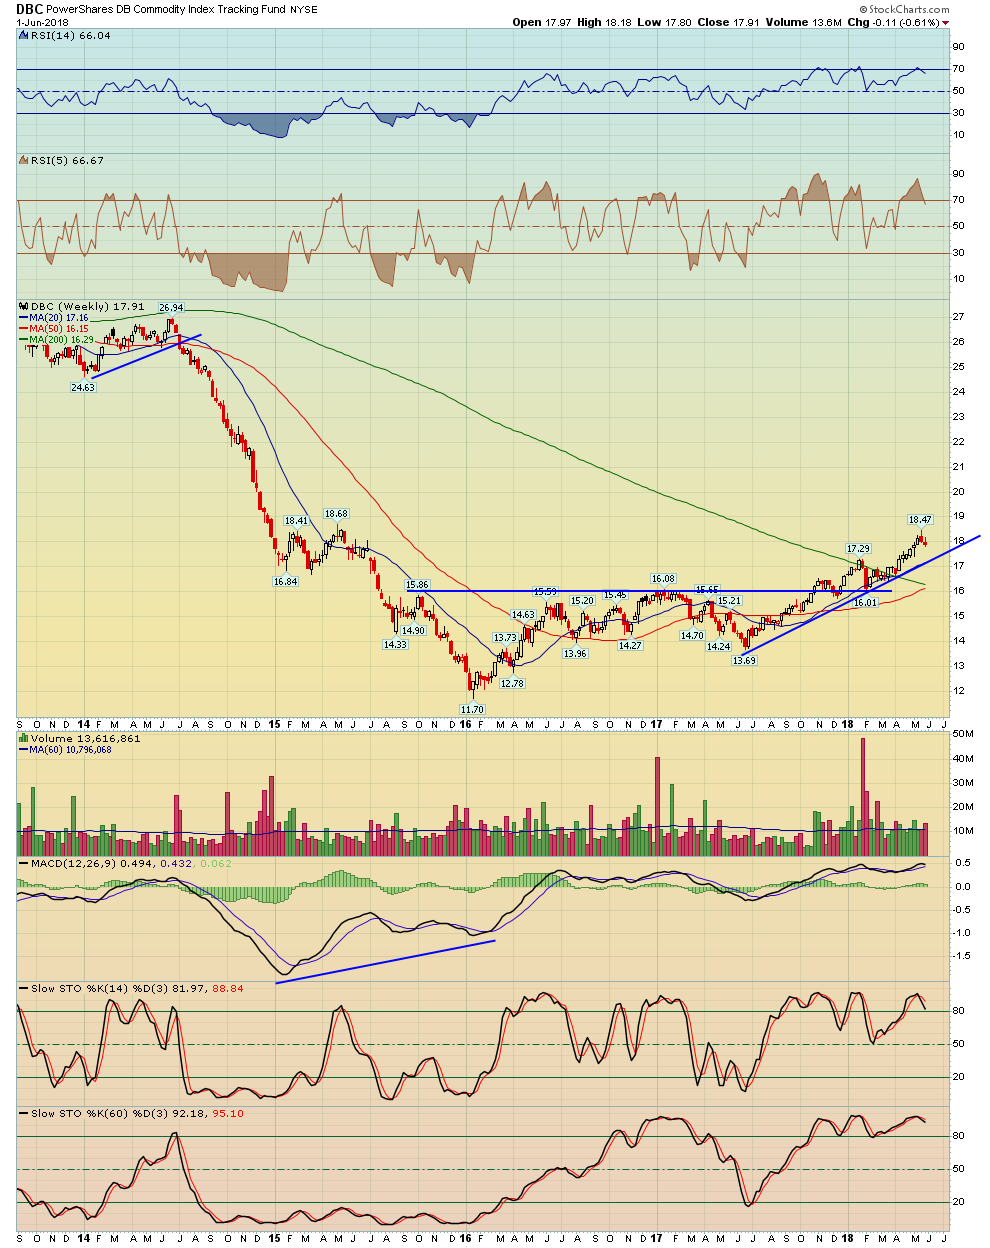
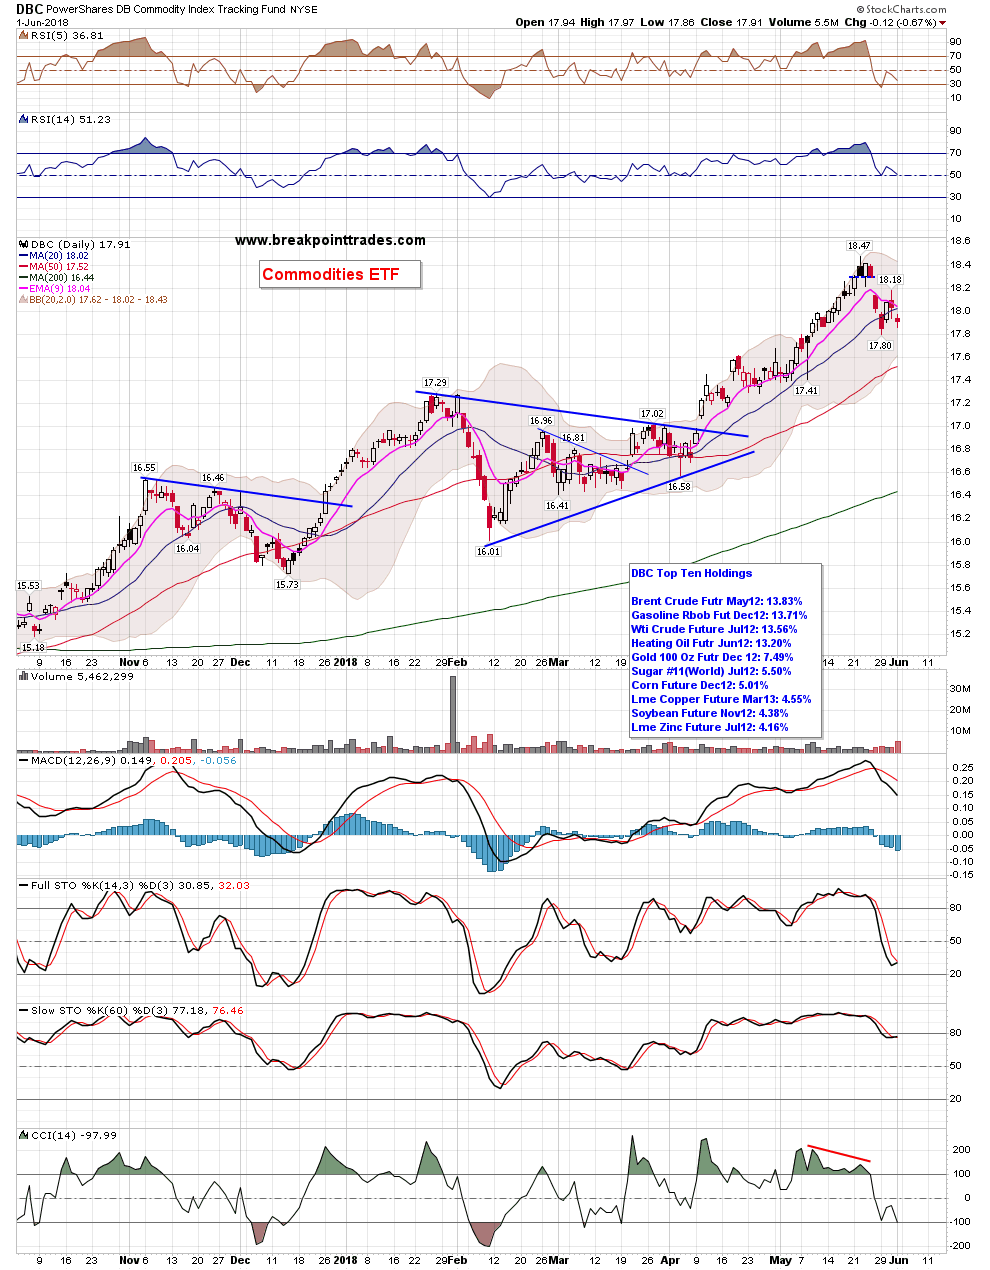
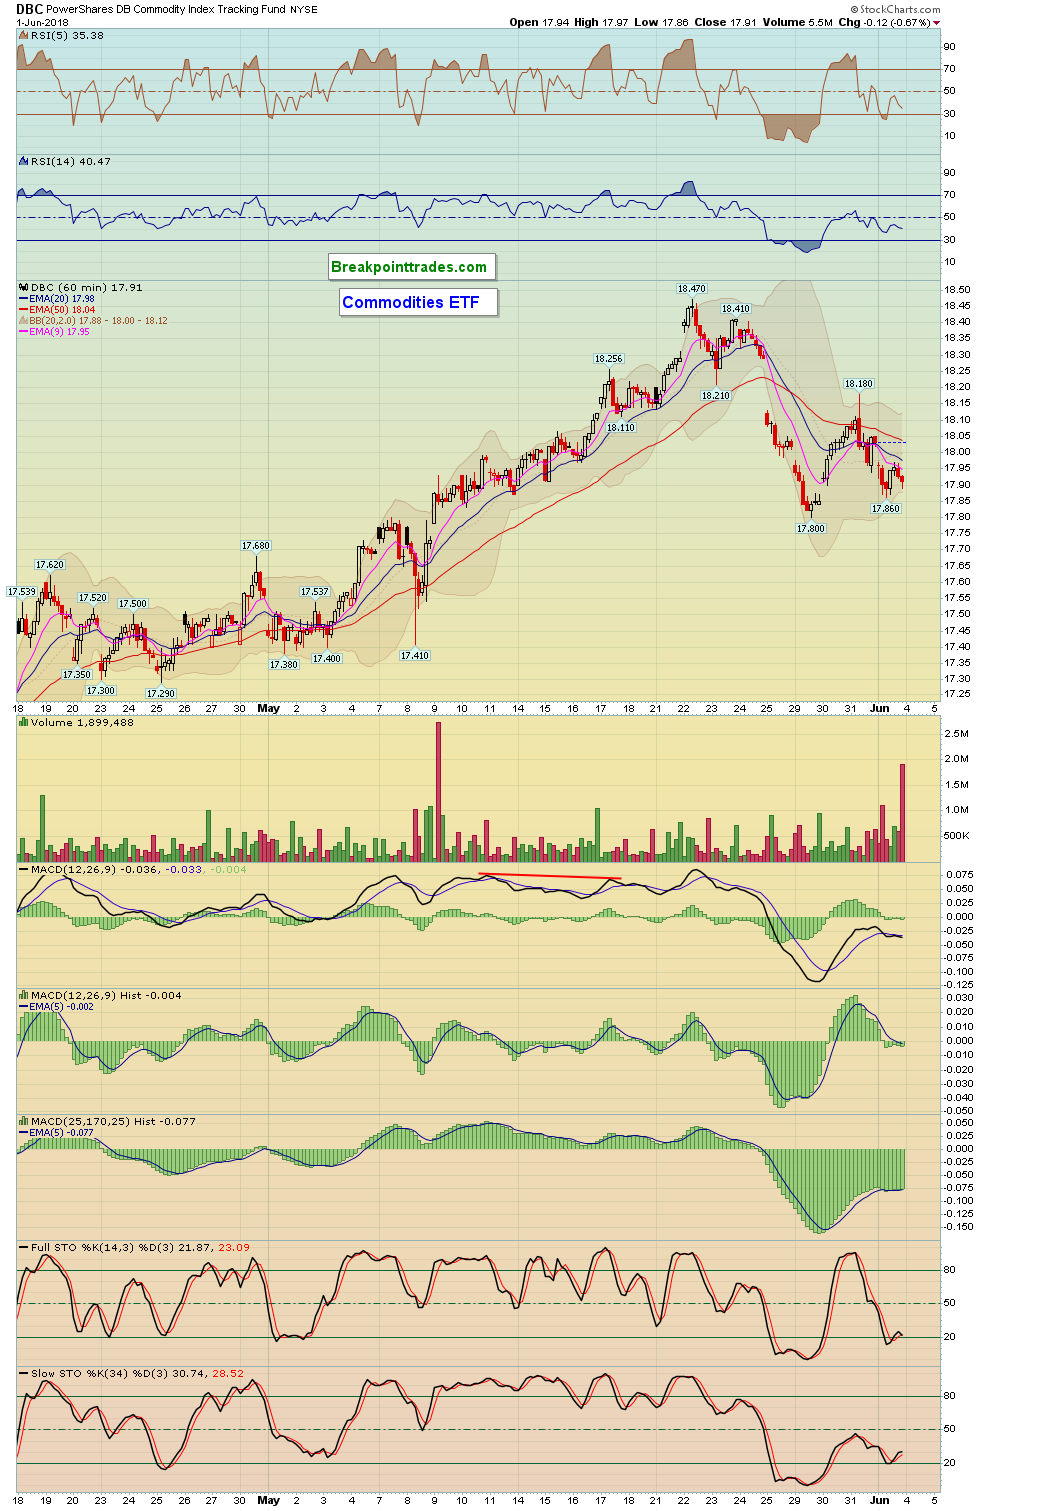
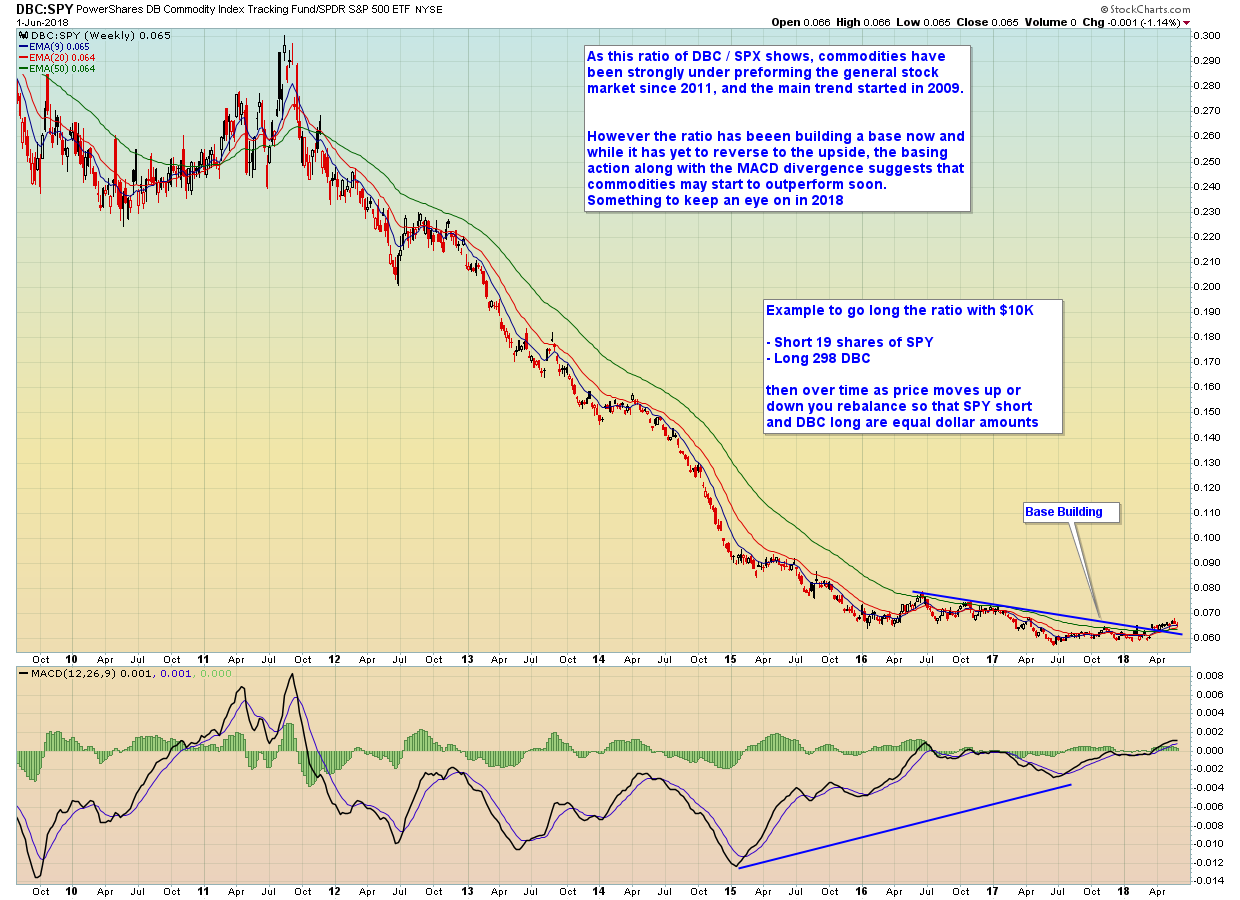
2. General Commodity Analysis/Overview (Minus Precious Metals)
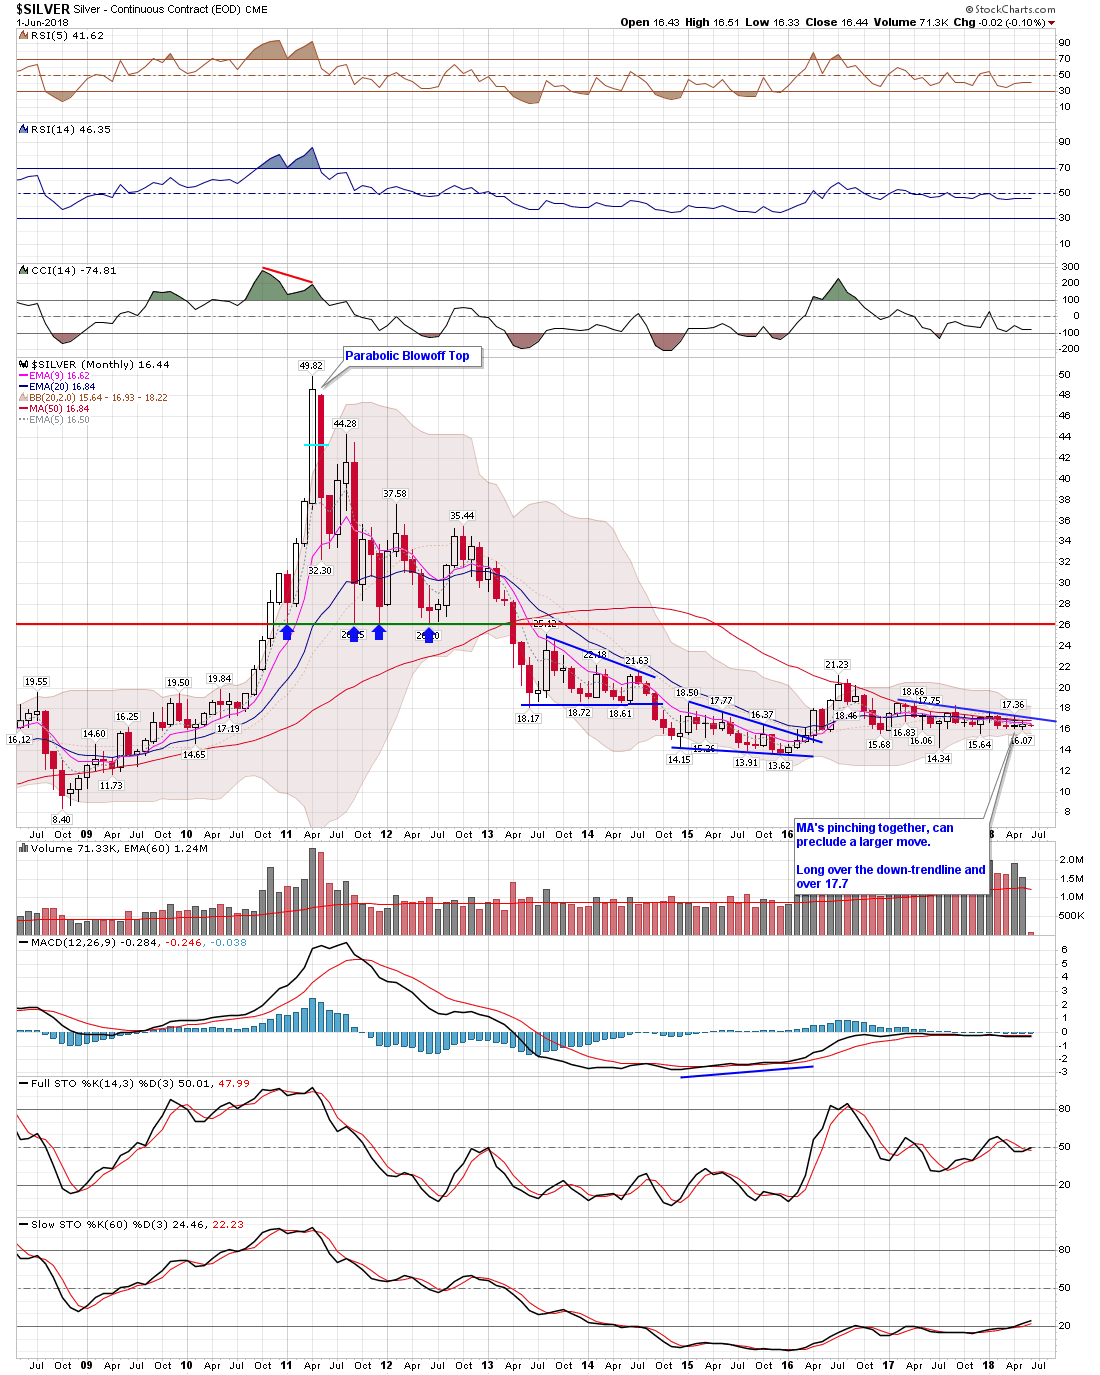
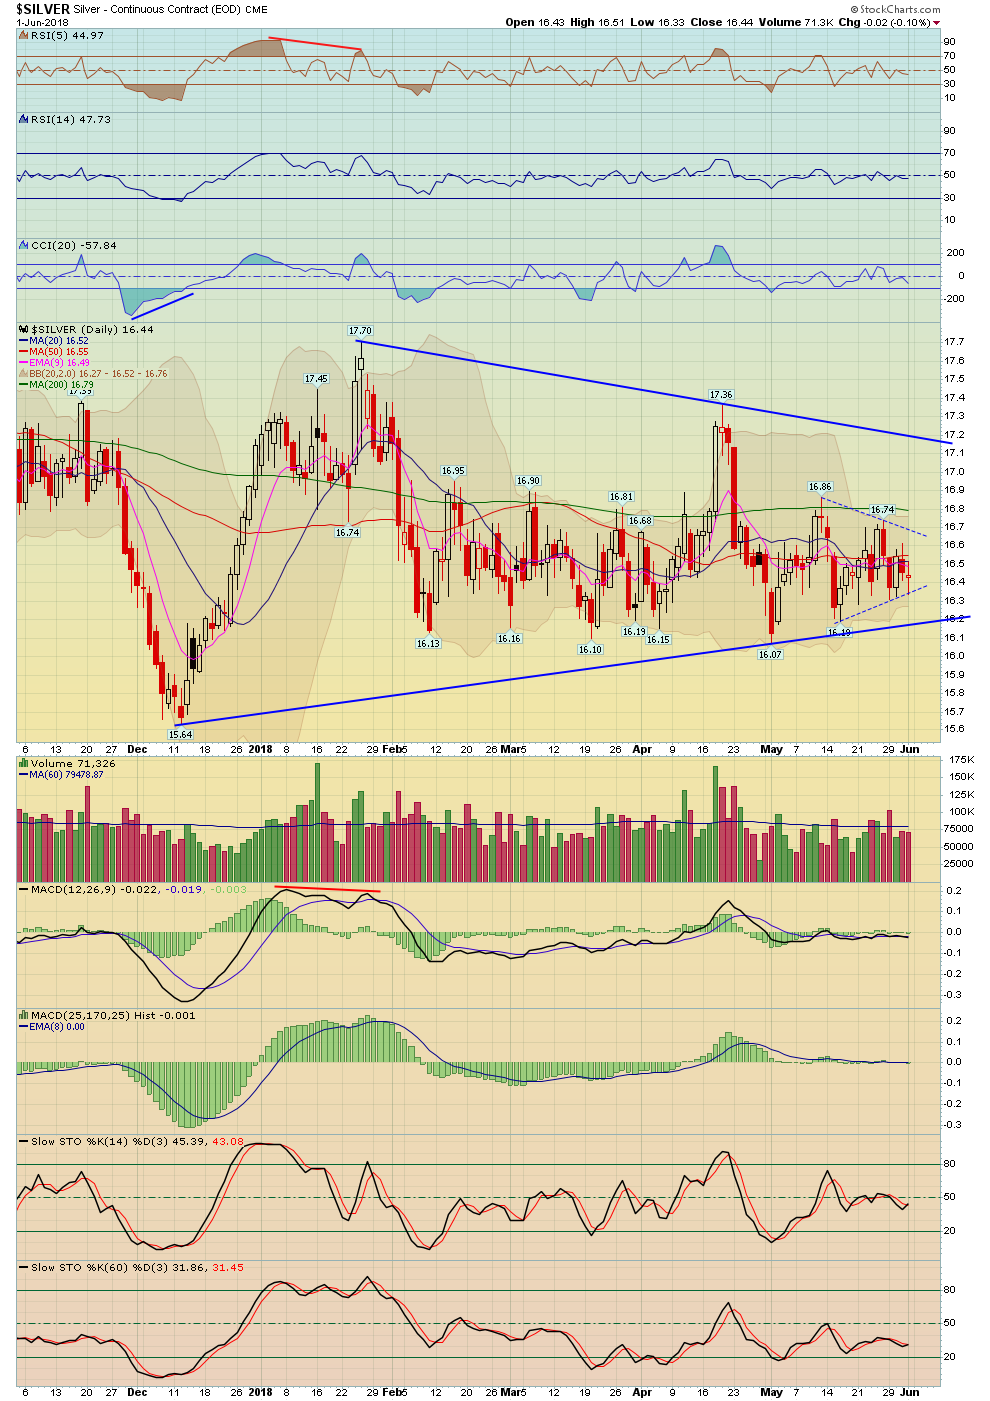
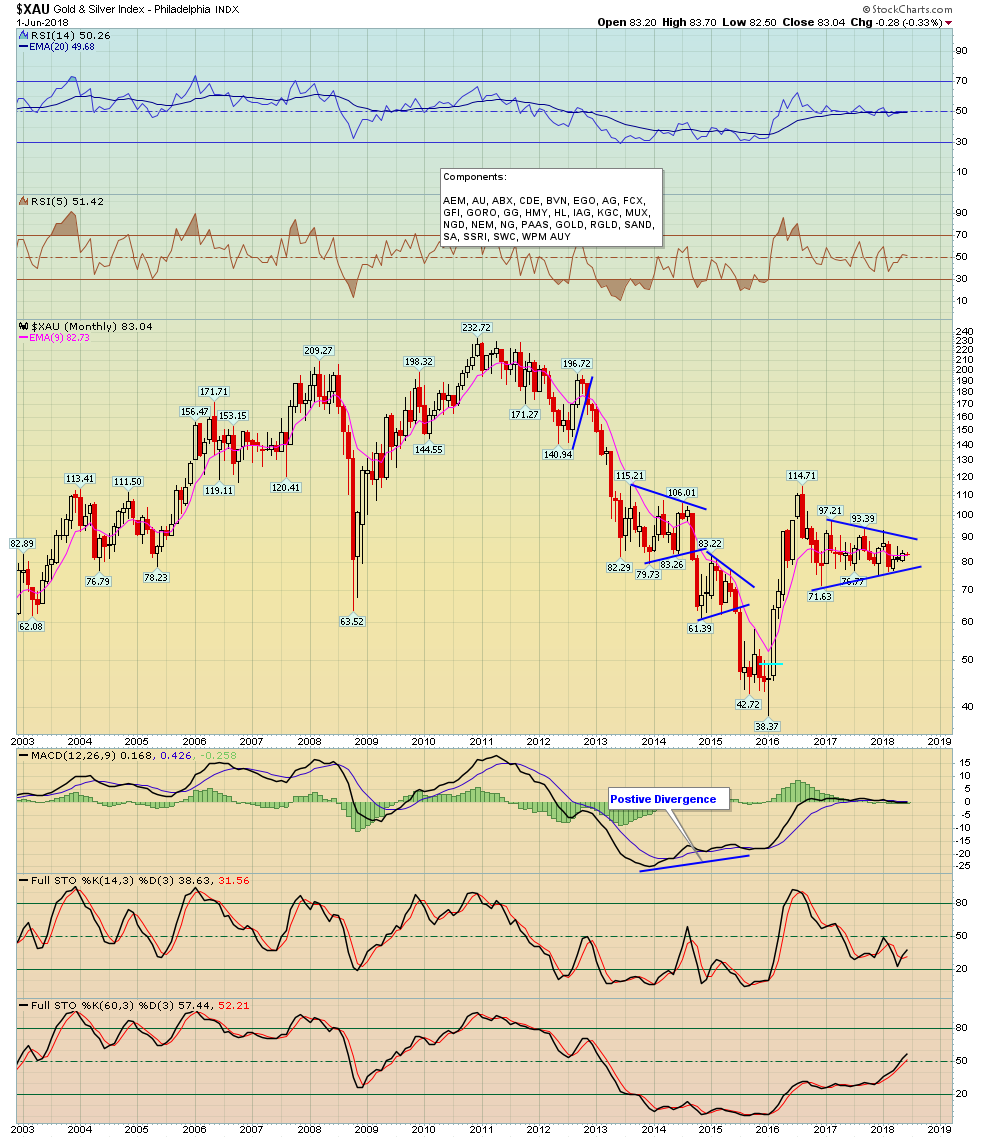
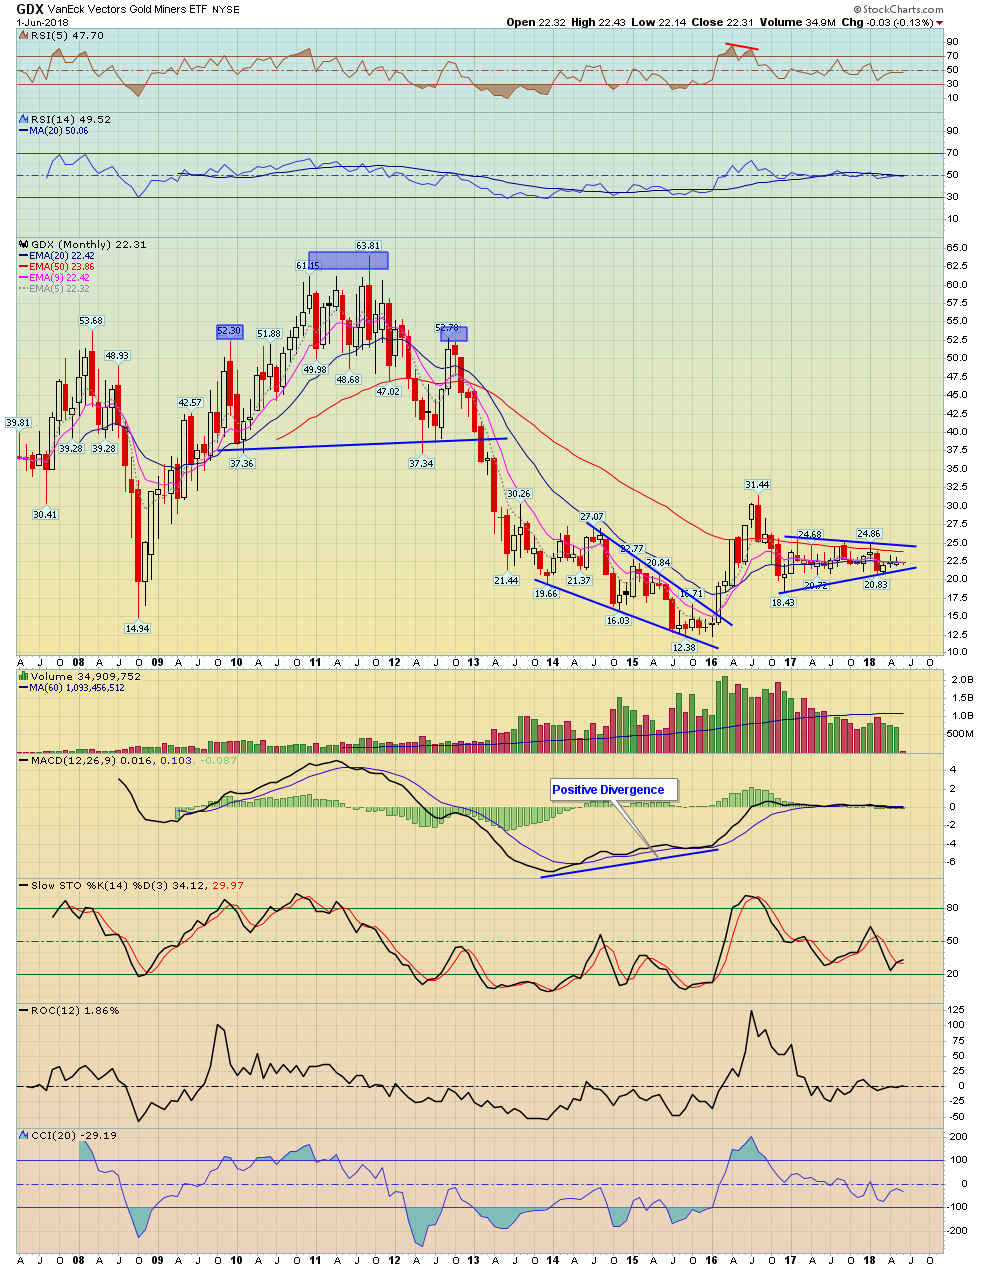
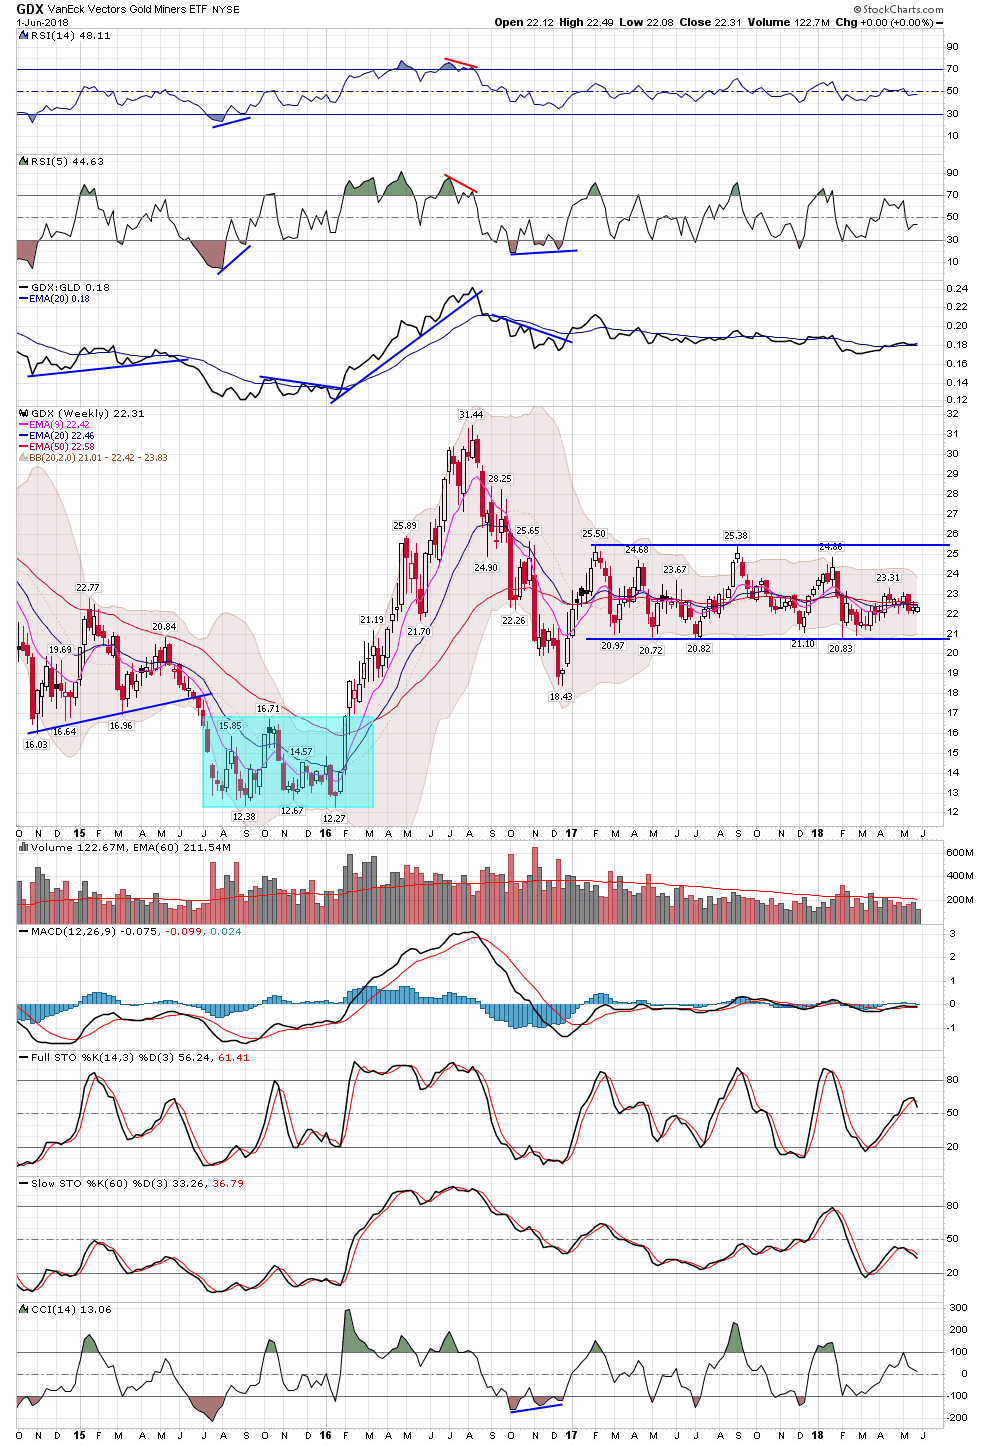
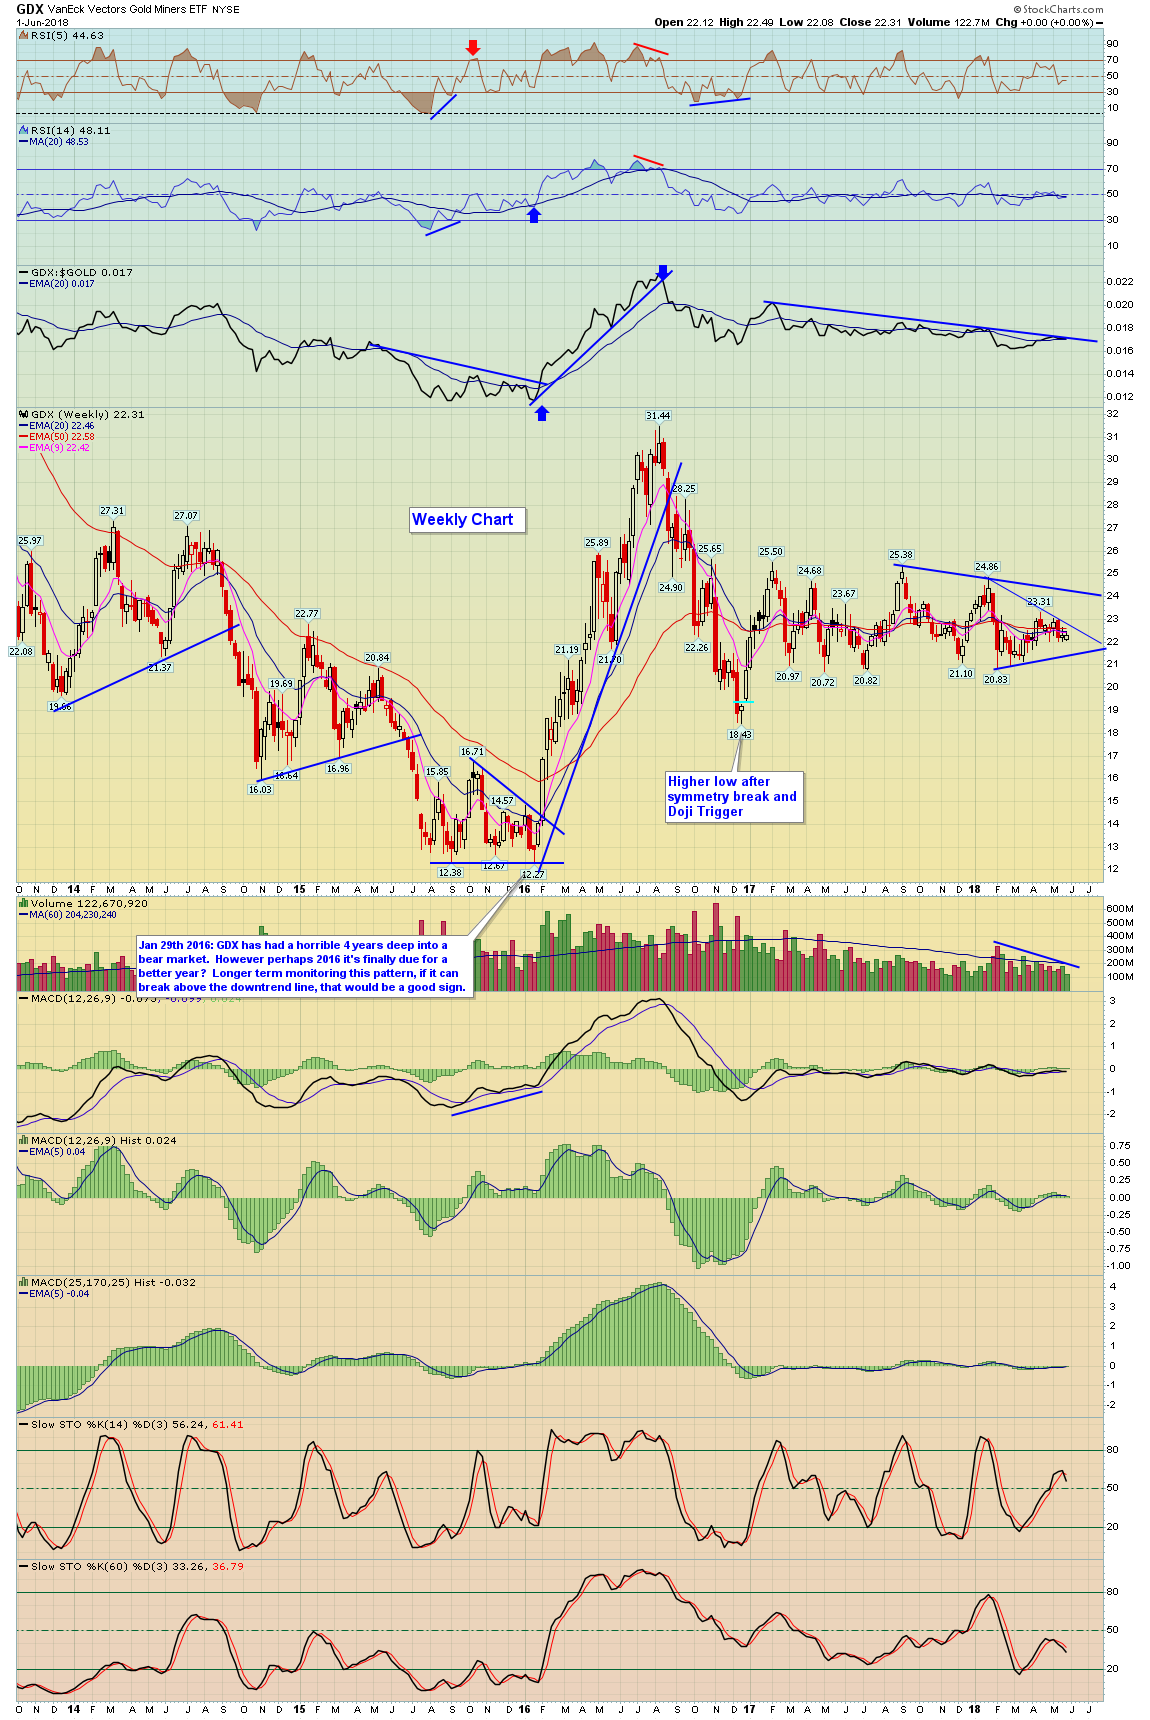
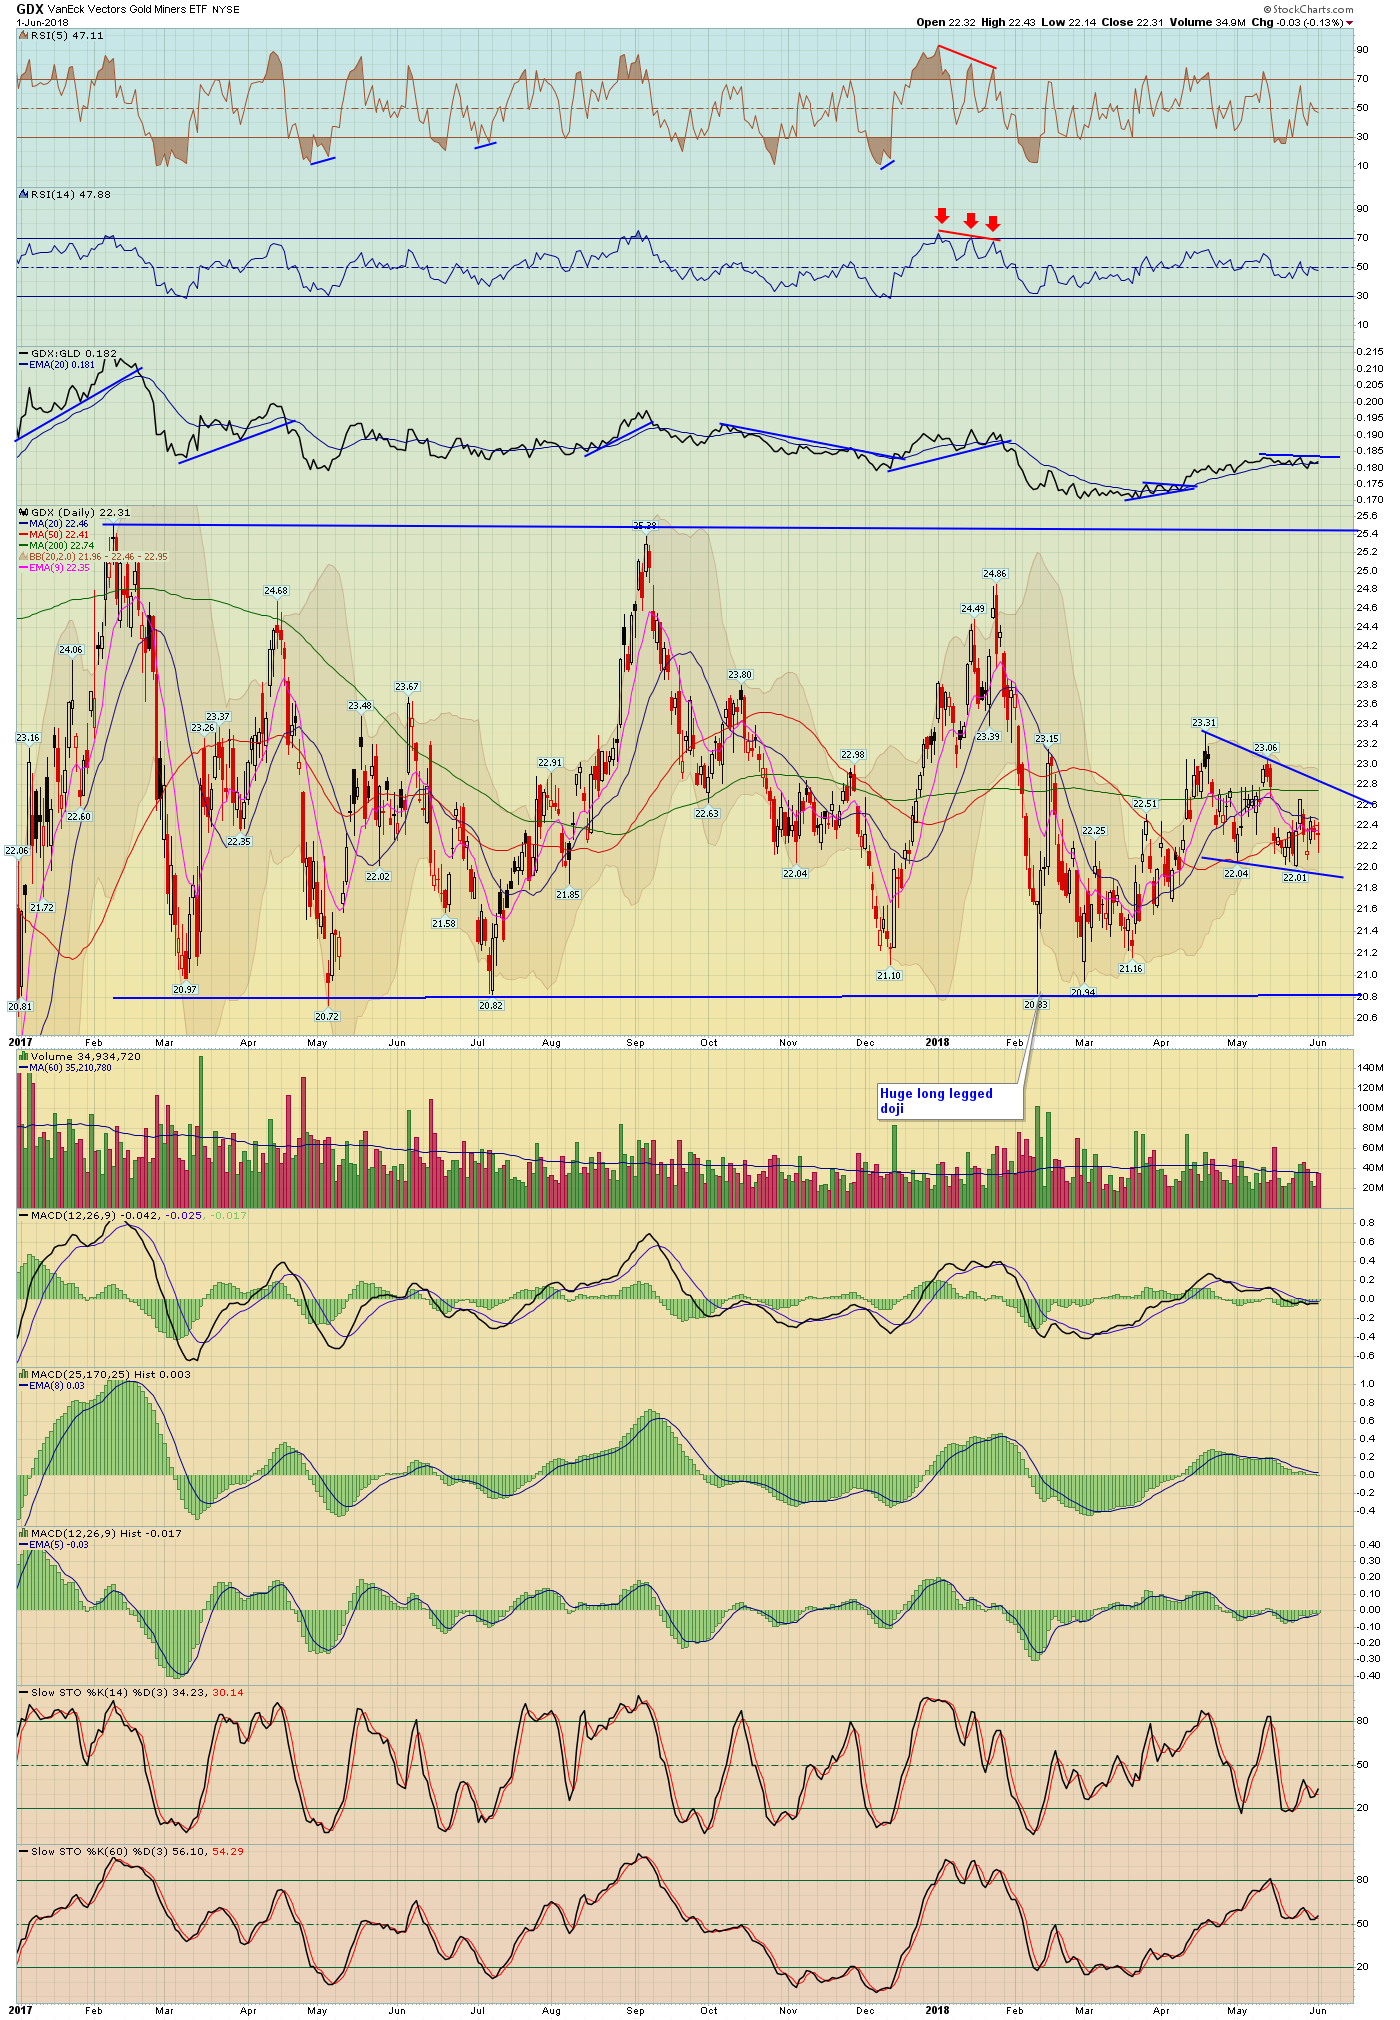
3. Precious Metals Analysis: Gold, Silver, GDX
2
| Major Indexes | Index Symbol | ETF Symbol | % G / L Day | % G / L Week | Close |
|---|---|---|---|---|---|
| Dow Jones | INDU - W | DIA - W | 0.90% | -0.48% | 24,635.21 |
| S&P 500 | SPX - W | SPY - W | 1.08% | 0.49% | 2,734.62 |
| Wilshire 5000 | WLSH - W | 0.99% | 0.58% | 28,498.62 | |
| Nasdaq | COMPQ - W | 1.51% | 1.62% | 7,554.33 | |
| NDX 100 | NDX - W | QQQ - W | 1.67% | 1.77% | 7,083.93 |
| Russel 2000 (Small Caps) | RUT - W | IWM - W | 0.88% | 1.29% | 1,647.98 |
| Market Sectors | Index Symbol | ETF Symbol | % G / L Day | % G / L Week | Close |
|---|---|---|---|---|---|
| Transports | TRAN - W | IYT - W | 1.34% | -0.06% | 10,893.97 |
| Banks | BKX - W | 1.46% | -1.32% | 107.49 | |
| Financials | XLF - W | 1.10% | -1.33% | 27.48 | |
| Brokers | XBD - W | 0.87% | -1.32% | 290.28 | |
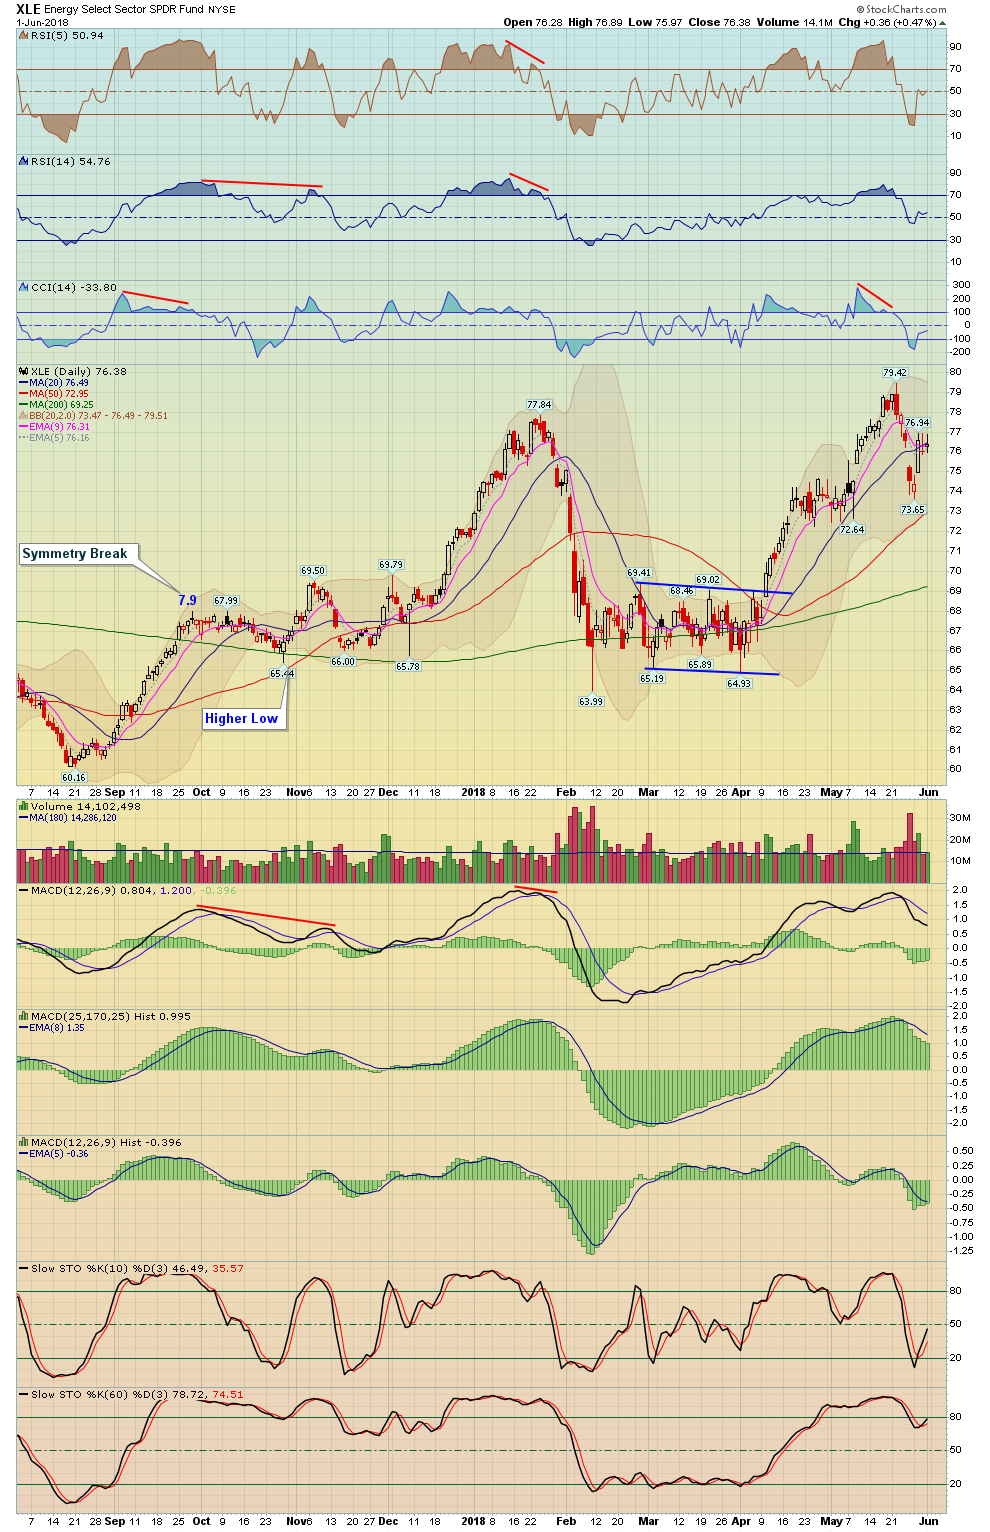
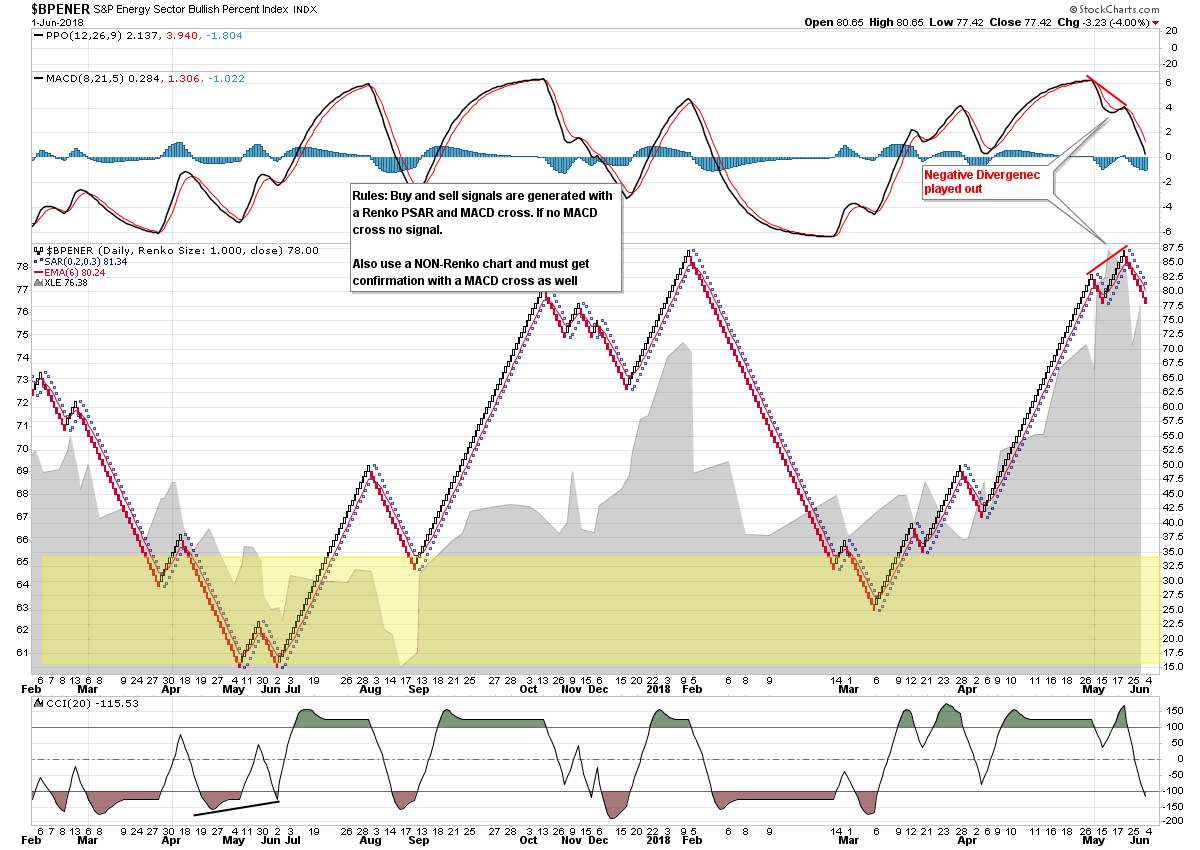
| XLE (Energy Select) | XLE - W | 0.47% | 2.41% | 76.38 | |
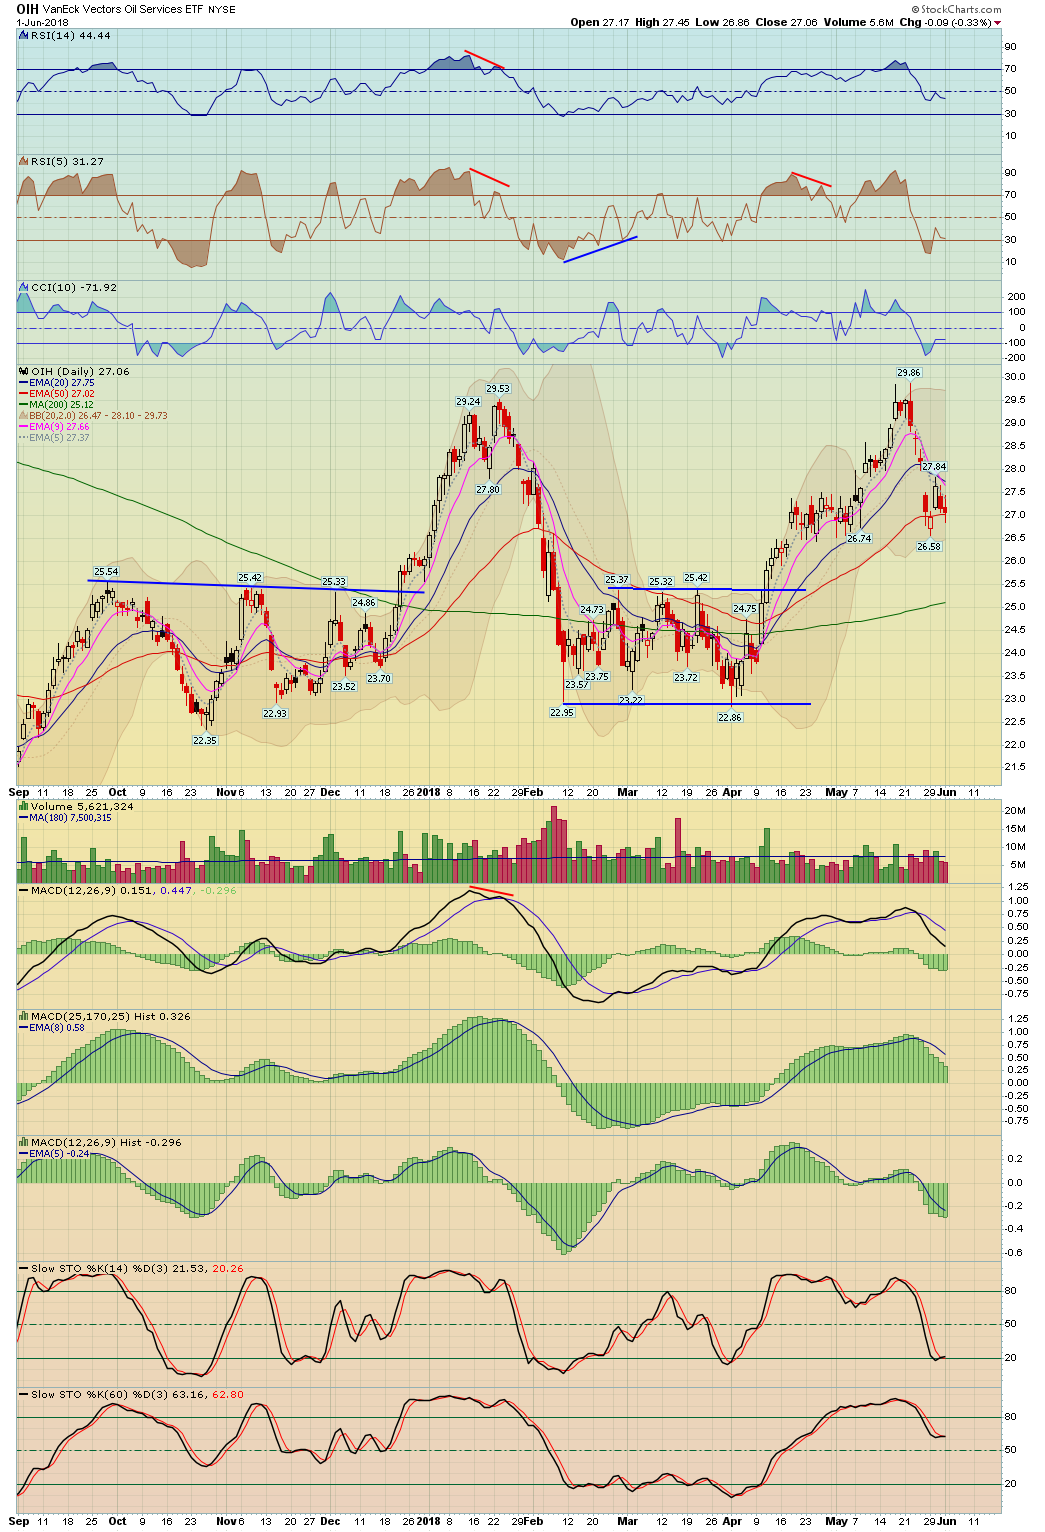
| Oil Service Holders | OIH - W | -0.33% | -0.15% | 27.06 | |
| Technology | XLK - W | 1.70% | 1.92% | 71.09 | |
| Semiconductor | SOX - W | SMH - W | 2.34% | 1.47% | 1,411.31 |
| Retail | XRT - W | 0.54% | -0.09% | 46.62 | |
| Consumer Staples | XLP - W | 0.00% | -0.44% | 49.66 | |
| Consumer Discretionary | XLY - W | 0.74% | 0.39% | 106.54 | |
| Industrials | XLI - W | 1.10% | -0.57% | 75.26 | |
| Telecom | IYZ - W | 1.15% | 0.18% | 27.28 | |
| Real Estate | IYR - W | 0.35% | 1.74% | 78.46 | |
| Homebuilders | HGX - W | XHB - W | 0.55% | -0.62% | 308.56 |
| Materials | XLB - W | 1.53% | 0.10% | 59.07 | |
| Metals And Mining | XME - W | 0.88% | 2.74% | 37.84 | |
| GDX Gold Miners ETF | GDX - W | -0.13% | 0.00% | 22.31 | |
| Biotechnology | BTK - W | XBI - W | 1.54% | 3.03% | 4,821.79 |
| Healthcare | XLV - W | 1.15% | 0.51% | 83.36 | |
| Drugs | DRG - W | 0.85% | 0.35% | 528.71 | |
| Utilities | UTIL - W | XLU - W | -1.51% | -0.71% | 684.74 |
| Currencies | Index Symbol | ETF Symbol | % G / L Day | % G / L Week | Close |
|---|---|---|---|---|---|
| US Dollar | UUP - W | 0.16% | 0.00% | 24.80 | |
| Euro | XEU - W | FXE - W | -0.24% | 0.09% | 116.66 |
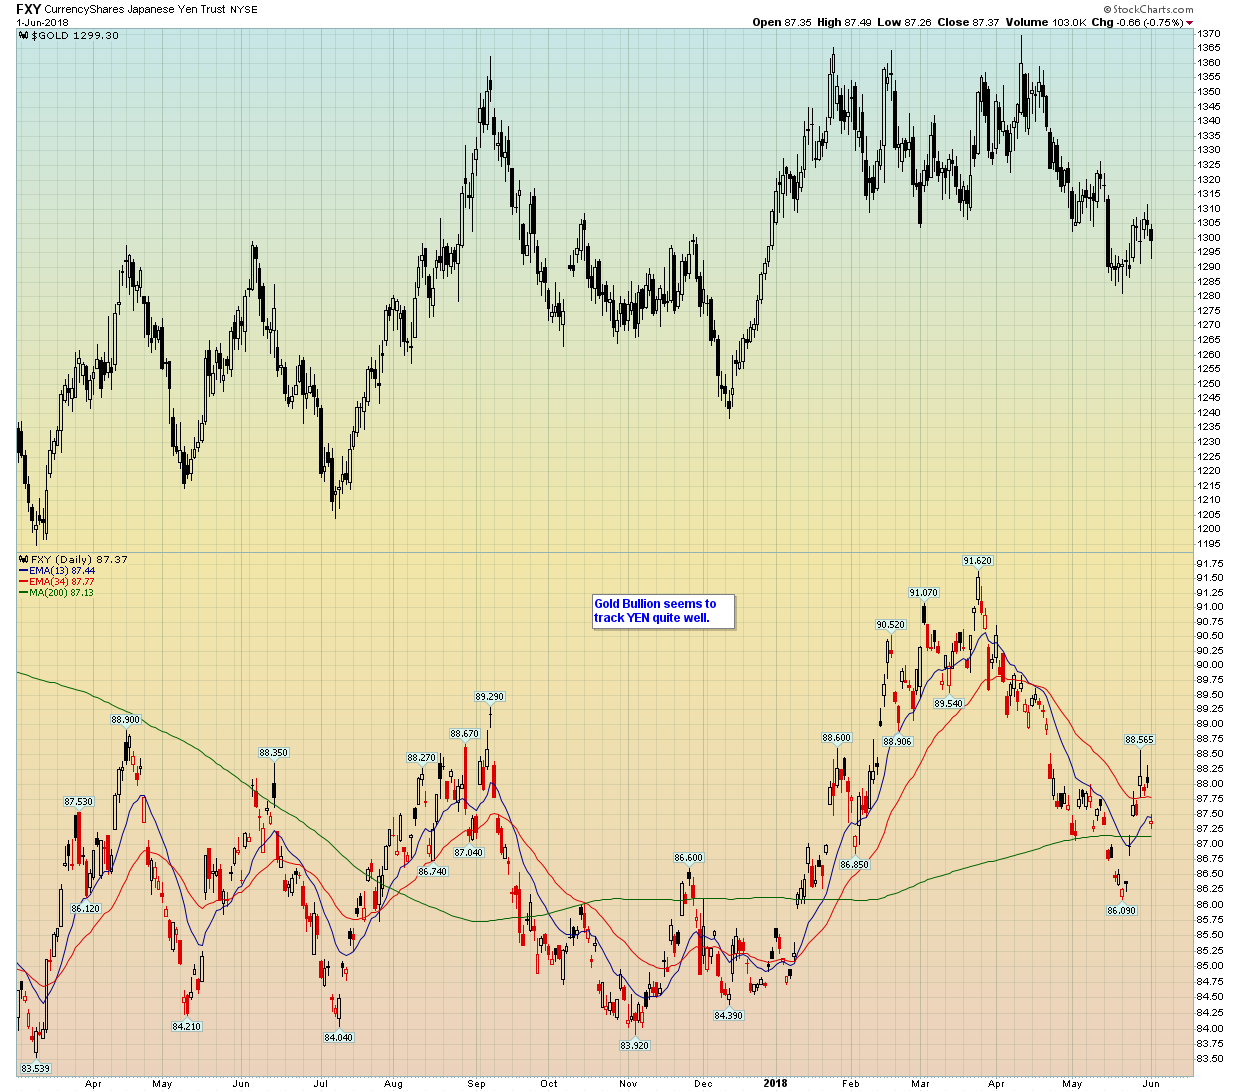
| Yen | XJY - W | FXY - W | -0.66% | -0.09% | 91.29 |
| Australian | XAD - W | FXA - W | 0.03% | 0.19% | 75.69 |
| British Pound | XBP - W | FXB - W | 0.43% | 0.30% | 133.49 |
| South African Rand | ZAR - W | 0.38% | -1.38% | 0.08 | |
| Canadian Dollar | CDW - W | FXC - W | -0.02% | 0.03% | 77.16 |
| Swiss Franc | XSF - W | FXF - W | -0.23% | 0.19% | 101.21 |
| Commodities | Index Symbol | ETF Symbol | % G / L Day | % G / L Week | Close |
|---|---|---|---|---|---|
| CRB Commodities (17 Components) | CRB - W | DBC - W | -0.56% | -0.80% | 201.71 |
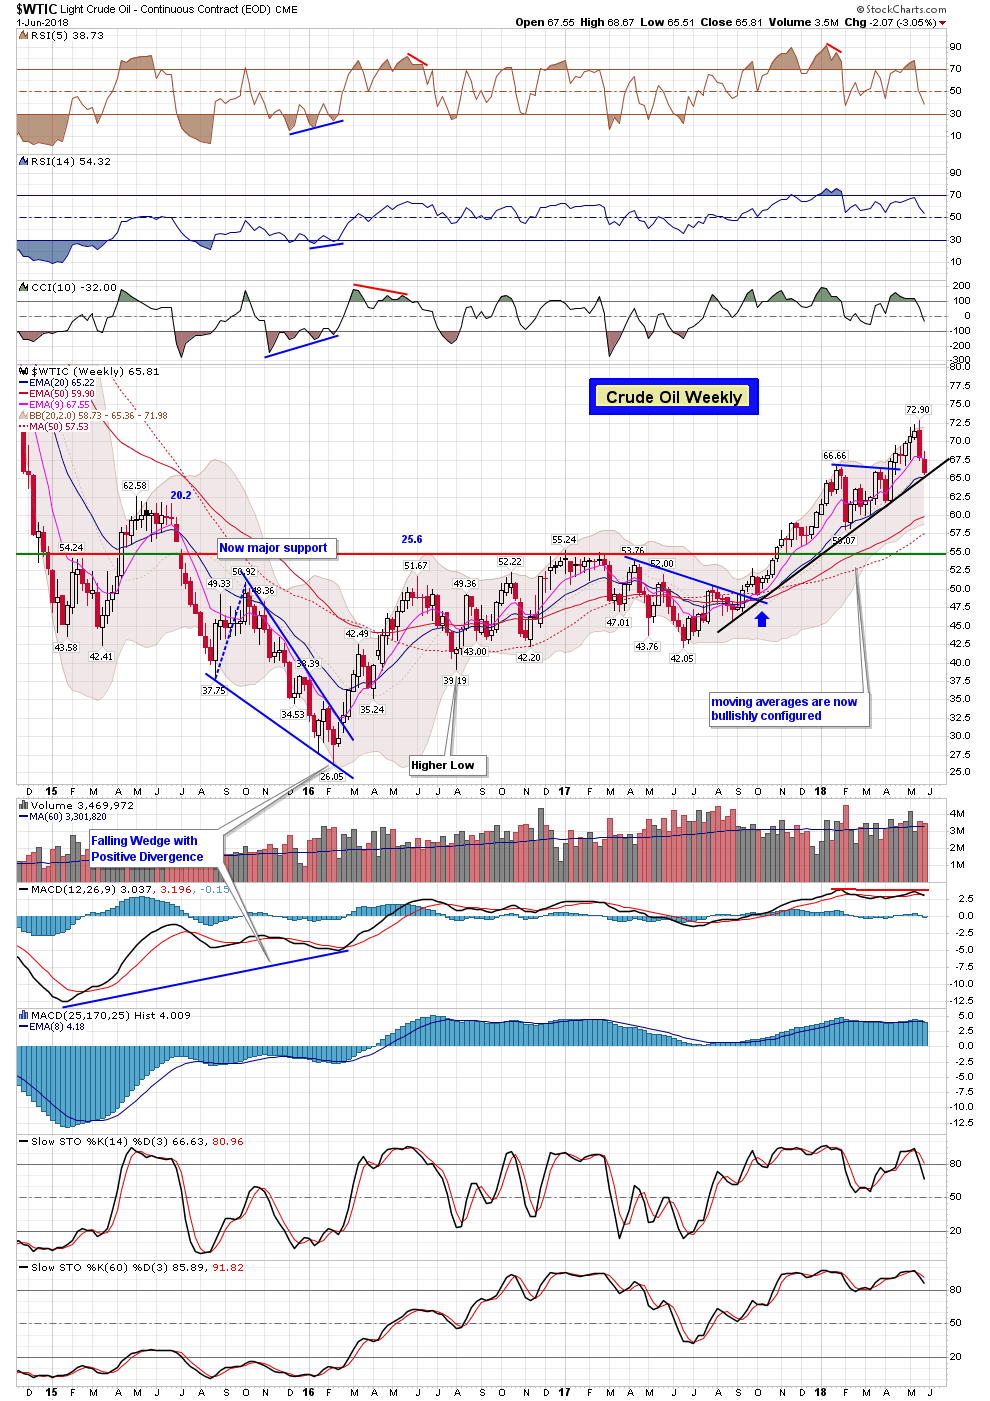
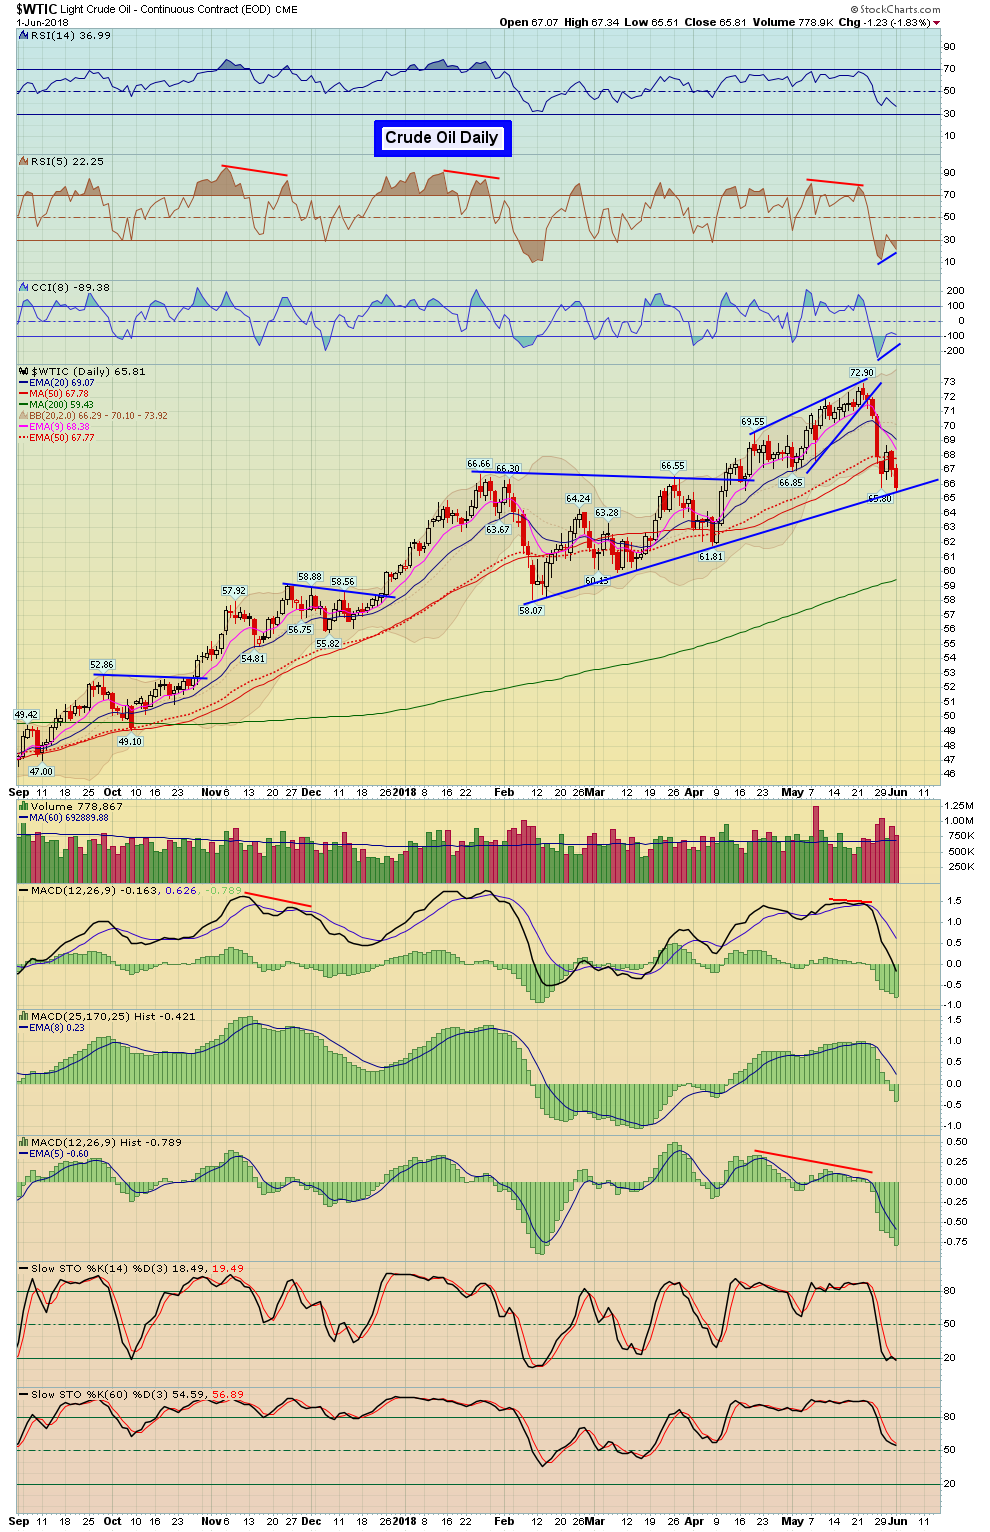
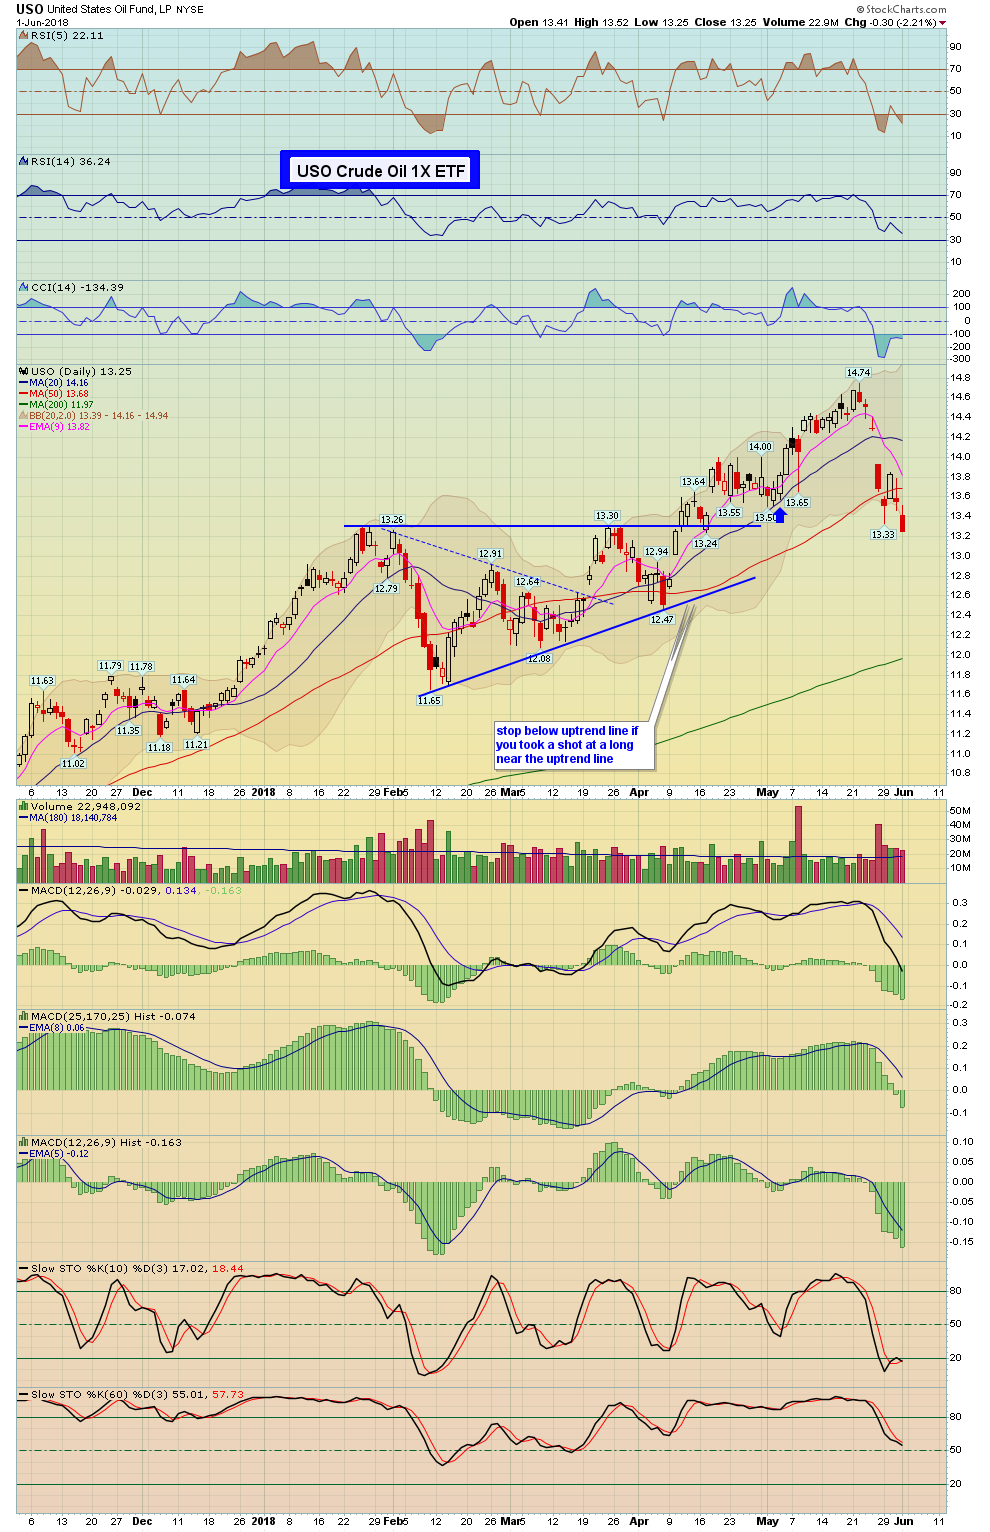
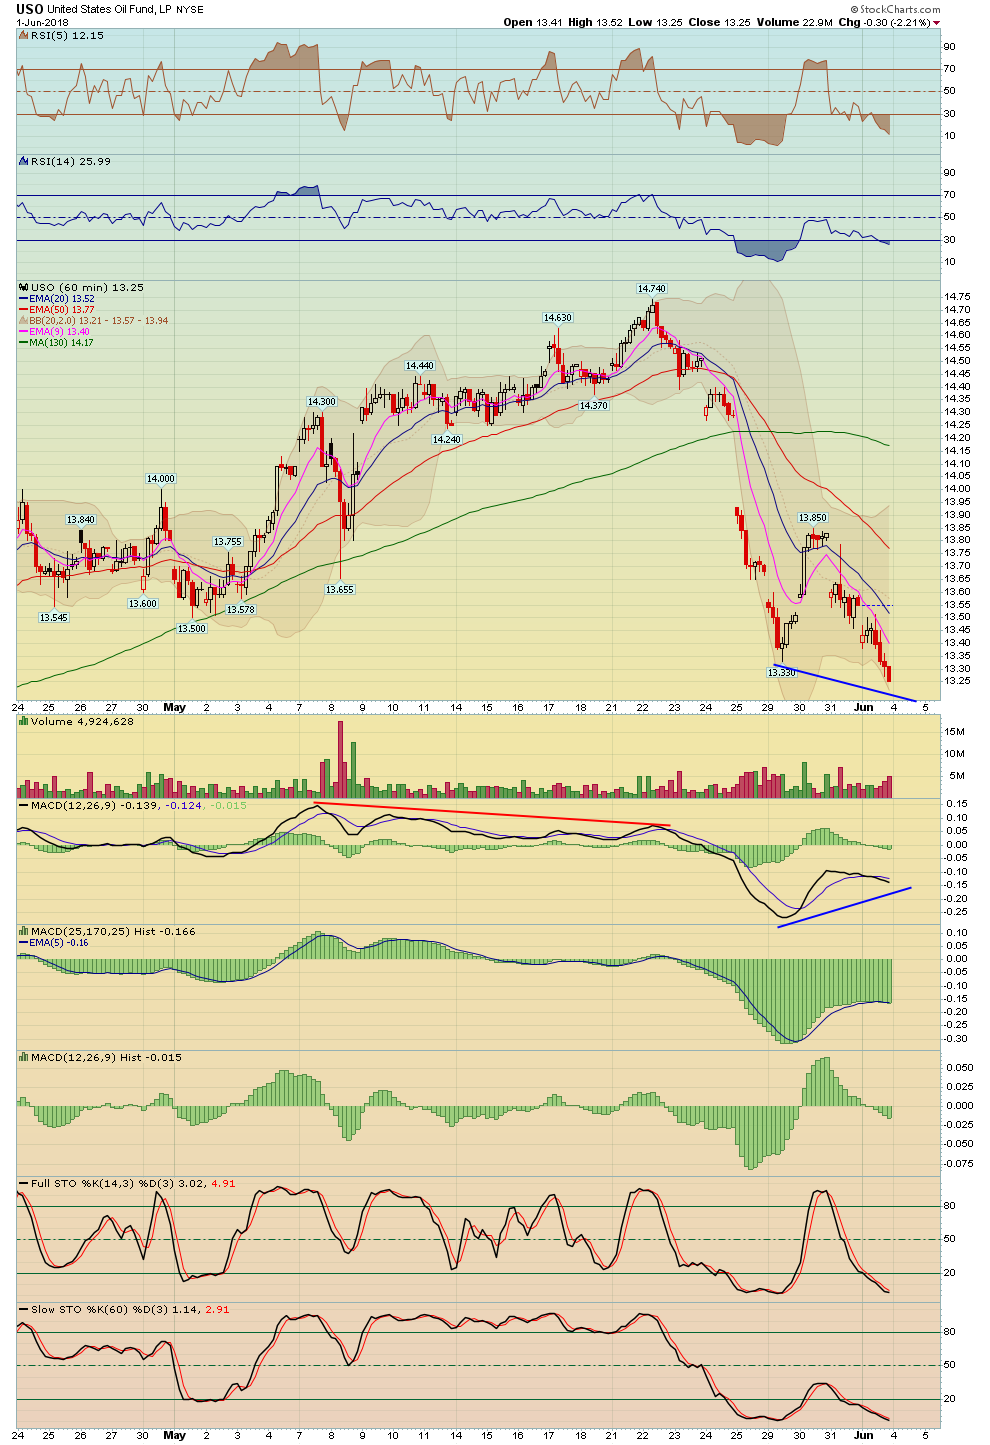
| Crude Oil | WTIC - W | USO - W | -1.83% | -3.05% | 65.81 |
| Gasoline | GASO - W | -0.79% | -1.42% | 2.14 | |
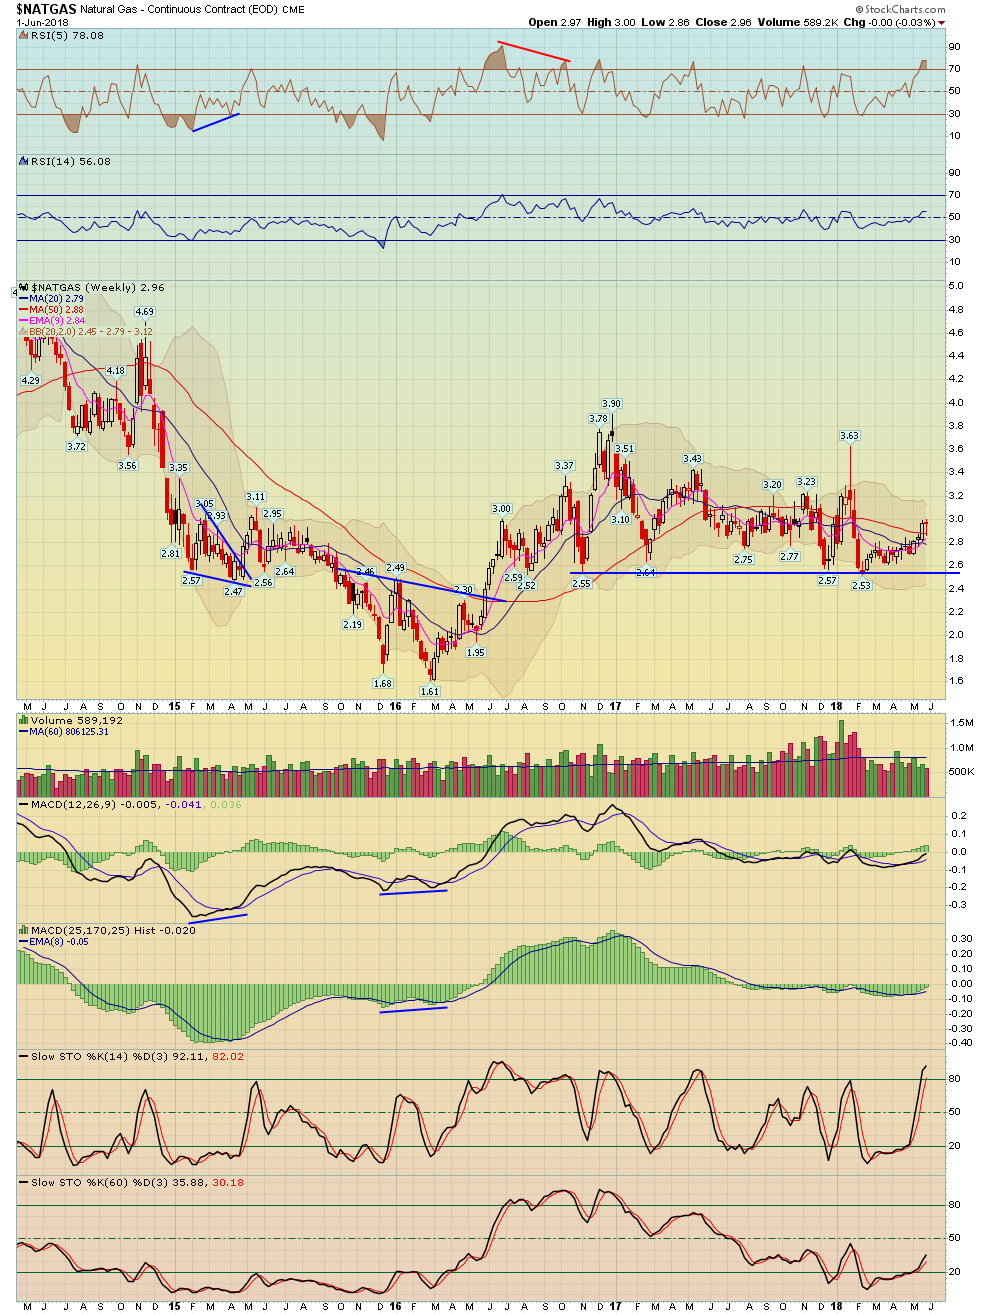
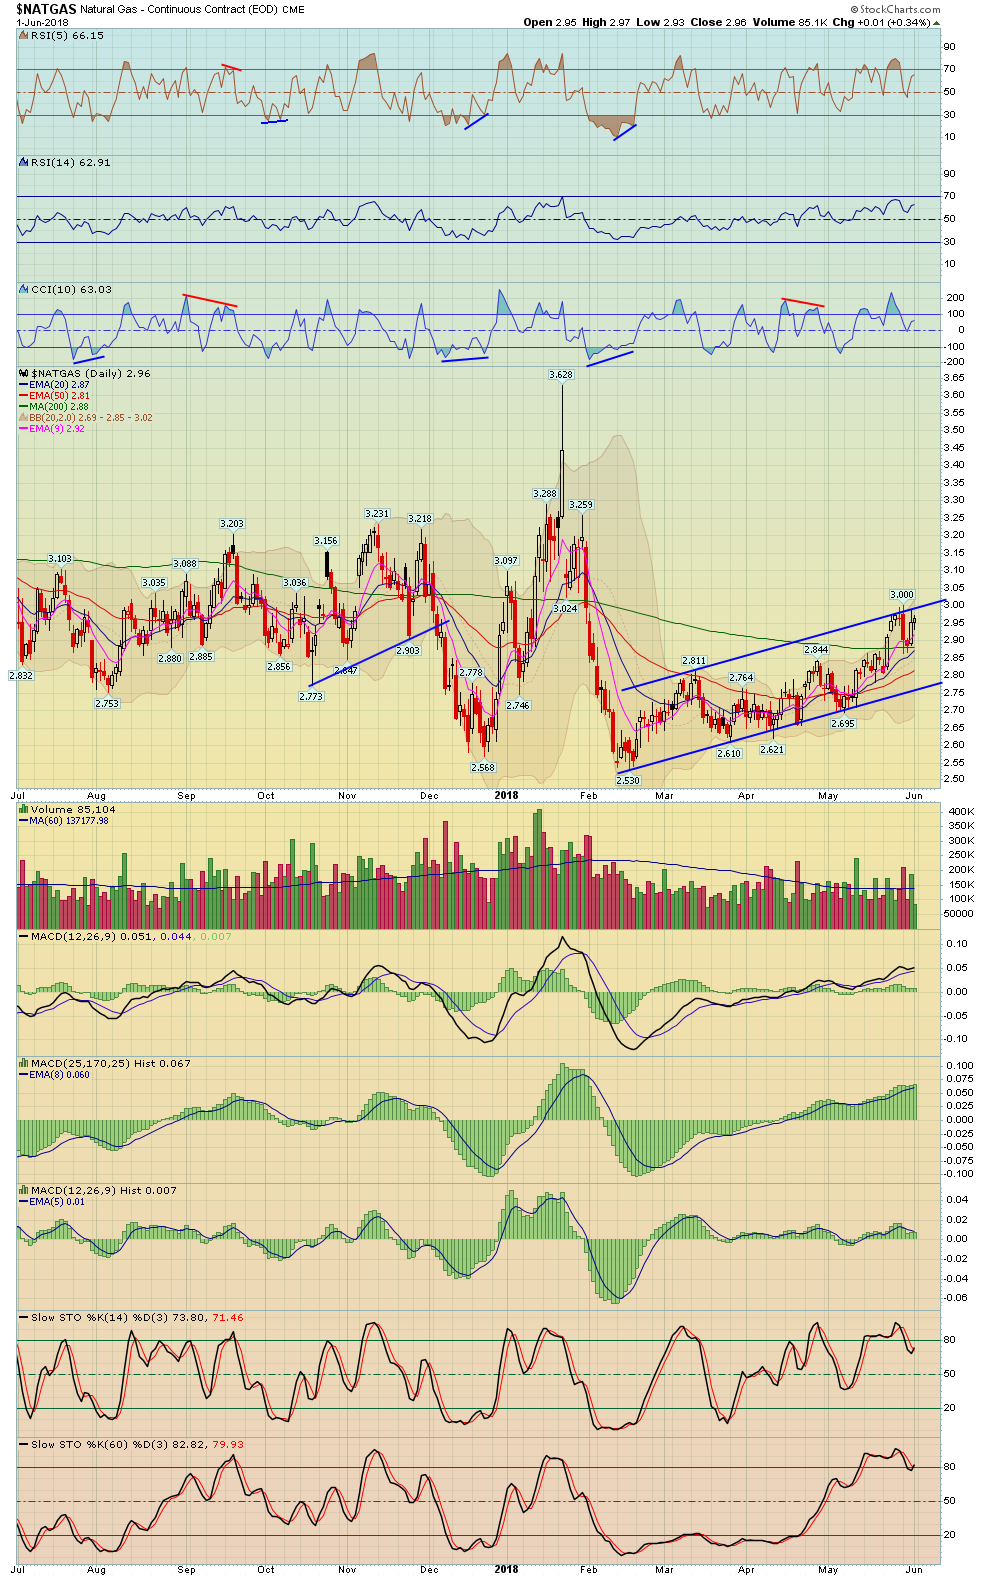
| Natural Gas | NATGAS - W | UNG - W | 0.34% | -0.03% | 2.96 |
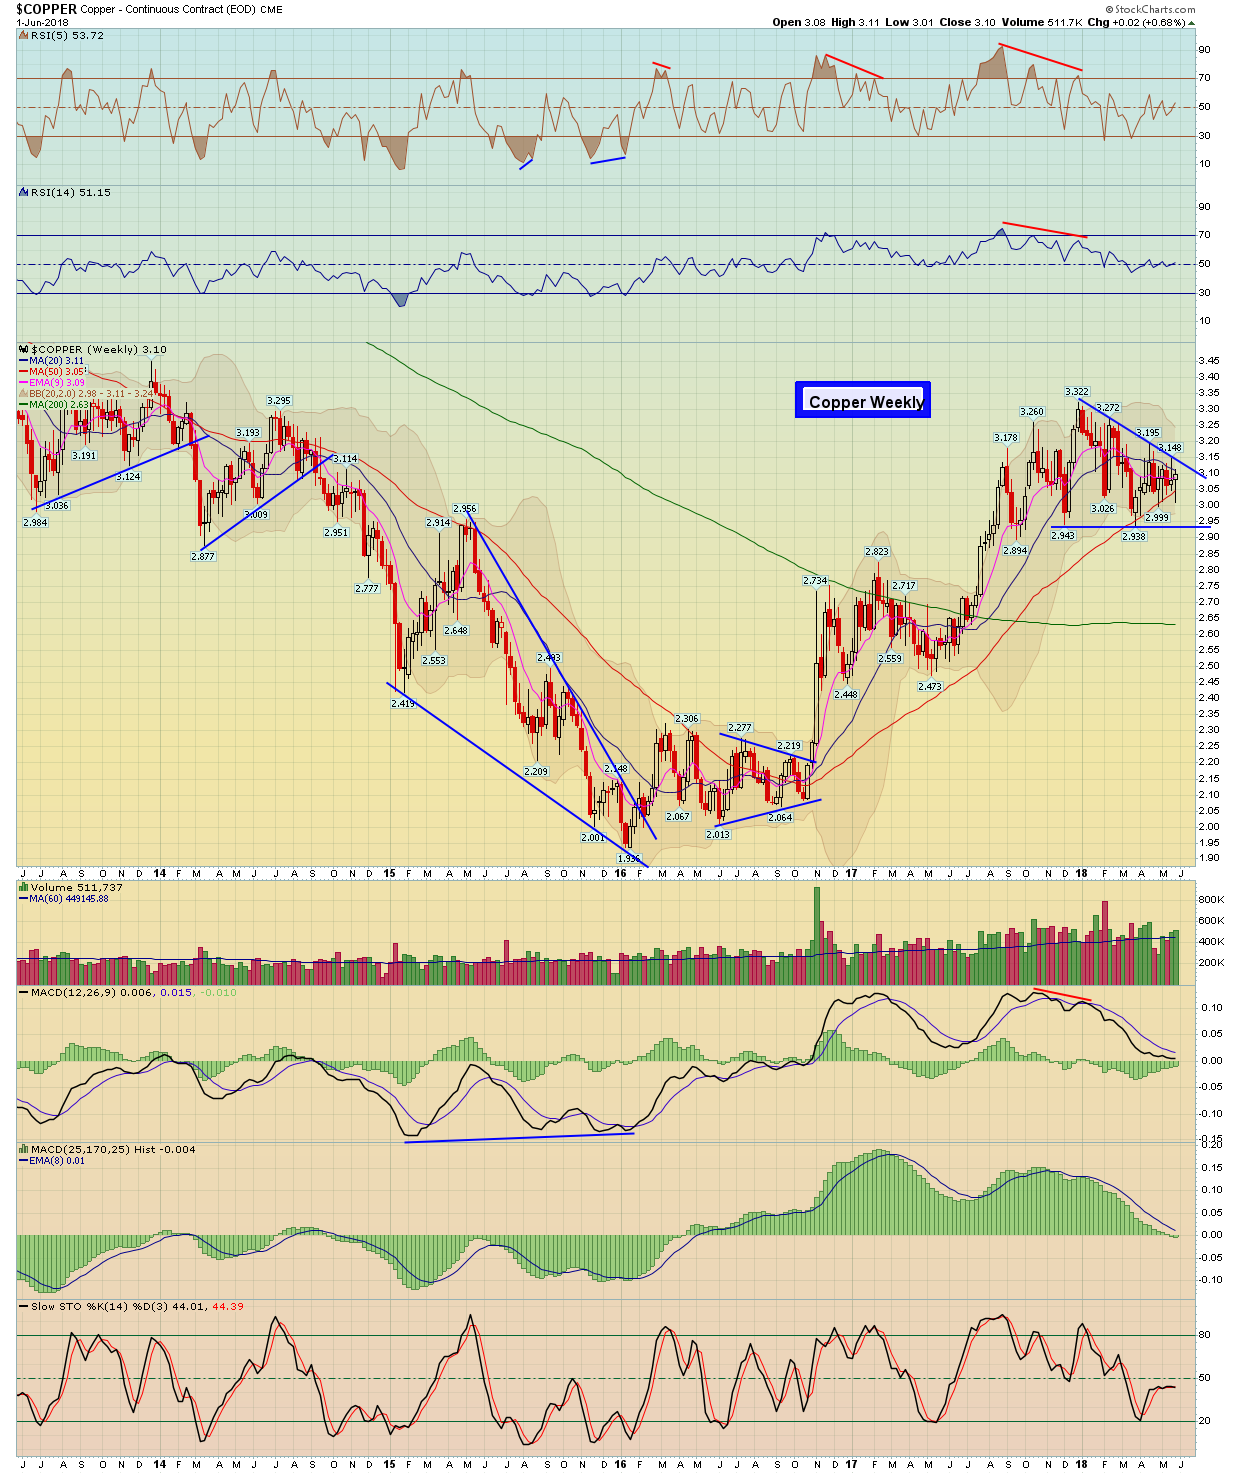
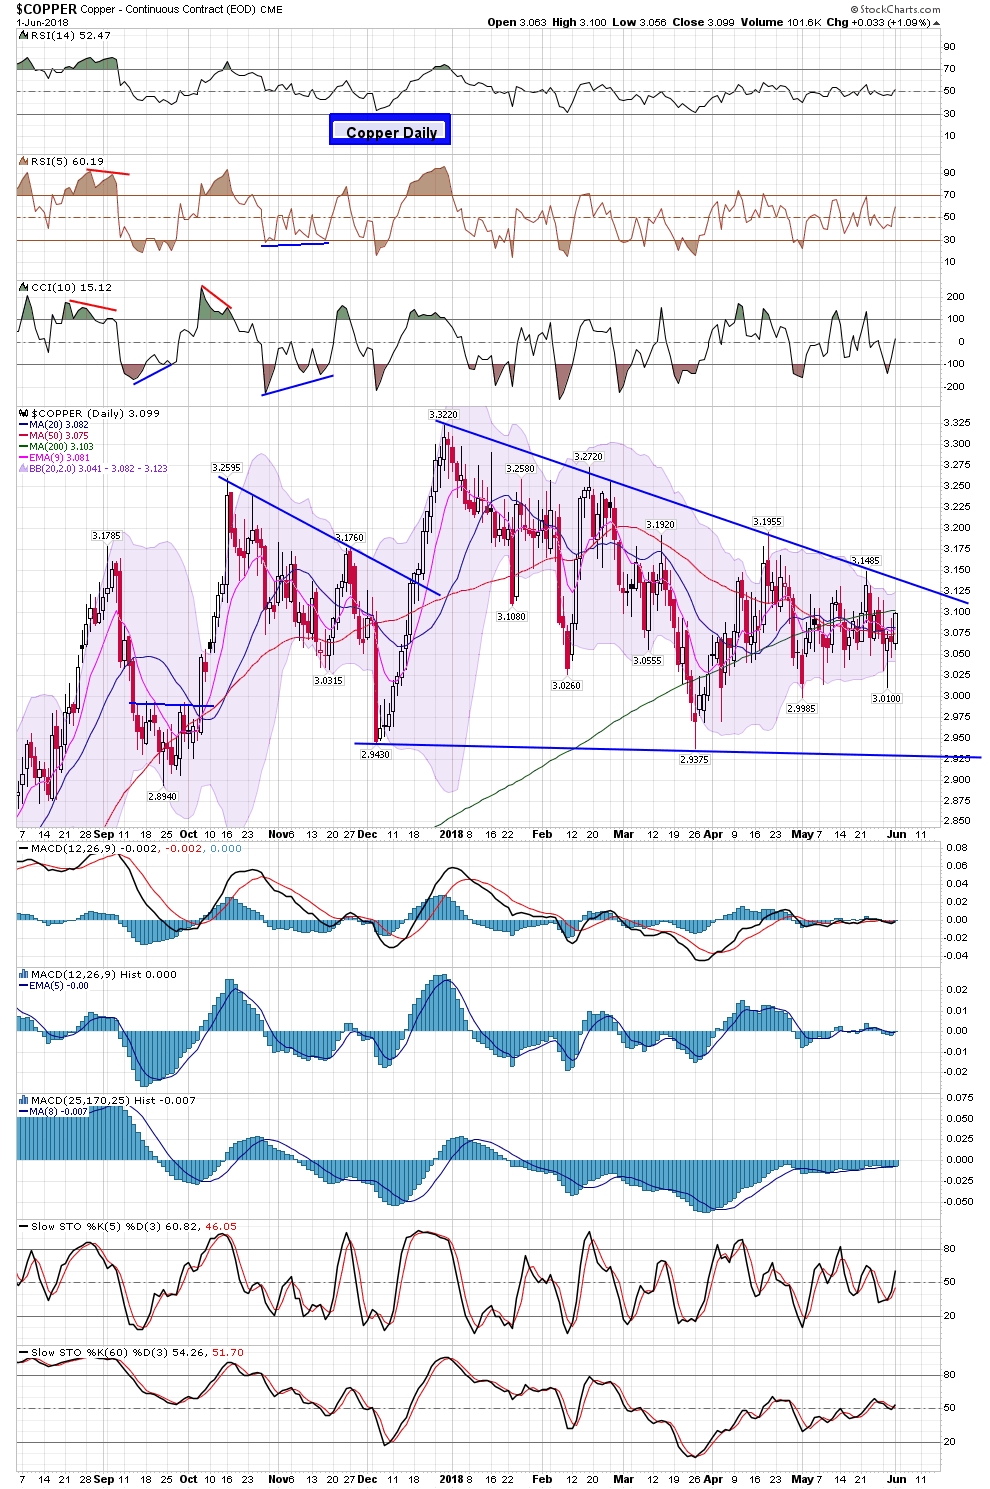
| Copper | COPPER - W | 1.09% | 0.68% | 3.10 | |
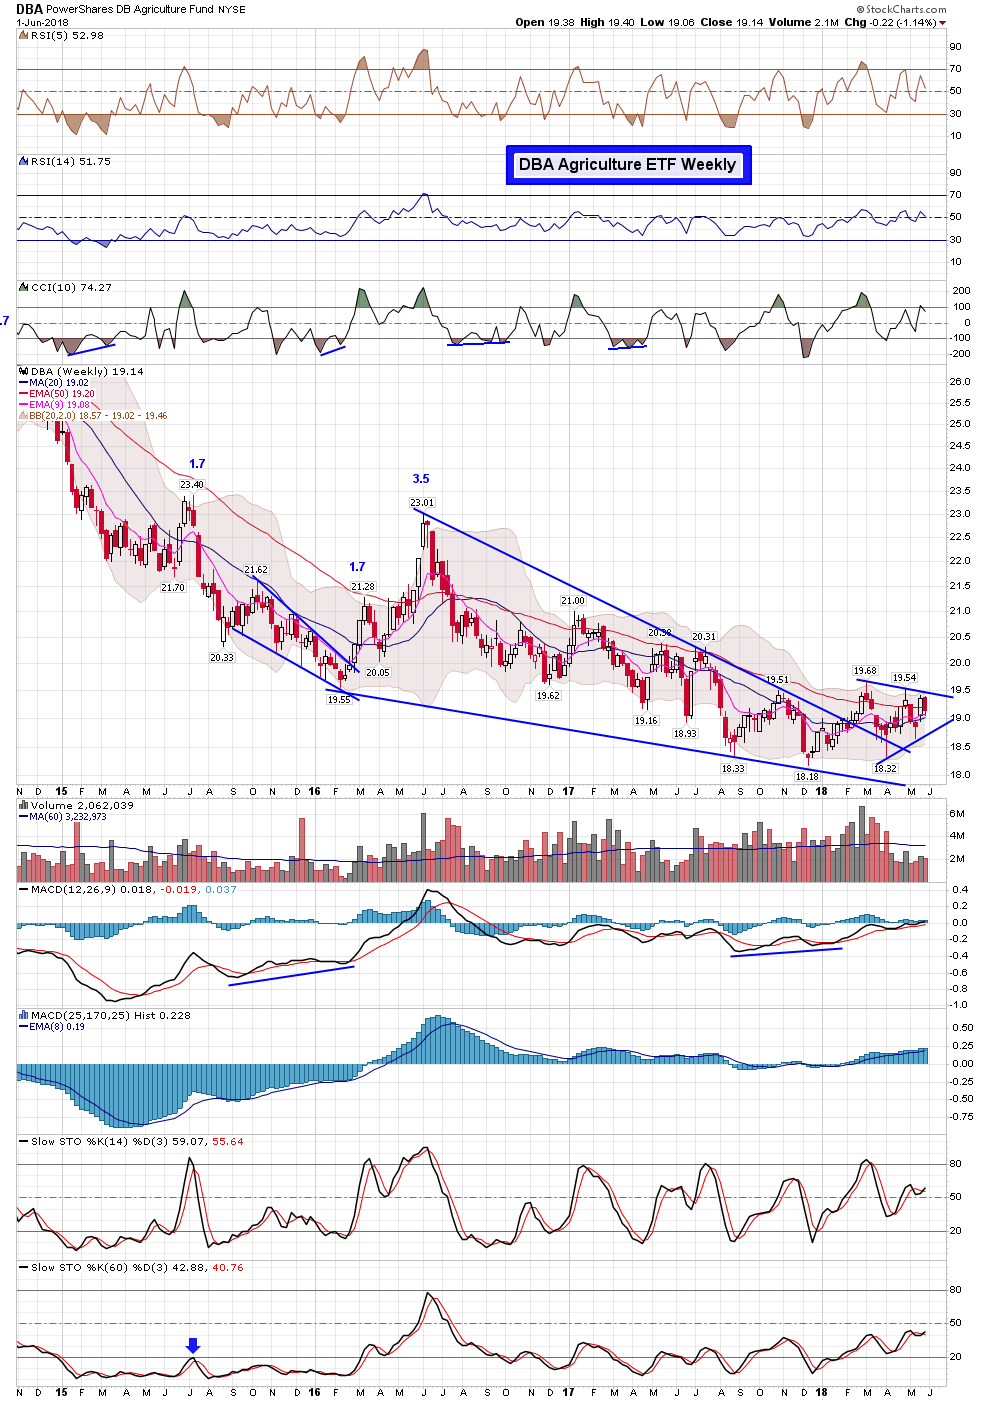
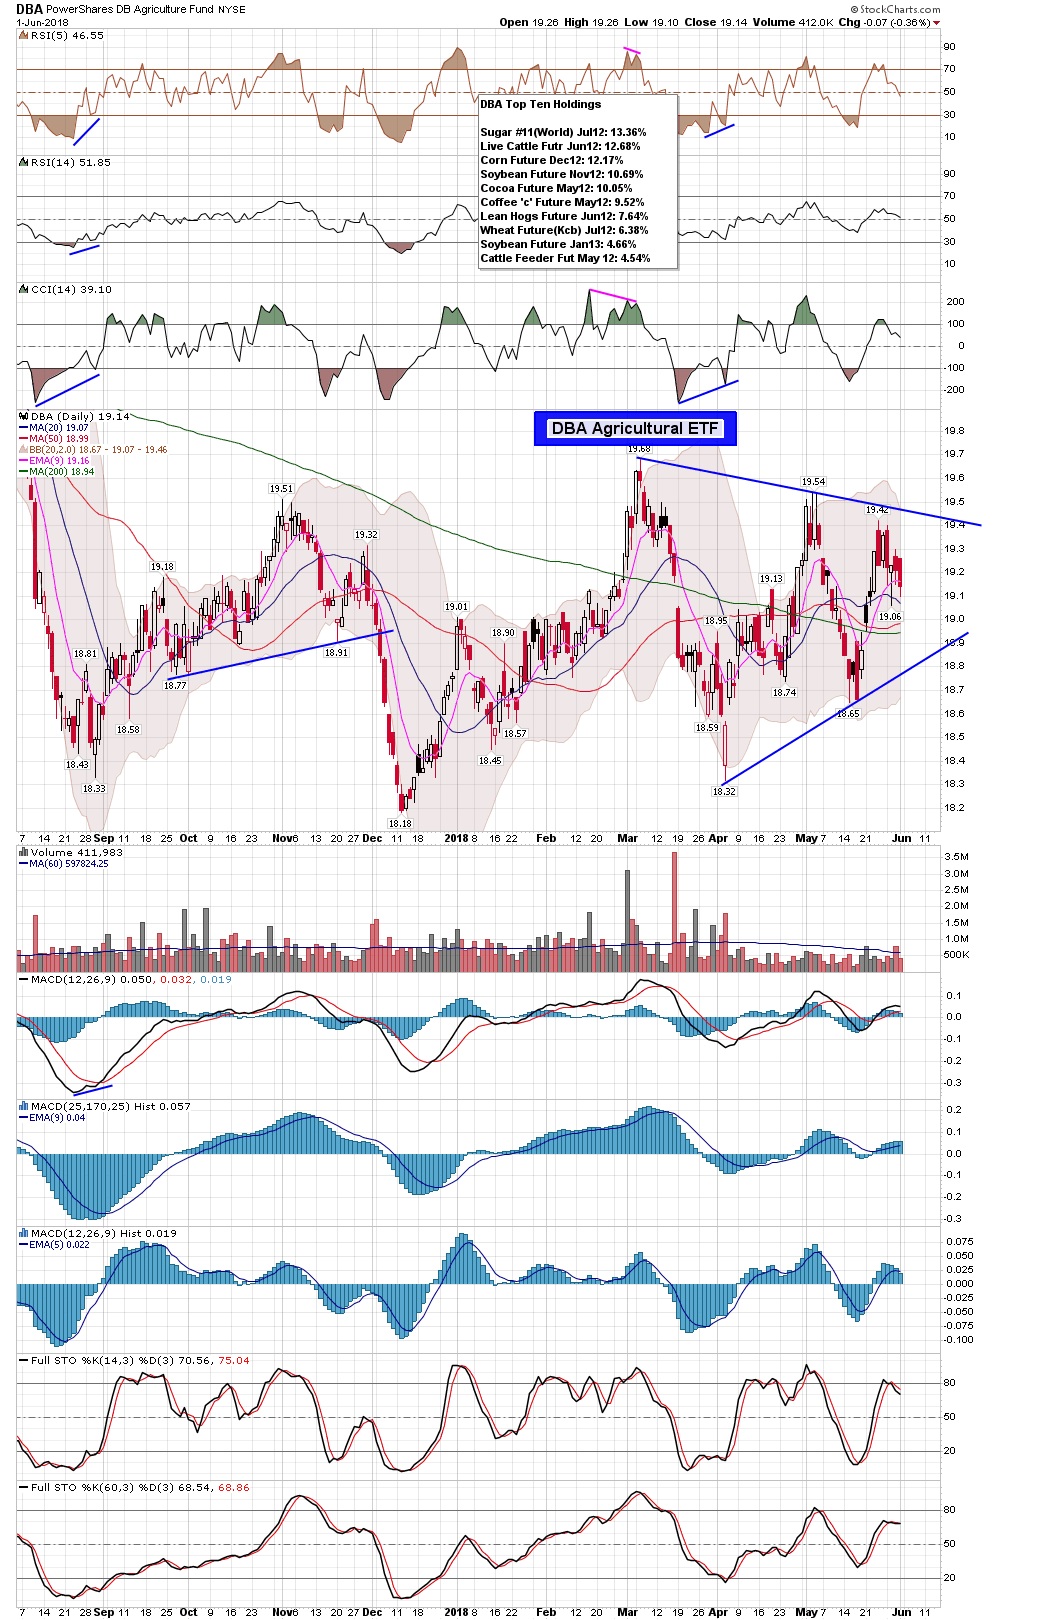
| Agriculture | DBA - W | -0.36% | -1.14% | 19.14 | |
| Corn | CORN - W | CORN - W | -0.63% | -3.57% | 391.50 |
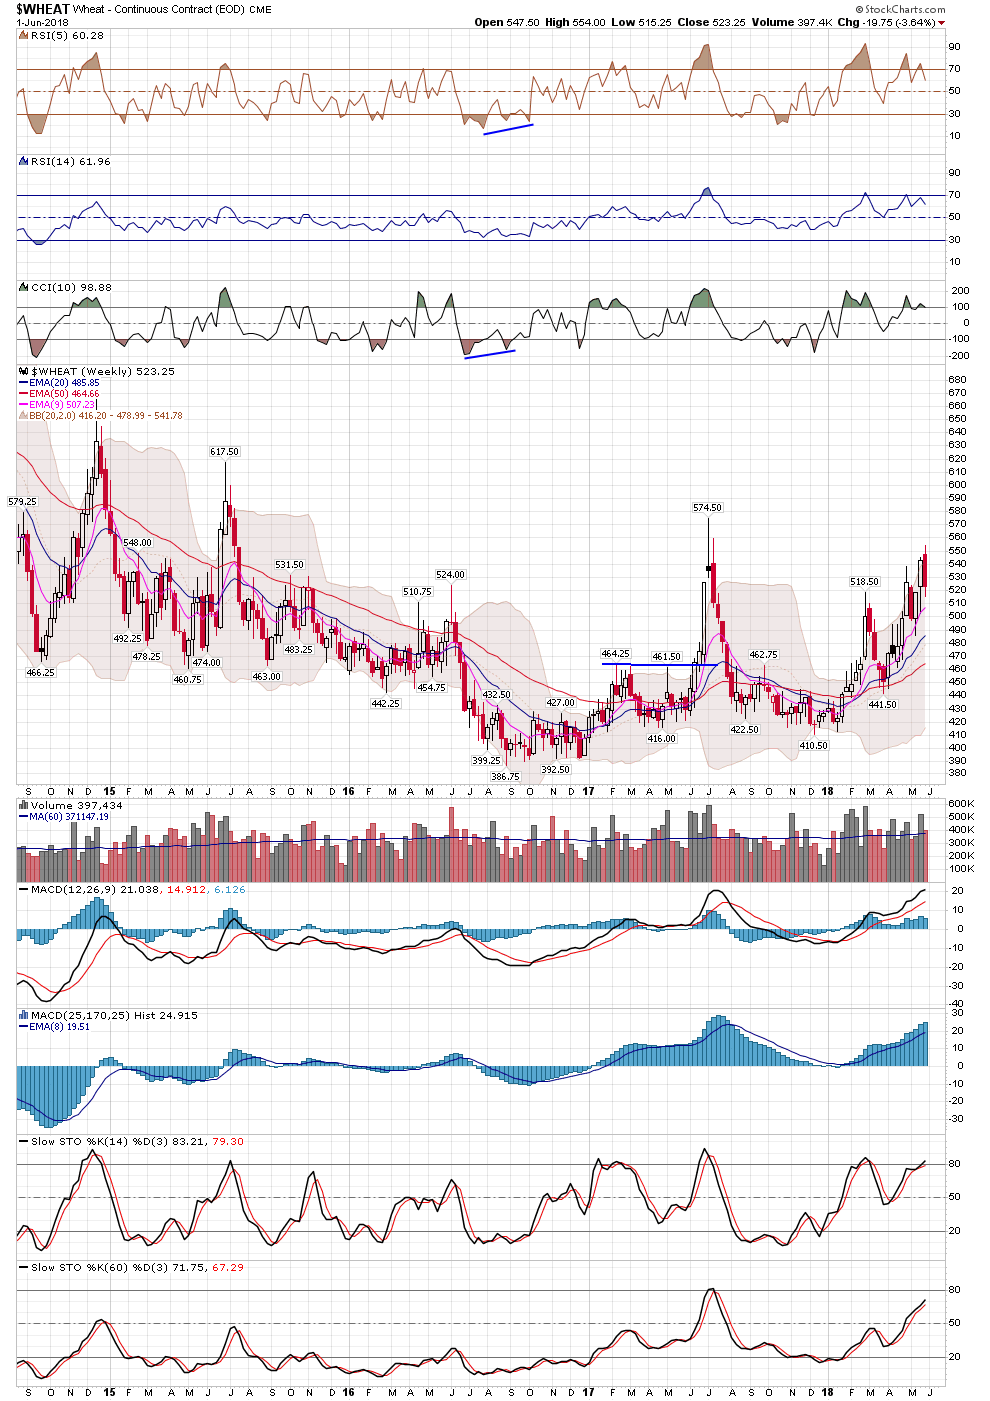
| Wheat | WHEAT - W | WEAT - W | -0.57% | -3.64% | 523.25 |
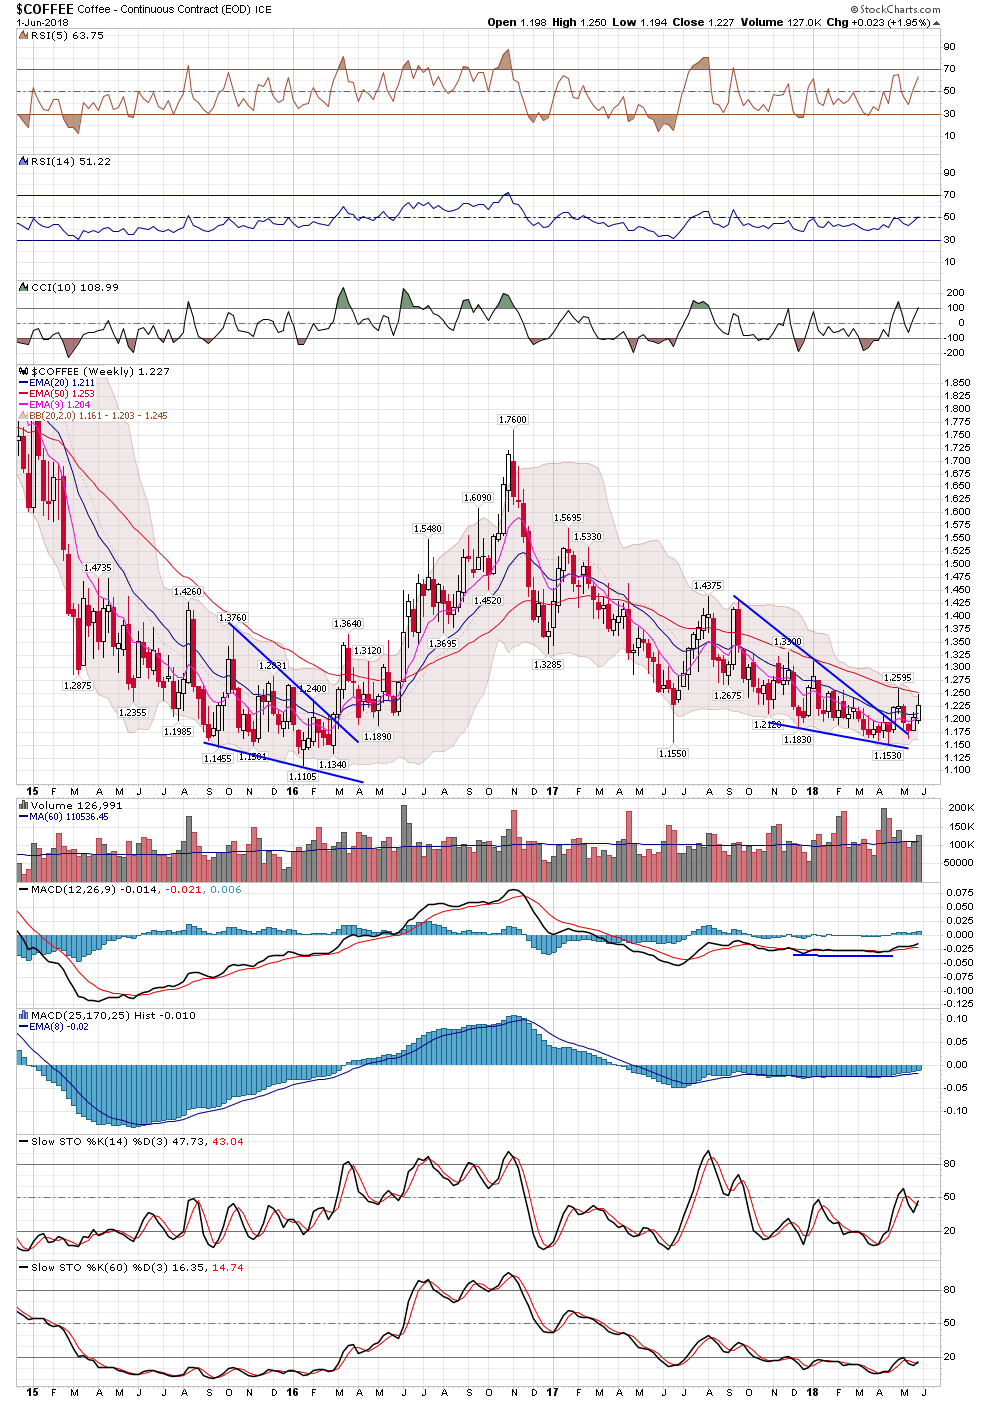
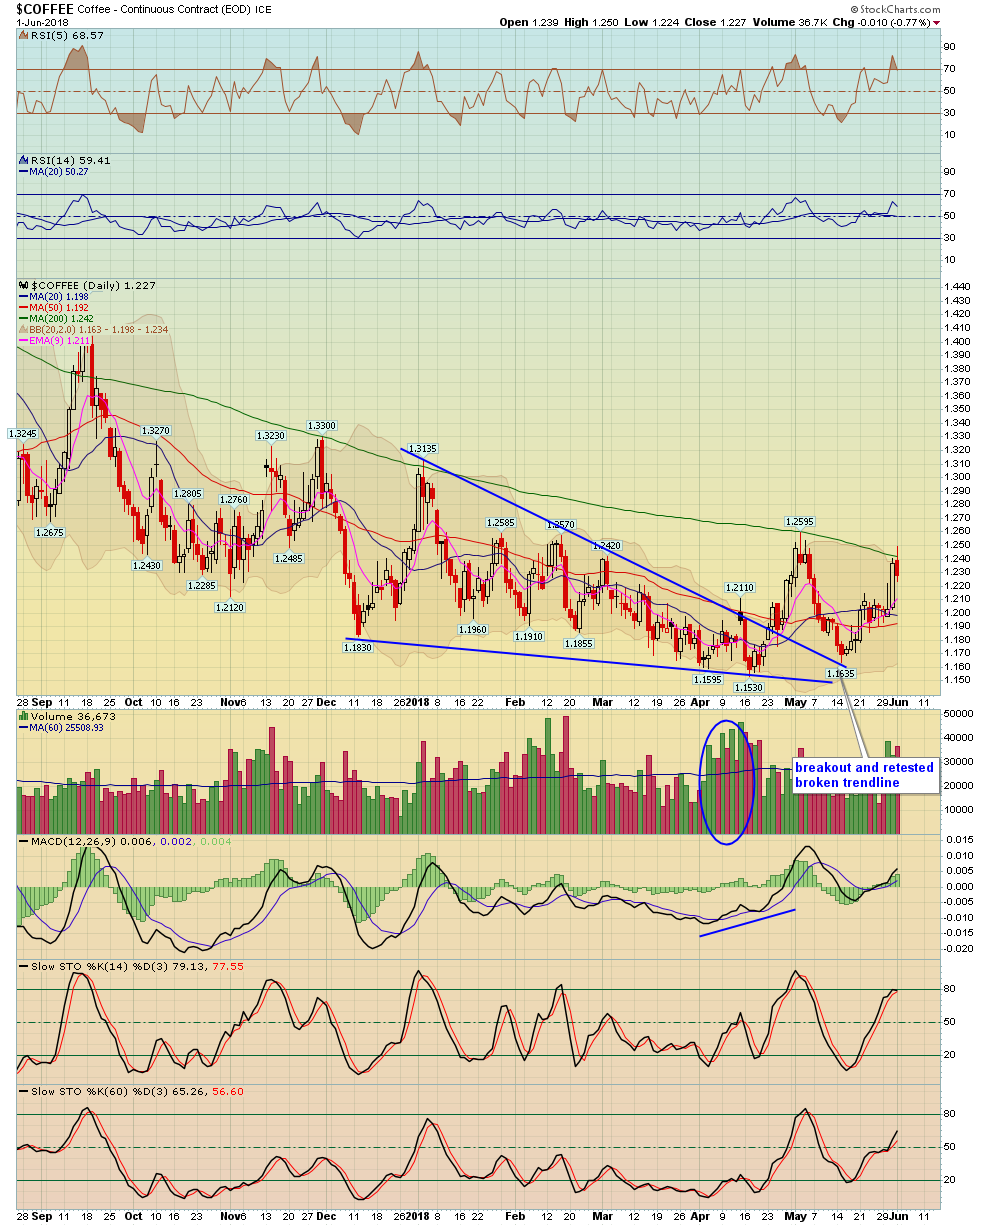
| Coffee | COFFEE - W | BJO - W | -0.77% | 1.95% | 1.23 |
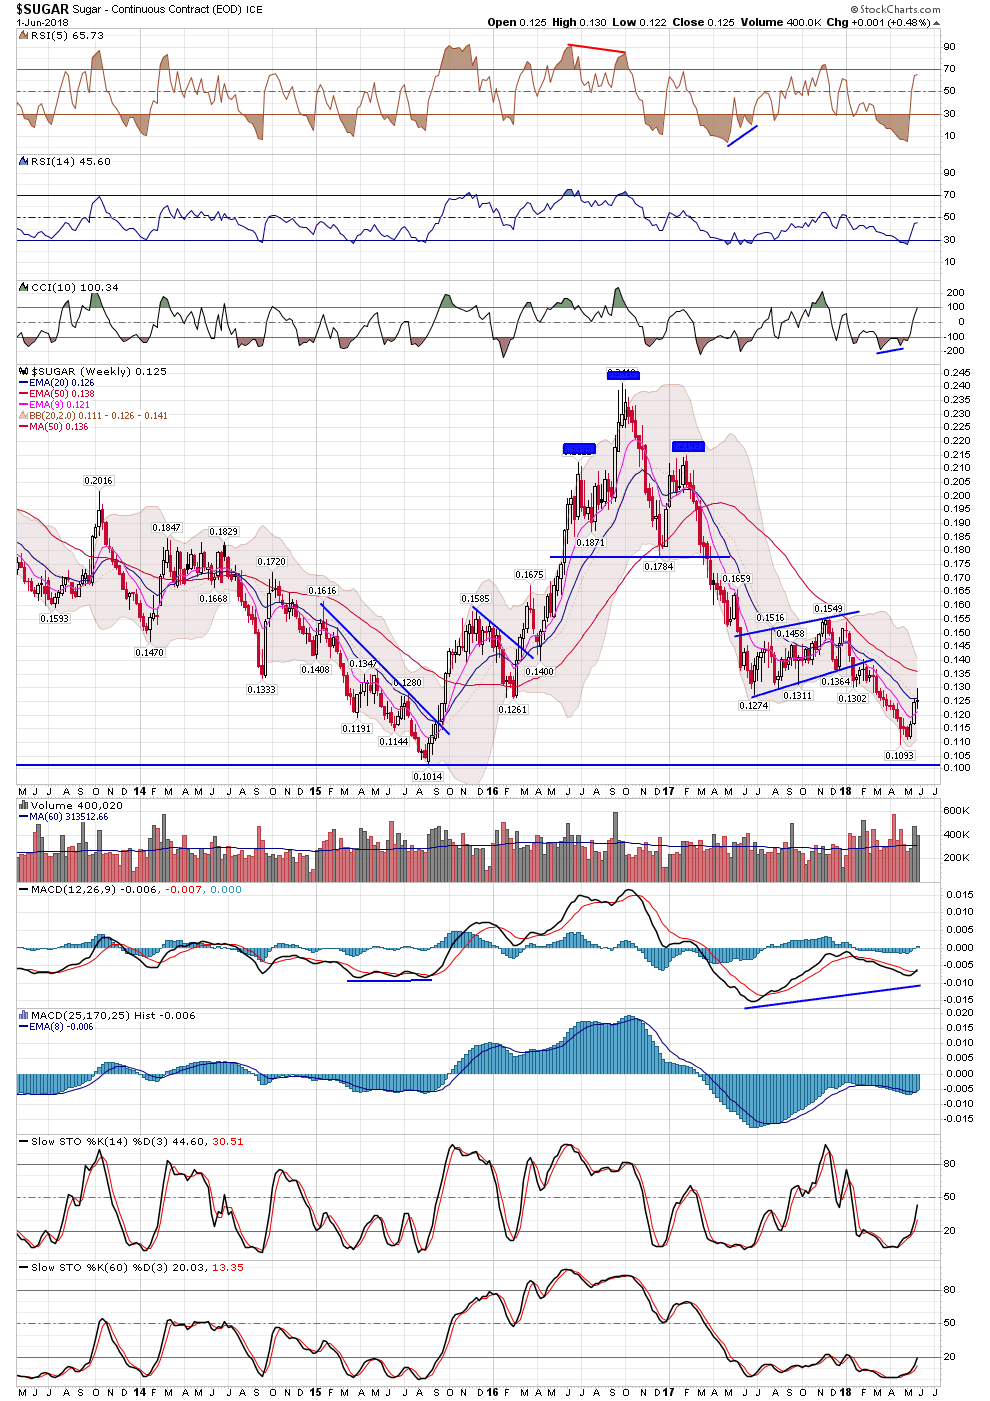
| Sugar | SUGAR - W | -2.11% | 0.48% | 0.13 |
| Precious Metals | Index Symbol | ETF Symbol | % G / L Day | % G / L Week | Close |
|---|---|---|---|---|---|
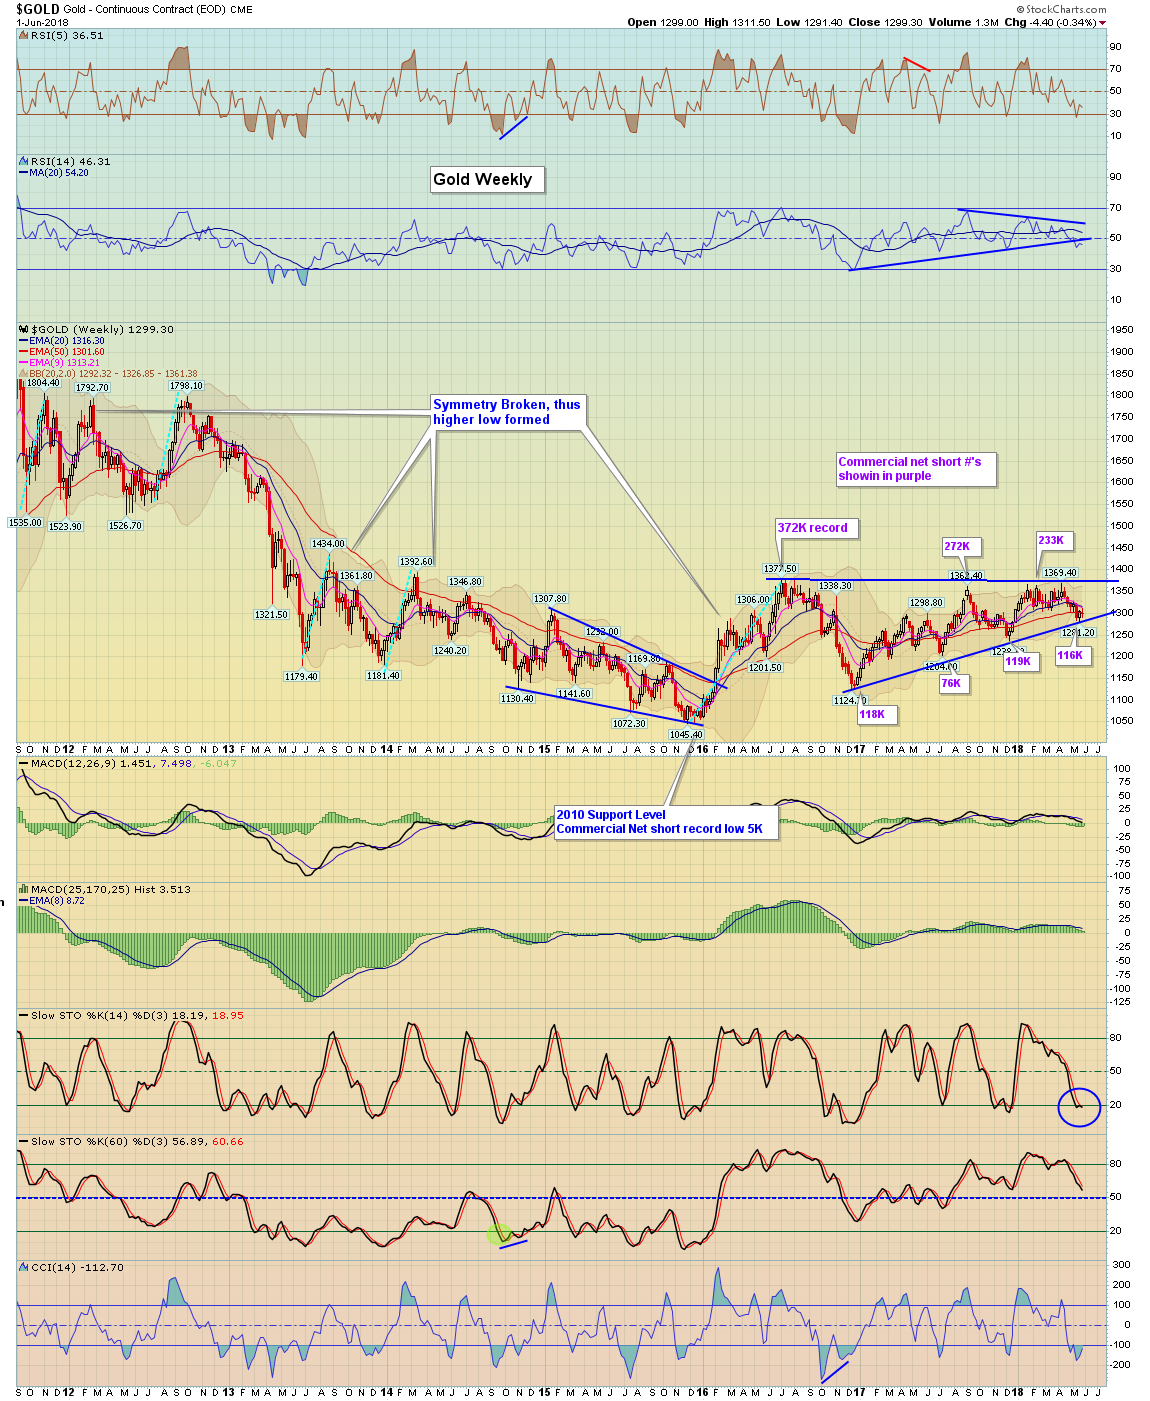
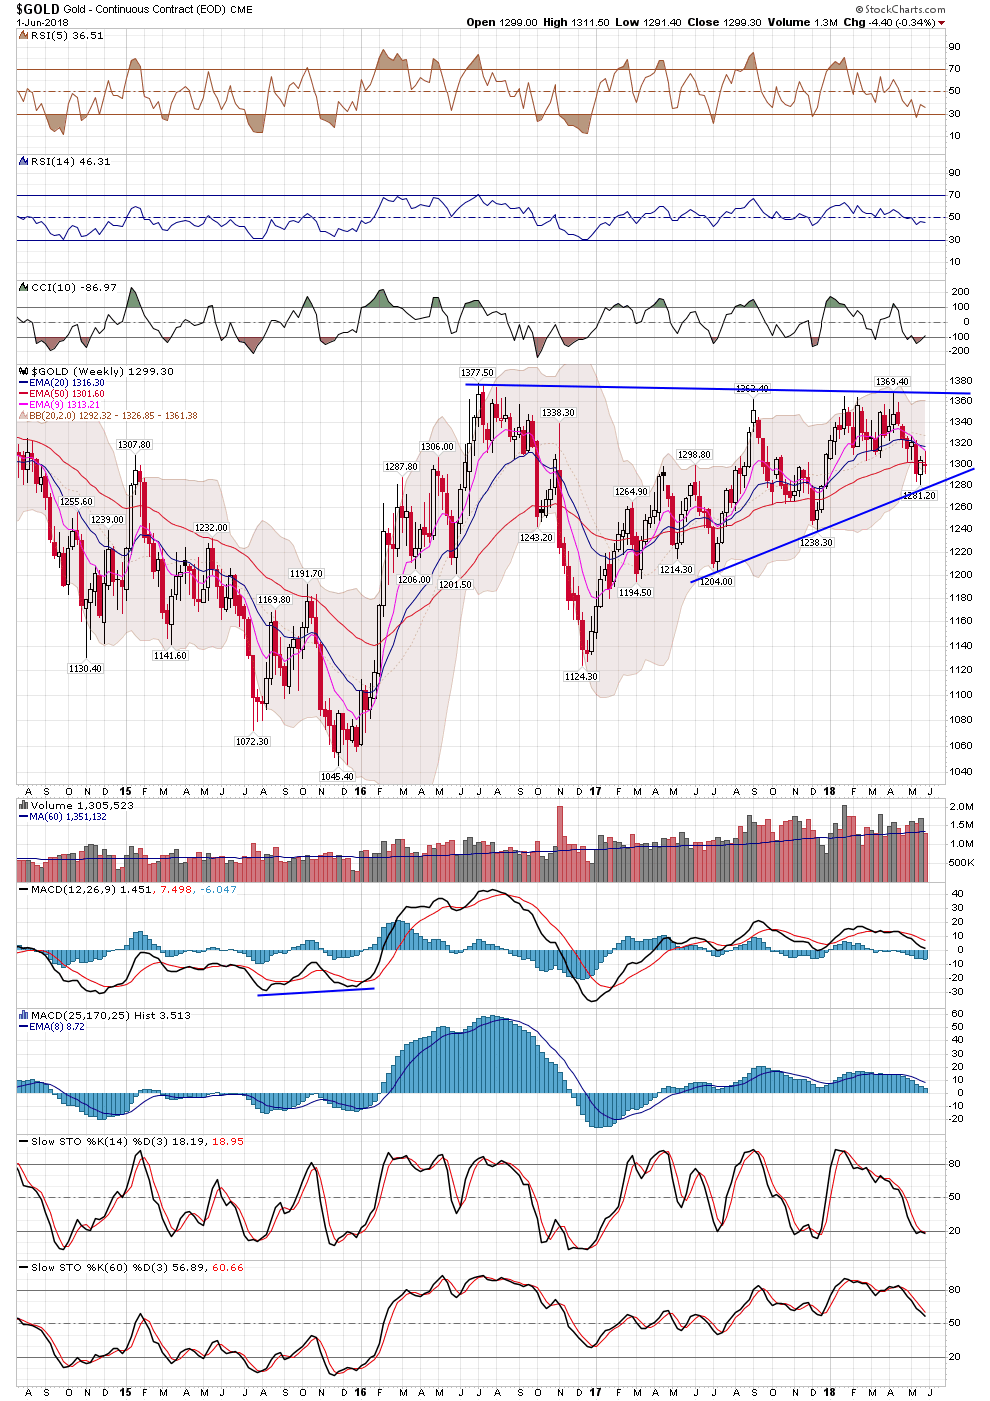
| Gold Metal | GLD - W | -0.50% | -0.58% | 122.49 | |
| Silver | SLV - W | -0.13% | -0.58% | 15.44 | |
| Platinum | PPLT - W | -0.44% | 0.32% | 85.89 | |
| Palladium | PALL - W | 1.44% | 2.39% | 95.38 | |
| GDX Gold Miners ETF | GDX - W | -0.13% | 0.00% | 22.31 |
| Bonds | Index Symbol | ETF Symbol | % G / L Day | % G / L Week | Close |
|---|---|---|---|---|---|
| TLT 20 Year Bond ETF | TLT - W | -0.53% | 0.80% | 120.30 | |
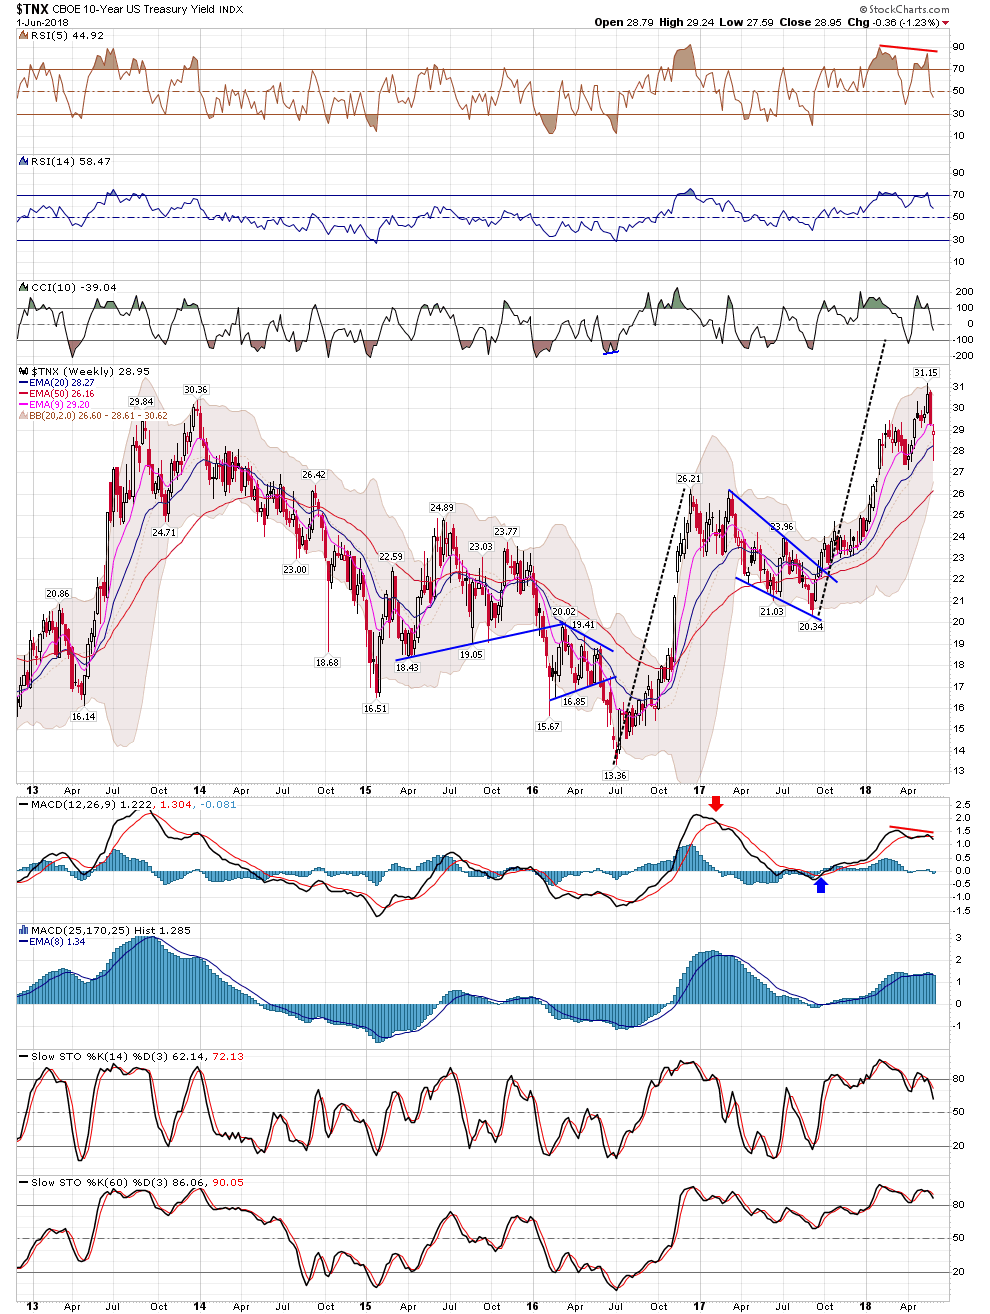
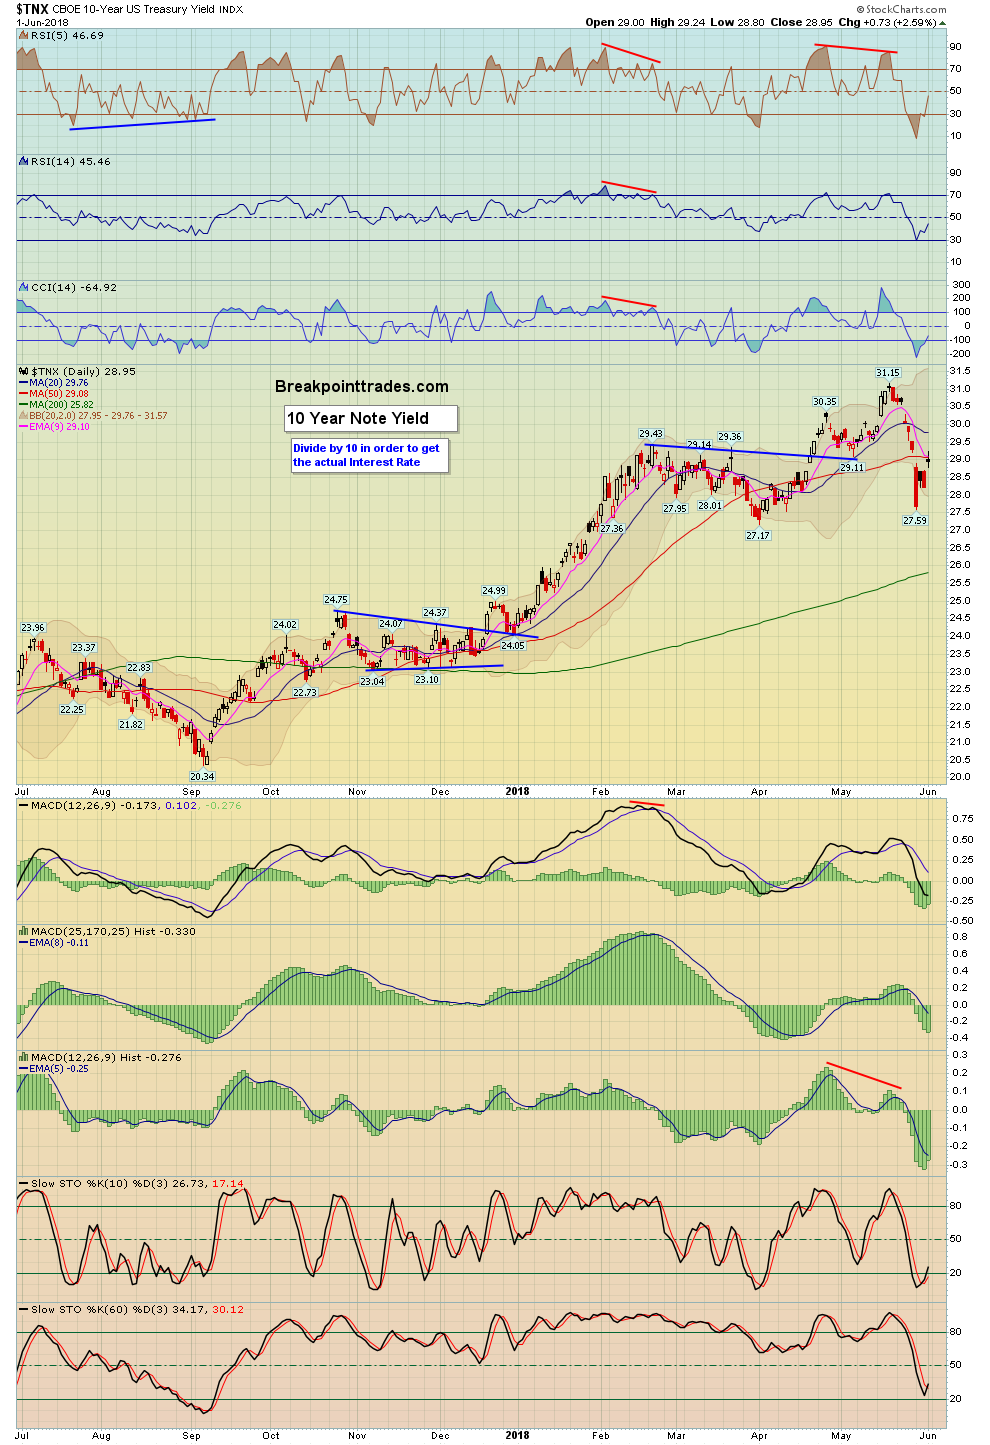
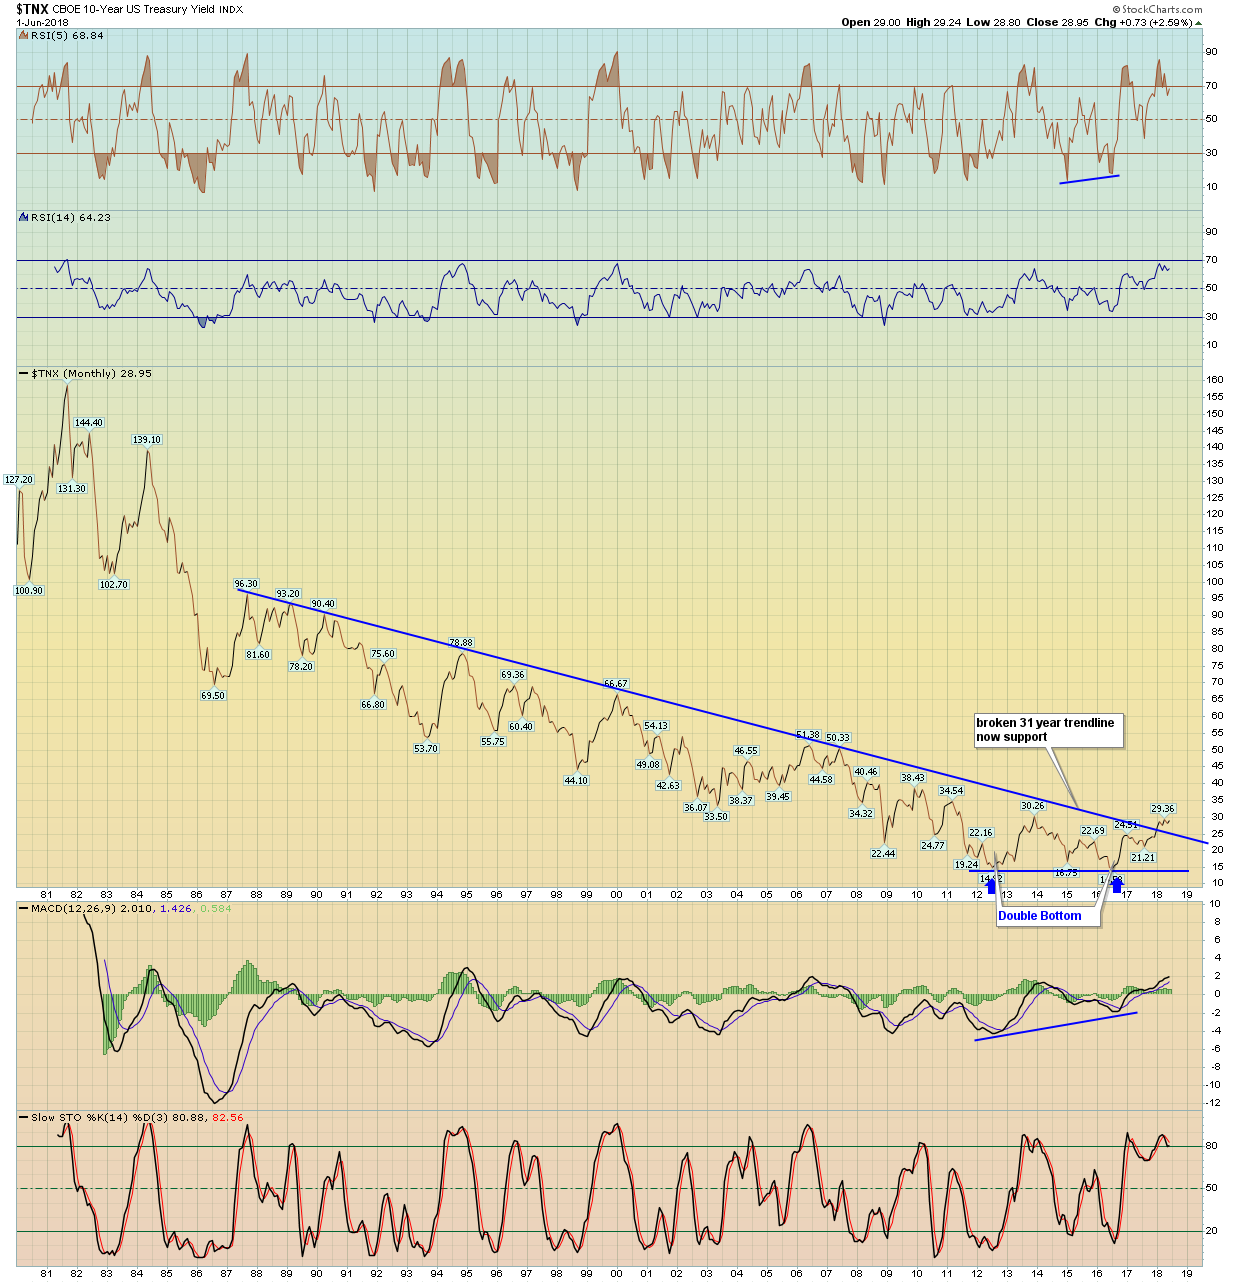
| 10 Year Treasury Yield | TNX - W | 2.59% | -1.23% | 28.95 | |
| 30 Year Treasury Yield | TYX - W | 2.01% | -1.42% | 30.46 |
3
Week of June 04 - June 08
| Date | ET | Release | For | Actual | Briefing.com Forecast | Briefing.com Consensus | Prior | Revised From |
|---|---|---|---|---|---|---|---|---|
| Jun 04 | 10:00 | Factory Orders | Apr | -0.4% | -0.5% | 1.6% | ||
| Jun 05 | 10:00 | ISM Services | May | 58.4 | 58.0 | 56.8 | ||
| Jun 05 | 10:00 | JOLTS - Job Openings | Apr | NA | NA | 6.550M | ||
| Jun 06 | 07:00 | MBA Mortgage Index | 06/02 | NA | NA | -2.9% | ||
| Jun 06 | 08:30 | Trade Balance | Apr | -$48.6B | -$48.8B | -$49.0B | ||
| Jun 06 | 08:30 | Productivity-Rev. | Q1 | 0.6% | 0.6% | 0.7% | ||
| Jun 06 | 08:30 | Unit Labor Costs - Rev. | Q1 | 2.7% | 2.8% | 2.7% | ||
| Jun 06 | 10:30 | Crude Inventories | 06/02 | NA | NA | -4.2M | ||
| Jun 07 | 08:30 | Initial Claims | 06/02 | 220K | 225 | 221K | ||
| Jun 07 | 08:30 | Continuing Claims | 05/26 | NA | NA | 1726K | ||
| Jun 07 | 10:30 | Natural Gas Inventories | 06/02 | NA | NA | +96 bcf | ||
| Jun 07 | 15:00 | Consumer Credit | Apr | $14.5B | $13.9B | $11.6B | ||
| Jun 08 | 10:00 | Wholesale Inventories | Apr | 0.3% | 0.2% | 0.3% |

Stock Earnings Calender:
Click here for a list of Stocks that are reporting Earnings
**Generally we never hold a position into earnings since the risk/reward is too great
4 - View Live Chart
5 - View Live Chart
6 - View Live Chart
7 - View Live Chart
8 - View Live Chart
9 - View Live Chart
10 - View Live Chart
11 - View Live Chart
12 - View Live Chart
13 - View Live Chart
14 - View Live Chart
15 - View Live Chart
16 - View Live Chart
17 - View Live Chart
18 - View Live Chart
19 - View Live Chart
20 - View Live Chart
21 - View Live Chart
22 - View Live Chart
23 - View Live Chart
24 - View Live Chart
25 - View Live Chart
26 - View Live Chart
27 - View Live Chart
28 - View Live Chart
29 - View Live Chart
30 - View Live Chart
31 - View Live Chart
32 - View Live Chart
33 - View Live Chart
34 - View Live Chart
35 - View Live Chart
36 - View Live Chart
37 - View Live Chart
38 - View Live Chart
39 - View Live Chart
40 - View Live Chart
41 - View Live Chart
42 - View Live Chart
43 - View Live Chart
44 - View Live Chart
45 - View Live Chart
46 - View Live Chart
47 - View Live Chart
48 - View Live Chart
49 - View Live Chart
50 - View Live Chart
51 - View Live Chart
52 - View Live Chart
- Hide Player Link to Newsletter Audio
Update Required
To play the media you will need to either update your browser to a recent version or update your Flash plugin.
- Hide Player Link to Newsletter Audio
Update Required
To play the media you will need to either update your browser to a recent version or update your Flash plugin.